Belizean vs Immigrants from Belgium Wage/Income Gap
COMPARE
Belizean
Immigrants from Belgium
Wage/Income Gap
Wage/Income Gap Comparison
Belizeans
Immigrants from Belgium
21.2%
WAGE/INCOME GAP
100.0/ 100
METRIC RATING
36th/ 347
METRIC RANK
29.0%
WAGE/INCOME GAP
0.0/ 100
METRIC RATING
326th/ 347
METRIC RANK
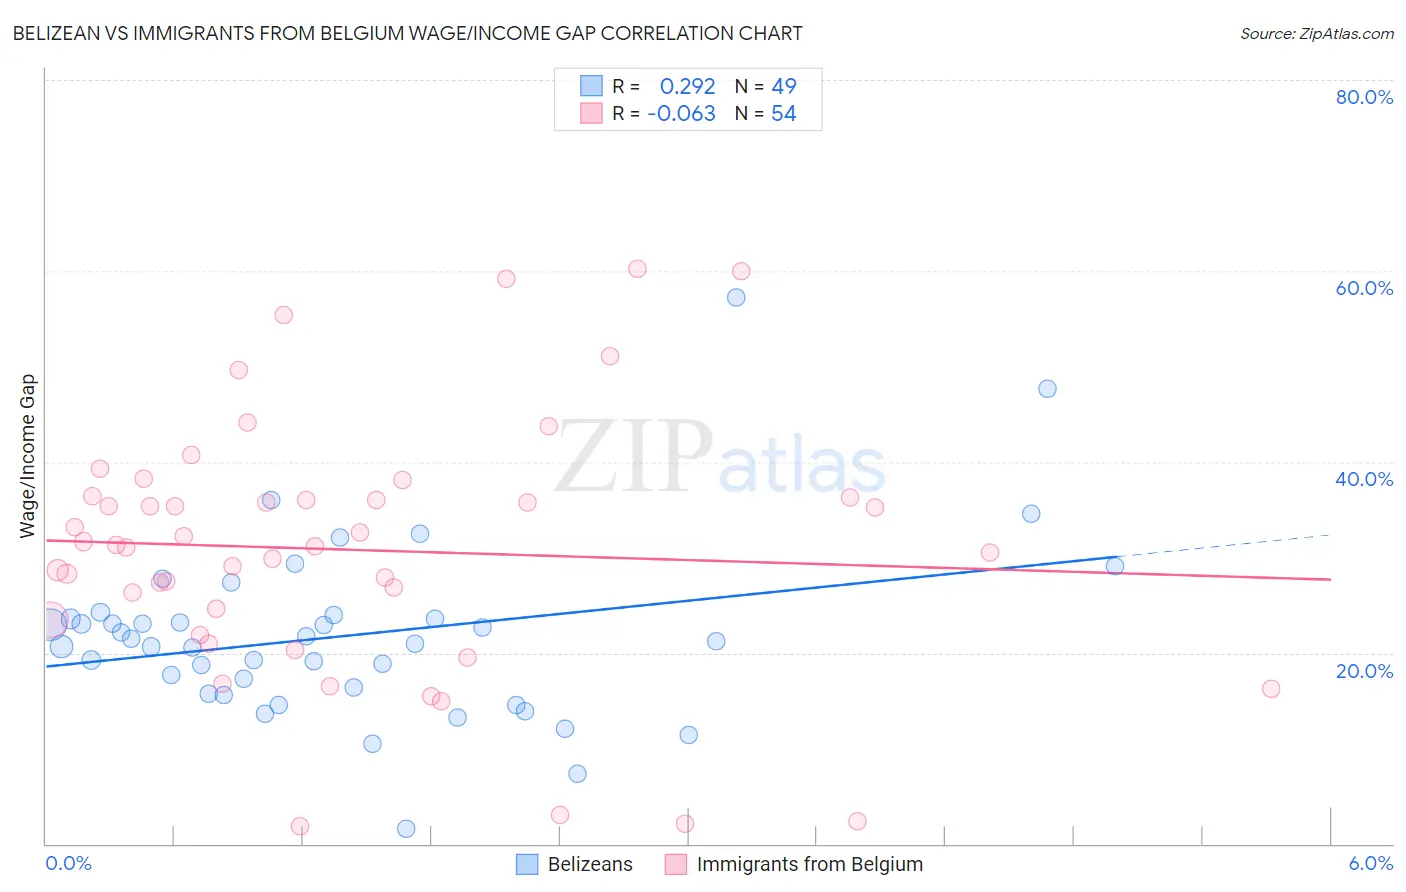
Belizean vs Immigrants from Belgium Wage/Income Gap Correlation Chart
The statistical analysis conducted on geographies consisting of 144,188,181 people shows a weak positive correlation between the proportion of Belizeans and wage/income gap percentage in the United States with a correlation coefficient (R) of 0.292 and weighted average of 21.2%. Similarly, the statistical analysis conducted on geographies consisting of 146,675,881 people shows a slight negative correlation between the proportion of Immigrants from Belgium and wage/income gap percentage in the United States with a correlation coefficient (R) of -0.063 and weighted average of 29.0%, a difference of 36.8%.
Wage/Income Gap Correlation Summary
| Measurement | Belizean | Immigrants from Belgium |
| Minimum | 1.6% | 1.8% |
| Maximum | 57.2% | 60.2% |
| Range | 55.6% | 58.4% |
| Mean | 21.8% | 30.8% |
| Median | 21.3% | 31.2% |
| Interquartile 25% (IQ1) | 16.1% | 23.4% |
| Interquartile 75% (IQ3) | 23.8% | 36.3% |
| Interquartile Range (IQR) | 7.7% | 12.9% |
| Standard Deviation (Sample) | 9.3% | 13.5% |
| Standard Deviation (Population) | 9.2% | 13.4% |
Similar Demographics by Wage/Income Gap
Demographics Similar to Belizeans by Wage/Income Gap
In terms of wage/income gap, the demographic groups most similar to Belizeans are Somali (21.2%, a difference of 0.020%), Immigrants from Somalia (21.2%, a difference of 0.070%), Immigrants from Belize (21.3%, a difference of 0.12%), Colville (21.3%, a difference of 0.23%), and Lumbee (21.3%, a difference of 0.43%).
| Demographics | Rating | Rank | Wage/Income Gap |
| Immigrants | Senegal | 100.0 /100 | #29 | Exceptional 20.9% |
| Immigrants | Bangladesh | 100.0 /100 | #30 | Exceptional 20.9% |
| Vietnamese | 100.0 /100 | #31 | Exceptional 21.0% |
| Immigrants | Yemen | 100.0 /100 | #32 | Exceptional 21.1% |
| Immigrants | Bahamas | 100.0 /100 | #33 | Exceptional 21.1% |
| Pima | 100.0 /100 | #34 | Exceptional 21.1% |
| Somalis | 100.0 /100 | #35 | Exceptional 21.2% |
| Belizeans | 100.0 /100 | #36 | Exceptional 21.2% |
| Immigrants | Somalia | 100.0 /100 | #37 | Exceptional 21.2% |
| Immigrants | Belize | 100.0 /100 | #38 | Exceptional 21.3% |
| Colville | 100.0 /100 | #39 | Exceptional 21.3% |
| Lumbee | 100.0 /100 | #40 | Exceptional 21.3% |
| Liberians | 100.0 /100 | #41 | Exceptional 21.4% |
| Immigrants | Sierra Leone | 100.0 /100 | #42 | Exceptional 21.4% |
| Sierra Leoneans | 100.0 /100 | #43 | Exceptional 21.4% |
Demographics Similar to Immigrants from Belgium by Wage/Income Gap
In terms of wage/income gap, the demographic groups most similar to Immigrants from Belgium are Hungarian (29.0%, a difference of 0.070%), Immigrants from Iran (29.1%, a difference of 0.11%), Scandinavian (29.1%, a difference of 0.17%), Croatian (29.0%, a difference of 0.20%), and Scottish (29.1%, a difference of 0.31%).
| Demographics | Rating | Rank | Wage/Income Gap |
| Slovaks | 0.1 /100 | #319 | Tragic 28.9% |
| British | 0.1 /100 | #320 | Tragic 28.9% |
| Welsh | 0.1 /100 | #321 | Tragic 28.9% |
| Immigrants | Singapore | 0.1 /100 | #322 | Tragic 28.9% |
| Norwegians | 0.1 /100 | #323 | Tragic 29.0% |
| Croatians | 0.0 /100 | #324 | Tragic 29.0% |
| Hungarians | 0.0 /100 | #325 | Tragic 29.0% |
| Immigrants | Belgium | 0.0 /100 | #326 | Tragic 29.0% |
| Immigrants | Iran | 0.0 /100 | #327 | Tragic 29.1% |
| Scandinavians | 0.0 /100 | #328 | Tragic 29.1% |
| Scottish | 0.0 /100 | #329 | Tragic 29.1% |
| Germans | 0.0 /100 | #330 | Tragic 29.2% |
| Czechs | 0.0 /100 | #331 | Tragic 29.2% |
| Immigrants | South Central Asia | 0.0 /100 | #332 | Tragic 29.3% |
| Europeans | 0.0 /100 | #333 | Tragic 29.4% |