Steuben County, IN Map & Demographics
Steuben County Map
Steuben County Overview
$36,648
PER CAPITA INCOME
$88,227
AVG FAMILY INCOME
$68,837
AVG HOUSEHOLD INCOME
37.9%
WAGE / INCOME GAP [ % ]
62.1¢/ $1
WAGE / INCOME GAP [ $ ]
$10,344
FAMILY INCOME DEFICIT
0.43
INEQUALITY / GINI INDEX
34,507
TOTAL POPULATION
17,722
MALE POPULATION
16,785
FEMALE POPULATION
105.58
MALES / 100 FEMALES
94.71
FEMALES / 100 MALES
43.5
MEDIAN AGE
2.9
AVG FAMILY SIZE
2.4
AVG HOUSEHOLD SIZE
17,828
LABOR FORCE [ PEOPLE ]
63.0%
PERCENT IN LABOR FORCE
7.1%
UNEMPLOYMENT RATE
Steuben County Area Codes
Income in Steuben County
Income Overview in Steuben County
Per Capita Income in Steuben County is $36,648, while median incomes of families and households are $88,227 and $68,837 respectively.
| Characteristic | Number | Measure |
| Per Capita Income | 34,507 | $36,648 |
| Median Family Income | 8,906 | $88,227 |
| Mean Family Income | 8,906 | $108,583 |
| Median Household Income | 13,794 | $68,837 |
| Mean Household Income | 13,794 | $90,100 |
| Income Deficit | 8,906 | $10,344 |
| Wage / Income Gap (%) | 34,507 | 37.95% |
| Wage / Income Gap ($) | 34,507 | 62.05¢ per $1 |
| Gini / Inequality Index | 34,507 | 0.43 |
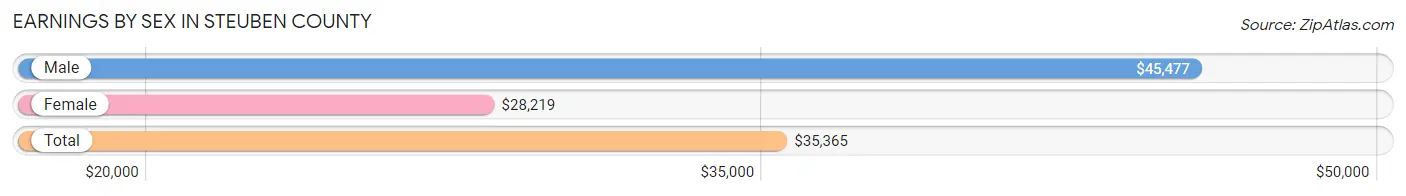
Earnings by Sex in Steuben County
Average Earnings in Steuben County are $35,365, $45,477 for men and $28,219 for women, a difference of 38.0%.
| Sex | Number | Average Earnings |
| Male | 10,664 (53.7%) | $45,477 |
| Female | 9,196 (46.3%) | $28,219 |
| Total | 19,860 (100.0%) | $35,365 |
Earnings by Sex by Income Bracket in Steuben County
The most common earnings brackets in Steuben County are $100,000+ for men (1,286 | 12.1%) and $2,499 or less for women (850 | 9.2%).
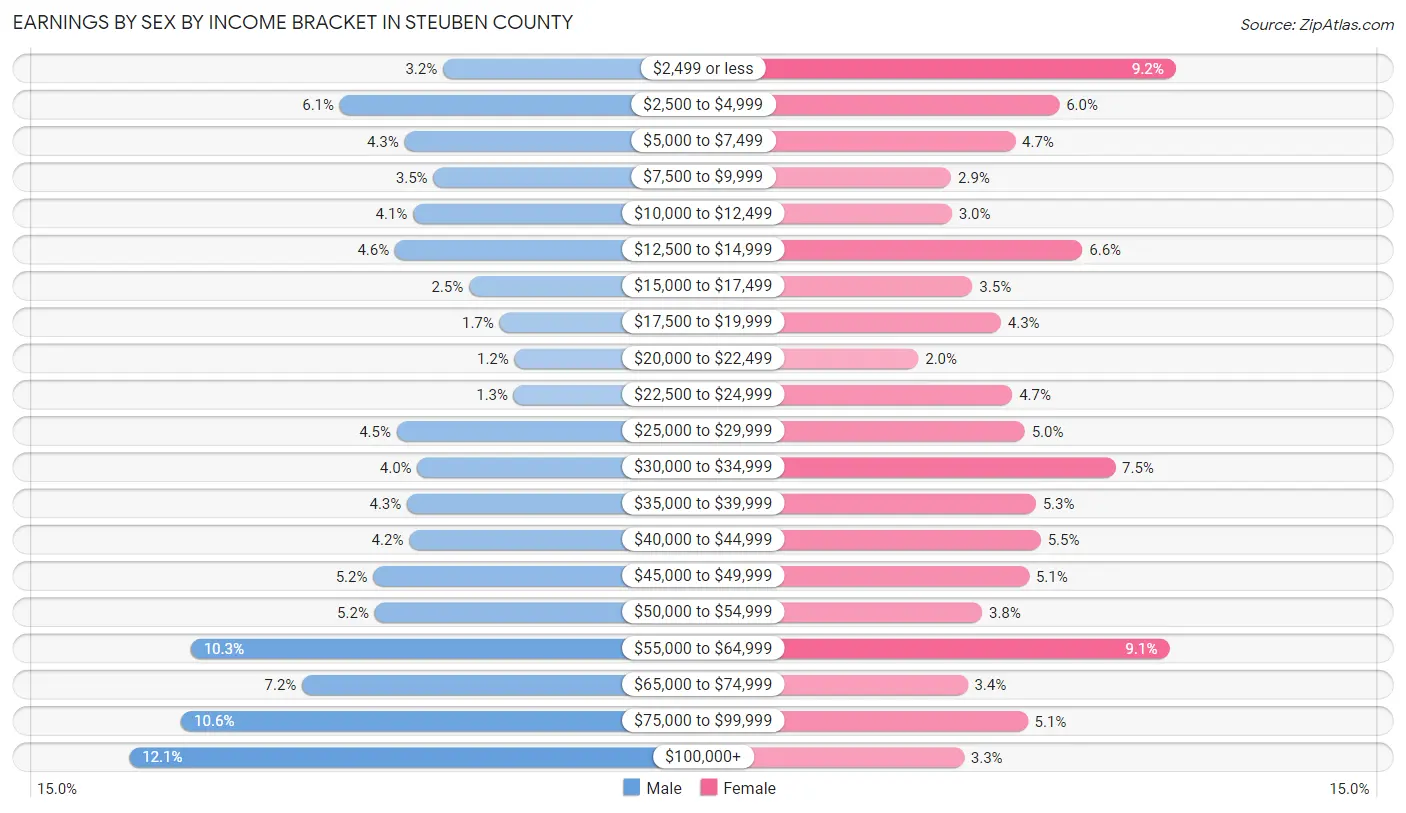
| Income | Male | Female |
| $2,499 or less | 346 (3.2%) | 850 (9.2%) |
| $2,500 to $4,999 | 655 (6.1%) | 549 (6.0%) |
| $5,000 to $7,499 | 461 (4.3%) | 435 (4.7%) |
| $7,500 to $9,999 | 374 (3.5%) | 269 (2.9%) |
| $10,000 to $12,499 | 435 (4.1%) | 271 (2.9%) |
| $12,500 to $14,999 | 489 (4.6%) | 609 (6.6%) |
| $15,000 to $17,499 | 268 (2.5%) | 325 (3.5%) |
| $17,500 to $19,999 | 176 (1.7%) | 398 (4.3%) |
| $20,000 to $22,499 | 131 (1.2%) | 185 (2.0%) |
| $22,500 to $24,999 | 133 (1.3%) | 428 (4.6%) |
| $25,000 to $29,999 | 484 (4.5%) | 460 (5.0%) |
| $30,000 to $34,999 | 422 (4.0%) | 693 (7.5%) |
| $35,000 to $39,999 | 453 (4.3%) | 488 (5.3%) |
| $40,000 to $44,999 | 447 (4.2%) | 501 (5.4%) |
| $45,000 to $49,999 | 554 (5.2%) | 471 (5.1%) |
| $50,000 to $54,999 | 550 (5.2%) | 349 (3.8%) |
| $55,000 to $64,999 | 1,102 (10.3%) | 833 (9.1%) |
| $65,000 to $74,999 | 768 (7.2%) | 312 (3.4%) |
| $75,000 to $99,999 | 1,130 (10.6%) | 467 (5.1%) |
| $100,000+ | 1,286 (12.1%) | 303 (3.3%) |
| Total | 10,664 (100.0%) | 9,196 (100.0%) |
Earnings by Sex by Educational Attainment in Steuben County
Average earnings in Steuben County are $54,826 for men and $33,149 for women, a difference of 39.5%. Men with an educational attainment of graduate degree enjoy the highest average annual earnings of $76,000, while those with less than high school education earn the least with $33,485. Women with an educational attainment of graduate degree earn the most with the average annual earnings of $70,982, while those with less than high school education have the smallest earnings of $19,286.

| Educational Attainment | Male Income | Female Income |
| Less than High School | $33,485 | $19,286 |
| High School Diploma | $50,045 | $20,986 |
| College or Associate's Degree | $59,256 | $34,164 |
| Bachelor's Degree | $71,107 | $49,672 |
| Graduate Degree | $76,000 | $70,982 |
| Total | $54,826 | $33,149 |
Family Income in Steuben County
Family Income Brackets in Steuben County
According to the Steuben County family income data, there are 2,244 families falling into the $100,000 to $149,999 income range, which is the most common income bracket and makes up 25.2% of all families. Conversely, the less than $10,000 income bracket is the least frequent group with only 160 families (1.8%) belonging to this category.
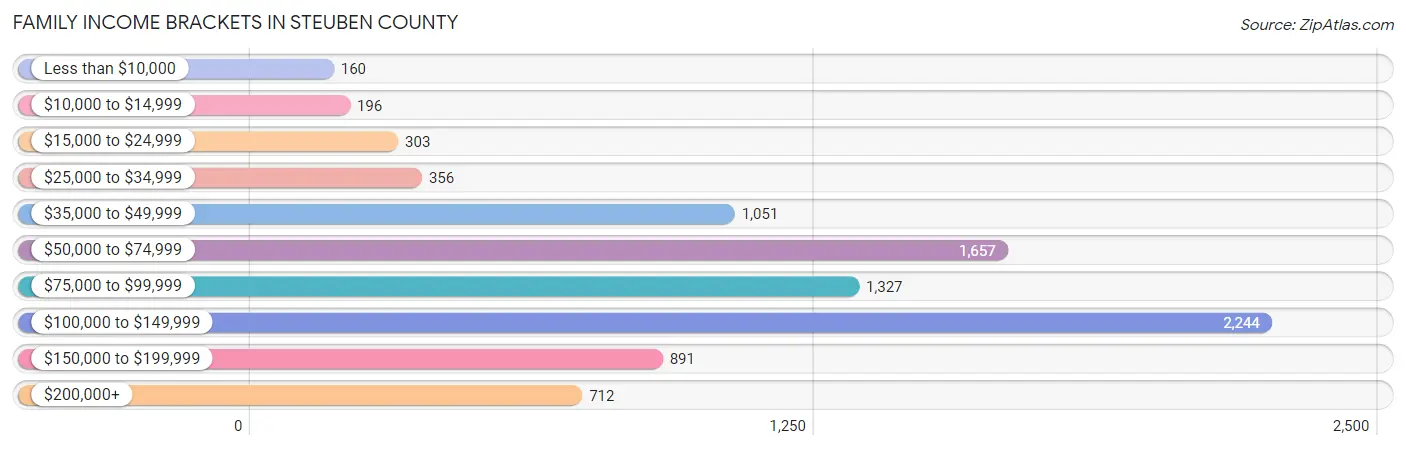
| Income Bracket | # Families | % Families |
| Less than $10,000 | 160 | 1.8% |
| $10,000 to $14,999 | 196 | 2.2% |
| $15,000 to $24,999 | 303 | 3.4% |
| $25,000 to $34,999 | 356 | 4.0% |
| $35,000 to $49,999 | 1,051 | 11.8% |
| $50,000 to $74,999 | 1,657 | 18.6% |
| $75,000 to $99,999 | 1,327 | 14.9% |
| $100,000 to $149,999 | 2,244 | 25.2% |
| $150,000 to $199,999 | 891 | 10.0% |
| $200,000+ | 712 | 8.0% |
Family Income by Famaliy Size in Steuben County
4-person families (1,143 | 12.8%) account for the highest median family income in Steuben County with $110,827 per family, while 2-person families (5,107 | 57.3%) have the highest median income of $38,236 per family member.
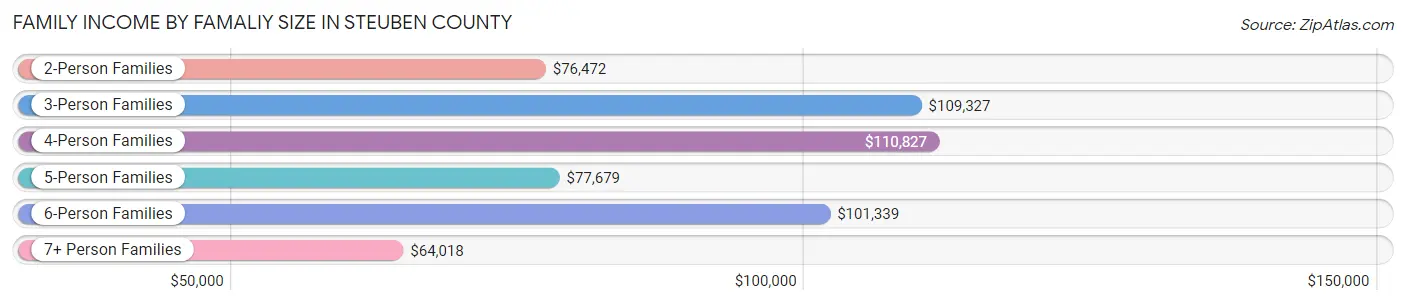
| Income Bracket | # Families | Median Income |
| 2-Person Families | 5,107 (57.3%) | $76,472 |
| 3-Person Families | 1,727 (19.4%) | $109,327 |
| 4-Person Families | 1,143 (12.8%) | $110,827 |
| 5-Person Families | 753 (8.5%) | $77,679 |
| 6-Person Families | 103 (1.2%) | $101,339 |
| 7+ Person Families | 73 (0.8%) | $64,018 |
| Total | 8,906 (100.0%) | $88,227 |
Family Income by Number of Earners in Steuben County
The median family income in Steuben County is $88,227, with families comprising 3+ earners (994) having the highest median family income of $133,707, while families with no earners (1,388) have the lowest median family income of $53,152, accounting for 11.2% and 15.6% of families, respectively.
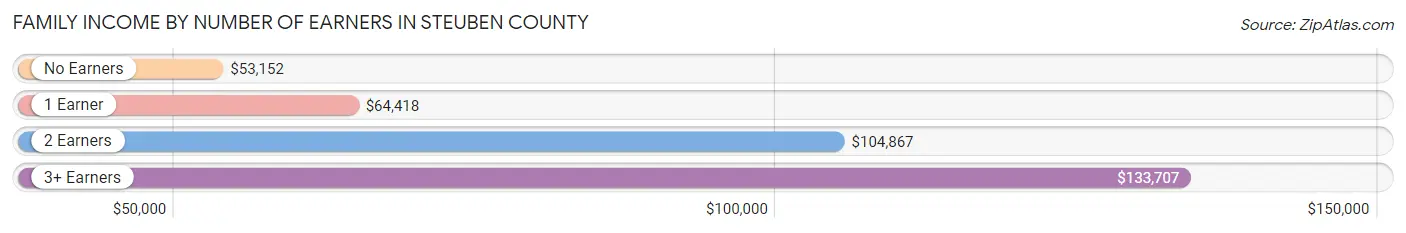
| Number of Earners | # Families | Median Income |
| No Earners | 1,388 (15.6%) | $53,152 |
| 1 Earner | 2,678 (30.1%) | $64,418 |
| 2 Earners | 3,846 (43.2%) | $104,867 |
| 3+ Earners | 994 (11.2%) | $133,707 |
| Total | 8,906 (100.0%) | $88,227 |
Household Income in Steuben County
Household Income Brackets in Steuben County
With 2,911 households falling in the category, the $50,000 to $74,999 income range is the most frequent in Steuben County, accounting for 21.1% of all households. In contrast, only 386 households (2.8%) fall into the less than $10,000 income bracket, making it the least populous group.
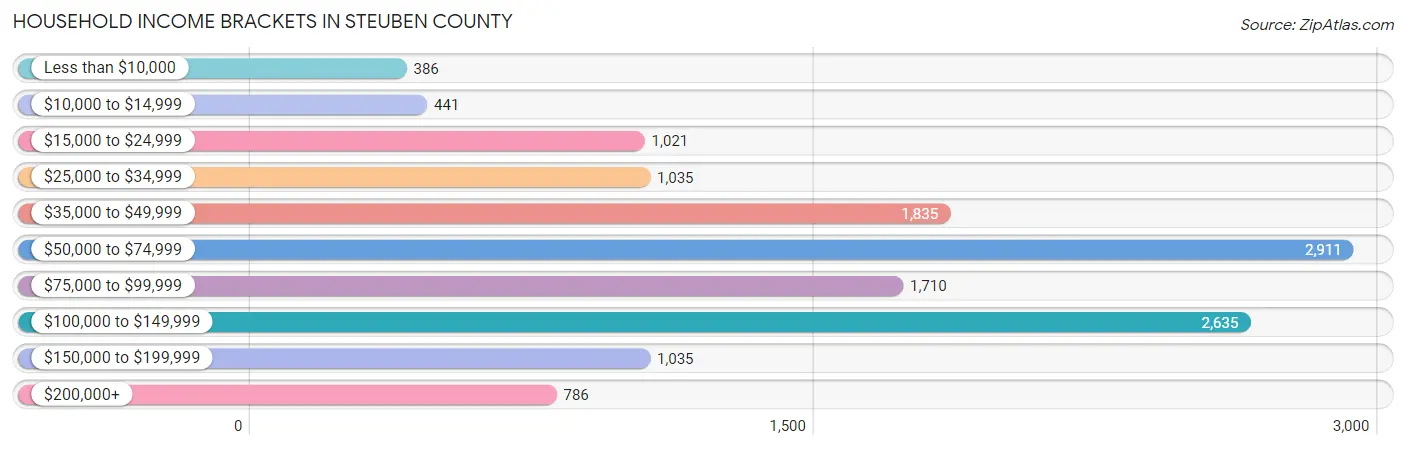
| Income Bracket | # Households | % Households |
| Less than $10,000 | 386 | 2.8% |
| $10,000 to $14,999 | 441 | 3.2% |
| $15,000 to $24,999 | 1,021 | 7.4% |
| $25,000 to $34,999 | 1,035 | 7.5% |
| $35,000 to $49,999 | 1,835 | 13.3% |
| $50,000 to $74,999 | 2,911 | 21.1% |
| $75,000 to $99,999 | 1,710 | 12.4% |
| $100,000 to $149,999 | 2,635 | 19.1% |
| $150,000 to $199,999 | 1,035 | 7.5% |
| $200,000+ | 786 | 5.7% |
Household Income by Householder Age in Steuben County
The median household income in Steuben County is $68,837, with the highest median household income of $87,317 found in the 45 to 64 years age bracket for the primary householder. A total of 5,312 households (38.5%) fall into this category. Meanwhile, the 65+ years age bracket for the primary householder has the lowest median household income of $51,264, with 4,495 households (32.6%) in this group.
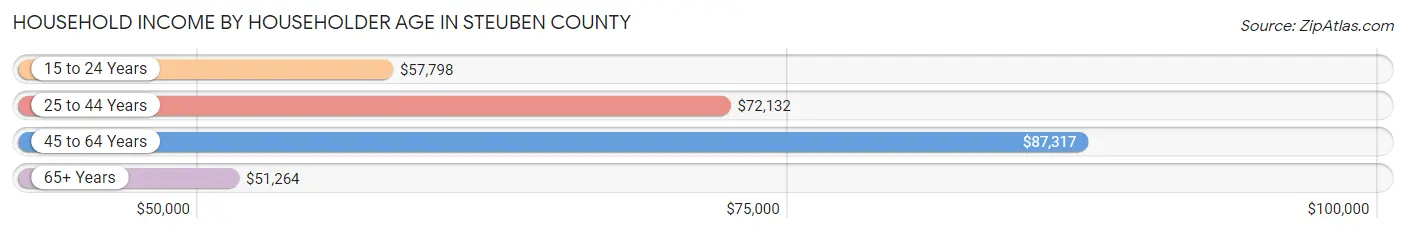
| Income Bracket | # Households | Median Income |
| 15 to 24 Years | 395 (2.9%) | $57,798 |
| 25 to 44 Years | 3,592 (26.0%) | $72,132 |
| 45 to 64 Years | 5,312 (38.5%) | $87,317 |
| 65+ Years | 4,495 (32.6%) | $51,264 |
| Total | 13,794 (100.0%) | $68,837 |
Poverty in Steuben County
Income Below Poverty by Sex and Age in Steuben County
With 8.9% poverty level for males and 9.7% for females among the residents of Steuben County, 15 year old males and under 5 year old females are the most vulnerable to poverty, with 86 males (25.4%) and 147 females (18.4%) in their respective age groups living below the poverty level.
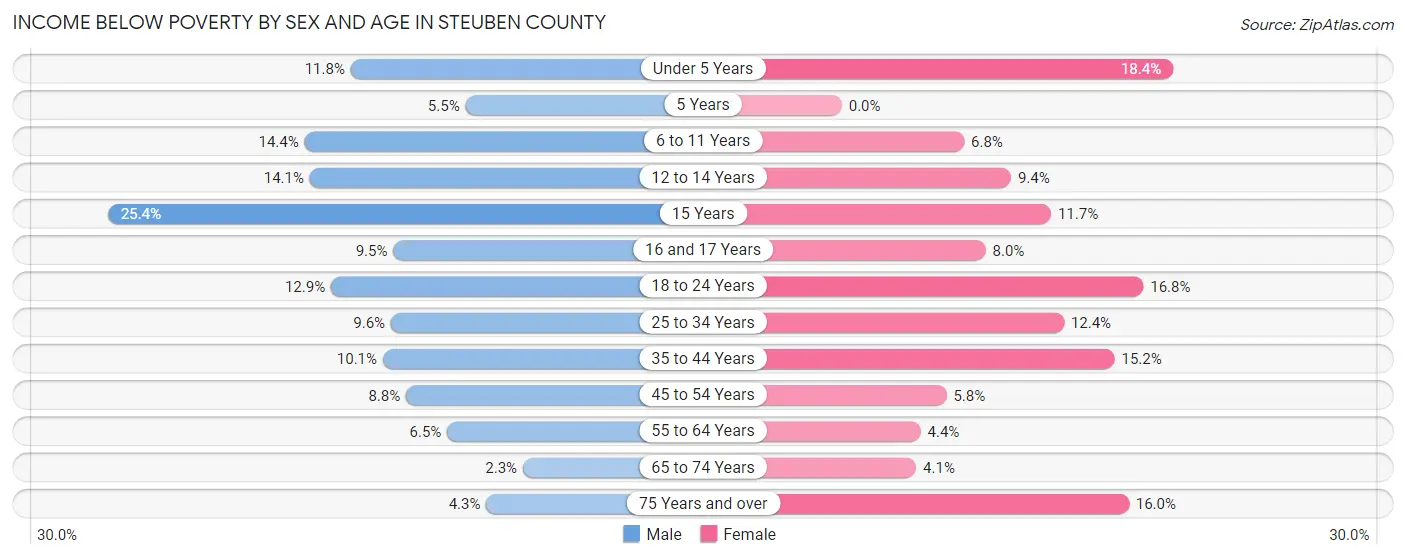
| Age Bracket | Male | Female |
| Under 5 Years | 108 (11.8%) | 147 (18.4%) |
| 5 Years | 9 (5.4%) | 0 (0.0%) |
| 6 to 11 Years | 154 (14.4%) | 71 (6.8%) |
| 12 to 14 Years | 98 (14.1%) | 44 (9.4%) |
| 15 Years | 86 (25.4%) | 29 (11.7%) |
| 16 and 17 Years | 27 (9.5%) | 29 (8.0%) |
| 18 to 24 Years | 206 (12.9%) | 208 (16.8%) |
| 25 to 34 Years | 178 (9.6%) | 225 (12.4%) |
| 35 to 44 Years | 173 (10.1%) | 258 (15.2%) |
| 45 to 54 Years | 185 (8.8%) | 123 (5.8%) |
| 55 to 64 Years | 168 (6.5%) | 109 (4.4%) |
| 65 to 74 Years | 49 (2.2%) | 92 (4.1%) |
| 75 Years and over | 54 (4.3%) | 233 (16.0%) |
| Total | 1,495 (8.9%) | 1,568 (9.7%) |
Income Above Poverty by Sex and Age in Steuben County
According to the poverty statistics in Steuben County, males aged 65 to 74 years and females aged 5 years are the age groups that are most secure financially, with 97.8% of males and 100.0% of females in these age groups living above the poverty line.
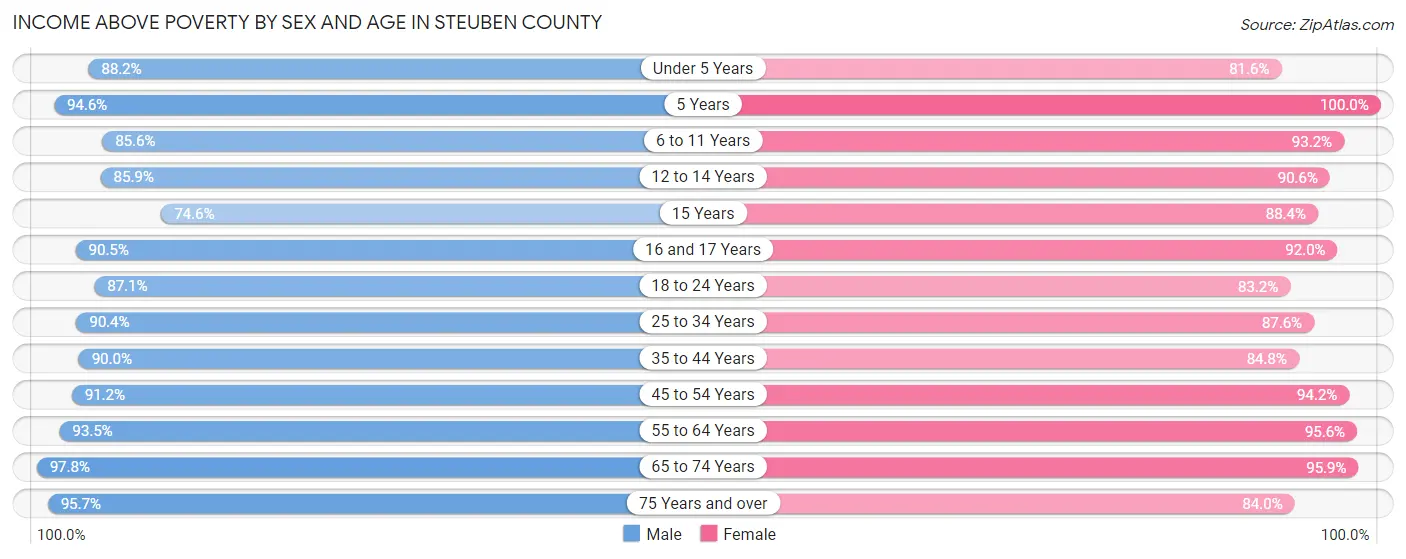
| Age Bracket | Male | Female |
| Under 5 Years | 804 (88.2%) | 650 (81.6%) |
| 5 Years | 156 (94.6%) | 195 (100.0%) |
| 6 to 11 Years | 915 (85.6%) | 972 (93.2%) |
| 12 to 14 Years | 596 (85.9%) | 423 (90.6%) |
| 15 Years | 253 (74.6%) | 220 (88.3%) |
| 16 and 17 Years | 258 (90.5%) | 333 (92.0%) |
| 18 to 24 Years | 1,386 (87.1%) | 1,031 (83.2%) |
| 25 to 34 Years | 1,677 (90.4%) | 1,594 (87.6%) |
| 35 to 44 Years | 1,549 (89.9%) | 1,440 (84.8%) |
| 45 to 54 Years | 1,927 (91.2%) | 1,988 (94.2%) |
| 55 to 64 Years | 2,427 (93.5%) | 2,373 (95.6%) |
| 65 to 74 Years | 2,126 (97.8%) | 2,129 (95.9%) |
| 75 Years and over | 1,204 (95.7%) | 1,225 (84.0%) |
| Total | 15,278 (91.1%) | 14,573 (90.3%) |
Income Below Poverty Among Married-Couple Families in Steuben County
The poverty statistics for married-couple families in Steuben County show that 4.3% or 312 of the total 7,345 families live below the poverty line. Families with 5 or more children have the highest poverty rate of 24.0%, comprising of 12 families. On the other hand, families with 1 or 2 children have the lowest poverty rate of 1.5%, which includes 26 families.

| Children | Above Poverty | Below Poverty |
| No Children | 4,817 (97.0%) | 148 (3.0%) |
| 1 or 2 Children | 1,680 (98.5%) | 26 (1.5%) |
| 3 or 4 Children | 498 (79.8%) | 126 (20.2%) |
| 5 or more Children | 38 (76.0%) | 12 (24.0%) |
| Total | 7,033 (95.8%) | 312 (4.3%) |
Income Below Poverty Among Single-Parent Households in Steuben County
According to the poverty data in Steuben County, 4.4% or 23 single-father households and 25.4% or 263 single-mother households are living below the poverty line. Among single-father households, those with 1 or 2 children have the highest poverty rate, with 17 households (7.0%) experiencing poverty. Likewise, among single-mother households, those with 3 or 4 children have the highest poverty rate, with 42 households (40.8%) falling below the poverty line.

| Children | Single Father | Single Mother |
| No Children | 0 (0.0%) | 36 (7.7%) |
| 1 or 2 Children | 17 (7.0%) | 185 (40.0%) |
| 3 or 4 Children | 6 (6.2%) | 42 (40.8%) |
| 5 or more Children | 0 (0.0%) | 0 (0.0%) |
| Total | 23 (4.4%) | 263 (25.4%) |
Income Below Poverty Among Married-Couple vs Single-Parent Households in Steuben County
The poverty data for Steuben County shows that 312 of the married-couple family households (4.3%) and 286 of the single-parent households (18.3%) are living below the poverty level. Within the married-couple family households, those with 5 or more children have the highest poverty rate, with 12 households (24.0%) falling below the poverty line. Among the single-parent households, those with 1 or 2 children have the highest poverty rate, with 202 household (28.6%) living below poverty.
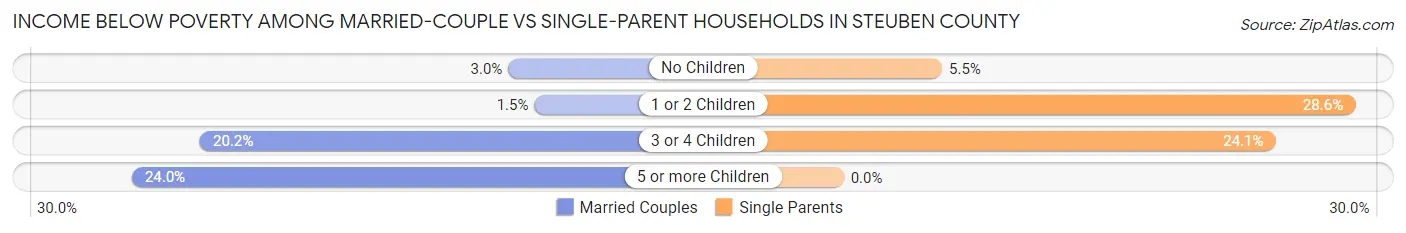
| Children | Married-Couple Families | Single-Parent Households |
| No Children | 148 (3.0%) | 36 (5.5%) |
| 1 or 2 Children | 26 (1.5%) | 202 (28.6%) |
| 3 or 4 Children | 126 (20.2%) | 48 (24.1%) |
| 5 or more Children | 12 (24.0%) | 0 (0.0%) |
| Total | 312 (4.3%) | 286 (18.3%) |
Race in Steuben County
The most populous races in Steuben County are White / Caucasian (32,572 | 94.4%), Hispanic or Latino (1,380 | 4.0%), and Two or more Races (1,183 | 3.4%).
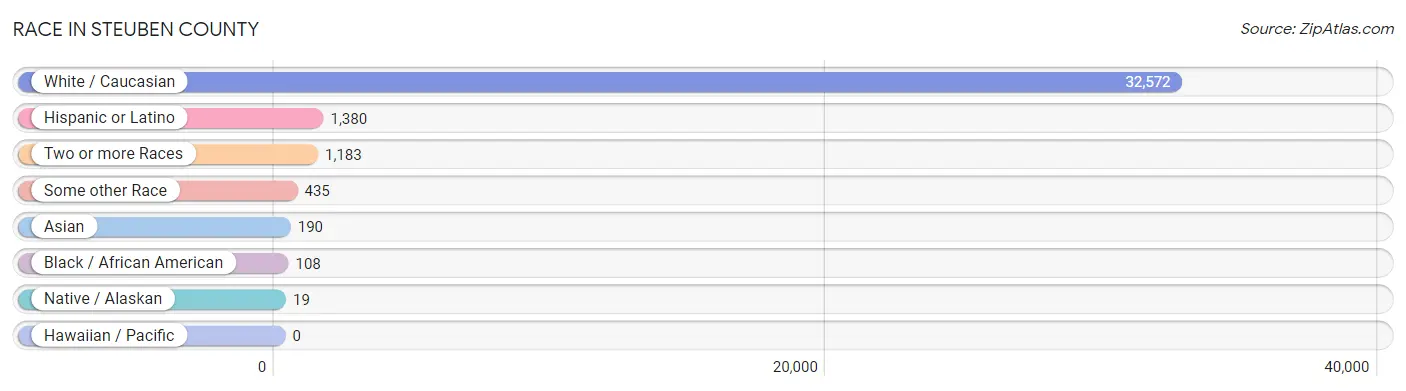
| Race | # Population | % Population |
| Asian | 190 | 0.5% |
| Black / African American | 108 | 0.3% |
| Hawaiian / Pacific | 0 | 0.0% |
| Hispanic or Latino | 1,380 | 4.0% |
| Native / Alaskan | 19 | 0.1% |
| White / Caucasian | 32,572 | 94.4% |
| Two or more Races | 1,183 | 3.4% |
| Some other Race | 435 | 1.3% |
| Total | 34,507 | 100.0% |
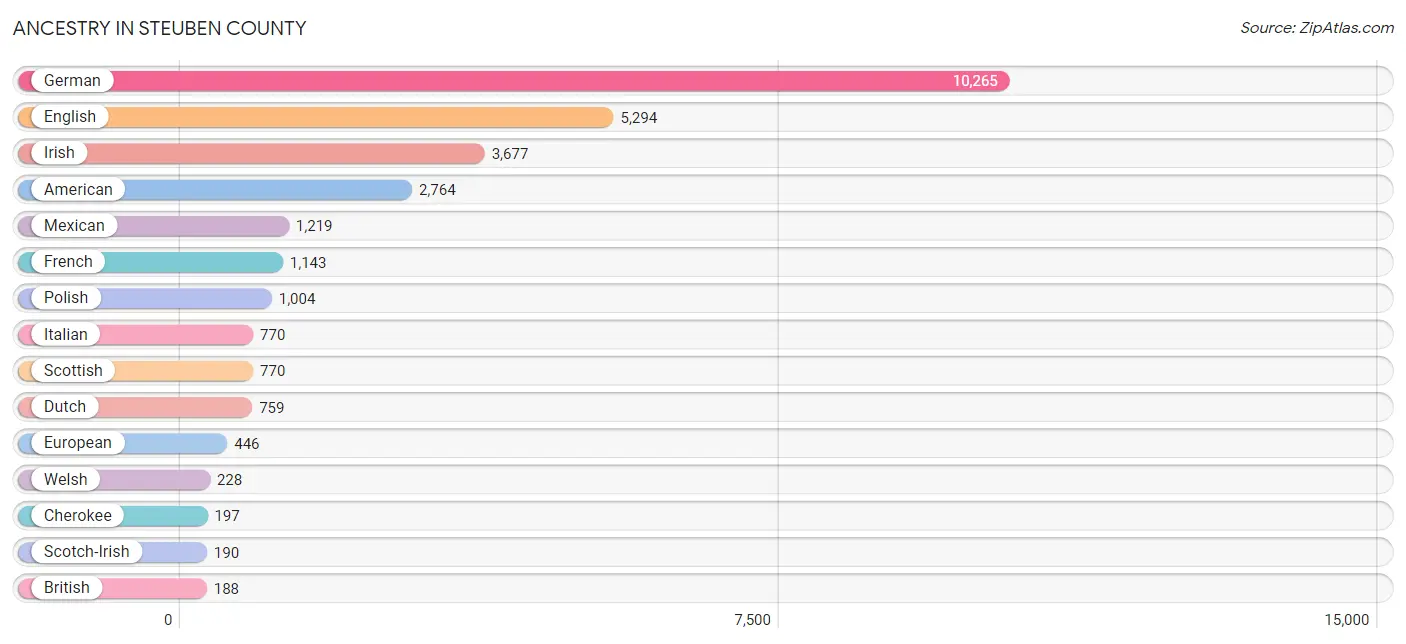
Ancestry in Steuben County
The most populous ancestries reported in Steuben County are German (10,265 | 29.7%), English (5,294 | 15.3%), Irish (3,677 | 10.7%), American (2,764 | 8.0%), and Mexican (1,219 | 3.5%), together accounting for 67.3% of all Steuben County residents.
| Ancestry | # Population | % Population |
| African | 10 | 0.0% |
| American | 2,764 | 8.0% |
| Arab | 10 | 0.0% |
| Austrian | 68 | 0.2% |
| Belgian | 139 | 0.4% |
| Brazilian | 7 | 0.0% |
| British | 188 | 0.5% |
| Bulgarian | 3 | 0.0% |
| Burmese | 4 | 0.0% |
| Canadian | 185 | 0.5% |
| Central American | 9 | 0.0% |
| Central American Indian | 30 | 0.1% |
| Cherokee | 197 | 0.6% |
| Chippewa | 24 | 0.1% |
| Comanche | 9 | 0.0% |
| Croatian | 26 | 0.1% |
| Cuban | 3 | 0.0% |
| Czech | 88 | 0.3% |
| Czechoslovakian | 98 | 0.3% |
| Danish | 33 | 0.1% |
| Dutch | 759 | 2.2% |
| Eastern European | 24 | 0.1% |
| English | 5,294 | 15.3% |
| European | 446 | 1.3% |
| Finnish | 27 | 0.1% |
| French | 1,143 | 3.3% |
| French American Indian | 1 | 0.0% |
| French Canadian | 127 | 0.4% |
| German | 10,265 | 29.7% |
| Greek | 41 | 0.1% |
| Guamanian / Chamorro | 8 | 0.0% |
| Hungarian | 113 | 0.3% |
| Icelander | 1 | 0.0% |
| Indian (Asian) | 22 | 0.1% |
| Indonesian | 4 | 0.0% |
| Irish | 3,677 | 10.7% |
| Italian | 770 | 2.2% |
| Japanese | 6 | 0.0% |
| Korean | 165 | 0.5% |
| Lebanese | 9 | 0.0% |
| Lithuanian | 7 | 0.0% |
| Mexican | 1,219 | 3.5% |
| Mexican American Indian | 30 | 0.1% |
| Native Hawaiian | 17 | 0.1% |
| Northern European | 42 | 0.1% |
| Norwegian | 132 | 0.4% |
| Pakistani | 49 | 0.1% |
| Pennsylvania German | 18 | 0.1% |
| Polish | 1,004 | 2.9% |
| Portuguese | 6 | 0.0% |
| Potawatomi | 5 | 0.0% |
| Puerto Rican | 73 | 0.2% |
| Romanian | 64 | 0.2% |
| Russian | 108 | 0.3% |
| Salvadoran | 9 | 0.0% |
| Scandinavian | 129 | 0.4% |
| Scotch-Irish | 190 | 0.5% |
| Scottish | 770 | 2.2% |
| Serbian | 12 | 0.0% |
| Sioux | 102 | 0.3% |
| Slavic | 10 | 0.0% |
| Slovak | 33 | 0.1% |
| Slovene | 17 | 0.1% |
| Spaniard | 6 | 0.0% |
| Sri Lankan | 26 | 0.1% |
| Subsaharan African | 10 | 0.0% |
| Swedish | 187 | 0.5% |
| Swiss | 99 | 0.3% |
| Syrian | 1 | 0.0% |
| Thai | 62 | 0.2% |
| Turkish | 7 | 0.0% |
| Ukrainian | 18 | 0.1% |
| Welsh | 228 | 0.7% | View All 73 Rows |
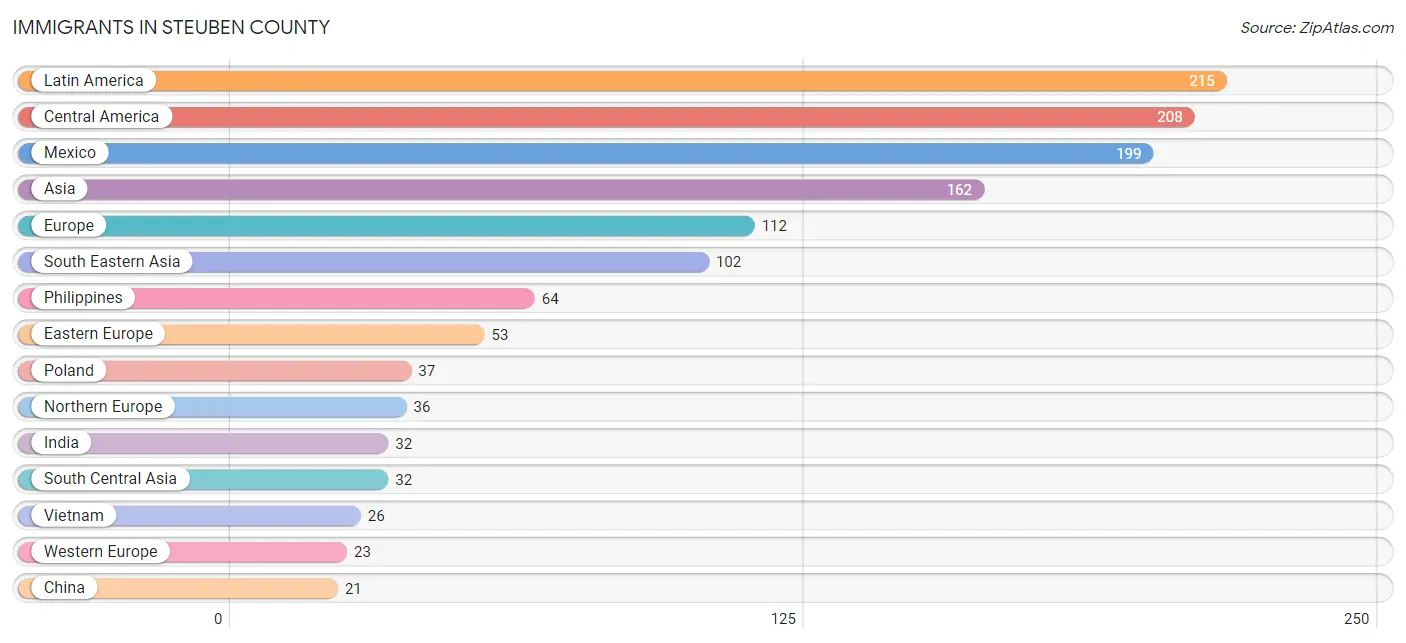
Immigrants in Steuben County
The most numerous immigrant groups reported in Steuben County came from Latin America (215 | 0.6%), Central America (208 | 0.6%), Mexico (199 | 0.6%), Asia (162 | 0.5%), and Europe (112 | 0.3%), together accounting for 2.6% of all Steuben County residents.
| Immigration Origin | # Population | % Population |
| Asia | 162 | 0.5% |
| Brazil | 7 | 0.0% |
| Canada | 9 | 0.0% |
| Central America | 208 | 0.6% |
| China | 21 | 0.1% |
| Czechoslovakia | 13 | 0.0% |
| Eastern Asia | 21 | 0.1% |
| Eastern Europe | 53 | 0.2% |
| El Salvador | 9 | 0.0% |
| England | 13 | 0.0% |
| Europe | 112 | 0.3% |
| Germany | 3 | 0.0% |
| India | 32 | 0.1% |
| Latin America | 215 | 0.6% |
| Mexico | 199 | 0.6% |
| Netherlands | 20 | 0.1% |
| Northern Europe | 36 | 0.1% |
| Philippines | 64 | 0.2% |
| Poland | 37 | 0.1% |
| Russia | 3 | 0.0% |
| Scotland | 7 | 0.0% |
| South America | 7 | 0.0% |
| South Central Asia | 32 | 0.1% |
| South Eastern Asia | 102 | 0.3% |
| Thailand | 8 | 0.0% |
| Turkey | 7 | 0.0% |
| Vietnam | 26 | 0.1% |
| Western Asia | 7 | 0.0% |
| Western Europe | 23 | 0.1% | View All 29 Rows |
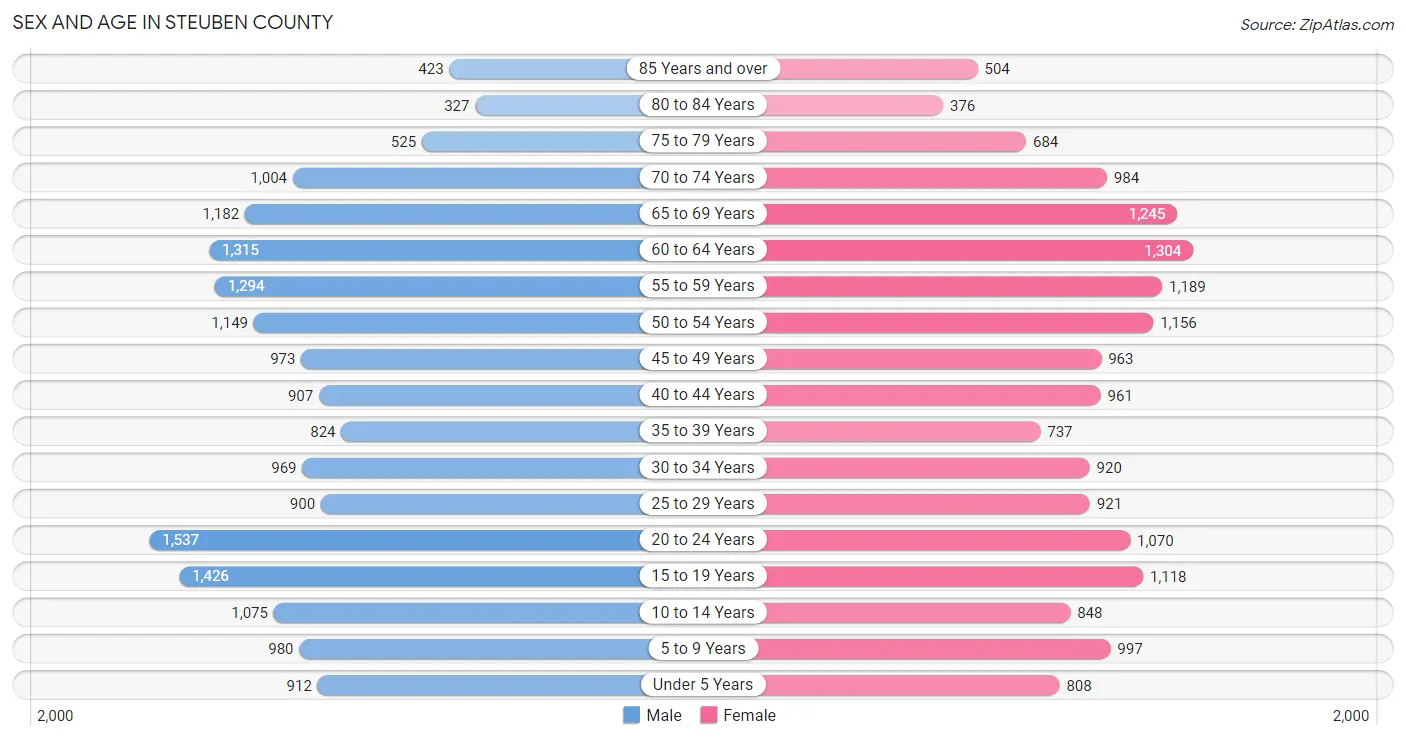
Sex and Age in Steuben County
Sex and Age in Steuben County
The most populous age groups in Steuben County are 20 to 24 Years (1,537 | 8.7%) for men and 60 to 64 Years (1,304 | 7.8%) for women.
| Age Bracket | Male | Female |
| Under 5 Years | 912 (5.1%) | 808 (4.8%) |
| 5 to 9 Years | 980 (5.5%) | 997 (5.9%) |
| 10 to 14 Years | 1,075 (6.1%) | 848 (5.1%) |
| 15 to 19 Years | 1,426 (8.1%) | 1,118 (6.7%) |
| 20 to 24 Years | 1,537 (8.7%) | 1,070 (6.4%) |
| 25 to 29 Years | 900 (5.1%) | 921 (5.5%) |
| 30 to 34 Years | 969 (5.5%) | 920 (5.5%) |
| 35 to 39 Years | 824 (4.6%) | 737 (4.4%) |
| 40 to 44 Years | 907 (5.1%) | 961 (5.7%) |
| 45 to 49 Years | 973 (5.5%) | 963 (5.7%) |
| 50 to 54 Years | 1,149 (6.5%) | 1,156 (6.9%) |
| 55 to 59 Years | 1,294 (7.3%) | 1,189 (7.1%) |
| 60 to 64 Years | 1,315 (7.4%) | 1,304 (7.8%) |
| 65 to 69 Years | 1,182 (6.7%) | 1,245 (7.4%) |
| 70 to 74 Years | 1,004 (5.7%) | 984 (5.9%) |
| 75 to 79 Years | 525 (3.0%) | 684 (4.1%) |
| 80 to 84 Years | 327 (1.8%) | 376 (2.2%) |
| 85 Years and over | 423 (2.4%) | 504 (3.0%) |
| Total | 17,722 (100.0%) | 16,785 (100.0%) |
Families and Households in Steuben County
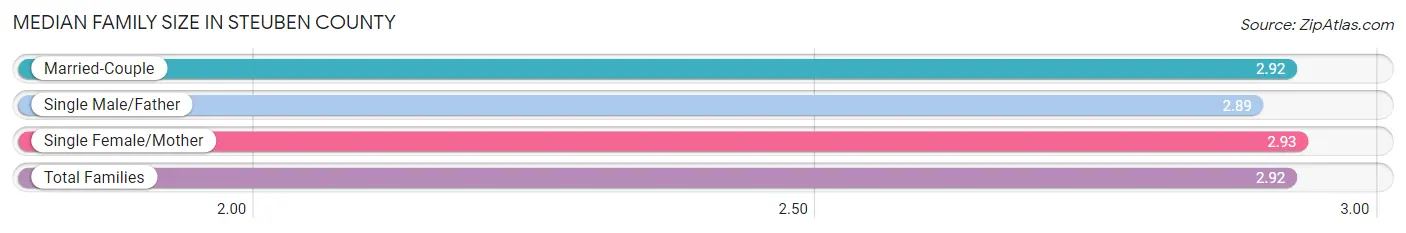
Median Family Size in Steuben County
The median family size in Steuben County is 2.92 persons per family, with single female/mother families (1,034 | 11.6%) accounting for the largest median family size of 2.93 persons per family. On the other hand, single male/father families (527 | 5.9%) represent the smallest median family size with 2.89 persons per family.
| Family Type | # Families | Family Size |
| Married-Couple | 7,345 (82.5%) | 2.92 |
| Single Male/Father | 527 (5.9%) | 2.89 |
| Single Female/Mother | 1,034 (11.6%) | 2.93 |
| Total Families | 8,906 (100.0%) | 2.92 |
Median Household Size in Steuben County
The median household size in Steuben County is 2.40 persons per household, with single male/father households (527 | 3.8%) accounting for the largest median household size of 3.43 persons per household. non-family households (4,888 | 35.4%) represent the smallest median household size with 1.31 persons per household.

| Household Type | # Households | Household Size |
| Married-Couple | 7,345 (53.2%) | 2.94 |
| Single Male/Father | 527 (3.8%) | 3.43 |
| Single Female/Mother | 1,034 (7.5%) | 3.25 |
| Non-family | 4,888 (35.4%) | 1.31 |
| Total Households | 13,794 (100.0%) | 2.40 |
Household Size by Marriage Status in Steuben County
Out of a total of 13,794 households in Steuben County, 8,906 (64.6%) are family households, while 4,888 (35.4%) are nonfamily households. The most numerous type of family households are 2-person households, comprising 4,871, and the most common type of nonfamily households are 1-person households, comprising 3,821.

| Household Size | Family Households | Nonfamily Households |
| 1-Person Households | - | 3,821 (27.7%) |
| 2-Person Households | 4,871 (35.3%) | 934 (6.8%) |
| 3-Person Households | 1,802 (13.1%) | 37 (0.3%) |
| 4-Person Households | 1,113 (8.1%) | 59 (0.4%) |
| 5-Person Households | 824 (6.0%) | 27 (0.2%) |
| 6-Person Households | 206 (1.5%) | 0 (0.0%) |
| 7+ Person Households | 90 (0.6%) | 10 (0.1%) |
| Total | 8,906 (64.6%) | 4,888 (35.4%) |
Female Fertility in Steuben County
Fertility by Age in Steuben County
Average fertility rate in Steuben County is 51.0 births per 1,000 women. Women in the age bracket of 20 to 34 years have the highest fertility rate with 109.0 births per 1,000 women. Women in the age bracket of 20 to 34 years acount for 90.3% of all women with births.

| Age Bracket | Women with Births | Births / 1,000 Women |
| 15 to 19 years | 10 (2.9%) | 9.0 |
| 20 to 34 years | 316 (90.3%) | 109.0 |
| 35 to 50 years | 24 (6.9%) | 8.0 |
| Total | 350 (100.0%) | 51.0 |
Fertility by Age by Marriage Status in Steuben County
62.0% of women with births (350) in Steuben County are married. The highest percentage of unmarried women with births falls into 15 to 19 years age bracket with 100.0% of them unmarried at the time of birth, while the lowest percentage of unmarried women with births belong to 20 to 34 years age bracket with 36.1% of them unmarried.

| Age Bracket | Married | Unmarried |
| 15 to 19 years | 0 (0.0%) | 10 (100.0%) |
| 20 to 34 years | 202 (63.9%) | 114 (36.1%) |
| 35 to 50 years | 15 (62.5%) | 9 (37.5%) |
| Total | 217 (62.0%) | 133 (38.0%) |
Fertility by Education in Steuben County
Average fertility rate in Steuben County is 51.0 births per 1,000 women. Women with the education attainment of high school diploma have the highest fertility rate of 74.0 births per 1,000 women, while women with the education attainment of less than high school have the lowest fertility at 9.0 births per 1,000 women. Women with the education attainment of high school diploma represent 46.3% of all women with births.

| Educational Attainment | Women with Births | Births / 1,000 Women |
| Less than High School | 10 (2.9%) | 9.0 |
| High School Diploma | 162 (46.3%) | 74.0 |
| College or Associate's Degree | 98 (28.0%) | 45.0 |
| Bachelor's Degree | 62 (17.7%) | 55.0 |
| Graduate Degree | 18 (5.1%) | 55.0 |
| Total | 350 (100.0%) | 51.0 |
Fertility by Education by Marriage Status in Steuben County
38.0% of women with births in Steuben County are unmarried. Women with the educational attainment of graduate degree are most likely to be married with 100.0% of them married at childbirth, while women with the educational attainment of less than high school are least likely to be married with 100.0% of them unmarried at childbirth.
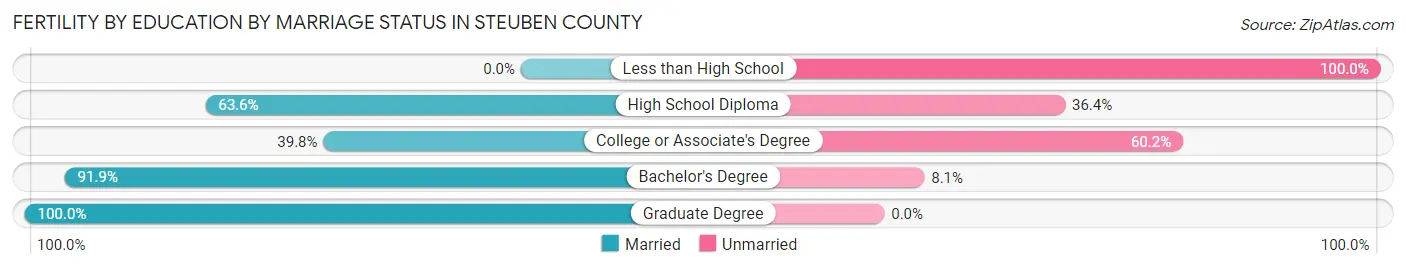
| Educational Attainment | Married | Unmarried |
| Less than High School | 0 (0.0%) | 10 (100.0%) |
| High School Diploma | 103 (63.6%) | 59 (36.4%) |
| College or Associate's Degree | 39 (39.8%) | 59 (60.2%) |
| Bachelor's Degree | 57 (91.9%) | 5 (8.1%) |
| Graduate Degree | 18 (100.0%) | 0 (0.0%) |
| Total | 217 (62.0%) | 133 (38.0%) |
Employment Characteristics in Steuben County
Employment by Class of Employer in Steuben County
Among the 16,098 employed individuals in Steuben County, private company employees (11,614 | 72.2%), not-for-profit organizations (1,505 | 9.3%), and local government employees (1,253 | 7.8%) make up the most common classes of employment.

| Employer Class | # Employees | % Employees |
| Private Company Employees | 11,614 | 72.2% |
| Self-Employed (Incorporated) | 556 | 3.5% |
| Self-Employed (Not Incorporated) | 698 | 4.3% |
| Not-for-profit Organizations | 1,505 | 9.3% |
| Local Government Employees | 1,253 | 7.8% |
| State Government Employees | 311 | 1.9% |
| Federal Government Employees | 155 | 1.0% |
| Unpaid Family Workers | 6 | 0.0% |
| Total | 16,098 | 100.0% |
Employment Status by Age in Steuben County
According to the labor force statistics for Steuben County, out of the total population over 16 years of age (28,299), 63.0% or 17,828 individuals are in the labor force, with 7.1% or 1,266 of them unemployed. The age group with the highest labor force participation rate is 45 to 54 years, with 87.2% or 3,698 individuals in the labor force. Within the labor force, the 20 to 24 years age range has the highest percentage of unemployed individuals, with 23.0% or 426 of them being unemployed.

| Age Bracket | In Labor Force | Unemployed |
| 16 to 19 Years | 1,246 (63.7%) | 213 (17.1%) |
| 20 to 24 Years | 1,851 (71.0%) | 426 (23.0%) |
| 25 to 29 Years | 1,524 (83.7%) | 43 (2.8%) |
| 30 to 34 Years | 1,615 (85.5%) | 27 (1.7%) |
| 35 to 44 Years | 2,870 (83.7%) | 181 (6.3%) |
| 45 to 54 Years | 3,698 (87.2%) | 189 (5.1%) |
| 55 to 59 Years | 1,974 (79.5%) | 20 (1.0%) |
| 60 to 64 Years | 1,532 (58.5%) | 32 (2.1%) |
| 65 to 74 Years | 1,342 (30.4%) | 129 (9.6%) |
| 75 Years and over | 179 (6.3%) | 1 (0.6%) |
| Total | 17,828 (63.0%) | 1,266 (7.1%) |
Employment Status by Educational Attainment in Steuben County
According to labor force statistics for Steuben County, 80.1% of individuals (13,202) out of the total population between 25 and 64 years of age (16,482) are in the labor force, with 3.7% or 488 of them being unemployed. The group with the highest labor force participation rate are those with the educational attainment of bachelor's degree or higher, with 84.9% or 3,427 individuals in the labor force. Within the labor force, individuals with high school diploma education have the highest percentage of unemployment, with 6.7% or 320 of them being unemployed.
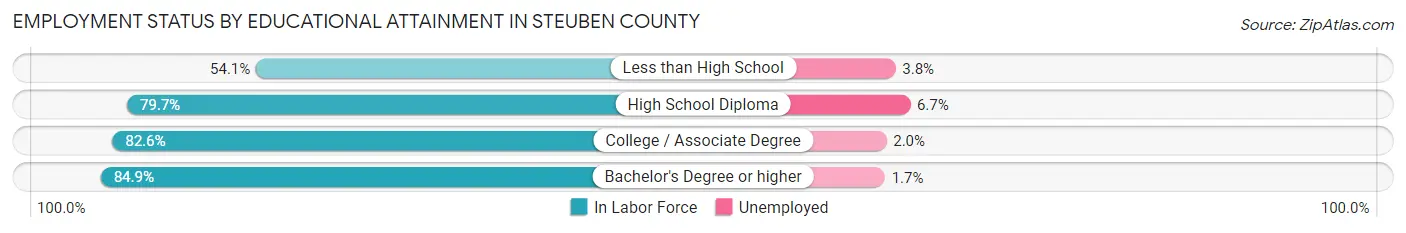
| Educational Attainment | In Labor Force | Unemployed |
| Less than High School | 612 (54.1%) | 43 (3.8%) |
| High School Diploma | 4,770 (79.7%) | 401 (6.7%) |
| College / Associate Degree | 4,402 (82.6%) | 107 (2.0%) |
| Bachelor's Degree or higher | 3,427 (84.9%) | 69 (1.7%) |
| Total | 13,202 (80.1%) | 610 (3.7%) |
Employment Occupations by Sex in Steuben County
Management, Business, Science and Arts Occupations
The most common Management, Business, Science and Arts occupations in Steuben County are Community & Social Service (1,599 | 9.7%), Management (1,384 | 8.4%), Education Instruction & Library (978 | 5.9%), Computers, Engineering & Science (719 | 4.3%), and Health Diagnosing & Treating (663 | 4.0%).

Management, Business, Science and Arts Occupations by Sex
Within the Management, Business, Science and Arts occupations in Steuben County, the most male-oriented occupations are Life, Physical & Social Science (88.6%), Architecture & Engineering (87.5%), and Computers, Engineering & Science (87.1%), while the most female-oriented occupations are Education Instruction & Library (79.2%), Health Diagnosing & Treating (76.3%), and Health Technologists (68.5%).

| Occupation | Male | Female |
| Management | 852 (61.6%) | 532 (38.4%) |
| Business & Financial | 180 (44.9%) | 221 (55.1%) |
| Computers, Engineering & Science | 626 (87.1%) | 93 (12.9%) |
| Computers & Mathematics | 163 (85.3%) | 28 (14.7%) |
| Architecture & Engineering | 370 (87.5%) | 53 (12.5%) |
| Life, Physical & Social Science | 93 (88.6%) | 12 (11.4%) |
| Community & Social Service | 574 (35.9%) | 1,025 (64.1%) |
| Education, Arts & Media | 212 (63.3%) | 123 (36.7%) |
| Legal Services & Support | 25 (37.3%) | 42 (62.7%) |
| Education Instruction & Library | 203 (20.8%) | 775 (79.2%) |
| Arts, Media & Entertainment | 134 (61.2%) | 85 (38.8%) |
| Health Diagnosing & Treating | 157 (23.7%) | 506 (76.3%) |
| Health Technologists | 105 (31.5%) | 228 (68.5%) |
| Total (Category) | 2,389 (50.1%) | 2,377 (49.9%) |
| Total (Overall) | 8,545 (51.6%) | 8,022 (48.4%) |
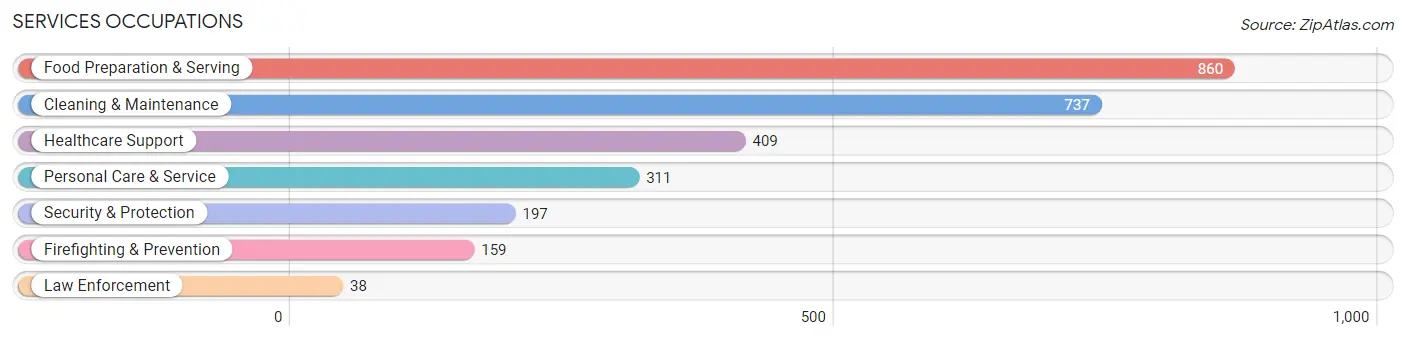
Services Occupations
The most common Services occupations in Steuben County are Food Preparation & Serving (860 | 5.2%), Cleaning & Maintenance (737 | 4.4%), Healthcare Support (409 | 2.5%), Personal Care & Service (311 | 1.9%), and Security & Protection (197 | 1.2%).
Services Occupations by Sex
Within the Services occupations in Steuben County, the most male-oriented occupations are Law Enforcement (100.0%), Security & Protection (76.1%), and Firefighting & Prevention (70.4%), while the most female-oriented occupations are Healthcare Support (96.3%), Personal Care & Service (77.2%), and Food Preparation & Serving (58.0%).

| Occupation | Male | Female |
| Healthcare Support | 15 (3.7%) | 394 (96.3%) |
| Security & Protection | 150 (76.1%) | 47 (23.9%) |
| Firefighting & Prevention | 112 (70.4%) | 47 (29.6%) |
| Law Enforcement | 38 (100.0%) | 0 (0.0%) |
| Food Preparation & Serving | 361 (42.0%) | 499 (58.0%) |
| Cleaning & Maintenance | 351 (47.6%) | 386 (52.4%) |
| Personal Care & Service | 71 (22.8%) | 240 (77.2%) |
| Total (Category) | 948 (37.7%) | 1,566 (62.3%) |
| Total (Overall) | 8,545 (51.6%) | 8,022 (48.4%) |
Sales and Office Occupations
The most common Sales and Office occupations in Steuben County are Office & Administration (1,738 | 10.5%), and Sales & Related (1,457 | 8.8%).

Sales and Office Occupations by Sex

| Occupation | Male | Female |
| Sales & Related | 609 (41.8%) | 848 (58.2%) |
| Office & Administration | 275 (15.8%) | 1,463 (84.2%) |
| Total (Category) | 884 (27.7%) | 2,311 (72.3%) |
| Total (Overall) | 8,545 (51.6%) | 8,022 (48.4%) |
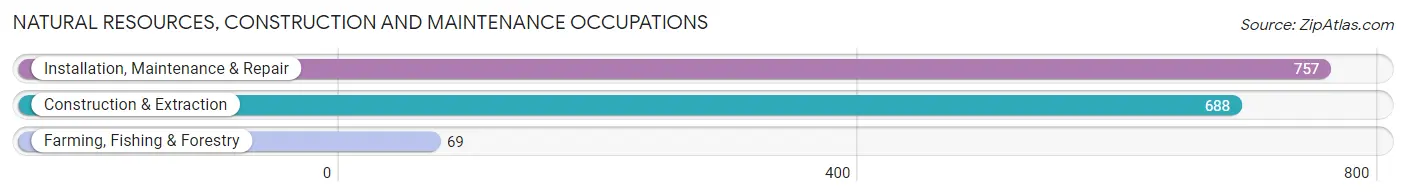
Natural Resources, Construction and Maintenance Occupations
The most common Natural Resources, Construction and Maintenance occupations in Steuben County are Installation, Maintenance & Repair (757 | 4.6%), Construction & Extraction (688 | 4.2%), and Farming, Fishing & Forestry (69 | 0.4%).
Natural Resources, Construction and Maintenance Occupations by Sex

| Occupation | Male | Female |
| Farming, Fishing & Forestry | 69 (100.0%) | 0 (0.0%) |
| Construction & Extraction | 618 (89.8%) | 70 (10.2%) |
| Installation, Maintenance & Repair | 741 (97.9%) | 16 (2.1%) |
| Total (Category) | 1,428 (94.3%) | 86 (5.7%) |
| Total (Overall) | 8,545 (51.6%) | 8,022 (48.4%) |
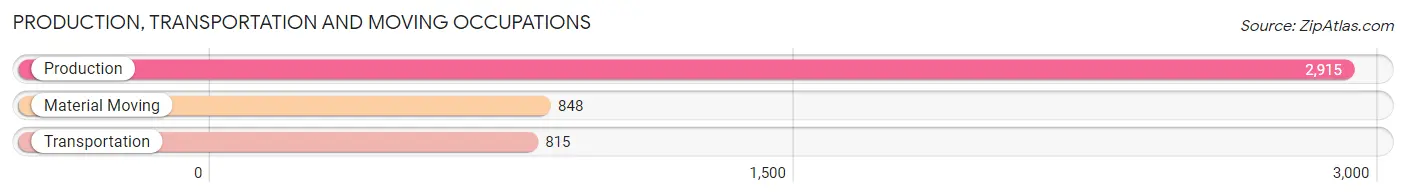
Production, Transportation and Moving Occupations
The most common Production, Transportation and Moving occupations in Steuben County are Production (2,915 | 17.6%), Material Moving (848 | 5.1%), and Transportation (815 | 4.9%).
Production, Transportation and Moving Occupations by Sex

| Occupation | Male | Female |
| Production | 1,652 (56.7%) | 1,263 (43.3%) |
| Transportation | 629 (77.2%) | 186 (22.8%) |
| Material Moving | 615 (72.5%) | 233 (27.5%) |
| Total (Category) | 2,896 (63.3%) | 1,682 (36.7%) |
| Total (Overall) | 8,545 (51.6%) | 8,022 (48.4%) |
Employment Industries by Sex in Steuben County
Employment Industries in Steuben County
The major employment industries in Steuben County include Manufacturing (5,053 | 30.5%), Retail Trade (1,835 | 11.1%), Health Care & Social Assistance (1,635 | 9.9%), Educational Services (1,542 | 9.3%), and Construction (1,056 | 6.4%).

Employment Industries by Sex in Steuben County
The Steuben County industries that see more men than women are Enterprise Management (100.0%), Agriculture, Fishing & Hunting (88.5%), and Utilities (78.4%), whereas the industries that tend to have a higher number of women are Information (90.1%), Health Care & Social Assistance (80.6%), and Finance & Insurance (78.1%).

| Industry | Male | Female |
| Agriculture, Fishing & Hunting | 138 (88.5%) | 18 (11.5%) |
| Mining, Quarrying, & Extraction | 48 (63.2%) | 28 (36.8%) |
| Construction | 739 (70.0%) | 317 (30.0%) |
| Manufacturing | 3,367 (66.6%) | 1,686 (33.4%) |
| Wholesale Trade | 231 (64.9%) | 125 (35.1%) |
| Retail Trade | 848 (46.2%) | 987 (53.8%) |
| Transportation & Warehousing | 494 (71.3%) | 199 (28.7%) |
| Utilities | 58 (78.4%) | 16 (21.6%) |
| Information | 8 (9.9%) | 73 (90.1%) |
| Finance & Insurance | 95 (21.9%) | 339 (78.1%) |
| Real Estate, Rental & Leasing | 96 (40.3%) | 142 (59.7%) |
| Professional & Scientific | 153 (37.5%) | 255 (62.5%) |
| Enterprise Management | 22 (100.0%) | 0 (0.0%) |
| Administrative & Support | 197 (56.3%) | 153 (43.7%) |
| Educational Services | 468 (30.3%) | 1,074 (69.7%) |
| Health Care & Social Assistance | 317 (19.4%) | 1,318 (80.6%) |
| Arts, Entertainment & Recreation | 194 (50.4%) | 191 (49.6%) |
| Accommodation & Food Services | 447 (51.6%) | 419 (48.4%) |
| Public Administration | 221 (43.5%) | 287 (56.5%) |
| Total | 8,545 (51.6%) | 8,022 (48.4%) |
Education in Steuben County
School Enrollment in Steuben County
The most common levels of schooling among the 8,032 students in Steuben County are college / undergraduate (2,107 | 26.2%), high school (1,859 | 23.1%), and elementary school (1,520 | 18.9%).
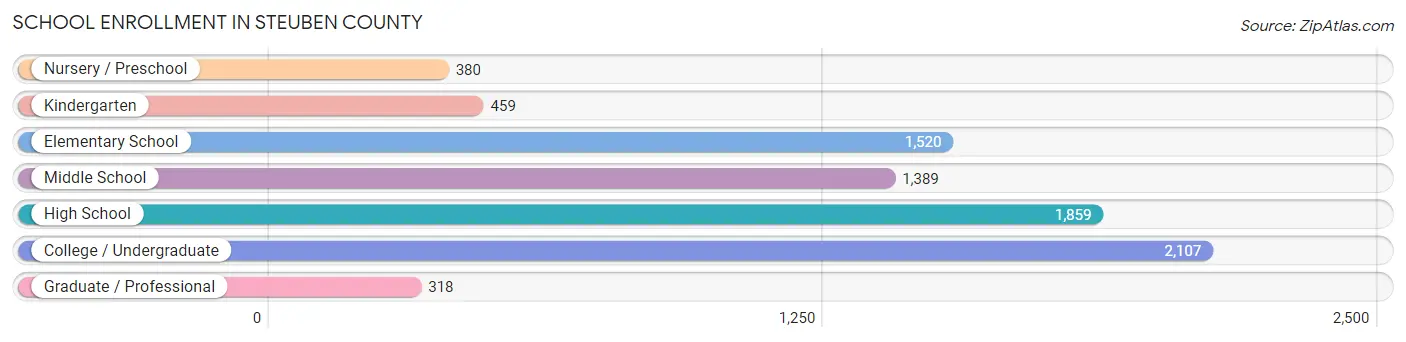
| School Level | # Students | % Students |
| Nursery / Preschool | 380 | 4.7% |
| Kindergarten | 459 | 5.7% |
| Elementary School | 1,520 | 18.9% |
| Middle School | 1,389 | 17.3% |
| High School | 1,859 | 23.1% |
| College / Undergraduate | 2,107 | 26.2% |
| Graduate / Professional | 318 | 4.0% |
| Total | 8,032 | 100.0% |
School Enrollment by Age by Funding Source in Steuben County
Out of a total of 8,032 students who are enrolled in schools in Steuben County, 2,321 (28.9%) attend a private institution, while the remaining 5,711 (71.1%) are enrolled in public schools. The age group of 20 to 24 year olds has the highest likelihood of being enrolled in private schools, with 832 (70.8% in the age bracket) enrolled. Conversely, the age group of 15 to 17 year olds has the lowest likelihood of being enrolled in a private school, with 1,121 (93.8% in the age bracket) attending a public institution.

| Age Bracket | Public School | Private School |
| 3 to 4 Year Olds | 156 (77.2%) | 46 (22.8%) |
| 5 to 9 Year Old | 1,601 (84.3%) | 299 (15.7%) |
| 10 to 14 Year Olds | 1,749 (92.6%) | 139 (7.4%) |
| 15 to 17 Year Olds | 1,121 (93.8%) | 74 (6.2%) |
| 18 to 19 Year Olds | 416 (44.5%) | 519 (55.5%) |
| 20 to 24 Year Olds | 343 (29.2%) | 832 (70.8%) |
| 25 to 34 Year Olds | 170 (37.9%) | 279 (62.1%) |
| 35 Years and over | 151 (52.4%) | 137 (47.6%) |
| Total | 5,711 (71.1%) | 2,321 (28.9%) |
Educational Attainment by Field of Study in Steuben County
Education (1,475 | 23.9%), business (1,083 | 17.5%), science & technology (676 | 10.9%), engineering (585 | 9.5%), and arts & humanities (429 | 7.0%) are the most common fields of study among 6,177 individuals in Steuben County who have obtained a bachelor's degree or higher.

| Field of Study | # Graduates | % Graduates |
| Computers & Mathematics | 155 | 2.5% |
| Bio, Nature & Agricultural | 278 | 4.5% |
| Physical & Health Sciences | 149 | 2.4% |
| Psychology | 249 | 4.0% |
| Social Sciences | 308 | 5.0% |
| Engineering | 585 | 9.5% |
| Multidisciplinary Studies | 52 | 0.8% |
| Science & Technology | 676 | 10.9% |
| Business | 1,083 | 17.5% |
| Education | 1,475 | 23.9% |
| Literature & Languages | 135 | 2.2% |
| Liberal Arts & History | 375 | 6.1% |
| Visual & Performing Arts | 111 | 1.8% |
| Communications | 117 | 1.9% |
| Arts & Humanities | 429 | 7.0% |
| Total | 6,177 | 100.0% |
Transportation & Commute in Steuben County
Vehicle Availability by Sex in Steuben County
The most prevalent vehicle ownership categories in Steuben County are males with 2 vehicles (3,759, accounting for 46.1%) and females with 2 vehicles (3,402, making up 49.5%).

| Vehicles Available | Male | Female |
| No Vehicle | 222 (2.7%) | 226 (3.0%) |
| 1 Vehicle | 1,028 (12.6%) | 1,056 (13.9%) |
| 2 Vehicles | 3,759 (46.1%) | 3,402 (44.8%) |
| 3 Vehicles | 1,896 (23.3%) | 1,847 (24.3%) |
| 4 Vehicles | 892 (10.9%) | 751 (9.9%) |
| 5 or more Vehicles | 354 (4.3%) | 308 (4.1%) |
| Total | 8,151 (100.0%) | 7,590 (100.0%) |
Commute Time in Steuben County
The most frequently occuring commute durations in Steuben County are 10 to 14 minutes (2,805 commuters, 18.1%), 5 to 9 minutes (2,627 commuters, 16.9%), and 15 to 19 minutes (2,417 commuters, 15.6%).
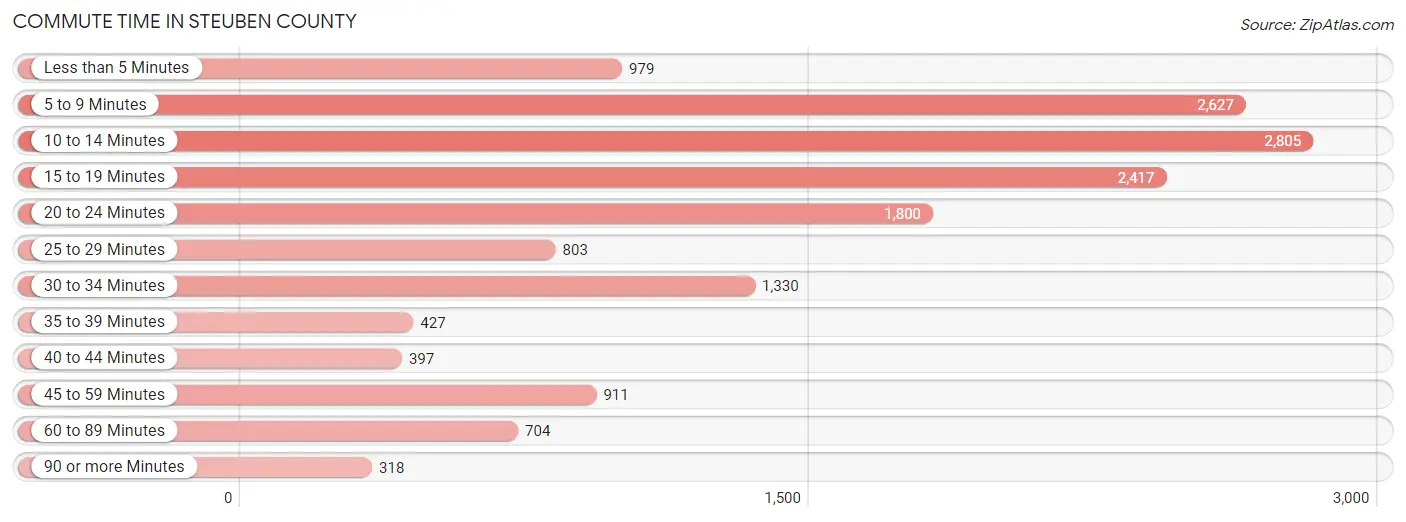
| Commute Time | # Commuters | % Commuters |
| Less than 5 Minutes | 979 | 6.3% |
| 5 to 9 Minutes | 2,627 | 16.9% |
| 10 to 14 Minutes | 2,805 | 18.1% |
| 15 to 19 Minutes | 2,417 | 15.6% |
| 20 to 24 Minutes | 1,800 | 11.6% |
| 25 to 29 Minutes | 803 | 5.2% |
| 30 to 34 Minutes | 1,330 | 8.6% |
| 35 to 39 Minutes | 427 | 2.8% |
| 40 to 44 Minutes | 397 | 2.6% |
| 45 to 59 Minutes | 911 | 5.9% |
| 60 to 89 Minutes | 704 | 4.5% |
| 90 or more Minutes | 318 | 2.1% |
Commute Time by Sex in Steuben County
The most common commute times in Steuben County are 10 to 14 minutes (1,386 commuters, 17.2%) for males and 10 to 14 minutes (1,419 commuters, 19.0%) for females.
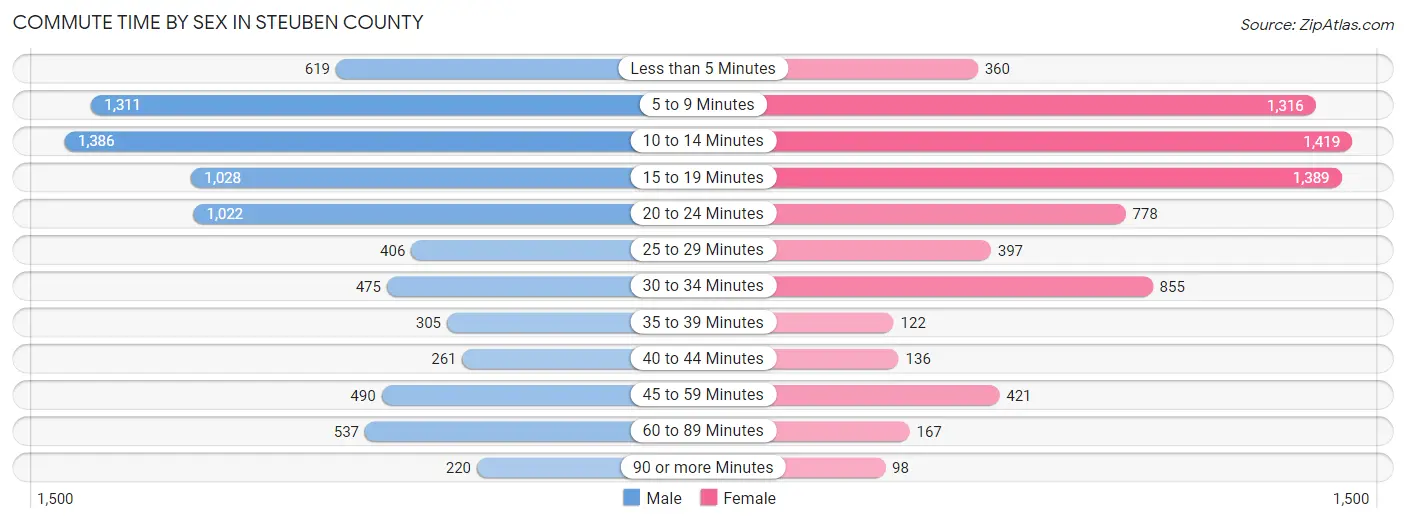
| Commute Time | Male | Female |
| Less than 5 Minutes | 619 (7.7%) | 360 (4.8%) |
| 5 to 9 Minutes | 1,311 (16.3%) | 1,316 (17.6%) |
| 10 to 14 Minutes | 1,386 (17.2%) | 1,419 (19.0%) |
| 15 to 19 Minutes | 1,028 (12.8%) | 1,389 (18.6%) |
| 20 to 24 Minutes | 1,022 (12.7%) | 778 (10.4%) |
| 25 to 29 Minutes | 406 (5.0%) | 397 (5.3%) |
| 30 to 34 Minutes | 475 (5.9%) | 855 (11.5%) |
| 35 to 39 Minutes | 305 (3.8%) | 122 (1.6%) |
| 40 to 44 Minutes | 261 (3.2%) | 136 (1.8%) |
| 45 to 59 Minutes | 490 (6.1%) | 421 (5.6%) |
| 60 to 89 Minutes | 537 (6.7%) | 167 (2.2%) |
| 90 or more Minutes | 220 (2.7%) | 98 (1.3%) |
Time of Departure to Work by Sex in Steuben County
The most frequent times of departure to work in Steuben County are 7:00 AM to 7:29 AM (1,013, 12.6%) for males and 7:30 AM to 7:59 AM (1,199, 16.1%) for females.
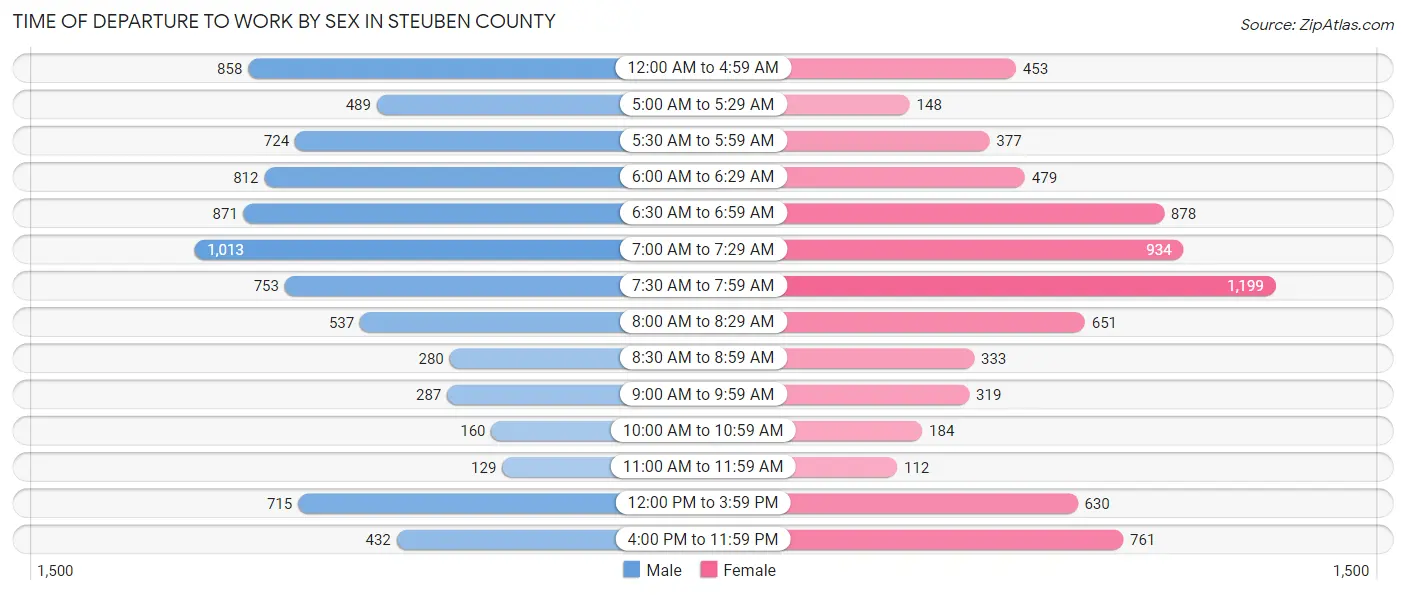
| Time of Departure | Male | Female |
| 12:00 AM to 4:59 AM | 858 (10.6%) | 453 (6.1%) |
| 5:00 AM to 5:29 AM | 489 (6.1%) | 148 (2.0%) |
| 5:30 AM to 5:59 AM | 724 (9.0%) | 377 (5.1%) |
| 6:00 AM to 6:29 AM | 812 (10.1%) | 479 (6.4%) |
| 6:30 AM to 6:59 AM | 871 (10.8%) | 878 (11.8%) |
| 7:00 AM to 7:29 AM | 1,013 (12.6%) | 934 (12.5%) |
| 7:30 AM to 7:59 AM | 753 (9.3%) | 1,199 (16.1%) |
| 8:00 AM to 8:29 AM | 537 (6.7%) | 651 (8.7%) |
| 8:30 AM to 8:59 AM | 280 (3.5%) | 333 (4.5%) |
| 9:00 AM to 9:59 AM | 287 (3.6%) | 319 (4.3%) |
| 10:00 AM to 10:59 AM | 160 (2.0%) | 184 (2.5%) |
| 11:00 AM to 11:59 AM | 129 (1.6%) | 112 (1.5%) |
| 12:00 PM to 3:59 PM | 715 (8.9%) | 630 (8.5%) |
| 4:00 PM to 11:59 PM | 432 (5.4%) | 761 (10.2%) |
| Total | 8,060 (100.0%) | 7,458 (100.0%) |
Housing Occupancy in Steuben County
Occupancy by Ownership in Steuben County
Of the total 13,794 dwellings in Steuben County, owner-occupied units account for 11,021 (79.9%), while renter-occupied units make up 2,773 (20.1%).
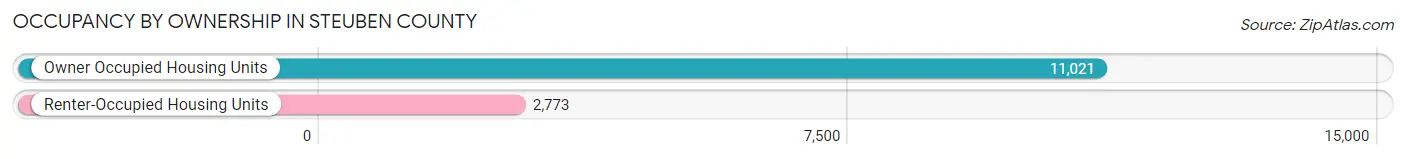
| Occupancy | # Housing Units | % Housing Units |
| Owner Occupied Housing Units | 11,021 | 79.9% |
| Renter-Occupied Housing Units | 2,773 | 20.1% |
| Total Occupied Housing Units | 13,794 | 100.0% |
Occupancy by Household Size in Steuben County

| Household Size | # Housing Units | % Housing Units |
| 1-Person Household | 3,821 | 27.7% |
| 2-Person Household | 5,805 | 42.1% |
| 3-Person Household | 1,839 | 13.3% |
| 4+ Person Household | 2,329 | 16.9% |
| Total Housing Units | 13,794 | 100.0% |
Occupancy by Ownership by Household Size in Steuben County
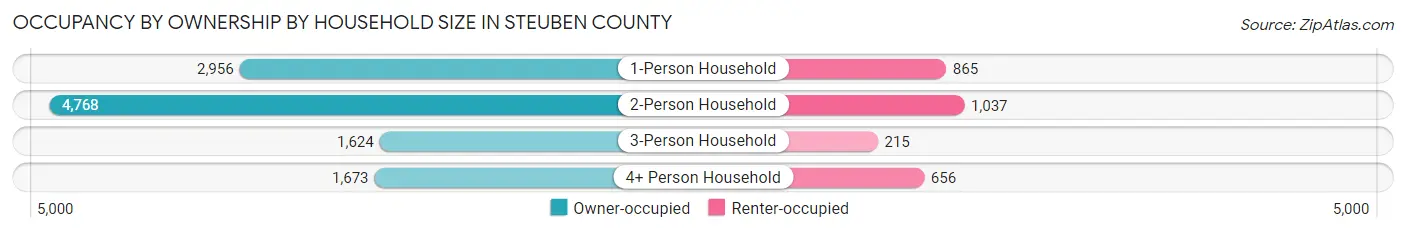
| Household Size | Owner-occupied | Renter-occupied |
| 1-Person Household | 2,956 (77.4%) | 865 (22.6%) |
| 2-Person Household | 4,768 (82.1%) | 1,037 (17.9%) |
| 3-Person Household | 1,624 (88.3%) | 215 (11.7%) |
| 4+ Person Household | 1,673 (71.8%) | 656 (28.2%) |
| Total Housing Units | 11,021 (79.9%) | 2,773 (20.1%) |
Occupancy by Educational Attainment in Steuben County

| Household Size | Owner-occupied | Renter-occupied |
| Less than High School | 601 (55.7%) | 478 (44.3%) |
| High School Diploma | 3,948 (78.1%) | 1,104 (21.8%) |
| College/Associate Degree | 3,595 (83.9%) | 688 (16.1%) |
| Bachelor's Degree or higher | 2,877 (85.1%) | 503 (14.9%) |
Occupancy by Age of Householder in Steuben County

| Age Bracket | # Households | % Households |
| Under 35 Years | 2,174 | 15.8% |
| 35 to 44 Years | 1,813 | 13.1% |
| 45 to 54 Years | 2,225 | 16.1% |
| 55 to 64 Years | 3,087 | 22.4% |
| 65 to 74 Years | 2,693 | 19.5% |
| 75 to 84 Years | 1,201 | 8.7% |
| 85 Years and Over | 601 | 4.4% |
| Total | 13,794 | 100.0% |
Housing Finances in Steuben County
Median Income by Occupancy in Steuben County
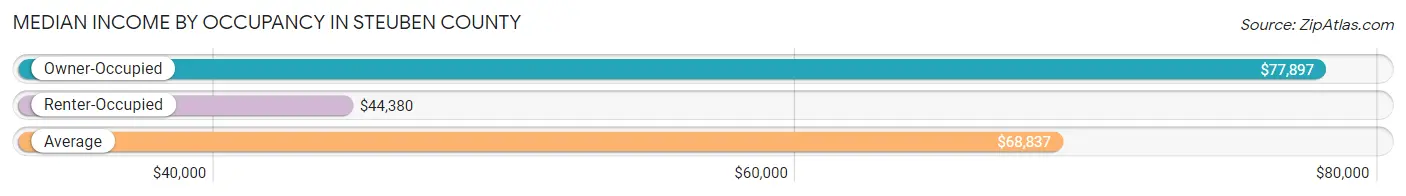
| Occupancy Type | # Households | Median Income |
| Owner-Occupied | 11,021 (79.9%) | $77,897 |
| Renter-Occupied | 2,773 (20.1%) | $44,380 |
| Average | 13,794 (100.0%) | $68,837 |
Occupancy by Householder Income Bracket in Steuben County

| Income Bracket | Owner-occupied | Renter-occupied |
| Less than $5,000 | 213 (1.9%) | 66 (2.4%) |
| $5,000 to $9,999 | 74 (0.7%) | 28 (1.0%) |
| $10,000 to $14,999 | 213 (1.9%) | 235 (8.5%) |
| $15,000 to $19,999 | 315 (2.9%) | 171 (6.2%) |
| $20,000 to $24,999 | 312 (2.8%) | 226 (8.2%) |
| $25,000 to $34,999 | 646 (5.9%) | 384 (13.9%) |
| $35,000 to $49,999 | 1,388 (12.6%) | 450 (16.2%) |
| $50,000 to $74,999 | 2,194 (19.9%) | 714 (25.8%) |
| $75,000 to $99,999 | 1,592 (14.4%) | 124 (4.5%) |
| $100,000 to $149,999 | 2,387 (21.7%) | 245 (8.8%) |
| $150,000 or more | 1,687 (15.3%) | 130 (4.7%) |
| Total | 11,021 (100.0%) | 2,773 (100.0%) |
Monthly Housing Cost Tiers in Steuben County
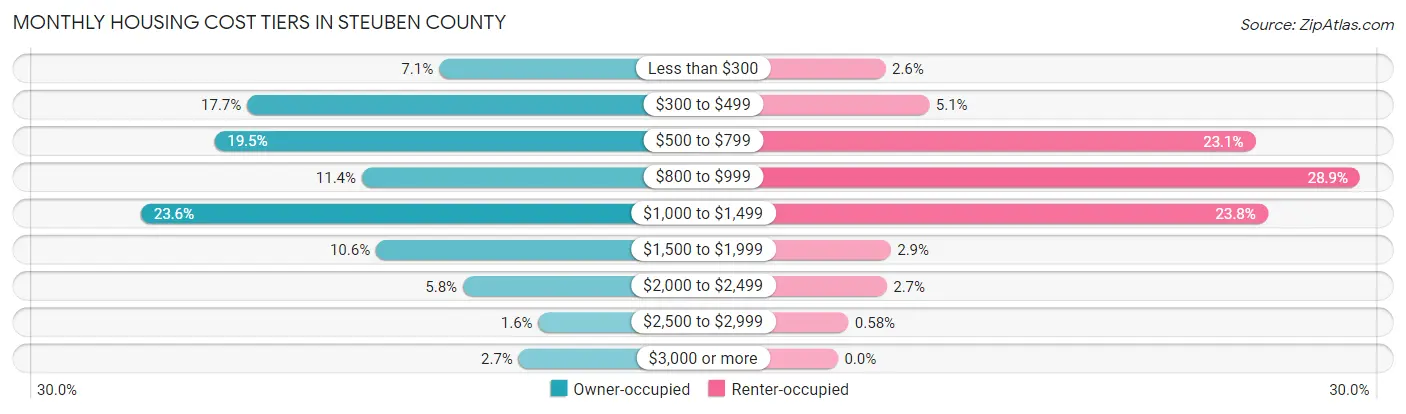
| Monthly Cost | Owner-occupied | Renter-occupied |
| Less than $300 | 784 (7.1%) | 73 (2.6%) |
| $300 to $499 | 1,952 (17.7%) | 140 (5.1%) |
| $500 to $799 | 2,151 (19.5%) | 640 (23.1%) |
| $800 to $999 | 1,253 (11.4%) | 800 (28.8%) |
| $1,000 to $1,499 | 2,599 (23.6%) | 659 (23.8%) |
| $1,500 to $1,999 | 1,167 (10.6%) | 81 (2.9%) |
| $2,000 to $2,499 | 638 (5.8%) | 75 (2.7%) |
| $2,500 to $2,999 | 178 (1.6%) | 16 (0.6%) |
| $3,000 or more | 299 (2.7%) | 0 (0.0%) |
| Total | 11,021 (100.0%) | 2,773 (100.0%) |
Physical Housing Characteristics in Steuben County
Housing Structures in Steuben County

| Structure Type | # Housing Units | % Housing Units |
| Single Unit, Detached | 10,776 | 78.1% |
| Single Unit, Attached | 494 | 3.6% |
| 2 Unit Apartments | 406 | 2.9% |
| 3 or 4 Unit Apartments | 111 | 0.8% |
| 5 to 9 Unit Apartments | 231 | 1.7% |
| 10 or more Apartments | 445 | 3.2% |
| Mobile Home / Other | 1,331 | 9.7% |
| Total | 13,794 | 100.0% |
Housing Structures by Occupancy in Steuben County
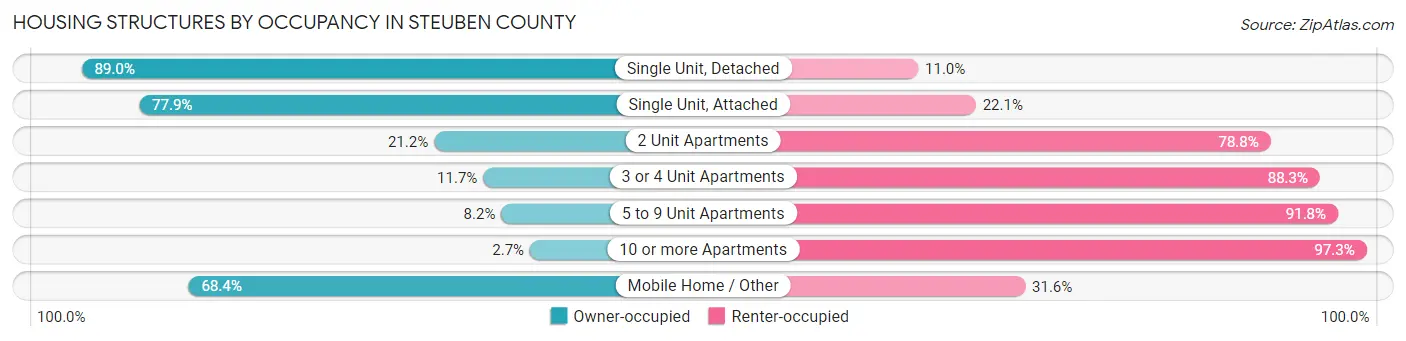
| Structure Type | Owner-occupied | Renter-occupied |
| Single Unit, Detached | 9,595 (89.0%) | 1,181 (11.0%) |
| Single Unit, Attached | 385 (77.9%) | 109 (22.1%) |
| 2 Unit Apartments | 86 (21.2%) | 320 (78.8%) |
| 3 or 4 Unit Apartments | 13 (11.7%) | 98 (88.3%) |
| 5 to 9 Unit Apartments | 19 (8.2%) | 212 (91.8%) |
| 10 or more Apartments | 12 (2.7%) | 433 (97.3%) |
| Mobile Home / Other | 911 (68.4%) | 420 (31.6%) |
| Total | 11,021 (79.9%) | 2,773 (20.1%) |
Housing Structures by Number of Rooms in Steuben County
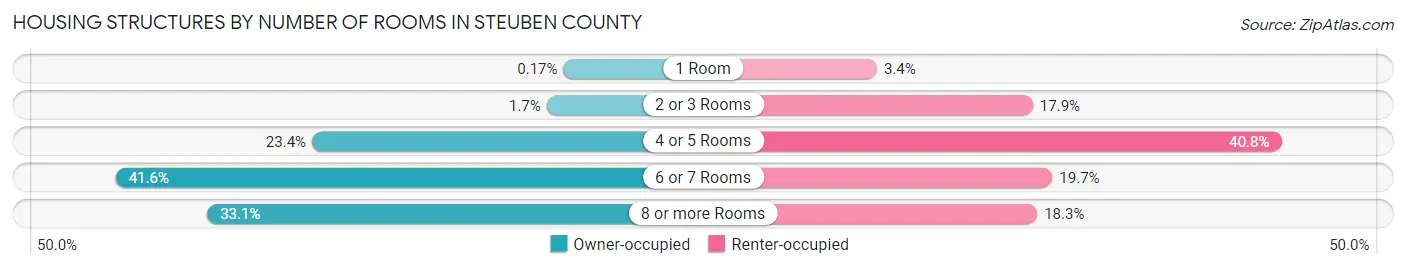
| Number of Rooms | Owner-occupied | Renter-occupied |
| 1 Room | 19 (0.2%) | 95 (3.4%) |
| 2 or 3 Rooms | 190 (1.7%) | 495 (17.8%) |
| 4 or 5 Rooms | 2,582 (23.4%) | 1,132 (40.8%) |
| 6 or 7 Rooms | 4,581 (41.6%) | 545 (19.7%) |
| 8 or more Rooms | 3,649 (33.1%) | 506 (18.2%) |
| Total | 11,021 (100.0%) | 2,773 (100.0%) |
Housing Structure by Heating Type in Steuben County
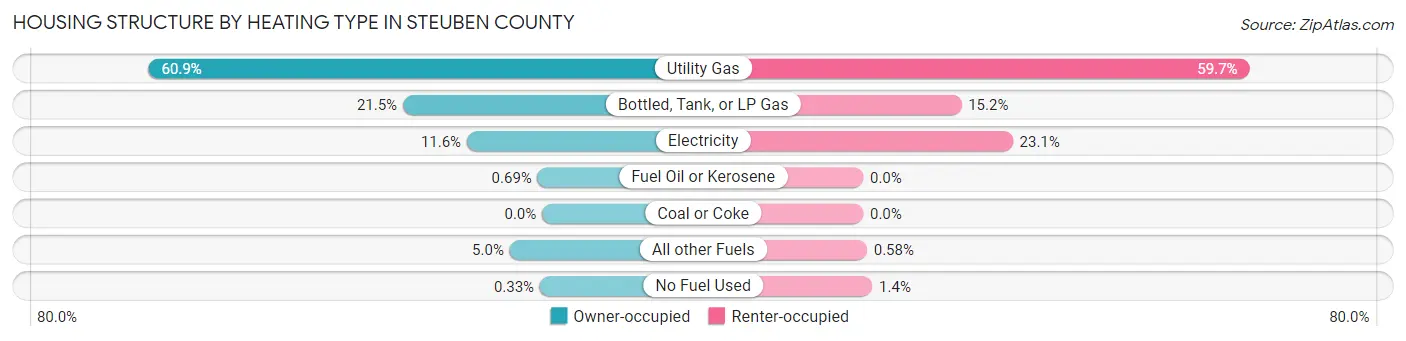
| Heating Type | Owner-occupied | Renter-occupied |
| Utility Gas | 6,706 (60.9%) | 1,656 (59.7%) |
| Bottled, Tank, or LP Gas | 2,371 (21.5%) | 421 (15.2%) |
| Electricity | 1,281 (11.6%) | 641 (23.1%) |
| Fuel Oil or Kerosene | 76 (0.7%) | 0 (0.0%) |
| Coal or Coke | 0 (0.0%) | 0 (0.0%) |
| All other Fuels | 551 (5.0%) | 16 (0.6%) |
| No Fuel Used | 36 (0.3%) | 39 (1.4%) |
| Total | 11,021 (100.0%) | 2,773 (100.0%) |
Household Vehicle Usage in Steuben County
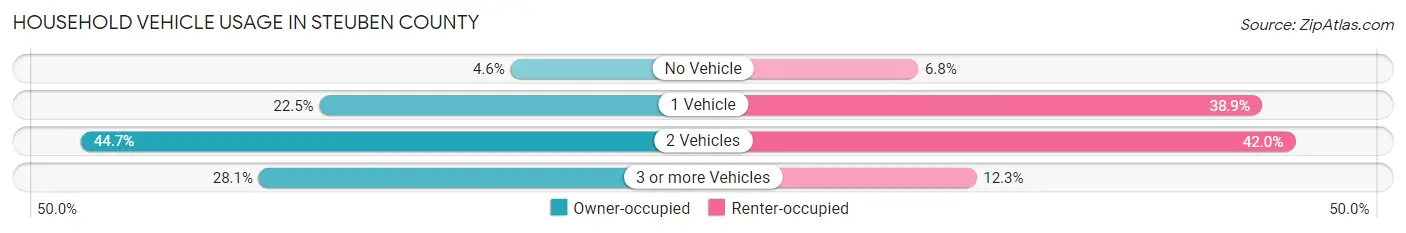
| Vehicles per Household | Owner-occupied | Renter-occupied |
| No Vehicle | 511 (4.6%) | 189 (6.8%) |
| 1 Vehicle | 2,478 (22.5%) | 1,079 (38.9%) |
| 2 Vehicles | 4,931 (44.7%) | 1,165 (42.0%) |
| 3 or more Vehicles | 3,101 (28.1%) | 340 (12.3%) |
| Total | 11,021 (100.0%) | 2,773 (100.0%) |
Real Estate & Mortgages in Steuben County
Real Estate and Mortgage Overview in Steuben County
| Characteristic | Without Mortgage | With Mortgage |
| Housing Units | 4,289 | 6,732 |
| Median Property Value | $185,700 | $188,400 |
| Median Household Income | $57,904 | $1,134 |
| Monthly Housing Costs | $446 | $299 |
| Real Estate Taxes | $1,168 | $131 |
Property Value by Mortgage Status in Steuben County

| Property Value | Without Mortgage | With Mortgage |
| Less than $50,000 | 477 (11.1%) | 194 (2.9%) |
| $50,000 to $99,999 | 388 (9.0%) | 849 (12.6%) |
| $100,000 to $299,999 | 2,176 (50.7%) | 3,746 (55.6%) |
| $300,000 to $499,999 | 787 (18.3%) | 1,366 (20.3%) |
| $500,000 to $749,999 | 285 (6.6%) | 343 (5.1%) |
| $750,000 to $999,999 | 91 (2.1%) | 147 (2.2%) |
| $1,000,000 or more | 85 (2.0%) | 87 (1.3%) |
| Total | 4,289 (100.0%) | 6,732 (100.0%) |
Household Income by Mortgage Status in Steuben County

| Household Income | Without Mortgage | With Mortgage |
| Less than $10,000 | 183 (4.3%) | 151 (2.2%) |
| $10,000 to $24,999 | 594 (13.9%) | 104 (1.5%) |
| $25,000 to $34,999 | 331 (7.7%) | 246 (3.6%) |
| $35,000 to $49,999 | 654 (15.2%) | 315 (4.7%) |
| $50,000 to $74,999 | 962 (22.4%) | 734 (10.9%) |
| $75,000 to $99,999 | 483 (11.3%) | 1,232 (18.3%) |
| $100,000 to $149,999 | 529 (12.3%) | 1,109 (16.5%) |
| $150,000 or more | 553 (12.9%) | 1,858 (27.6%) |
| Total | 4,289 (100.0%) | 6,732 (100.0%) |
Property Value to Household Income Ratio in Steuben County

| Value-to-Income Ratio | Without Mortgage | With Mortgage |
| Less than 2.0x | 1,477 (34.4%) | 91,675 (1,361.8%) |
| 2.0x to 2.9x | 610 (14.2%) | 2,995 (44.5%) |
| 3.0x to 3.9x | 504 (11.7%) | 1,496 (22.2%) |
| 4.0x or more | 1,691 (39.4%) | 799 (11.9%) |
| Total | 4,289 (100.0%) | 6,732 (100.0%) |
Real Estate Taxes by Mortgage Status in Steuben County

| Property Taxes | Without Mortgage | With Mortgage |
| Less than $800 | 1,369 (31.9%) | 37 (0.5%) |
| $800 to $1,499 | 1,202 (28.0%) | 2,441 (36.3%) |
| $800 to $1,499 | 1,494 (34.8%) | 1,892 (28.1%) |
| Total | 4,289 (100.0%) | 6,732 (100.0%) |
Health & Disability in Steuben County
Health Insurance Coverage by Age in Steuben County

| Age Bracket | With Coverage | Without Coverage |
| Under 6 Years | 2,035 (97.7%) | 47 (2.3%) |
| 6 to 18 Years | 5,256 (95.9%) | 225 (4.1%) |
| 19 to 25 Years | 3,170 (88.3%) | 419 (11.7%) |
| 26 to 34 Years | 2,942 (89.7%) | 337 (10.3%) |
| 35 to 44 Years | 3,105 (90.8%) | 315 (9.2%) |
| 45 to 54 Years | 3,853 (91.2%) | 370 (8.8%) |
| 55 to 64 Years | 4,793 (94.4%) | 284 (5.6%) |
| 65 to 74 Years | 4,396 (100.0%) | 0 (0.0%) |
| 75 Years and older | 2,716 (100.0%) | 0 (0.0%) |
| Total | 32,266 (94.2%) | 1,997 (5.8%) |
Health Insurance Coverage by Citizenship Status in Steuben County

| Citizenship Status | With Coverage | Without Coverage |
| Native Born | 2,035 (97.7%) | 47 (2.3%) |
| Foreign Born, Citizen | 5,256 (95.9%) | 225 (4.1%) |
| Foreign Born, not a Citizen | 3,170 (88.3%) | 419 (11.7%) |
Health Insurance Coverage by Household Income in Steuben County
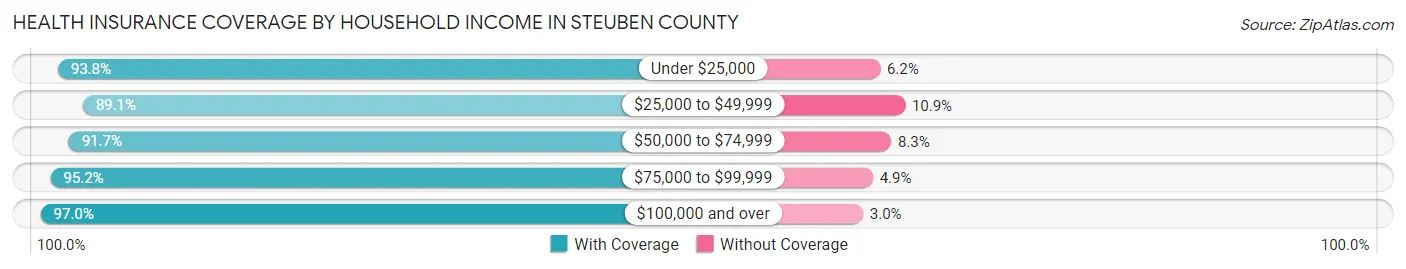
| Household Income | With Coverage | Without Coverage |
| Under $25,000 | 2,701 (93.8%) | 179 (6.2%) |
| $25,000 to $49,999 | 4,613 (89.1%) | 564 (10.9%) |
| $50,000 to $74,999 | 6,557 (91.7%) | 592 (8.3%) |
| $75,000 to $99,999 | 4,222 (95.2%) | 215 (4.9%) |
| $100,000 and over | 13,097 (97.0%) | 406 (3.0%) |
Public vs Private Health Insurance Coverage by Age in Steuben County
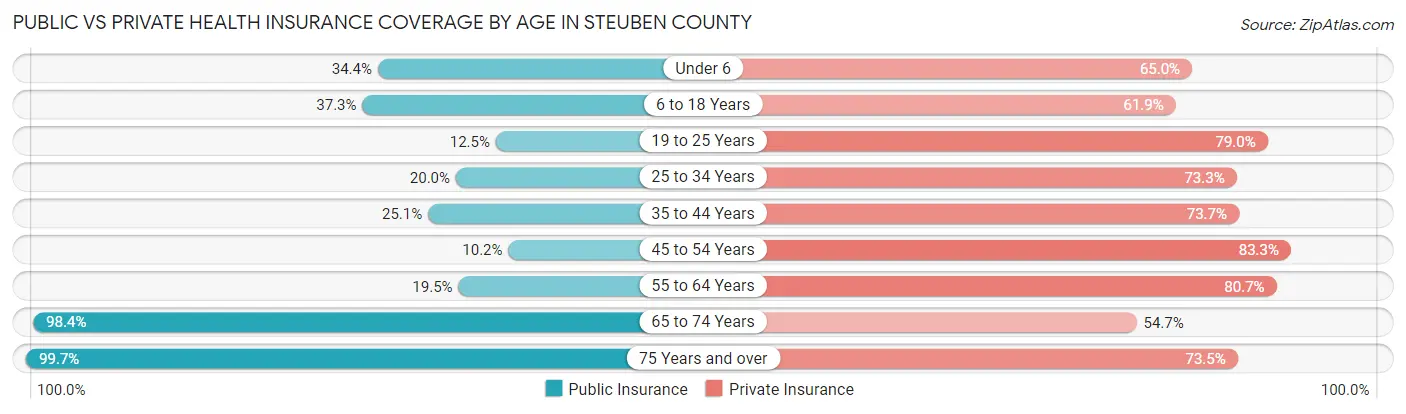
| Age Bracket | Public Insurance | Private Insurance |
| Under 6 | 717 (34.4%) | 1,353 (65.0%) |
| 6 to 18 Years | 2,045 (37.3%) | 3,395 (61.9%) |
| 19 to 25 Years | 450 (12.5%) | 2,836 (79.0%) |
| 25 to 34 Years | 654 (20.0%) | 2,402 (73.3%) |
| 35 to 44 Years | 859 (25.1%) | 2,520 (73.7%) |
| 45 to 54 Years | 431 (10.2%) | 3,519 (83.3%) |
| 55 to 64 Years | 989 (19.5%) | 4,095 (80.7%) |
| 65 to 74 Years | 4,326 (98.4%) | 2,405 (54.7%) |
| 75 Years and over | 2,709 (99.7%) | 1,995 (73.5%) |
| Total | 13,180 (38.5%) | 24,520 (71.6%) |
Disability Status by Sex by Age in Steuben County
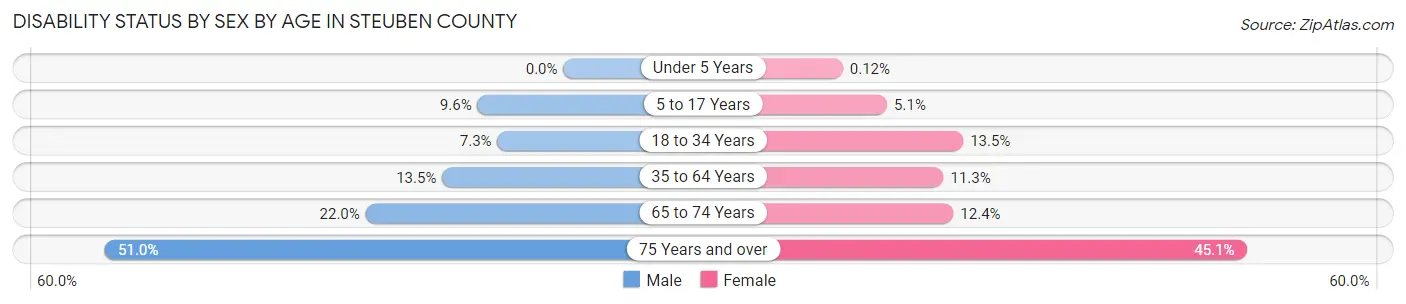
| Age Bracket | Male | Female |
| Under 5 Years | 0 (0.0%) | 1 (0.1%) |
| 5 to 17 Years | 256 (9.6%) | 124 (5.1%) |
| 18 to 34 Years | 307 (7.3%) | 459 (13.5%) |
| 35 to 64 Years | 867 (13.5%) | 713 (11.3%) |
| 65 to 74 Years | 479 (22.0%) | 276 (12.4%) |
| 75 Years and over | 642 (51.0%) | 657 (45.1%) |
Disability Class by Sex by Age in Steuben County
Disability Class: Hearing Difficulty
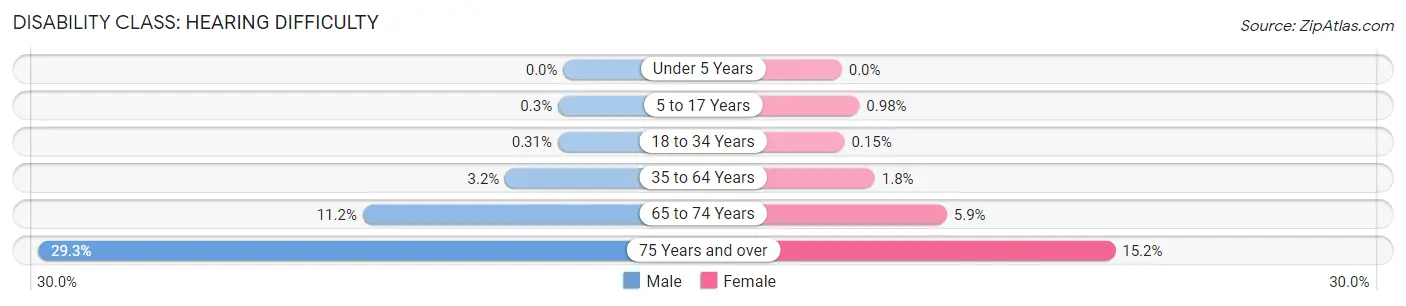
| Age Bracket | Male | Female |
| Under 5 Years | 0 (0.0%) | 0 (0.0%) |
| 5 to 17 Years | 8 (0.3%) | 24 (1.0%) |
| 18 to 34 Years | 13 (0.3%) | 5 (0.2%) |
| 35 to 64 Years | 208 (3.2%) | 116 (1.8%) |
| 65 to 74 Years | 243 (11.2%) | 130 (5.9%) |
| 75 Years and over | 368 (29.2%) | 222 (15.2%) |
Disability Class: Vision Difficulty
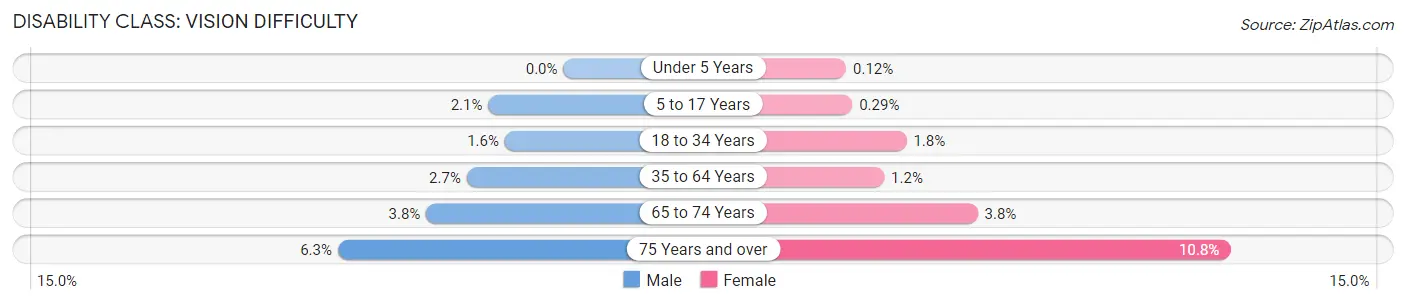
| Age Bracket | Male | Female |
| Under 5 Years | 0 (0.0%) | 1 (0.1%) |
| 5 to 17 Years | 56 (2.1%) | 7 (0.3%) |
| 18 to 34 Years | 68 (1.6%) | 61 (1.8%) |
| 35 to 64 Years | 173 (2.7%) | 74 (1.2%) |
| 65 to 74 Years | 83 (3.8%) | 84 (3.8%) |
| 75 Years and over | 79 (6.3%) | 158 (10.8%) |
Disability Class: Cognitive Difficulty
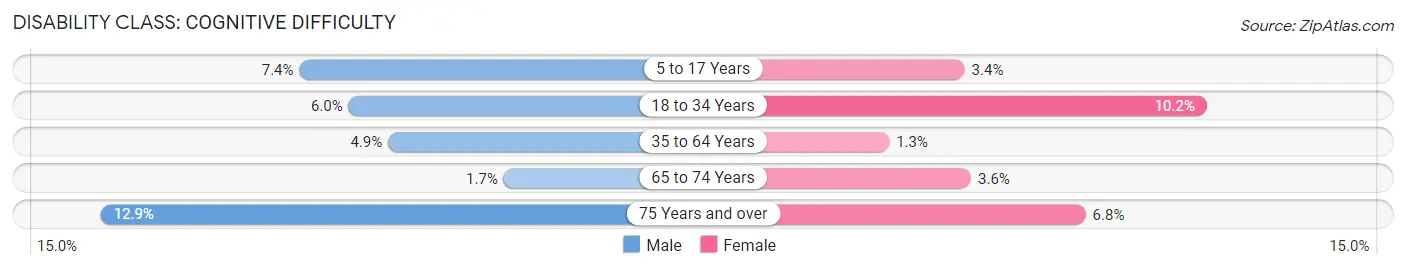
| Age Bracket | Male | Female |
| 5 to 17 Years | 197 (7.3%) | 84 (3.4%) |
| 18 to 34 Years | 250 (6.0%) | 345 (10.2%) |
| 35 to 64 Years | 314 (4.9%) | 83 (1.3%) |
| 65 to 74 Years | 36 (1.7%) | 80 (3.6%) |
| 75 Years and over | 162 (12.9%) | 99 (6.8%) |
Disability Class: Ambulatory Difficulty
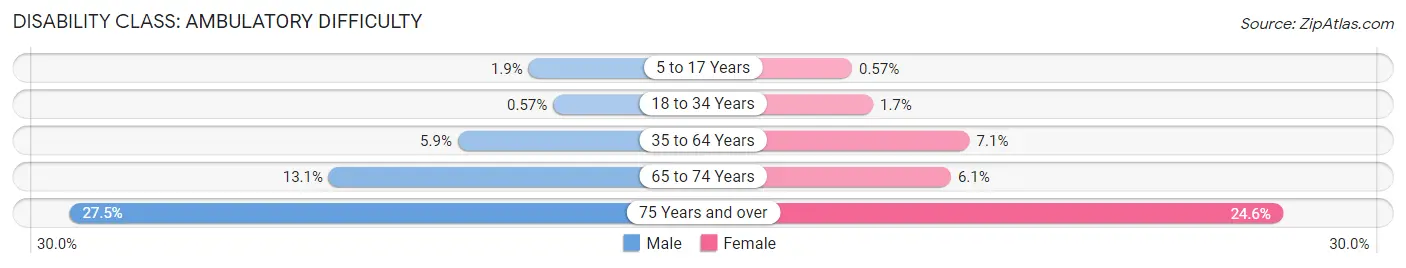
| Age Bracket | Male | Female |
| 5 to 17 Years | 52 (1.9%) | 14 (0.6%) |
| 18 to 34 Years | 24 (0.6%) | 59 (1.7%) |
| 35 to 64 Years | 378 (5.9%) | 448 (7.1%) |
| 65 to 74 Years | 284 (13.1%) | 135 (6.1%) |
| 75 Years and over | 346 (27.5%) | 358 (24.5%) |
Disability Class: Self-Care Difficulty

| Age Bracket | Male | Female |
| 5 to 17 Years | 79 (2.9%) | 43 (1.8%) |
| 18 to 34 Years | 13 (0.3%) | 42 (1.2%) |
| 35 to 64 Years | 187 (2.9%) | 66 (1.1%) |
| 65 to 74 Years | 116 (5.3%) | 23 (1.0%) |
| 75 Years and over | 76 (6.0%) | 66 (4.5%) |
Technology Access in Steuben County
Computing Device Access in Steuben County

| Device Type | # Households | % Households |
| Desktop or Laptop | 10,141 | 73.5% |
| Smartphone | 11,746 | 85.2% |
| Tablet | 7,864 | 57.0% |
| No Computing Device | 1,220 | 8.8% |
| Total | 13,794 | 100.0% |
Internet Access in Steuben County
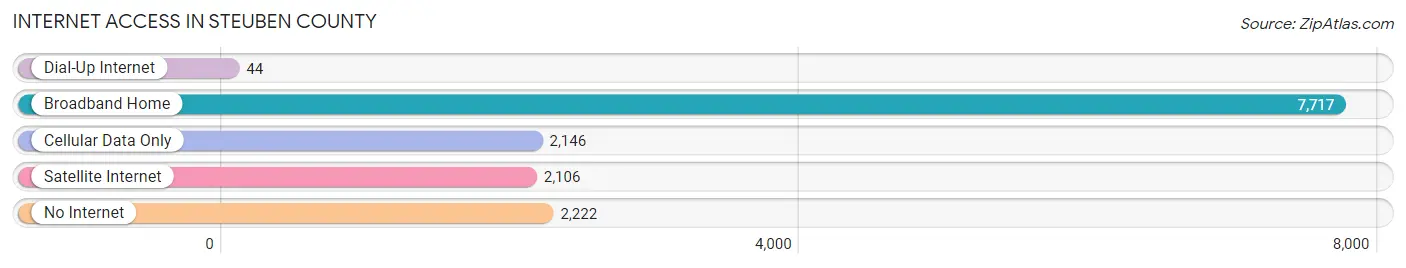
| Internet Type | # Households | % Households |
| Dial-Up Internet | 44 | 0.3% |
| Broadband Home | 7,717 | 55.9% |
| Cellular Data Only | 2,146 | 15.6% |
| Satellite Internet | 2,106 | 15.3% |
| No Internet | 2,222 | 16.1% |
| Total | 13,794 | 100.0% |
Steuben County Summary
Steuben County, Indiana is located in the northeast corner of the state, bordered by Michigan to the north and Ohio to the east. It is part of the Fort Wayne metropolitan area and is the largest county in the state by area. The county seat is Angola, and the population was estimated to be 34,185 in 2019.
History
Steuben County was formed in 1837 from parts of LaGrange and DeKalb counties. It was named after Baron von Steuben, a German-born military officer who served in the American Revolutionary War. The county was originally part of the Northwest Territory and was part of the Michigan Territory until 1816.
The first settlers in the area were Native Americans, including the Miami, Potawatomi, and Ottawa tribes. The first white settlers arrived in the early 1800s, and the county was officially organized in 1837.
The county was an important part of the Underground Railroad, with many Quaker families providing shelter and assistance to escaped slaves. The county was also home to the first public library in Indiana, which was established in Angola in 1851.
Geography
Steuben County is located in the northeast corner of Indiana, bordered by Michigan to the north and Ohio to the east. It is part of the Fort Wayne metropolitan area and is the largest county in the state by area. The county is mostly rural, with the majority of the population living in the cities of Angola and Fremont.
The county is located in the Tipton Till Plain, a flat region of glacial till and sand. The terrain is mostly flat, with some rolling hills in the northern part of the county. The highest point in the county is located in the northwest corner, at an elevation of 1,068 feet.
The county is home to several lakes, including Lake James, Lake Gage, and Lake George. The St. Joseph River flows through the county, and there are several creeks and streams.
Economy
Steuben County has a diverse economy, with a mix of manufacturing, agriculture, and tourism. The county is home to several large employers, including Zimmer Biomet, a medical device manufacturer, and Steuben Foods, a food processing company.
Agriculture is an important part of the economy, with corn, soybeans, and wheat being the main crops. Livestock production is also important, with beef cattle, dairy cows, and hogs being raised in the county.
Tourism is also an important part of the economy, with several state parks and recreational areas located in the county. The county is also home to Pokagon State Park, which is the only state park in Indiana with a ski resort.
Demographics
As of the 2010 census, the population of Steuben County was 34,185. The population is mostly white (94.3%), with small percentages of African American (2.2%), Hispanic (1.7%), and Asian (0.7%) residents.
The median household income in the county is $45,845, and the median home value is $117,400. The poverty rate is 11.3%, and the unemployment rate is 4.2%.
Conclusion
Steuben County, Indiana is located in the northeast corner of the state, bordered by Michigan to the north and Ohio to the east. It is part of the Fort Wayne metropolitan area and is the largest county in the state by area. The county has a diverse economy, with a mix of manufacturing, agriculture, and tourism. The population is mostly white, with small percentages of African American, Hispanic, and Asian residents. The median household income in the county is $45,845, and the median home value is $117,400. The poverty rate is 11.3%, and the unemployment rate is 4.2%.
Common Questions
What is Per Capita Income in Steuben County?
Per Capita income in Steuben County is $36,648.
What is the Median Family Income in Steuben County?
Median Family Income in Steuben County is $88,227.
What is the Median Household income in Steuben County?
Median Household Income in Steuben County is $68,837.
What is Income or Wage Gap in Steuben County?
Income or Wage Gap in Steuben County is 37.9%.
Women in Steuben County earn 62.1 cents for every dollar earned by a man.
What is Family Income Deficit in Steuben County?
Family Income Deficit in Steuben County is $10,344.
Families that are below poverty line in Steuben County earn $10,344 less on average than the poverty threshold level.
What is Inequality or Gini Index in Steuben County?
Inequality or Gini Index in Steuben County is 0.43.
What is the Total Population of Steuben County?
Total Population of Steuben County is 34,507.
What is the Total Male Population of Steuben County?
Total Male Population of Steuben County is 17,722.
What is the Total Female Population of Steuben County?
Total Female Population of Steuben County is 16,785.
What is the Ratio of Males per 100 Females in Steuben County?
There are 105.58 Males per 100 Females in Steuben County.
What is the Ratio of Females per 100 Males in Steuben County?
There are 94.71 Females per 100 Males in Steuben County.
What is the Median Population Age in Steuben County?
Median Population Age in Steuben County is 43.5 Years.
What is the Average Family Size in Steuben County
Average Family Size in Steuben County is 2.9 People.
What is the Average Household Size in Steuben County
Average Household Size in Steuben County is 2.4 People.
How Large is the Labor Force in Steuben County?
There are 17,828 People in the Labor Forcein in Steuben County.
What is the Percentage of People in the Labor Force in Steuben County?
63.0% of People are in the Labor Force in Steuben County.
What is the Unemployment Rate in Steuben County?
Unemployment Rate in Steuben County is 7.1%.