Rush County, IN Map & Demographics
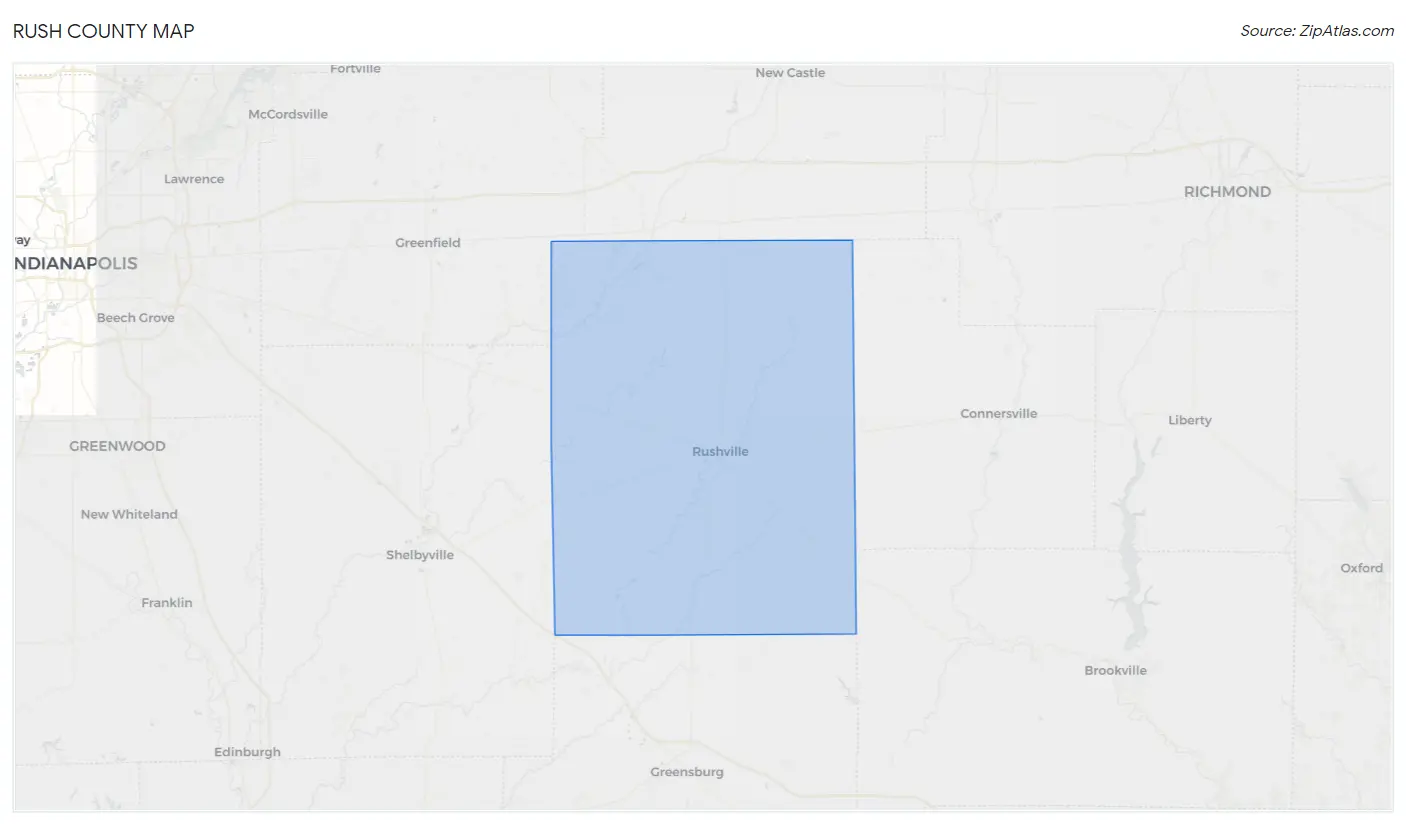
Rush County Map
Rush County Overview
$29,735
PER CAPITA INCOME
$75,018
AVG FAMILY INCOME
$62,386
AVG HOUSEHOLD INCOME
29.3%
WAGE / INCOME GAP [ % ]
70.7¢/ $1
WAGE / INCOME GAP [ $ ]
$8,895
FAMILY INCOME DEFICIT
0.38
INEQUALITY / GINI INDEX
16,716
TOTAL POPULATION
8,374
MALE POPULATION
8,342
FEMALE POPULATION
100.38
MALES / 100 FEMALES
99.62
FEMALES / 100 MALES
42.5
MEDIAN AGE
3.0
AVG FAMILY SIZE
2.5
AVG HOUSEHOLD SIZE
8,103
LABOR FORCE [ PEOPLE ]
60.3%
PERCENT IN LABOR FORCE
6.3%
UNEMPLOYMENT RATE
Income in Rush County
Income Overview in Rush County
Per Capita Income in Rush County is $29,735, while median incomes of families and households are $75,018 and $62,386 respectively.
| Characteristic | Number | Measure |
| Per Capita Income | 16,716 | $29,735 |
| Median Family Income | 4,383 | $75,018 |
| Mean Family Income | 4,383 | $83,541 |
| Median Household Income | 6,719 | $62,386 |
| Mean Household Income | 6,719 | $72,784 |
| Income Deficit | 4,383 | $8,895 |
| Wage / Income Gap (%) | 16,716 | 29.27% |
| Wage / Income Gap ($) | 16,716 | 70.73¢ per $1 |
| Gini / Inequality Index | 16,716 | 0.38 |
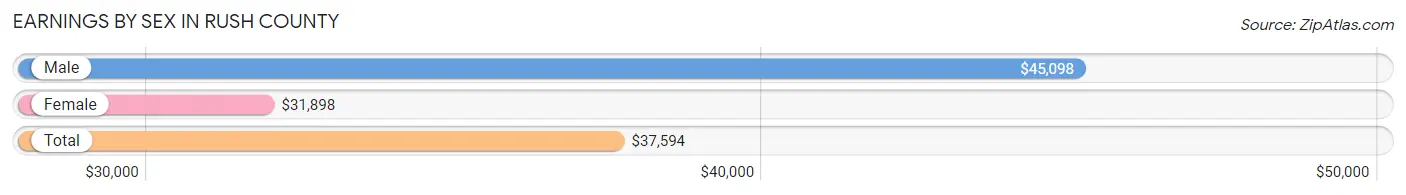
Earnings by Sex in Rush County
Average Earnings in Rush County are $37,594, $45,098 for men and $31,898 for women, a difference of 29.3%.
| Sex | Number | Average Earnings |
| Male | 4,632 (54.1%) | $45,098 |
| Female | 3,929 (45.9%) | $31,898 |
| Total | 8,561 (100.0%) | $37,594 |
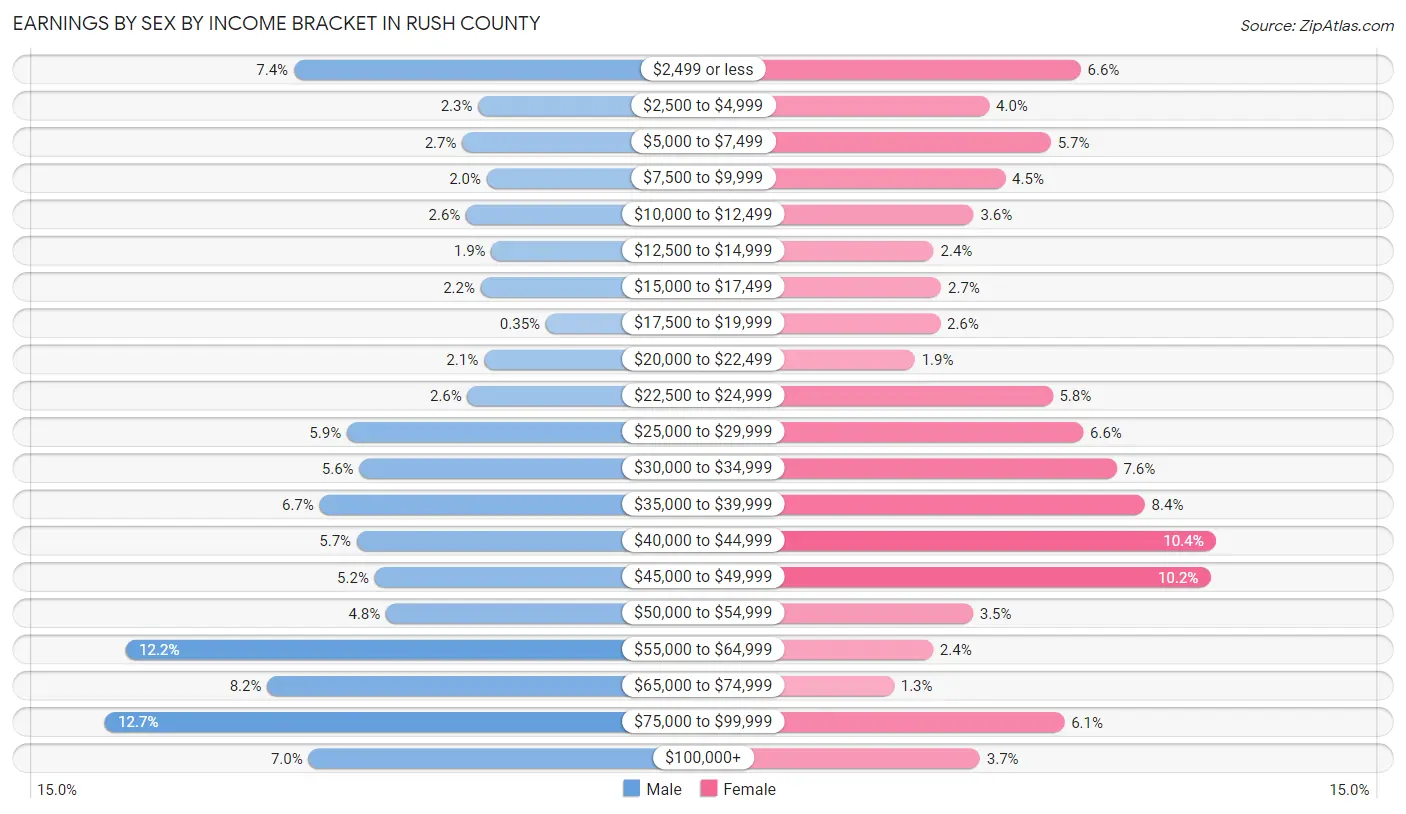
Earnings by Sex by Income Bracket in Rush County
The most common earnings brackets in Rush County are $75,000 to $99,999 for men (590 | 12.7%) and $40,000 to $44,999 for women (407 | 10.4%).
| Income | Male | Female |
| $2,499 or less | 344 (7.4%) | 258 (6.6%) |
| $2,500 to $4,999 | 104 (2.2%) | 157 (4.0%) |
| $5,000 to $7,499 | 125 (2.7%) | 225 (5.7%) |
| $7,500 to $9,999 | 93 (2.0%) | 175 (4.4%) |
| $10,000 to $12,499 | 120 (2.6%) | 140 (3.6%) |
| $12,500 to $14,999 | 87 (1.9%) | 96 (2.4%) |
| $15,000 to $17,499 | 101 (2.2%) | 104 (2.6%) |
| $17,500 to $19,999 | 16 (0.4%) | 103 (2.6%) |
| $20,000 to $22,499 | 97 (2.1%) | 75 (1.9%) |
| $22,500 to $24,999 | 118 (2.5%) | 227 (5.8%) |
| $25,000 to $29,999 | 275 (5.9%) | 261 (6.6%) |
| $30,000 to $34,999 | 259 (5.6%) | 298 (7.6%) |
| $35,000 to $39,999 | 311 (6.7%) | 329 (8.4%) |
| $40,000 to $44,999 | 262 (5.7%) | 407 (10.4%) |
| $45,000 to $49,999 | 239 (5.2%) | 401 (10.2%) |
| $50,000 to $54,999 | 224 (4.8%) | 139 (3.5%) |
| $55,000 to $64,999 | 563 (12.1%) | 95 (2.4%) |
| $65,000 to $74,999 | 379 (8.2%) | 52 (1.3%) |
| $75,000 to $99,999 | 590 (12.7%) | 240 (6.1%) |
| $100,000+ | 325 (7.0%) | 147 (3.7%) |
| Total | 4,632 (100.0%) | 3,929 (100.0%) |
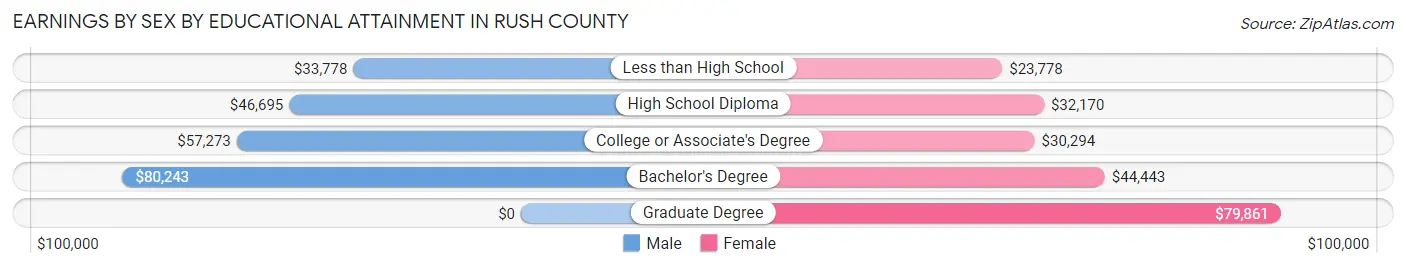
Earnings by Sex by Educational Attainment in Rush County
Average earnings in Rush County are $50,205 for men and $36,594 for women, a difference of 27.1%. Men with an educational attainment of bachelor's degree enjoy the highest average annual earnings of $80,243, while those with less than high school education earn the least with $33,778. Women with an educational attainment of graduate degree earn the most with the average annual earnings of $79,861, while those with less than high school education have the smallest earnings of $23,778.
| Educational Attainment | Male Income | Female Income |
| Less than High School | $33,778 | $23,778 |
| High School Diploma | $46,695 | $32,170 |
| College or Associate's Degree | $57,273 | $30,294 |
| Bachelor's Degree | $80,243 | $44,443 |
| Graduate Degree | - | - |
| Total | $50,205 | $36,594 |
Family Income in Rush County
Family Income Brackets in Rush County
According to the Rush County family income data, there are 1,030 families falling into the $100,000 to $149,999 income range, which is the most common income bracket and makes up 23.5% of all families. Conversely, the $10,000 to $14,999 income bracket is the least frequent group with only 66 families (1.5%) belonging to this category.
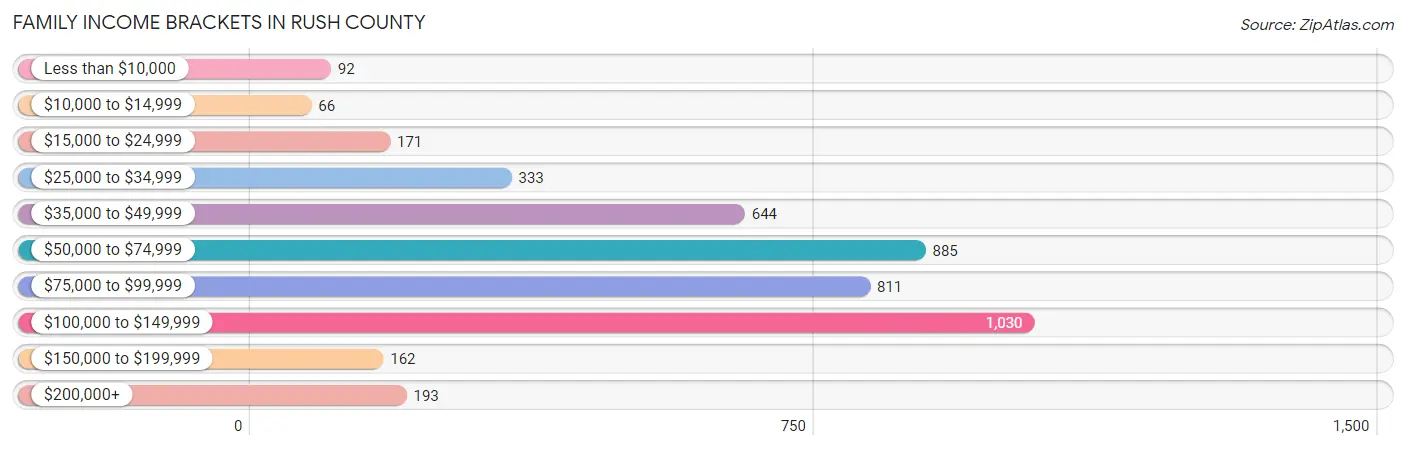
| Income Bracket | # Families | % Families |
| Less than $10,000 | 92 | 2.1% |
| $10,000 to $14,999 | 66 | 1.5% |
| $15,000 to $24,999 | 171 | 3.9% |
| $25,000 to $34,999 | 333 | 7.6% |
| $35,000 to $49,999 | 644 | 14.7% |
| $50,000 to $74,999 | 885 | 20.2% |
| $75,000 to $99,999 | 811 | 18.5% |
| $100,000 to $149,999 | 1,030 | 23.5% |
| $150,000 to $199,999 | 162 | 3.7% |
| $200,000+ | 193 | 4.4% |
Family Income by Famaliy Size in Rush County
4-person families (744 | 17.0%) account for the highest median family income in Rush County with $93,633 per family, while 2-person families (2,289 | 52.2%) have the highest median income of $32,335 per family member.
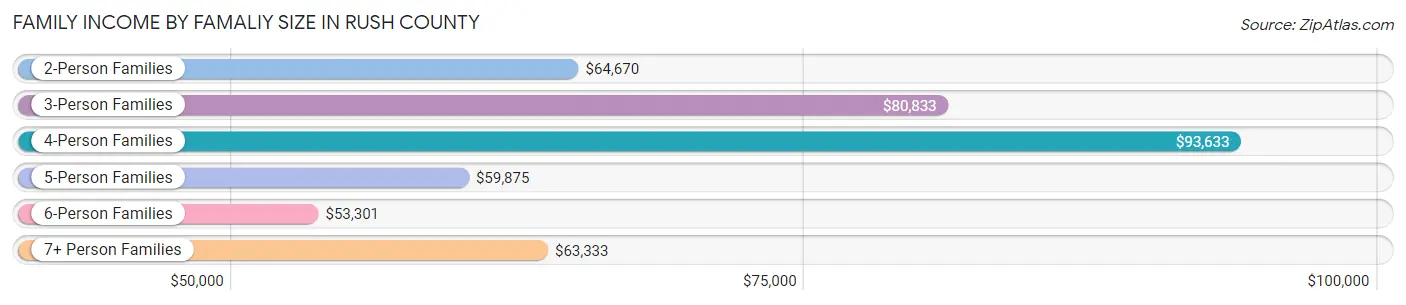
| Income Bracket | # Families | Median Income |
| 2-Person Families | 2,289 (52.2%) | $64,670 |
| 3-Person Families | 858 (19.6%) | $80,833 |
| 4-Person Families | 744 (17.0%) | $93,633 |
| 5-Person Families | 349 (8.0%) | $59,875 |
| 6-Person Families | 127 (2.9%) | $53,301 |
| 7+ Person Families | 16 (0.4%) | $63,333 |
| Total | 4,383 (100.0%) | $75,018 |
Family Income by Number of Earners in Rush County
The median family income in Rush County is $75,018, with families comprising 3+ earners (418) having the highest median family income of $123,795, while families with no earners (701) have the lowest median family income of $44,934, accounting for 9.5% and 16.0% of families, respectively.
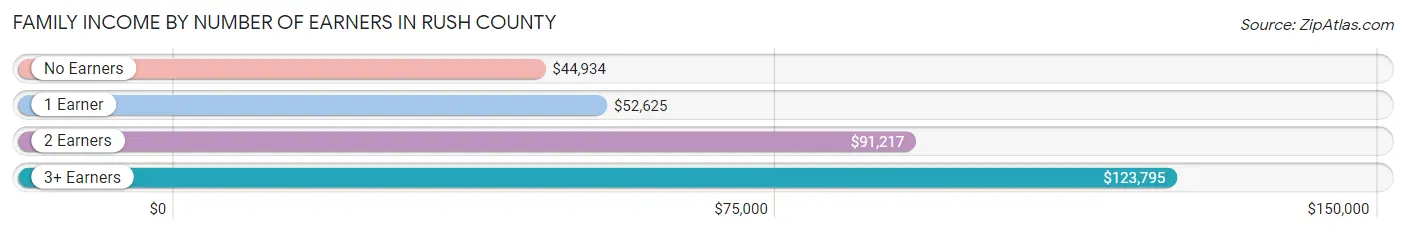
| Number of Earners | # Families | Median Income |
| No Earners | 701 (16.0%) | $44,934 |
| 1 Earner | 1,268 (28.9%) | $52,625 |
| 2 Earners | 1,996 (45.5%) | $91,217 |
| 3+ Earners | 418 (9.5%) | $123,795 |
| Total | 4,383 (100.0%) | $75,018 |
Household Income in Rush County
Household Income Brackets in Rush County
With 1,290 households falling in the category, the $100,000 to $149,999 income range is the most frequent in Rush County, accounting for 19.2% of all households. In contrast, only 202 households (3.0%) fall into the $150,000 to $199,999 income bracket, making it the least populous group.
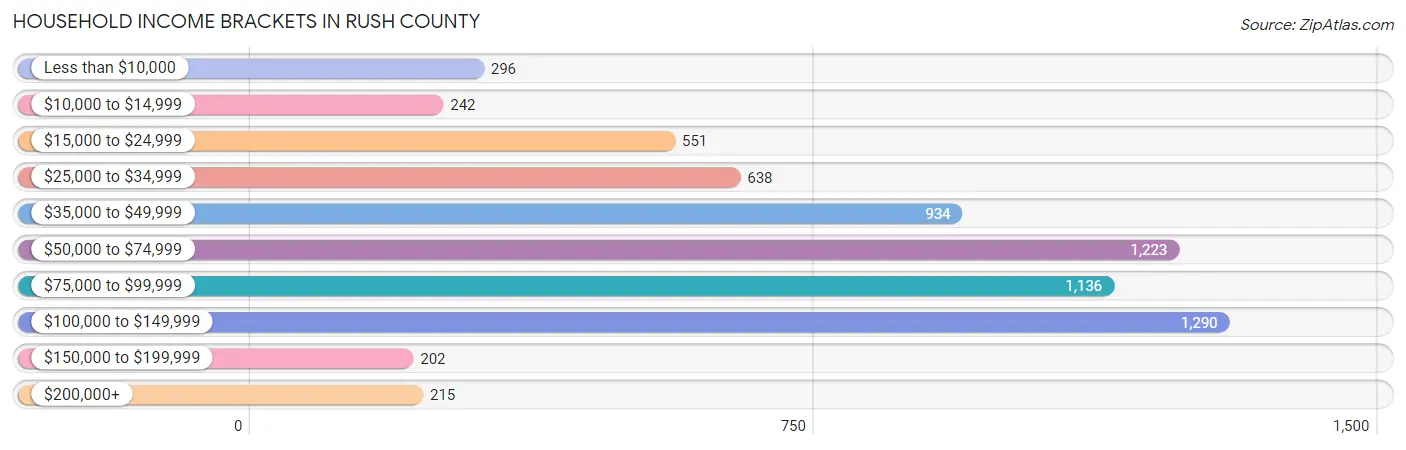
| Income Bracket | # Households | % Households |
| Less than $10,000 | 296 | 4.4% |
| $10,000 to $14,999 | 242 | 3.6% |
| $15,000 to $24,999 | 551 | 8.2% |
| $25,000 to $34,999 | 638 | 9.5% |
| $35,000 to $49,999 | 934 | 13.9% |
| $50,000 to $74,999 | 1,223 | 18.2% |
| $75,000 to $99,999 | 1,136 | 16.9% |
| $100,000 to $149,999 | 1,290 | 19.2% |
| $150,000 to $199,999 | 202 | 3.0% |
| $200,000+ | 215 | 3.2% |
Household Income by Householder Age in Rush County
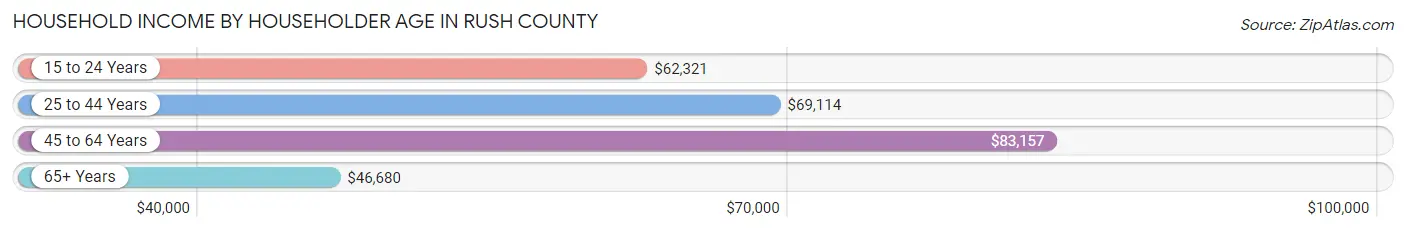
The median household income in Rush County is $62,386, with the highest median household income of $83,157 found in the 45 to 64 years age bracket for the primary householder. A total of 2,822 households (42.0%) fall into this category. Meanwhile, the 65+ years age bracket for the primary householder has the lowest median household income of $46,680, with 1,952 households (29.0%) in this group.
| Income Bracket | # Households | Median Income |
| 15 to 24 Years | 182 (2.7%) | $62,321 |
| 25 to 44 Years | 1,763 (26.2%) | $69,114 |
| 45 to 64 Years | 2,822 (42.0%) | $83,157 |
| 65+ Years | 1,952 (29.0%) | $46,680 |
| Total | 6,719 (100.0%) | $62,386 |
Poverty in Rush County
Income Below Poverty by Sex and Age in Rush County
With 10.4% poverty level for males and 13.0% for females among the residents of Rush County, 16 and 17 year old males and 15 year old females are the most vulnerable to poverty, with 64 males (25.6%) and 82 females (39.2%) in their respective age groups living below the poverty level.
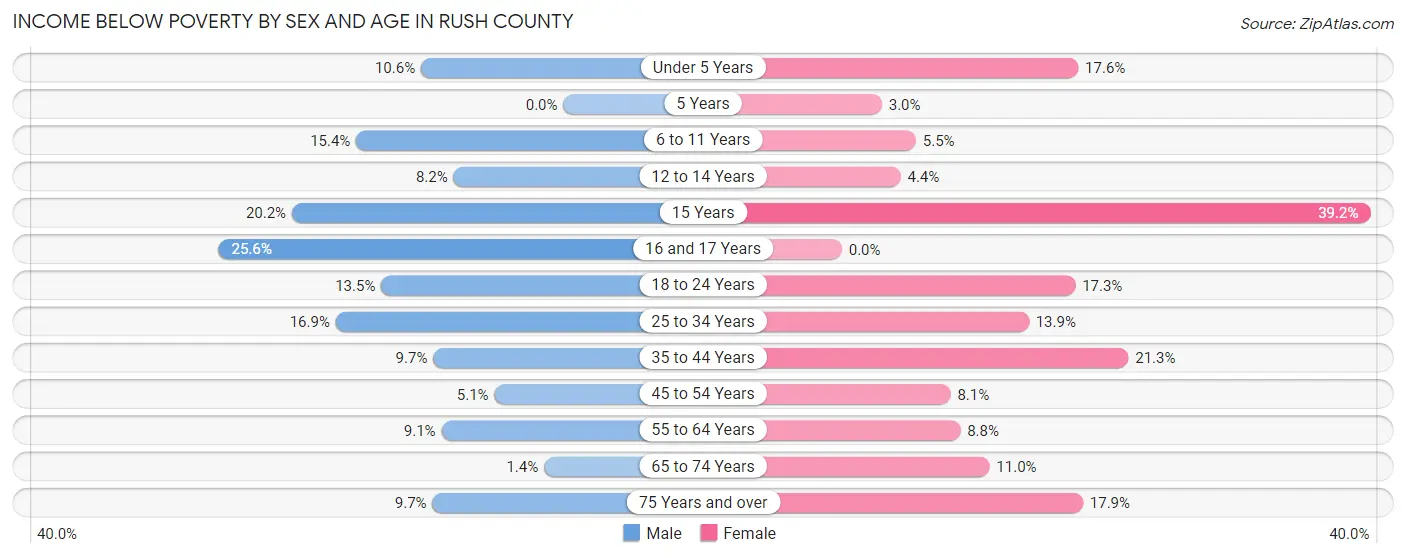
| Age Bracket | Male | Female |
| Under 5 Years | 48 (10.6%) | 73 (17.5%) |
| 5 Years | 0 (0.0%) | 3 (3.0%) |
| 6 to 11 Years | 110 (15.4%) | 27 (5.5%) |
| 12 to 14 Years | 22 (8.2%) | 14 (4.4%) |
| 15 Years | 27 (20.2%) | 82 (39.2%) |
| 16 and 17 Years | 64 (25.6%) | 0 (0.0%) |
| 18 to 24 Years | 98 (13.5%) | 109 (17.3%) |
| 25 to 34 Years | 160 (16.9%) | 128 (13.9%) |
| 35 to 44 Years | 88 (9.7%) | 207 (21.3%) |
| 45 to 54 Years | 56 (5.1%) | 85 (8.1%) |
| 55 to 64 Years | 122 (9.0%) | 110 (8.8%) |
| 65 to 74 Years | 12 (1.4%) | 99 (11.0%) |
| 75 Years and over | 48 (9.7%) | 131 (17.9%) |
| Total | 855 (10.4%) | 1,068 (13.0%) |
Income Above Poverty by Sex and Age in Rush County
According to the poverty statistics in Rush County, males aged 5 years and females aged 16 and 17 years are the age groups that are most secure financially, with 100.0% of males and 100.0% of females in these age groups living above the poverty line.
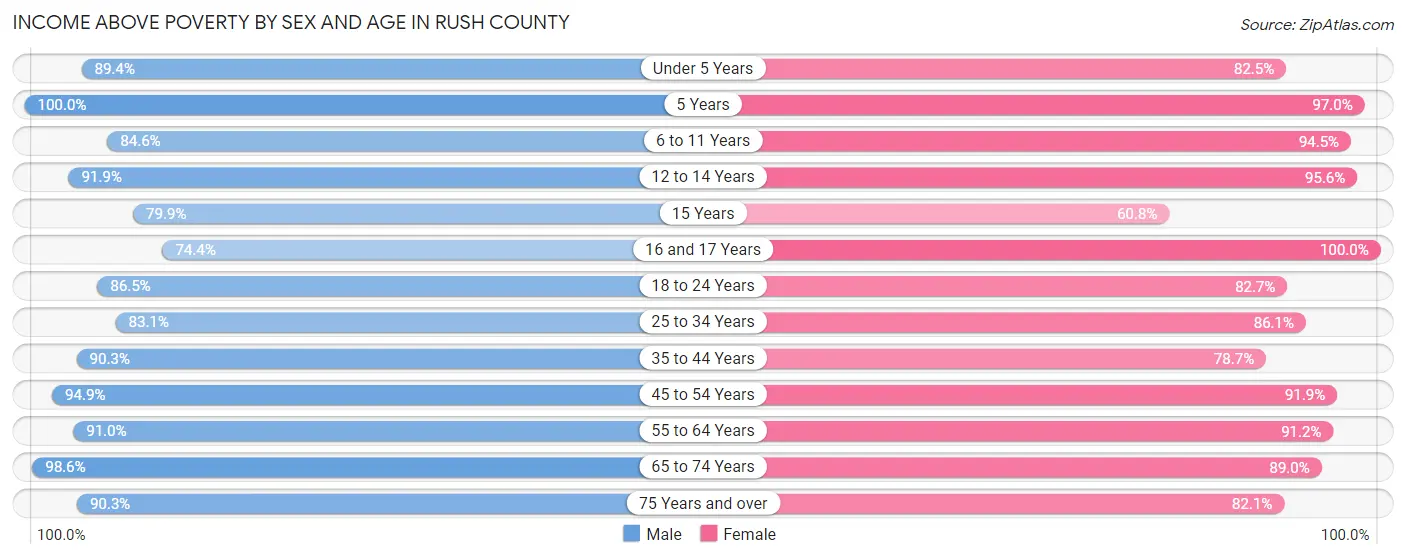
| Age Bracket | Male | Female |
| Under 5 Years | 406 (89.4%) | 343 (82.5%) |
| 5 Years | 48 (100.0%) | 98 (97.0%) |
| 6 to 11 Years | 605 (84.6%) | 464 (94.5%) |
| 12 to 14 Years | 248 (91.8%) | 307 (95.6%) |
| 15 Years | 107 (79.8%) | 127 (60.8%) |
| 16 and 17 Years | 186 (74.4%) | 192 (100.0%) |
| 18 to 24 Years | 627 (86.5%) | 520 (82.7%) |
| 25 to 34 Years | 787 (83.1%) | 794 (86.1%) |
| 35 to 44 Years | 823 (90.3%) | 766 (78.7%) |
| 45 to 54 Years | 1,038 (94.9%) | 968 (91.9%) |
| 55 to 64 Years | 1,226 (90.9%) | 1,141 (91.2%) |
| 65 to 74 Years | 828 (98.6%) | 804 (89.0%) |
| 75 Years and over | 446 (90.3%) | 601 (82.1%) |
| Total | 7,375 (89.6%) | 7,125 (87.0%) |
Income Below Poverty Among Married-Couple Families in Rush County
The poverty statistics for married-couple families in Rush County show that 3.5% or 122 of the total 3,452 families live below the poverty line. Families with 3 or 4 children have the highest poverty rate of 7.7%, comprising of 23 families. On the other hand, families with 5 or more children have the lowest poverty rate of 0.0%, which includes 0 families.
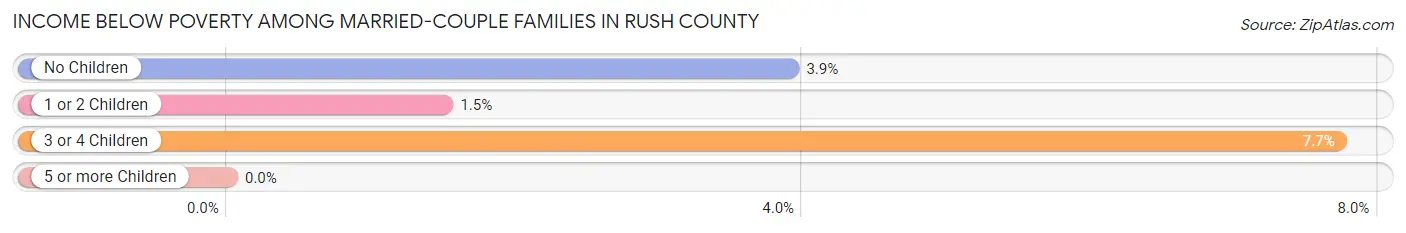
| Children | Above Poverty | Below Poverty |
| No Children | 2,062 (96.1%) | 84 (3.9%) |
| 1 or 2 Children | 982 (98.5%) | 15 (1.5%) |
| 3 or 4 Children | 275 (92.3%) | 23 (7.7%) |
| 5 or more Children | 11 (100.0%) | 0 (0.0%) |
| Total | 3,330 (96.5%) | 122 (3.5%) |
Income Below Poverty Among Single-Parent Households in Rush County
According to the poverty data in Rush County, 12.4% or 40 single-father households and 26.3% or 160 single-mother households are living below the poverty line. Among single-father households, those with 1 or 2 children have the highest poverty rate, with 40 households (32.0%) experiencing poverty. Likewise, among single-mother households, those with 1 or 2 children have the highest poverty rate, with 103 households (28.0%) falling below the poverty line.
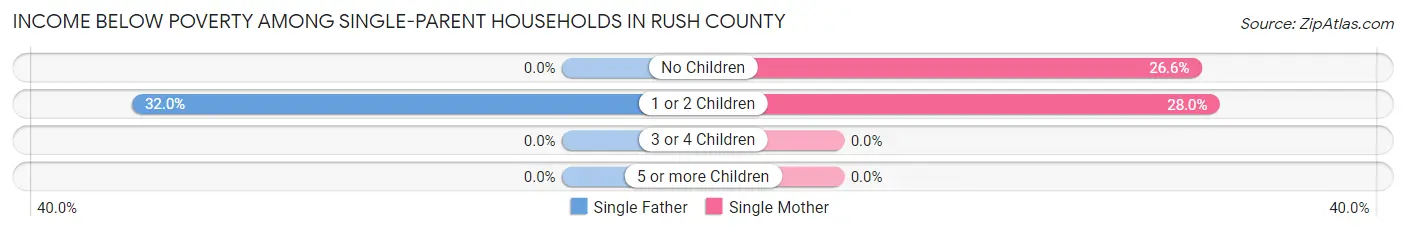
| Children | Single Father | Single Mother |
| No Children | 0 (0.0%) | 57 (26.6%) |
| 1 or 2 Children | 40 (32.0%) | 103 (28.0%) |
| 3 or 4 Children | 0 (0.0%) | 0 (0.0%) |
| 5 or more Children | 0 (0.0%) | 0 (0.0%) |
| Total | 40 (12.4%) | 160 (26.3%) |
Income Below Poverty Among Married-Couple vs Single-Parent Households in Rush County
The poverty data for Rush County shows that 122 of the married-couple family households (3.5%) and 200 of the single-parent households (21.5%) are living below the poverty level. Within the married-couple family households, those with 3 or 4 children have the highest poverty rate, with 23 households (7.7%) falling below the poverty line. Among the single-parent households, those with 1 or 2 children have the highest poverty rate, with 143 household (29.0%) living below poverty.
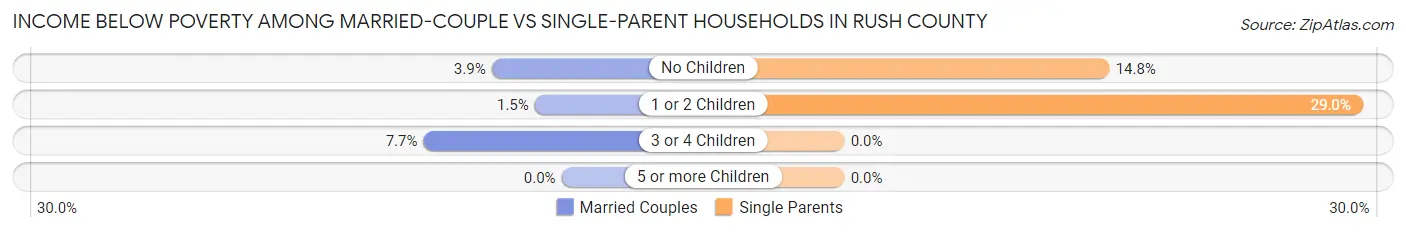
| Children | Married-Couple Families | Single-Parent Households |
| No Children | 84 (3.9%) | 57 (14.8%) |
| 1 or 2 Children | 15 (1.5%) | 143 (29.0%) |
| 3 or 4 Children | 23 (7.7%) | 0 (0.0%) |
| 5 or more Children | 0 (0.0%) | 0 (0.0%) |
| Total | 122 (3.5%) | 200 (21.5%) |
Race in Rush County
The most populous races in Rush County are White / Caucasian (16,151 | 96.6%), Two or more Races (406 | 2.4%), and Hispanic or Latino (303 | 1.8%).
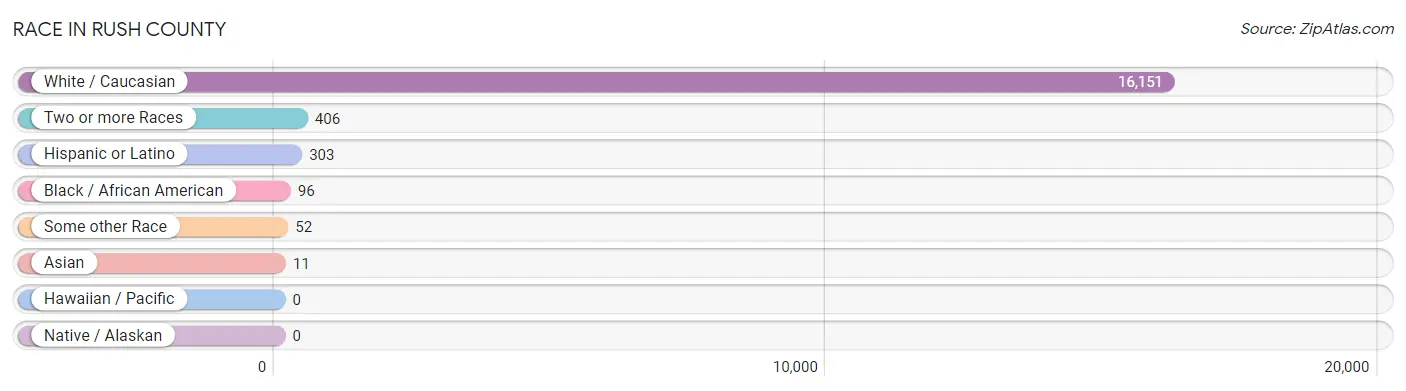
| Race | # Population | % Population |
| Asian | 11 | 0.1% |
| Black / African American | 96 | 0.6% |
| Hawaiian / Pacific | 0 | 0.0% |
| Hispanic or Latino | 303 | 1.8% |
| Native / Alaskan | 0 | 0.0% |
| White / Caucasian | 16,151 | 96.6% |
| Two or more Races | 406 | 2.4% |
| Some other Race | 52 | 0.3% |
| Total | 16,716 | 100.0% |
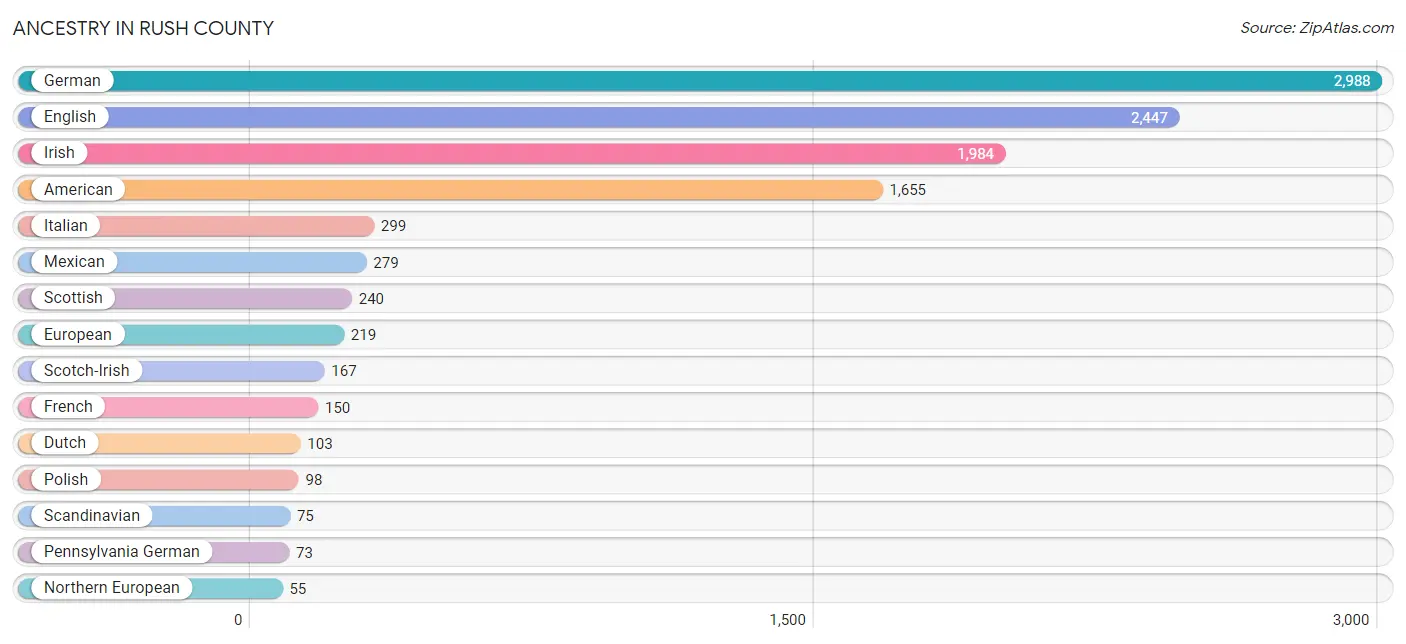
Ancestry in Rush County
The most populous ancestries reported in Rush County are German (2,988 | 17.9%), English (2,447 | 14.6%), Irish (1,984 | 11.9%), American (1,655 | 9.9%), and Italian (299 | 1.8%), together accounting for 56.1% of all Rush County residents.
| Ancestry | # Population | % Population |
| American | 1,655 | 9.9% |
| Belgian | 13 | 0.1% |
| British | 47 | 0.3% |
| Canadian | 9 | 0.1% |
| Central American | 2 | 0.0% |
| Cherokee | 49 | 0.3% |
| Czech | 7 | 0.0% |
| Dutch | 103 | 0.6% |
| Eastern European | 29 | 0.2% |
| English | 2,447 | 14.6% |
| European | 219 | 1.3% |
| French | 150 | 0.9% |
| French Canadian | 10 | 0.1% |
| German | 2,988 | 17.9% |
| Greek | 4 | 0.0% |
| Guatemalan | 2 | 0.0% |
| Irish | 1,984 | 11.9% |
| Italian | 299 | 1.8% |
| Jamaican | 8 | 0.1% |
| Korean | 41 | 0.3% |
| Mexican | 279 | 1.7% |
| Northern European | 55 | 0.3% |
| Norwegian | 18 | 0.1% |
| Pennsylvania German | 73 | 0.4% |
| Polish | 98 | 0.6% |
| Romanian | 20 | 0.1% |
| Scandinavian | 75 | 0.4% |
| Scotch-Irish | 167 | 1.0% |
| Scottish | 240 | 1.4% |
| Swedish | 43 | 0.3% |
| Swiss | 19 | 0.1% |
| Welsh | 31 | 0.2% | View All 32 Rows |
Immigrants in Rush County
The most numerous immigrant groups reported in Rush County came from Central America (69 | 0.4%), Latin America (69 | 0.4%), Mexico (69 | 0.4%), Europe (45 | 0.3%), and Germany (37 | 0.2%), together accounting for 1.7% of all Rush County residents.
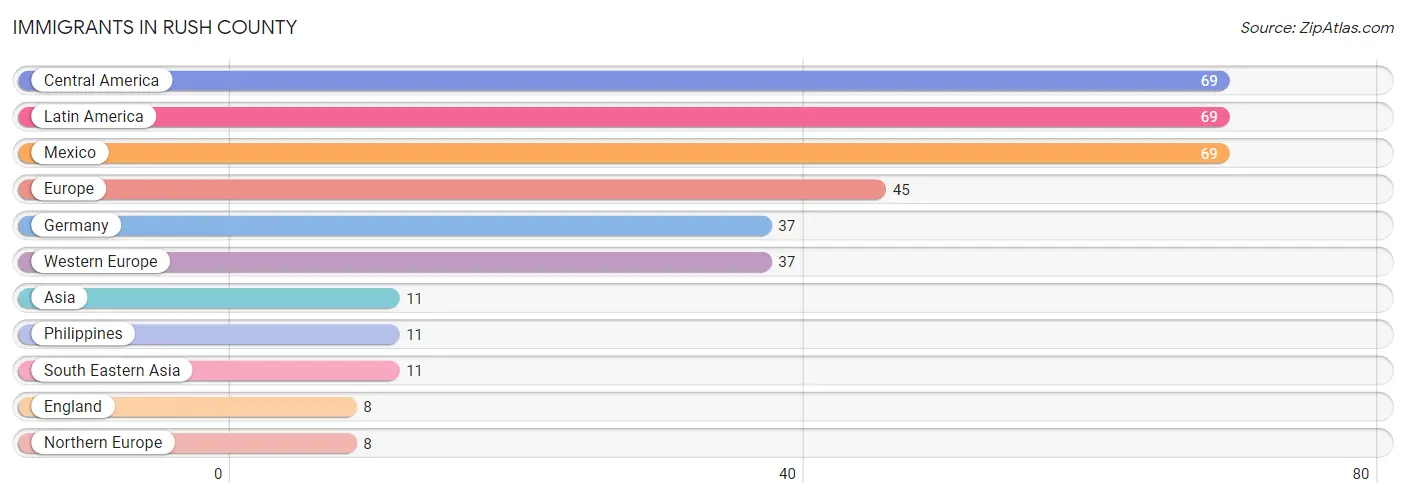
| Immigration Origin | # Population | % Population |
| Asia | 11 | 0.1% |
| Central America | 69 | 0.4% |
| England | 8 | 0.1% |
| Europe | 45 | 0.3% |
| Germany | 37 | 0.2% |
| Latin America | 69 | 0.4% |
| Mexico | 69 | 0.4% |
| Northern Europe | 8 | 0.1% |
| Philippines | 11 | 0.1% |
| South Eastern Asia | 11 | 0.1% |
| Western Europe | 37 | 0.2% | View All 11 Rows |
Sex and Age in Rush County
Sex and Age in Rush County
The most populous age groups in Rush County are 60 to 64 Years (723 | 8.6%) for men and 55 to 59 Years (721 | 8.6%) for women.
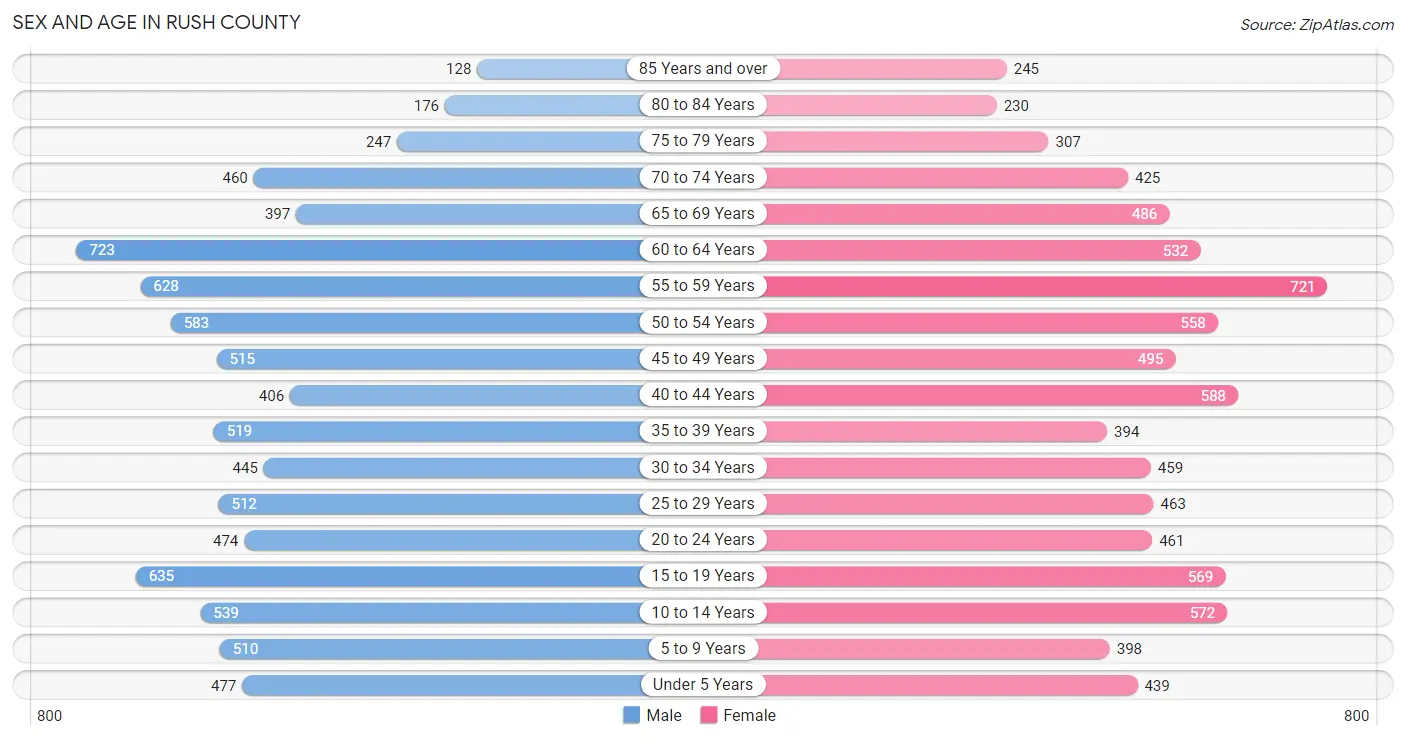
| Age Bracket | Male | Female |
| Under 5 Years | 477 (5.7%) | 439 (5.3%) |
| 5 to 9 Years | 510 (6.1%) | 398 (4.8%) |
| 10 to 14 Years | 539 (6.4%) | 572 (6.9%) |
| 15 to 19 Years | 635 (7.6%) | 569 (6.8%) |
| 20 to 24 Years | 474 (5.7%) | 461 (5.5%) |
| 25 to 29 Years | 512 (6.1%) | 463 (5.6%) |
| 30 to 34 Years | 445 (5.3%) | 459 (5.5%) |
| 35 to 39 Years | 519 (6.2%) | 394 (4.7%) |
| 40 to 44 Years | 406 (4.9%) | 588 (7.0%) |
| 45 to 49 Years | 515 (6.1%) | 495 (5.9%) |
| 50 to 54 Years | 583 (7.0%) | 558 (6.7%) |
| 55 to 59 Years | 628 (7.5%) | 721 (8.6%) |
| 60 to 64 Years | 723 (8.6%) | 532 (6.4%) |
| 65 to 69 Years | 397 (4.7%) | 486 (5.8%) |
| 70 to 74 Years | 460 (5.5%) | 425 (5.1%) |
| 75 to 79 Years | 247 (2.9%) | 307 (3.7%) |
| 80 to 84 Years | 176 (2.1%) | 230 (2.8%) |
| 85 Years and over | 128 (1.5%) | 245 (2.9%) |
| Total | 8,374 (100.0%) | 8,342 (100.0%) |
Families and Households in Rush County
Median Family Size in Rush County
The median family size in Rush County is 2.95 persons per family, with married-couple families (3,452 | 78.8%) accounting for the largest median family size of 2.98 persons per family. On the other hand, single male/father families (322 | 7.3%) represent the smallest median family size with 2.79 persons per family.
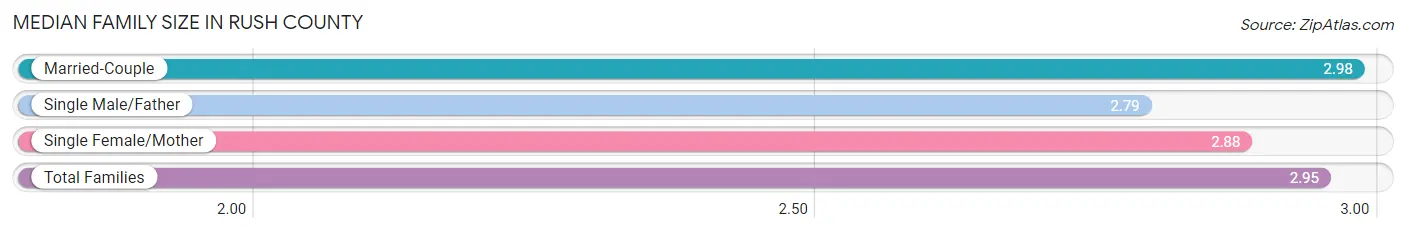
| Family Type | # Families | Family Size |
| Married-Couple | 3,452 (78.8%) | 2.98 |
| Single Male/Father | 322 (7.3%) | 2.79 |
| Single Female/Mother | 609 (13.9%) | 2.88 |
| Total Families | 4,383 (100.0%) | 2.95 |
Median Household Size in Rush County
The median household size in Rush County is 2.46 persons per household, with single male/father households (322 | 4.8%) accounting for the largest median household size of 3.42 persons per household. non-family households (2,336 | 34.8%) represent the smallest median household size with 1.35 persons per household.
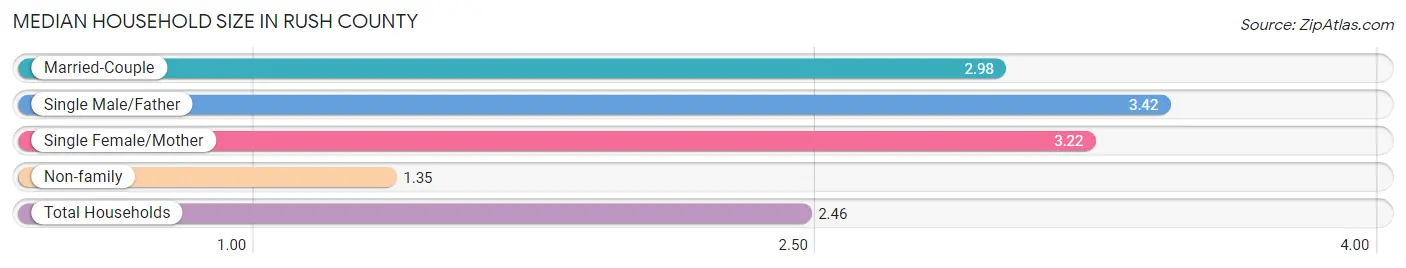
| Household Type | # Households | Household Size |
| Married-Couple | 3,452 (51.4%) | 2.98 |
| Single Male/Father | 322 (4.8%) | 3.42 |
| Single Female/Mother | 609 (9.1%) | 3.22 |
| Non-family | 2,336 (34.8%) | 1.35 |
| Total Households | 6,719 (100.0%) | 2.46 |
Household Size by Marriage Status in Rush County
Out of a total of 6,719 households in Rush County, 4,383 (65.2%) are family households, while 2,336 (34.8%) are nonfamily households. The most numerous type of family households are 2-person households, comprising 2,101, and the most common type of nonfamily households are 1-person households, comprising 1,815.
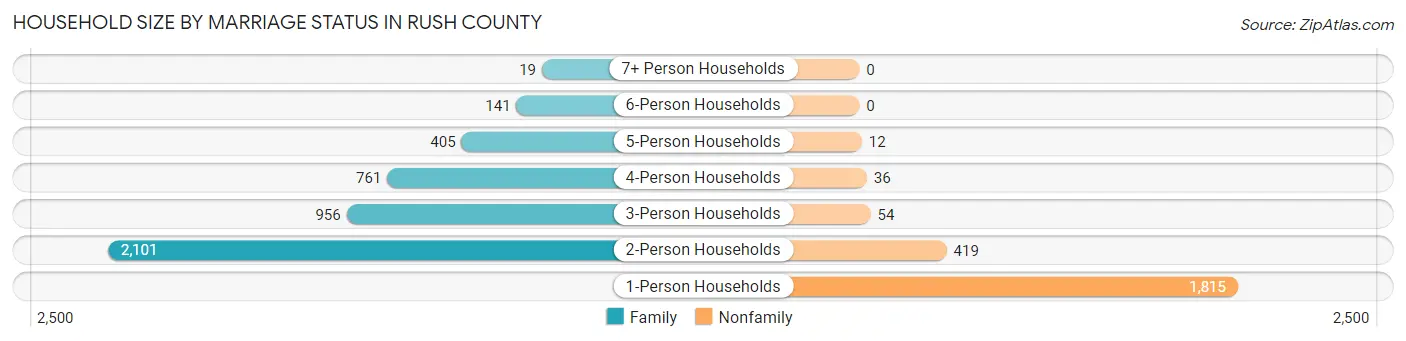
| Household Size | Family Households | Nonfamily Households |
| 1-Person Households | - | 1,815 (27.0%) |
| 2-Person Households | 2,101 (31.3%) | 419 (6.2%) |
| 3-Person Households | 956 (14.2%) | 54 (0.8%) |
| 4-Person Households | 761 (11.3%) | 36 (0.5%) |
| 5-Person Households | 405 (6.0%) | 12 (0.2%) |
| 6-Person Households | 141 (2.1%) | 0 (0.0%) |
| 7+ Person Households | 19 (0.3%) | 0 (0.0%) |
| Total | 4,383 (65.2%) | 2,336 (34.8%) |
Female Fertility in Rush County
Fertility by Age in Rush County
Average fertility rate in Rush County is 62.0 births per 1,000 women. Women in the age bracket of 20 to 34 years have the highest fertility rate with 132.0 births per 1,000 women. Women in the age bracket of 20 to 34 years acount for 82.1% of all women with births.
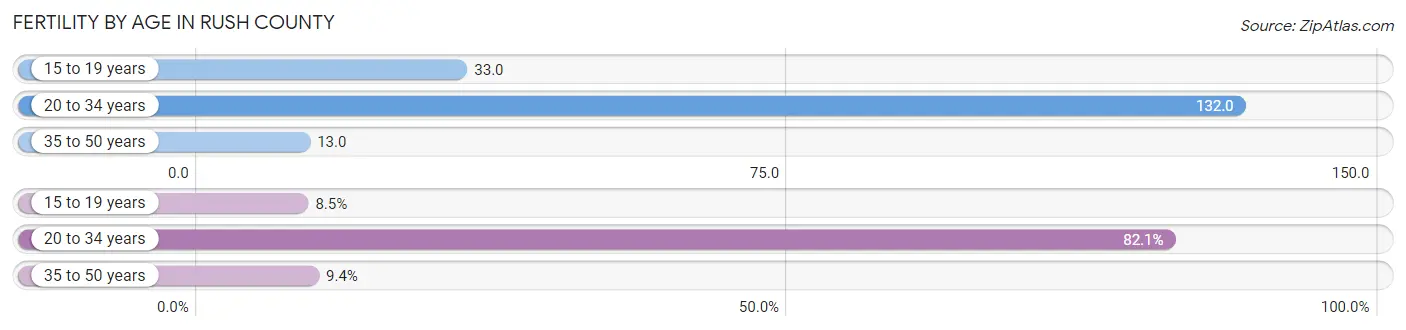
| Age Bracket | Women with Births | Births / 1,000 Women |
| 15 to 19 years | 19 (8.5%) | 33.0 |
| 20 to 34 years | 183 (82.1%) | 132.0 |
| 35 to 50 years | 21 (9.4%) | 13.0 |
| Total | 223 (100.0%) | 62.0 |
Fertility by Age by Marriage Status in Rush County
87.0% of women with births (223) in Rush County are married. The highest percentage of unmarried women with births falls into 15 to 19 years age bracket with 100.0% of them unmarried at the time of birth, while the lowest percentage of unmarried women with births belong to 35 to 50 years age bracket with 0.0% of them unmarried.
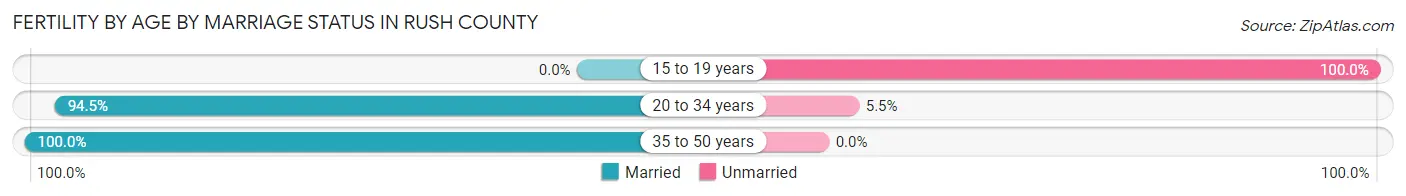
| Age Bracket | Married | Unmarried |
| 15 to 19 years | 0 (0.0%) | 19 (100.0%) |
| 20 to 34 years | 173 (94.5%) | 10 (5.5%) |
| 35 to 50 years | 21 (100.0%) | 0 (0.0%) |
| Total | 194 (87.0%) | 29 (13.0%) |
Fertility by Education in Rush County
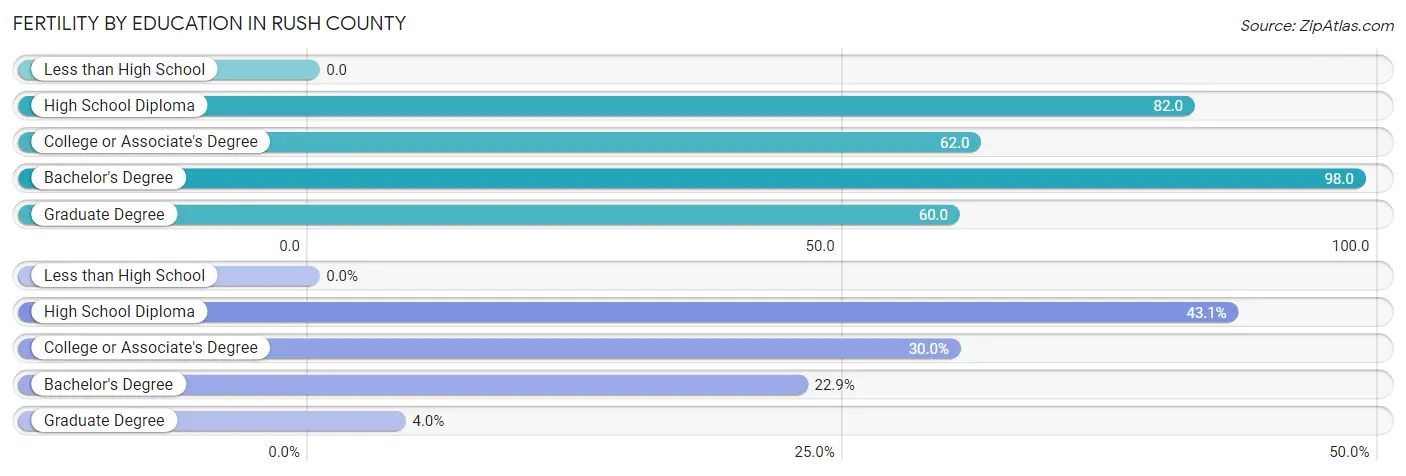
| Educational Attainment | Women with Births | Births / 1,000 Women |
| Less than High School | 0 (0.0%) | 0.0 |
| High School Diploma | 96 (43.0%) | 82.0 |
| College or Associate's Degree | 67 (30.0%) | 62.0 |
| Bachelor's Degree | 51 (22.9%) | 98.0 |
| Graduate Degree | 9 (4.0%) | 60.0 |
| Total | 223 (100.0%) | 62.0 |
Fertility by Education by Marriage Status in Rush County
13.0% of women with births in Rush County are unmarried. Women with the educational attainment of college or associate's degree are most likely to be married with 100.0% of them married at childbirth, while women with the educational attainment of high school diploma are least likely to be married with 30.2% of them unmarried at childbirth.
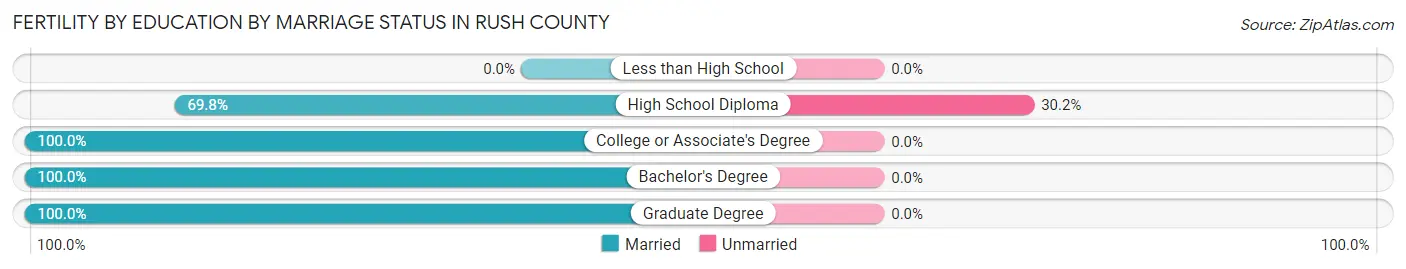
| Educational Attainment | Married | Unmarried |
| Less than High School | 0 (0.0%) | 0 (0.0%) |
| High School Diploma | 67 (69.8%) | 29 (30.2%) |
| College or Associate's Degree | 67 (100.0%) | 0 (0.0%) |
| Bachelor's Degree | 51 (100.0%) | 0 (0.0%) |
| Graduate Degree | 9 (100.0%) | 0 (0.0%) |
| Total | 194 (87.0%) | 29 (13.0%) |
Employment Characteristics in Rush County
Employment by Class of Employer in Rush County
Among the 7,343 employed individuals in Rush County, private company employees (5,395 | 73.5%), self-employed (not incorporated) (568 | 7.7%), and not-for-profit organizations (516 | 7.0%) make up the most common classes of employment.
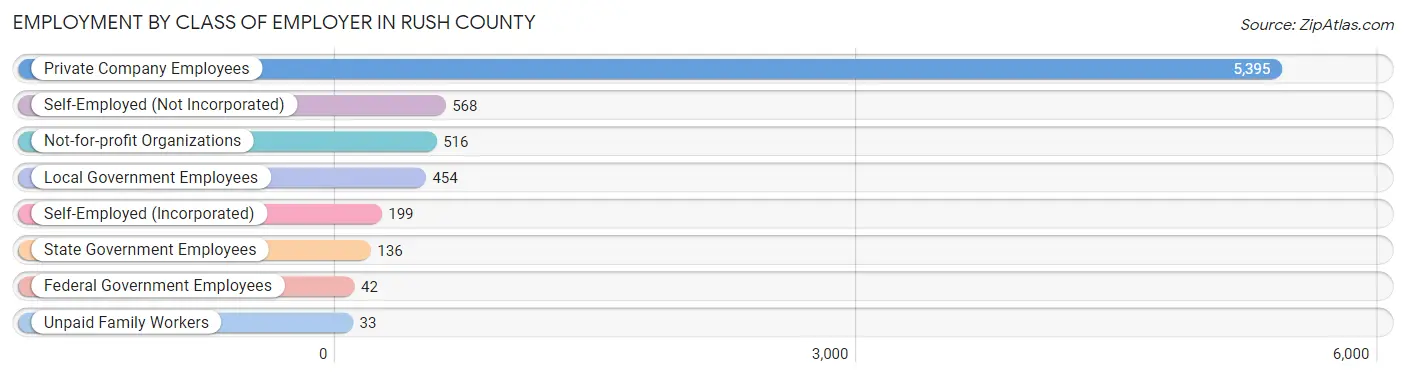
| Employer Class | # Employees | % Employees |
| Private Company Employees | 5,395 | 73.5% |
| Self-Employed (Incorporated) | 199 | 2.7% |
| Self-Employed (Not Incorporated) | 568 | 7.7% |
| Not-for-profit Organizations | 516 | 7.0% |
| Local Government Employees | 454 | 6.2% |
| State Government Employees | 136 | 1.8% |
| Federal Government Employees | 42 | 0.6% |
| Unpaid Family Workers | 33 | 0.4% |
| Total | 7,343 | 100.0% |
Employment Status by Age in Rush County
According to the labor force statistics for Rush County, out of the total population over 16 years of age (13,438), 60.3% or 8,103 individuals are in the labor force, with 6.3% or 510 of them unemployed. The age group with the highest labor force participation rate is 45 to 54 years, with 85.4% or 1,837 individuals in the labor force. Within the labor force, the 16 to 19 years age range has the highest percentage of unemployed individuals, with 15.9% or 55 of them being unemployed.
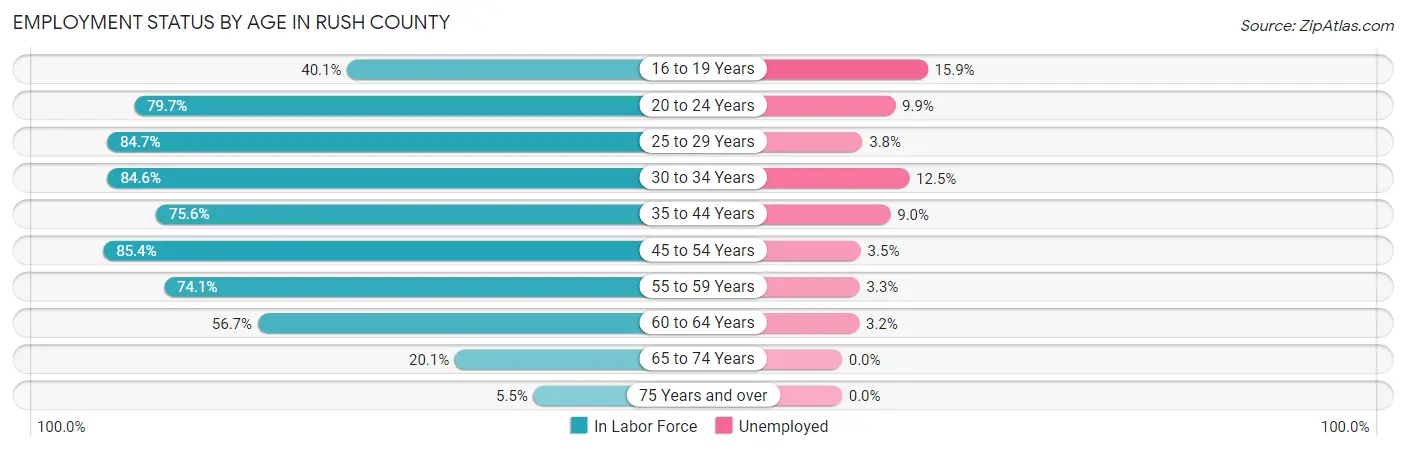
| Age Bracket | In Labor Force | Unemployed |
| 16 to 19 Years | 345 (40.1%) | 55 (15.9%) |
| 20 to 24 Years | 745 (79.7%) | 74 (9.9%) |
| 25 to 29 Years | 826 (84.7%) | 31 (3.8%) |
| 30 to 34 Years | 765 (84.6%) | 96 (12.5%) |
| 35 to 44 Years | 1,442 (75.6%) | 130 (9.0%) |
| 45 to 54 Years | 1,837 (85.4%) | 64 (3.5%) |
| 55 to 59 Years | 1,000 (74.1%) | 33 (3.3%) |
| 60 to 64 Years | 712 (56.7%) | 23 (3.2%) |
| 65 to 74 Years | 355 (20.1%) | 0 (0.0%) |
| 75 Years and over | 73 (5.5%) | 0 (0.0%) |
| Total | 8,103 (60.3%) | 510 (6.3%) |
Employment Status by Educational Attainment in Rush County
According to labor force statistics for Rush County, 77.1% of individuals (6,585) out of the total population between 25 and 64 years of age (8,541) are in the labor force, with 5.7% or 375 of them being unemployed. The group with the highest labor force participation rate are those with the educational attainment of bachelor's degree or higher, with 90.6% or 1,278 individuals in the labor force. Within the labor force, individuals with less than high school education have the highest percentage of unemployment, with 9.3% or 43 of them being unemployed.
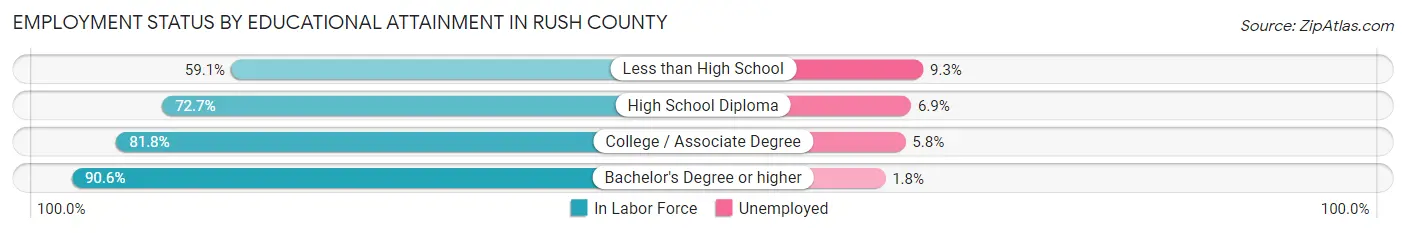
| Educational Attainment | In Labor Force | Unemployed |
| Less than High School | 464 (59.1%) | 73 (9.3%) |
| High School Diploma | 2,800 (72.7%) | 266 (6.9%) |
| College / Associate Degree | 2,040 (81.8%) | 145 (5.8%) |
| Bachelor's Degree or higher | 1,278 (90.6%) | 25 (1.8%) |
| Total | 6,585 (77.1%) | 487 (5.7%) |
Employment Occupations by Sex in Rush County
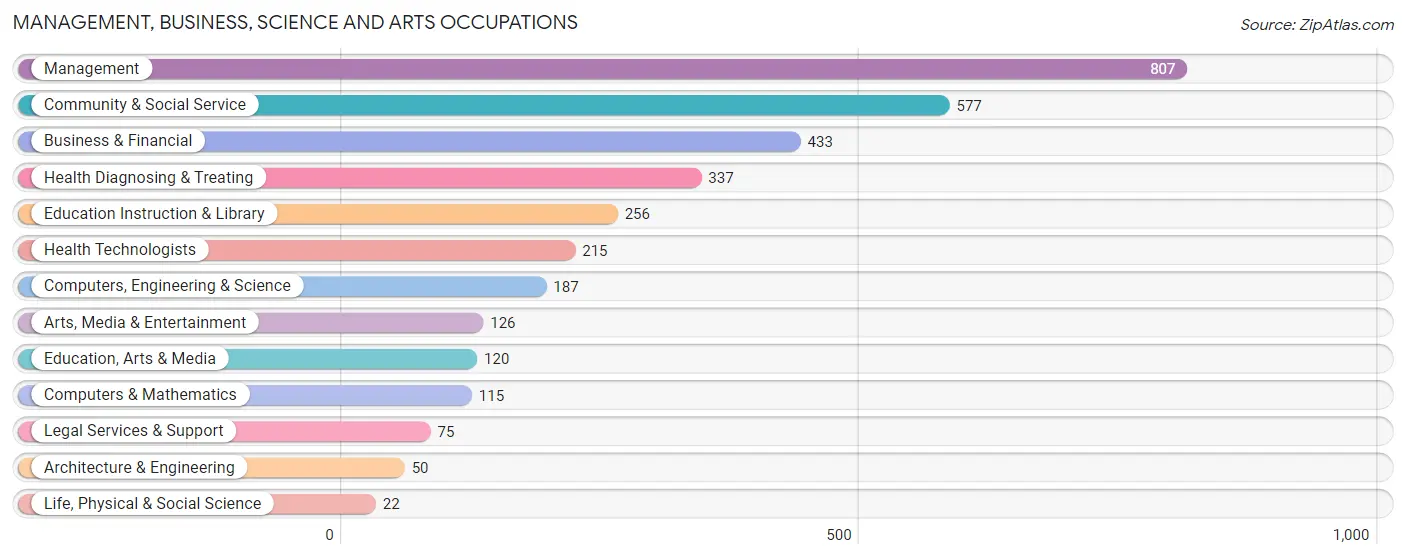
Management, Business, Science and Arts Occupations
The most common Management, Business, Science and Arts occupations in Rush County are Management (807 | 10.6%), Community & Social Service (577 | 7.6%), Business & Financial (433 | 5.7%), Health Diagnosing & Treating (337 | 4.4%), and Education Instruction & Library (256 | 3.4%).
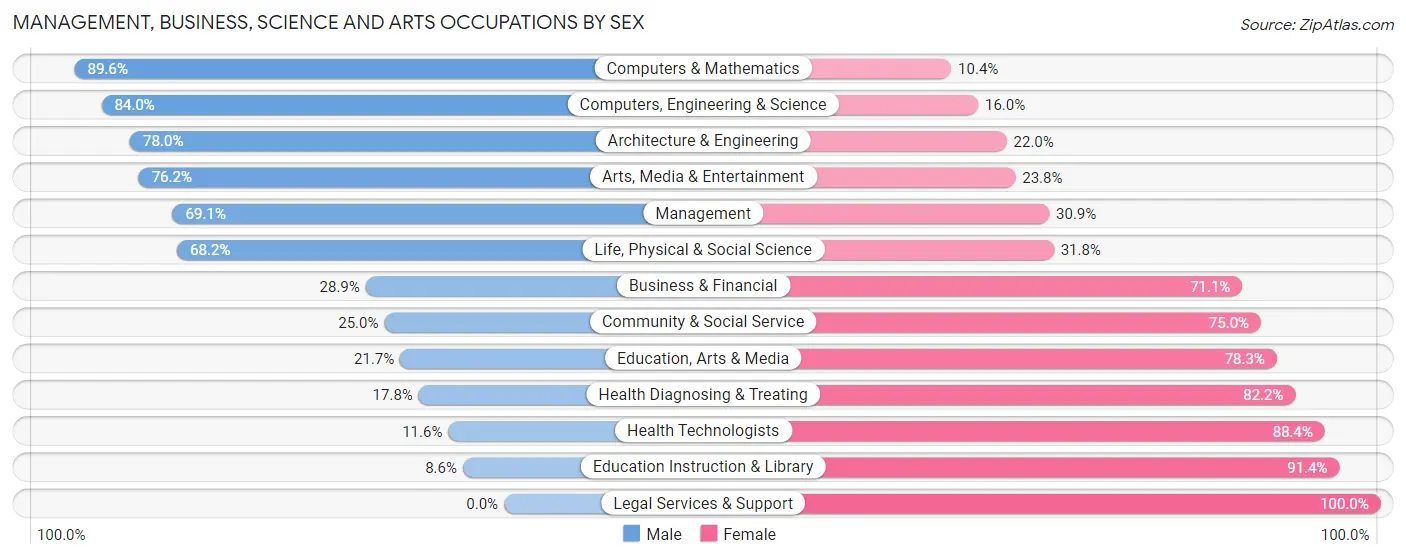
Management, Business, Science and Arts Occupations by Sex
Within the Management, Business, Science and Arts occupations in Rush County, the most male-oriented occupations are Computers & Mathematics (89.6%), Computers, Engineering & Science (84.0%), and Architecture & Engineering (78.0%), while the most female-oriented occupations are Legal Services & Support (100.0%), Education Instruction & Library (91.4%), and Health Technologists (88.4%).
| Occupation | Male | Female |
| Management | 558 (69.1%) | 249 (30.9%) |
| Business & Financial | 125 (28.9%) | 308 (71.1%) |
| Computers, Engineering & Science | 157 (84.0%) | 30 (16.0%) |
| Computers & Mathematics | 103 (89.6%) | 12 (10.4%) |
| Architecture & Engineering | 39 (78.0%) | 11 (22.0%) |
| Life, Physical & Social Science | 15 (68.2%) | 7 (31.8%) |
| Community & Social Service | 144 (25.0%) | 433 (75.0%) |
| Education, Arts & Media | 26 (21.7%) | 94 (78.3%) |
| Legal Services & Support | 0 (0.0%) | 75 (100.0%) |
| Education Instruction & Library | 22 (8.6%) | 234 (91.4%) |
| Arts, Media & Entertainment | 96 (76.2%) | 30 (23.8%) |
| Health Diagnosing & Treating | 60 (17.8%) | 277 (82.2%) |
| Health Technologists | 25 (11.6%) | 190 (88.4%) |
| Total (Category) | 1,044 (44.6%) | 1,297 (55.4%) |
| Total (Overall) | 3,962 (52.2%) | 3,631 (47.8%) |
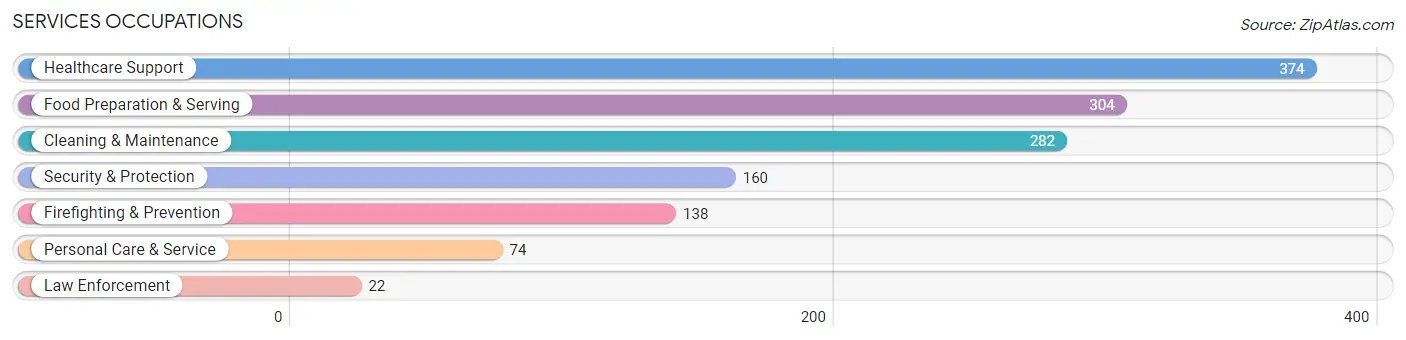
Services Occupations
The most common Services occupations in Rush County are Healthcare Support (374 | 4.9%), Food Preparation & Serving (304 | 4.0%), Cleaning & Maintenance (282 | 3.7%), Security & Protection (160 | 2.1%), and Firefighting & Prevention (138 | 1.8%).
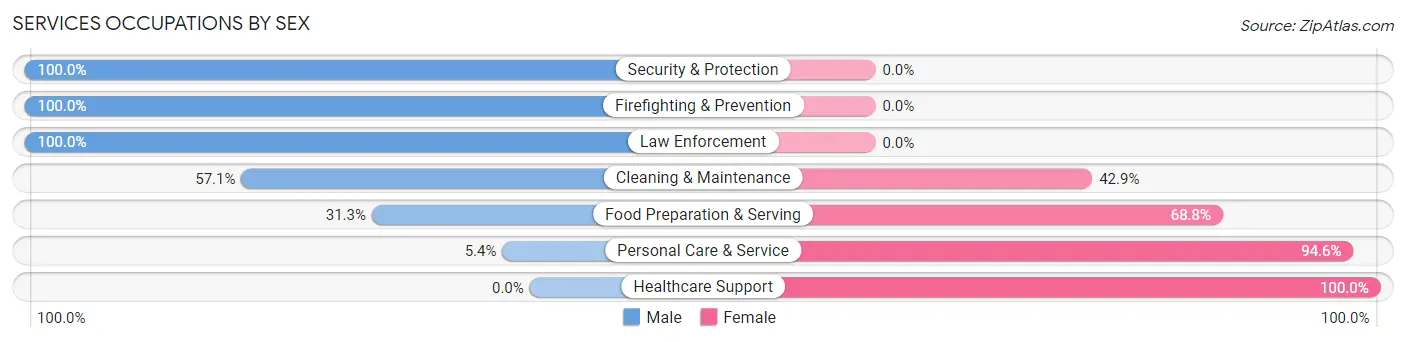
Services Occupations by Sex
Within the Services occupations in Rush County, the most male-oriented occupations are Security & Protection (100.0%), Firefighting & Prevention (100.0%), and Law Enforcement (100.0%), while the most female-oriented occupations are Healthcare Support (100.0%), Personal Care & Service (94.6%), and Food Preparation & Serving (68.8%).
| Occupation | Male | Female |
| Healthcare Support | 0 (0.0%) | 374 (100.0%) |
| Security & Protection | 160 (100.0%) | 0 (0.0%) |
| Firefighting & Prevention | 138 (100.0%) | 0 (0.0%) |
| Law Enforcement | 22 (100.0%) | 0 (0.0%) |
| Food Preparation & Serving | 95 (31.2%) | 209 (68.8%) |
| Cleaning & Maintenance | 161 (57.1%) | 121 (42.9%) |
| Personal Care & Service | 4 (5.4%) | 70 (94.6%) |
| Total (Category) | 420 (35.2%) | 774 (64.8%) |
| Total (Overall) | 3,962 (52.2%) | 3,631 (47.8%) |
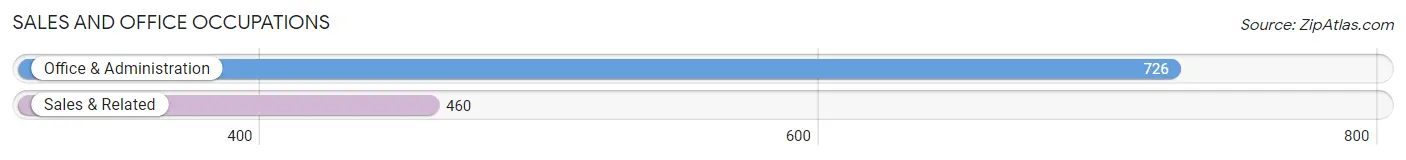
Sales and Office Occupations
The most common Sales and Office occupations in Rush County are Office & Administration (726 | 9.6%), and Sales & Related (460 | 6.1%).
Sales and Office Occupations by Sex
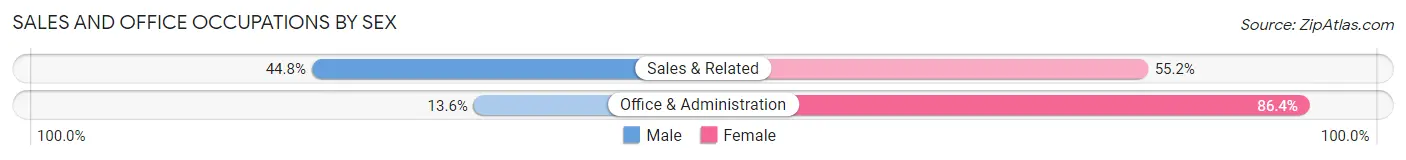
| Occupation | Male | Female |
| Sales & Related | 206 (44.8%) | 254 (55.2%) |
| Office & Administration | 99 (13.6%) | 627 (86.4%) |
| Total (Category) | 305 (25.7%) | 881 (74.3%) |
| Total (Overall) | 3,962 (52.2%) | 3,631 (47.8%) |
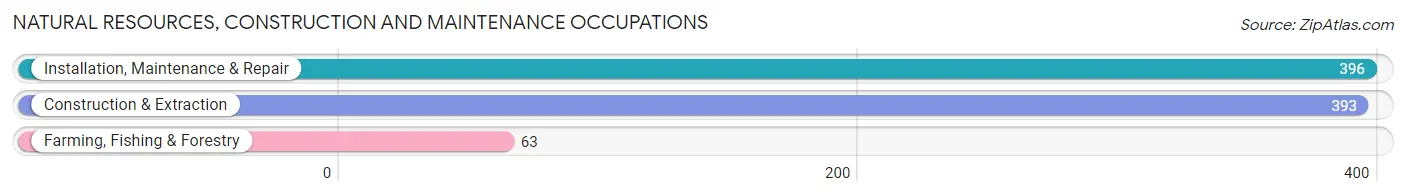
Natural Resources, Construction and Maintenance Occupations
The most common Natural Resources, Construction and Maintenance occupations in Rush County are Installation, Maintenance & Repair (396 | 5.2%), Construction & Extraction (393 | 5.2%), and Farming, Fishing & Forestry (63 | 0.8%).
Natural Resources, Construction and Maintenance Occupations by Sex
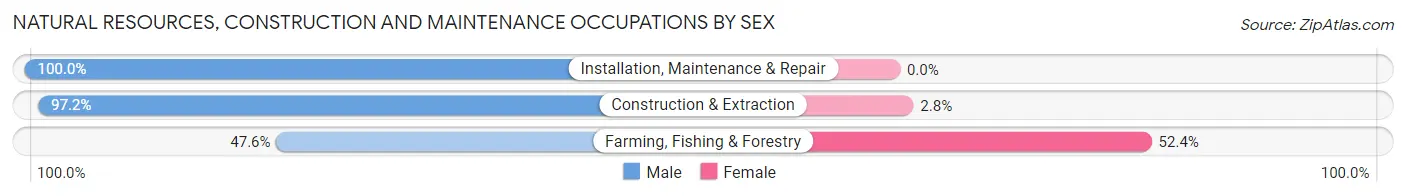
| Occupation | Male | Female |
| Farming, Fishing & Forestry | 30 (47.6%) | 33 (52.4%) |
| Construction & Extraction | 382 (97.2%) | 11 (2.8%) |
| Installation, Maintenance & Repair | 396 (100.0%) | 0 (0.0%) |
| Total (Category) | 808 (94.8%) | 44 (5.2%) |
| Total (Overall) | 3,962 (52.2%) | 3,631 (47.8%) |
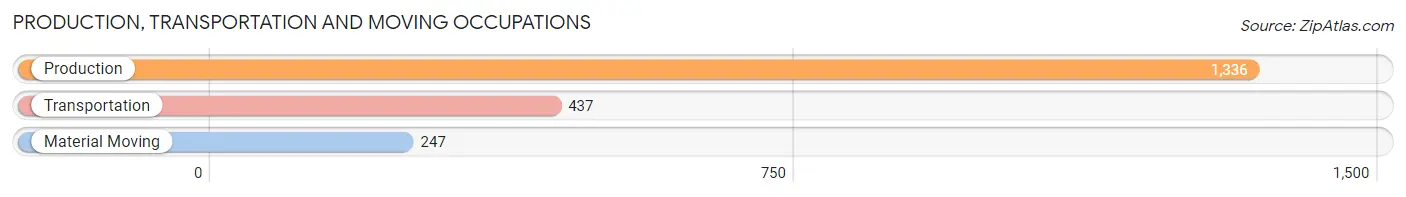
Production, Transportation and Moving Occupations
The most common Production, Transportation and Moving occupations in Rush County are Production (1,336 | 17.6%), Transportation (437 | 5.8%), and Material Moving (247 | 3.3%).
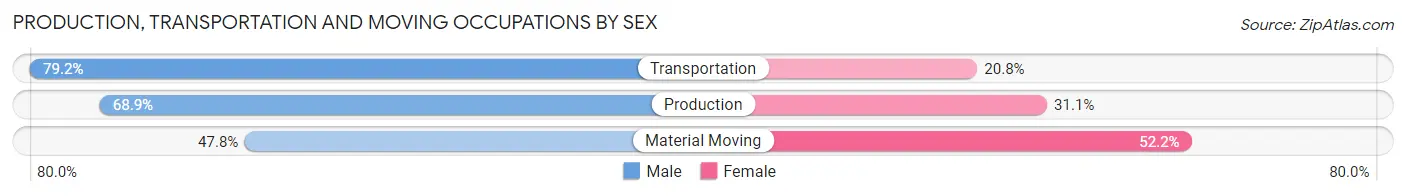
Production, Transportation and Moving Occupations by Sex
| Occupation | Male | Female |
| Production | 921 (68.9%) | 415 (31.1%) |
| Transportation | 346 (79.2%) | 91 (20.8%) |
| Material Moving | 118 (47.8%) | 129 (52.2%) |
| Total (Category) | 1,385 (68.6%) | 635 (31.4%) |
| Total (Overall) | 3,962 (52.2%) | 3,631 (47.8%) |
Employment Industries by Sex in Rush County
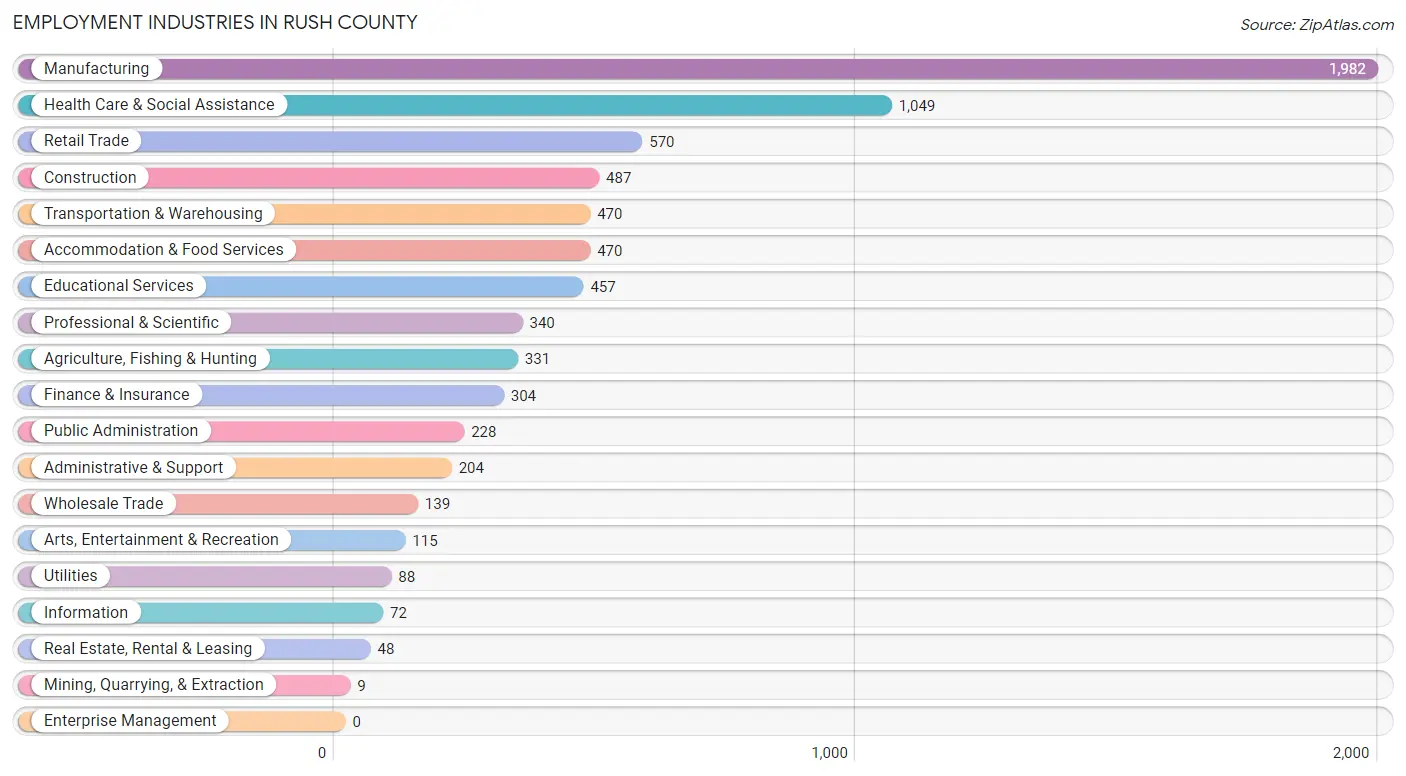
Employment Industries in Rush County
The major employment industries in Rush County include Manufacturing (1,982 | 26.1%), Health Care & Social Assistance (1,049 | 13.8%), Retail Trade (570 | 7.5%), Construction (487 | 6.4%), and Transportation & Warehousing (470 | 6.2%).
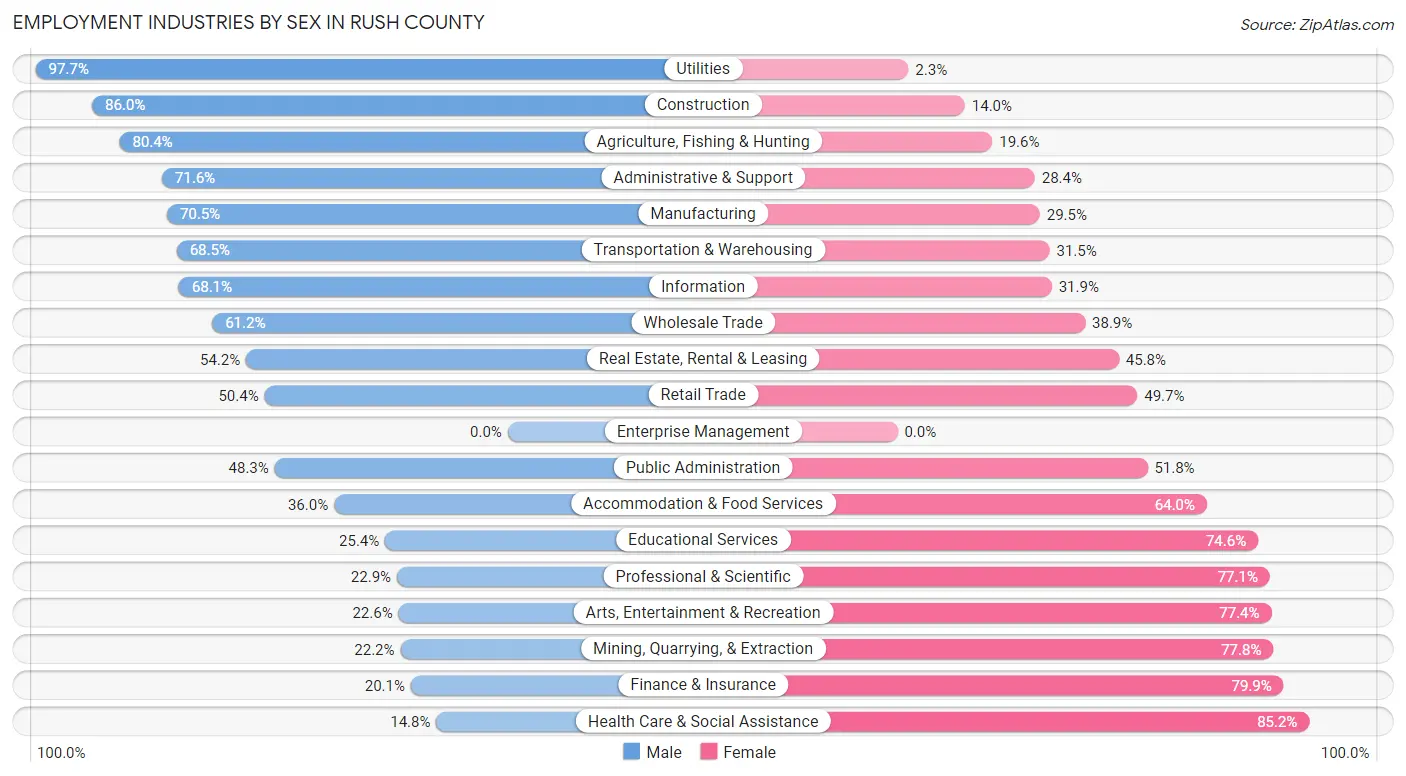
Employment Industries by Sex in Rush County
The Rush County industries that see more men than women are Utilities (97.7%), Construction (86.0%), and Agriculture, Fishing & Hunting (80.4%), whereas the industries that tend to have a higher number of women are Health Care & Social Assistance (85.2%), Finance & Insurance (79.9%), and Mining, Quarrying, & Extraction (77.8%).
| Industry | Male | Female |
| Agriculture, Fishing & Hunting | 266 (80.4%) | 65 (19.6%) |
| Mining, Quarrying, & Extraction | 2 (22.2%) | 7 (77.8%) |
| Construction | 419 (86.0%) | 68 (14.0%) |
| Manufacturing | 1,398 (70.5%) | 584 (29.5%) |
| Wholesale Trade | 85 (61.2%) | 54 (38.9%) |
| Retail Trade | 287 (50.3%) | 283 (49.6%) |
| Transportation & Warehousing | 322 (68.5%) | 148 (31.5%) |
| Utilities | 86 (97.7%) | 2 (2.3%) |
| Information | 49 (68.1%) | 23 (31.9%) |
| Finance & Insurance | 61 (20.1%) | 243 (79.9%) |
| Real Estate, Rental & Leasing | 26 (54.2%) | 22 (45.8%) |
| Professional & Scientific | 78 (22.9%) | 262 (77.1%) |
| Enterprise Management | 0 (0.0%) | 0 (0.0%) |
| Administrative & Support | 146 (71.6%) | 58 (28.4%) |
| Educational Services | 116 (25.4%) | 341 (74.6%) |
| Health Care & Social Assistance | 155 (14.8%) | 894 (85.2%) |
| Arts, Entertainment & Recreation | 26 (22.6%) | 89 (77.4%) |
| Accommodation & Food Services | 169 (36.0%) | 301 (64.0%) |
| Public Administration | 110 (48.2%) | 118 (51.7%) |
| Total | 3,962 (52.2%) | 3,631 (47.8%) |
Education in Rush County
School Enrollment in Rush County
The most common levels of schooling among the 3,512 students in Rush County are high school (995 | 28.3%), middle school (939 | 26.7%), and elementary school (716 | 20.4%).
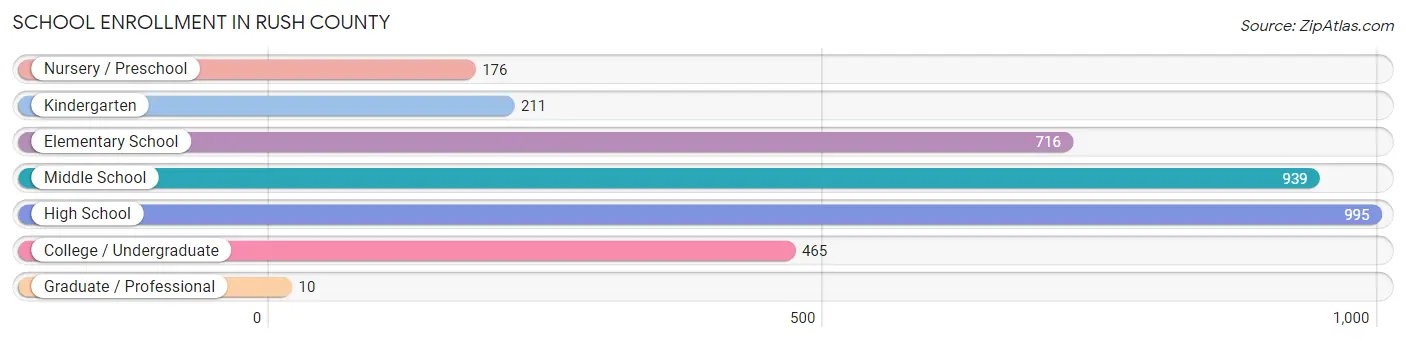
| School Level | # Students | % Students |
| Nursery / Preschool | 176 | 5.0% |
| Kindergarten | 211 | 6.0% |
| Elementary School | 716 | 20.4% |
| Middle School | 939 | 26.7% |
| High School | 995 | 28.3% |
| College / Undergraduate | 465 | 13.2% |
| Graduate / Professional | 10 | 0.3% |
| Total | 3,512 | 100.0% |
School Enrollment by Age by Funding Source in Rush County
Out of a total of 3,512 students who are enrolled in schools in Rush County, 421 (12.0%) attend a private institution, while the remaining 3,091 (88.0%) are enrolled in public schools. The age group of 3 to 4 year olds has the highest likelihood of being enrolled in private schools, with 67 (49.3% in the age bracket) enrolled. Conversely, the age group of 35 years and over has the lowest likelihood of being enrolled in a private school, with 161 (100.0% in the age bracket) attending a public institution.
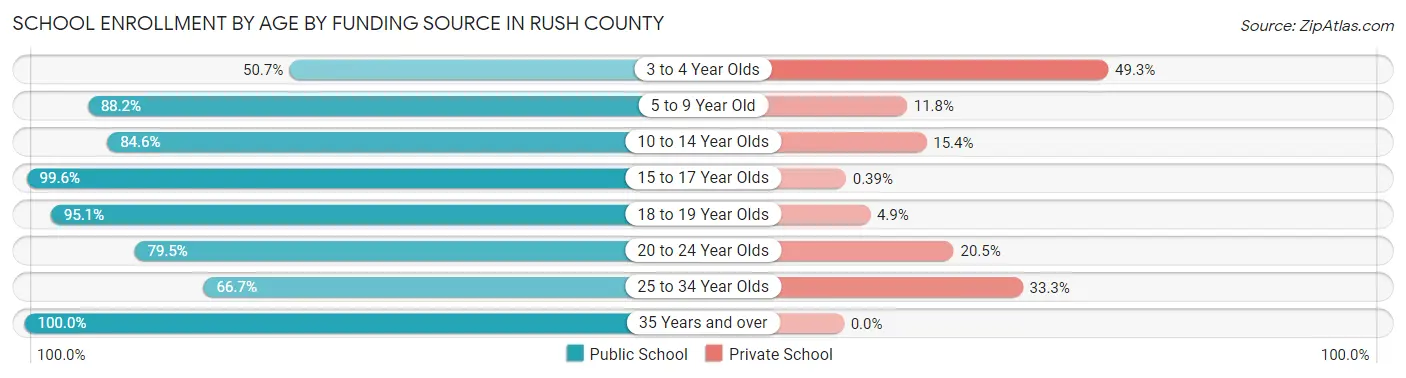
| Age Bracket | Public School | Private School |
| 3 to 4 Year Olds | 69 (50.7%) | 67 (49.3%) |
| 5 to 9 Year Old | 765 (88.2%) | 102 (11.8%) |
| 10 to 14 Year Olds | 940 (84.6%) | 171 (15.4%) |
| 15 to 17 Year Olds | 763 (99.6%) | 3 (0.4%) |
| 18 to 19 Year Olds | 194 (95.1%) | 10 (4.9%) |
| 20 to 24 Year Olds | 136 (79.5%) | 35 (20.5%) |
| 25 to 34 Year Olds | 64 (66.7%) | 32 (33.3%) |
| 35 Years and over | 161 (100.0%) | 0 (0.0%) |
| Total | 3,091 (88.0%) | 421 (12.0%) |
Educational Attainment by Field of Study in Rush County
Education (452 | 23.1%), business (435 | 22.2%), science & technology (183 | 9.3%), bio, nature & agricultural (175 | 8.9%), and psychology (146 | 7.5%) are the most common fields of study among 1,958 individuals in Rush County who have obtained a bachelor's degree or higher.
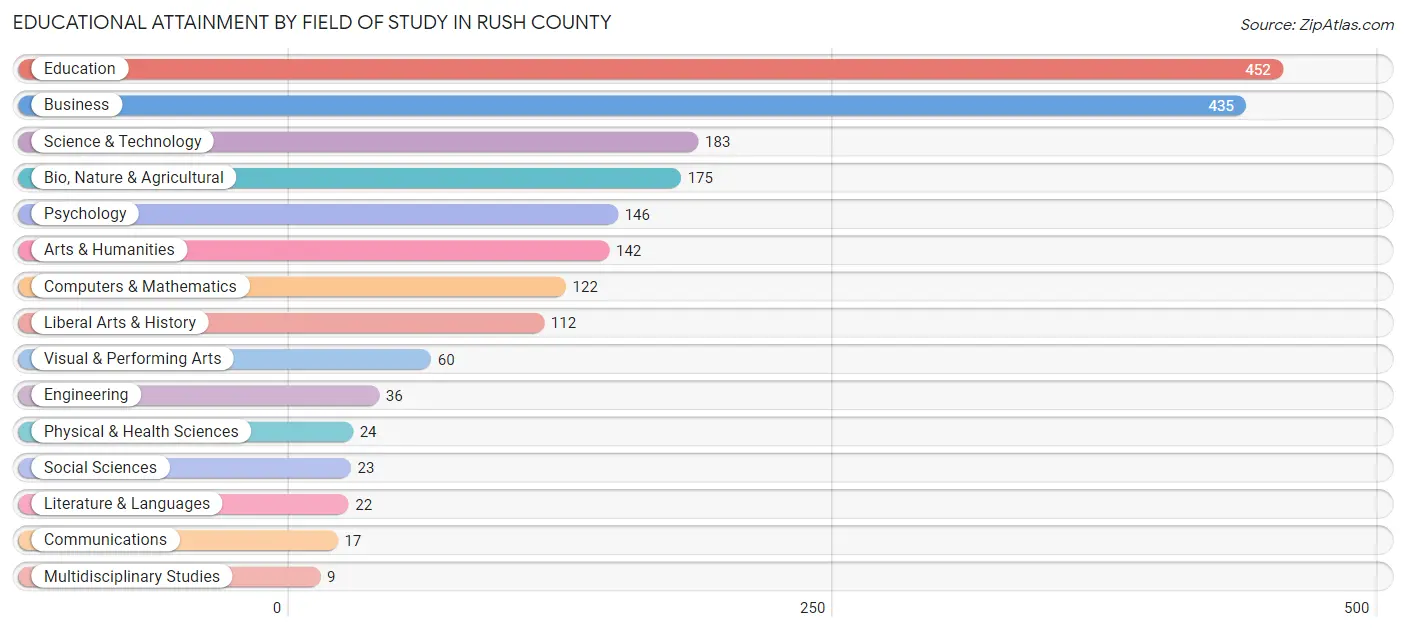
| Field of Study | # Graduates | % Graduates |
| Computers & Mathematics | 122 | 6.2% |
| Bio, Nature & Agricultural | 175 | 8.9% |
| Physical & Health Sciences | 24 | 1.2% |
| Psychology | 146 | 7.5% |
| Social Sciences | 23 | 1.2% |
| Engineering | 36 | 1.8% |
| Multidisciplinary Studies | 9 | 0.5% |
| Science & Technology | 183 | 9.3% |
| Business | 435 | 22.2% |
| Education | 452 | 23.1% |
| Literature & Languages | 22 | 1.1% |
| Liberal Arts & History | 112 | 5.7% |
| Visual & Performing Arts | 60 | 3.1% |
| Communications | 17 | 0.9% |
| Arts & Humanities | 142 | 7.2% |
| Total | 1,958 | 100.0% |
Transportation & Commute in Rush County
Vehicle Availability by Sex in Rush County
The most prevalent vehicle ownership categories in Rush County are males with 2 vehicles (1,457, accounting for 38.0%) and females with 2 vehicles (1,427, making up 41.6%).
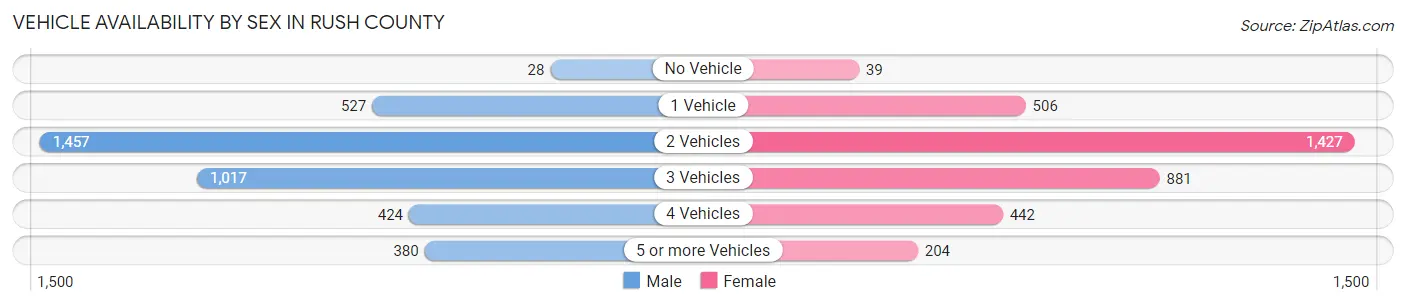
| Vehicles Available | Male | Female |
| No Vehicle | 28 (0.7%) | 39 (1.1%) |
| 1 Vehicle | 527 (13.8%) | 506 (14.5%) |
| 2 Vehicles | 1,457 (38.0%) | 1,427 (40.8%) |
| 3 Vehicles | 1,017 (26.5%) | 881 (25.2%) |
| 4 Vehicles | 424 (11.1%) | 442 (12.6%) |
| 5 or more Vehicles | 380 (9.9%) | 204 (5.8%) |
| Total | 3,833 (100.0%) | 3,499 (100.0%) |
Commute Time in Rush County
The most frequently occuring commute durations in Rush County are 15 to 19 minutes (1,037 commuters, 14.9%), 20 to 24 minutes (921 commuters, 13.3%), and 5 to 9 minutes (843 commuters, 12.1%).
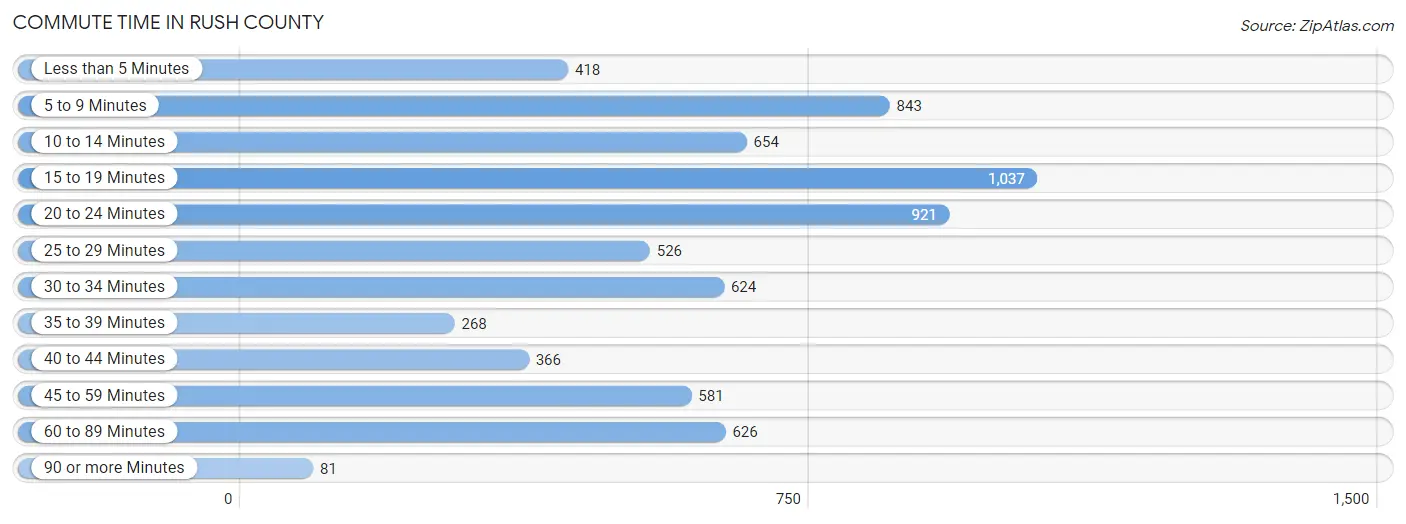
| Commute Time | # Commuters | % Commuters |
| Less than 5 Minutes | 418 | 6.0% |
| 5 to 9 Minutes | 843 | 12.1% |
| 10 to 14 Minutes | 654 | 9.4% |
| 15 to 19 Minutes | 1,037 | 14.9% |
| 20 to 24 Minutes | 921 | 13.3% |
| 25 to 29 Minutes | 526 | 7.6% |
| 30 to 34 Minutes | 624 | 9.0% |
| 35 to 39 Minutes | 268 | 3.9% |
| 40 to 44 Minutes | 366 | 5.3% |
| 45 to 59 Minutes | 581 | 8.4% |
| 60 to 89 Minutes | 626 | 9.0% |
| 90 or more Minutes | 81 | 1.2% |
Commute Time by Sex in Rush County
The most common commute times in Rush County are 15 to 19 minutes (531 commuters, 14.4%) for males and 5 to 9 minutes (560 commuters, 17.2%) for females.
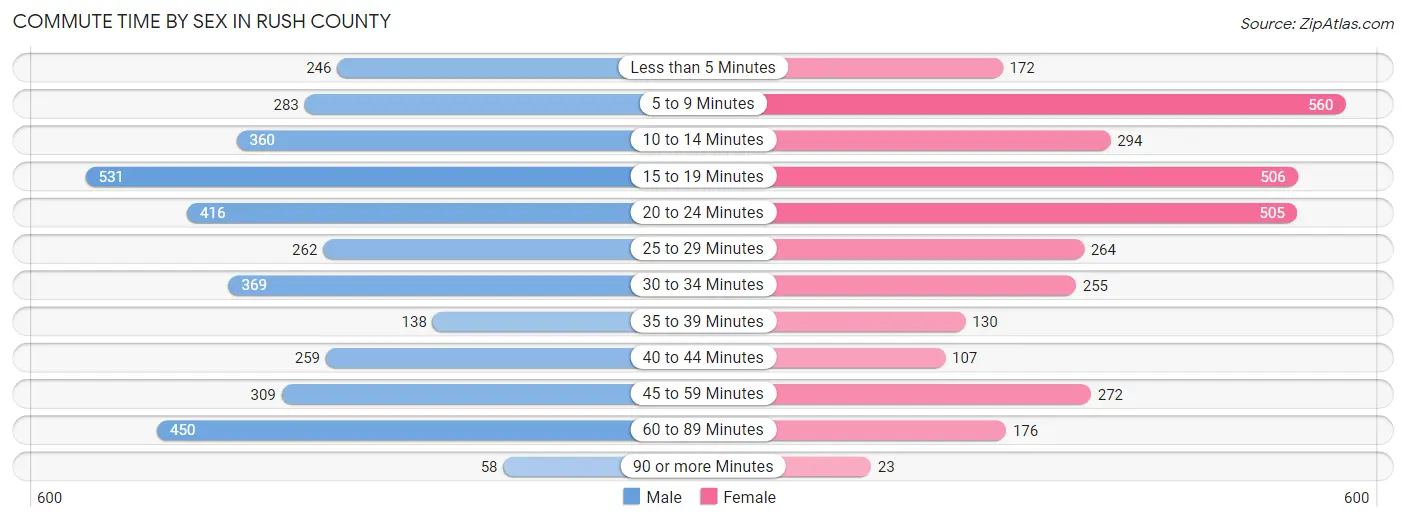
| Commute Time | Male | Female |
| Less than 5 Minutes | 246 (6.7%) | 172 (5.3%) |
| 5 to 9 Minutes | 283 (7.7%) | 560 (17.2%) |
| 10 to 14 Minutes | 360 (9.8%) | 294 (9.0%) |
| 15 to 19 Minutes | 531 (14.4%) | 506 (15.5%) |
| 20 to 24 Minutes | 416 (11.3%) | 505 (15.5%) |
| 25 to 29 Minutes | 262 (7.1%) | 264 (8.1%) |
| 30 to 34 Minutes | 369 (10.0%) | 255 (7.8%) |
| 35 to 39 Minutes | 138 (3.7%) | 130 (4.0%) |
| 40 to 44 Minutes | 259 (7.0%) | 107 (3.3%) |
| 45 to 59 Minutes | 309 (8.4%) | 272 (8.3%) |
| 60 to 89 Minutes | 450 (12.2%) | 176 (5.4%) |
| 90 or more Minutes | 58 (1.6%) | 23 (0.7%) |
Time of Departure to Work by Sex in Rush County
The most frequent times of departure to work in Rush County are 6:00 AM to 6:29 AM (501, 13.6%) for males and 7:00 AM to 7:29 AM (580, 17.8%) for females.
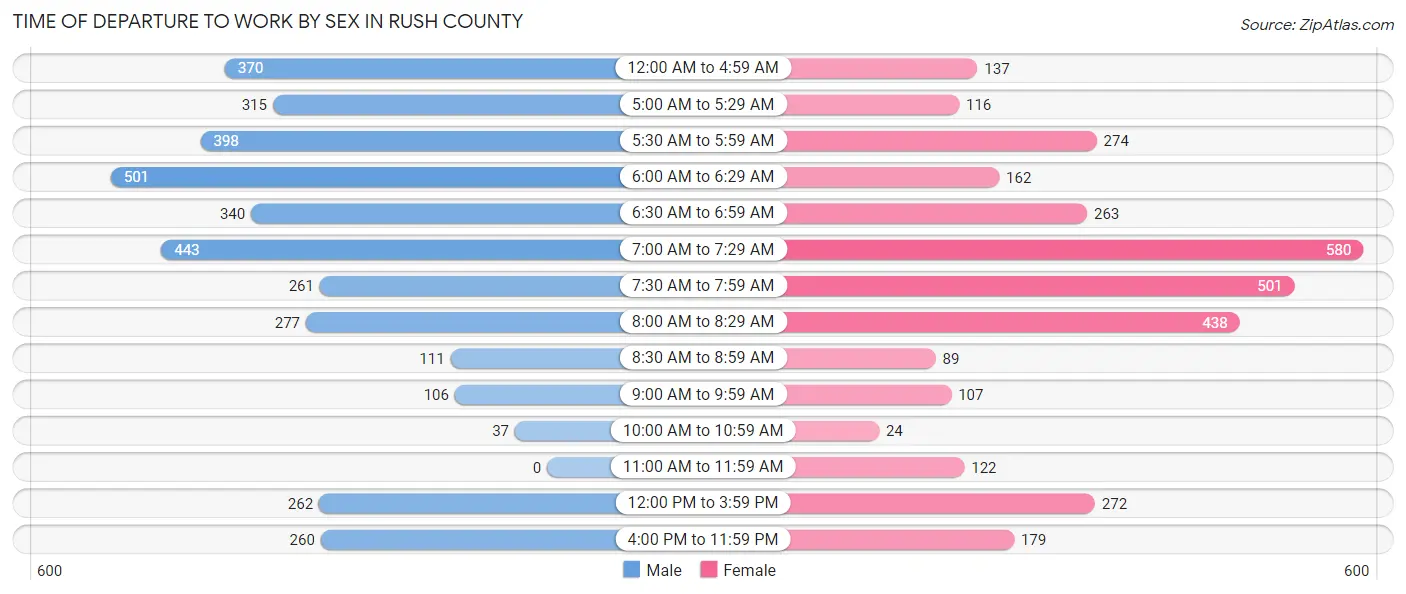
| Time of Departure | Male | Female |
| 12:00 AM to 4:59 AM | 370 (10.1%) | 137 (4.2%) |
| 5:00 AM to 5:29 AM | 315 (8.6%) | 116 (3.5%) |
| 5:30 AM to 5:59 AM | 398 (10.8%) | 274 (8.4%) |
| 6:00 AM to 6:29 AM | 501 (13.6%) | 162 (5.0%) |
| 6:30 AM to 6:59 AM | 340 (9.2%) | 263 (8.1%) |
| 7:00 AM to 7:29 AM | 443 (12.0%) | 580 (17.8%) |
| 7:30 AM to 7:59 AM | 261 (7.1%) | 501 (15.3%) |
| 8:00 AM to 8:29 AM | 277 (7.5%) | 438 (13.4%) |
| 8:30 AM to 8:59 AM | 111 (3.0%) | 89 (2.7%) |
| 9:00 AM to 9:59 AM | 106 (2.9%) | 107 (3.3%) |
| 10:00 AM to 10:59 AM | 37 (1.0%) | 24 (0.7%) |
| 11:00 AM to 11:59 AM | 0 (0.0%) | 122 (3.7%) |
| 12:00 PM to 3:59 PM | 262 (7.1%) | 272 (8.3%) |
| 4:00 PM to 11:59 PM | 260 (7.1%) | 179 (5.5%) |
| Total | 3,681 (100.0%) | 3,264 (100.0%) |
Housing Occupancy in Rush County
Occupancy by Ownership in Rush County
Of the total 6,719 dwellings in Rush County, owner-occupied units account for 4,783 (71.2%), while renter-occupied units make up 1,936 (28.8%).
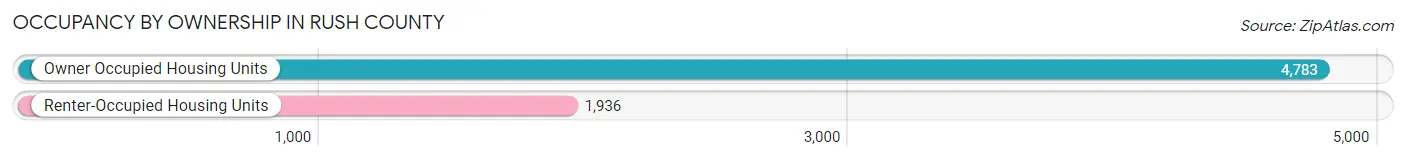
| Occupancy | # Housing Units | % Housing Units |
| Owner Occupied Housing Units | 4,783 | 71.2% |
| Renter-Occupied Housing Units | 1,936 | 28.8% |
| Total Occupied Housing Units | 6,719 | 100.0% |
Occupancy by Household Size in Rush County
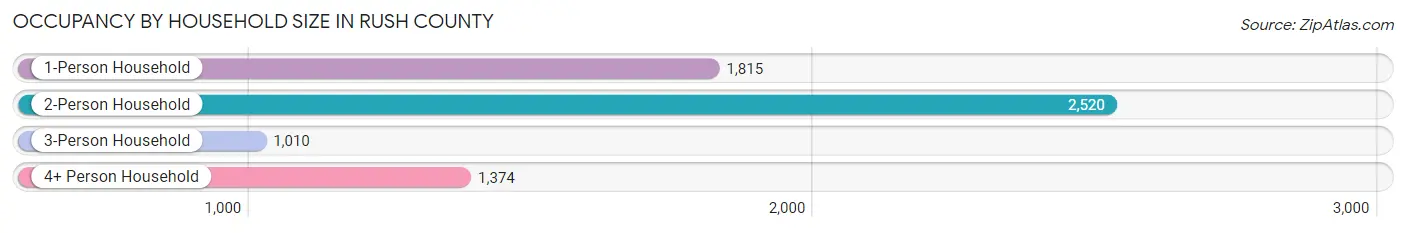
| Household Size | # Housing Units | % Housing Units |
| 1-Person Household | 1,815 | 27.0% |
| 2-Person Household | 2,520 | 37.5% |
| 3-Person Household | 1,010 | 15.0% |
| 4+ Person Household | 1,374 | 20.4% |
| Total Housing Units | 6,719 | 100.0% |
Occupancy by Ownership by Household Size in Rush County
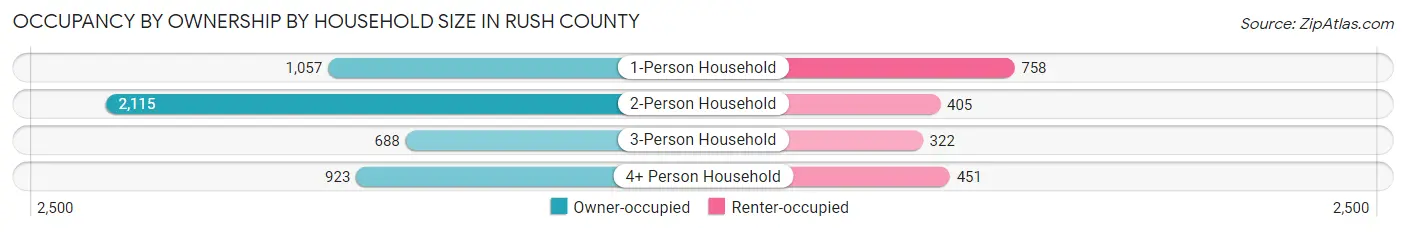
| Household Size | Owner-occupied | Renter-occupied |
| 1-Person Household | 1,057 (58.2%) | 758 (41.8%) |
| 2-Person Household | 2,115 (83.9%) | 405 (16.1%) |
| 3-Person Household | 688 (68.1%) | 322 (31.9%) |
| 4+ Person Household | 923 (67.2%) | 451 (32.8%) |
| Total Housing Units | 4,783 (71.2%) | 1,936 (28.8%) |
Occupancy by Educational Attainment in Rush County
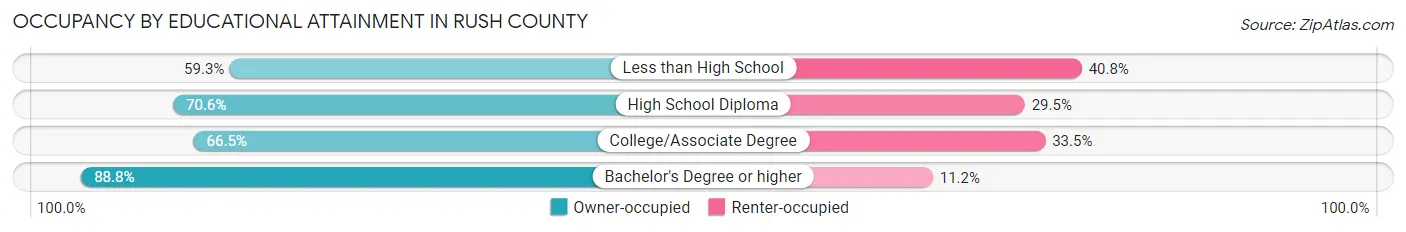
| Household Size | Owner-occupied | Renter-occupied |
| Less than High School | 410 (59.3%) | 282 (40.7%) |
| High School Diploma | 1,945 (70.6%) | 812 (29.4%) |
| College/Associate Degree | 1,416 (66.5%) | 714 (33.5%) |
| Bachelor's Degree or higher | 1,012 (88.8%) | 128 (11.2%) |
Occupancy by Age of Householder in Rush County
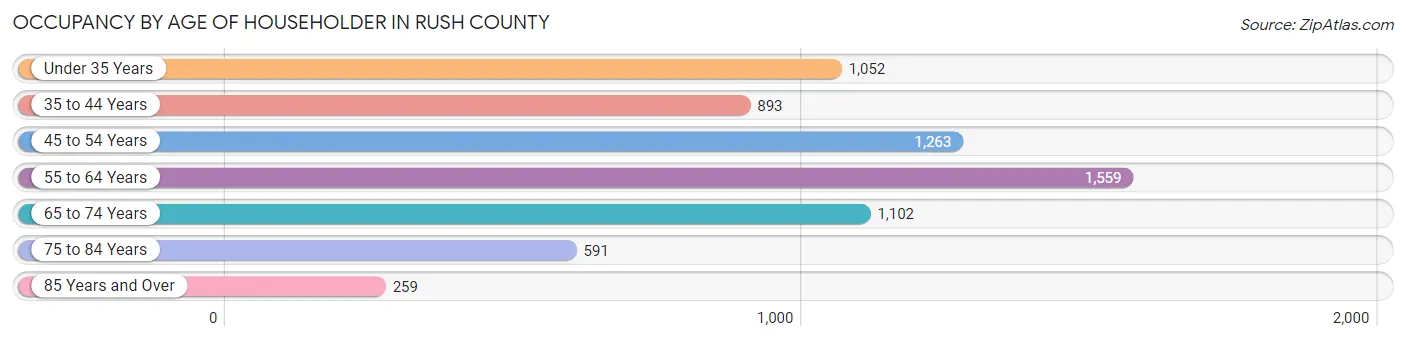
| Age Bracket | # Households | % Households |
| Under 35 Years | 1,052 | 15.7% |
| 35 to 44 Years | 893 | 13.3% |
| 45 to 54 Years | 1,263 | 18.8% |
| 55 to 64 Years | 1,559 | 23.2% |
| 65 to 74 Years | 1,102 | 16.4% |
| 75 to 84 Years | 591 | 8.8% |
| 85 Years and Over | 259 | 3.8% |
| Total | 6,719 | 100.0% |
Housing Finances in Rush County
Median Income by Occupancy in Rush County
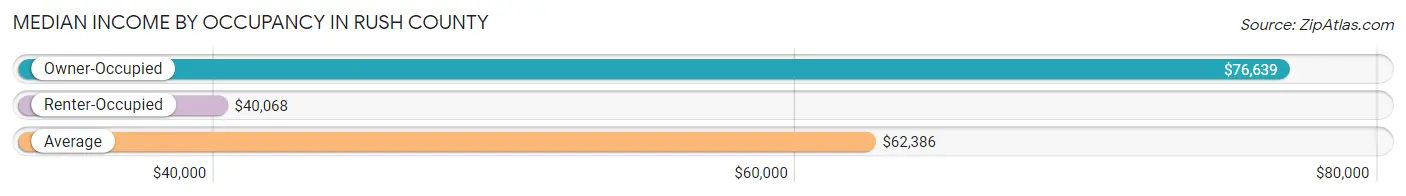
| Occupancy Type | # Households | Median Income |
| Owner-Occupied | 4,783 (71.2%) | $76,639 |
| Renter-Occupied | 1,936 (28.8%) | $40,068 |
| Average | 6,719 (100.0%) | $62,386 |
Occupancy by Householder Income Bracket in Rush County
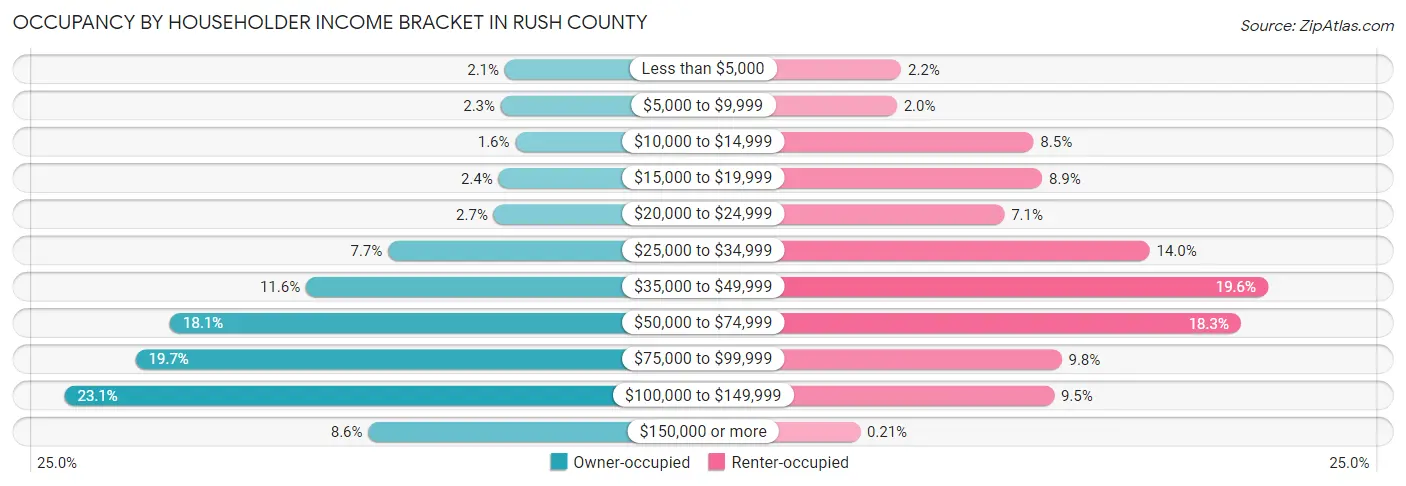
| Income Bracket | Owner-occupied | Renter-occupied |
| Less than $5,000 | 102 (2.1%) | 42 (2.2%) |
| $5,000 to $9,999 | 111 (2.3%) | 38 (2.0%) |
| $10,000 to $14,999 | 78 (1.6%) | 164 (8.5%) |
| $15,000 to $19,999 | 116 (2.4%) | 172 (8.9%) |
| $20,000 to $24,999 | 127 (2.7%) | 137 (7.1%) |
| $25,000 to $34,999 | 368 (7.7%) | 271 (14.0%) |
| $35,000 to $49,999 | 555 (11.6%) | 380 (19.6%) |
| $50,000 to $74,999 | 865 (18.1%) | 355 (18.3%) |
| $75,000 to $99,999 | 943 (19.7%) | 190 (9.8%) |
| $100,000 to $149,999 | 1,105 (23.1%) | 183 (9.5%) |
| $150,000 or more | 413 (8.6%) | 4 (0.2%) |
| Total | 4,783 (100.0%) | 1,936 (100.0%) |
Monthly Housing Cost Tiers in Rush County
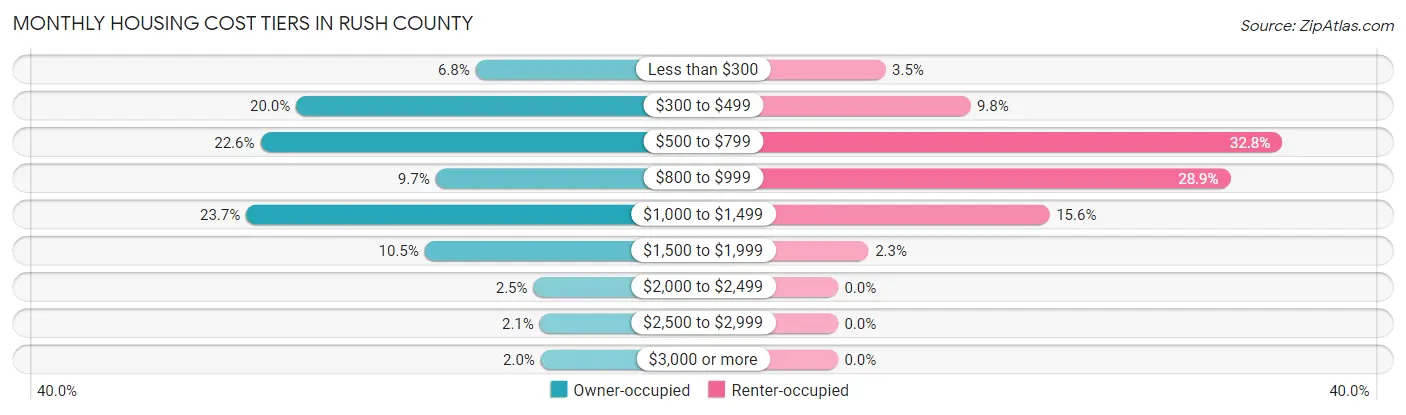
| Monthly Cost | Owner-occupied | Renter-occupied |
| Less than $300 | 325 (6.8%) | 68 (3.5%) |
| $300 to $499 | 957 (20.0%) | 189 (9.8%) |
| $500 to $799 | 1,083 (22.6%) | 634 (32.8%) |
| $800 to $999 | 466 (9.7%) | 560 (28.9%) |
| $1,000 to $1,499 | 1,133 (23.7%) | 302 (15.6%) |
| $1,500 to $1,999 | 504 (10.5%) | 44 (2.3%) |
| $2,000 to $2,499 | 121 (2.5%) | 0 (0.0%) |
| $2,500 to $2,999 | 99 (2.1%) | 0 (0.0%) |
| $3,000 or more | 95 (2.0%) | 0 (0.0%) |
| Total | 4,783 (100.0%) | 1,936 (100.0%) |
Physical Housing Characteristics in Rush County
Housing Structures in Rush County
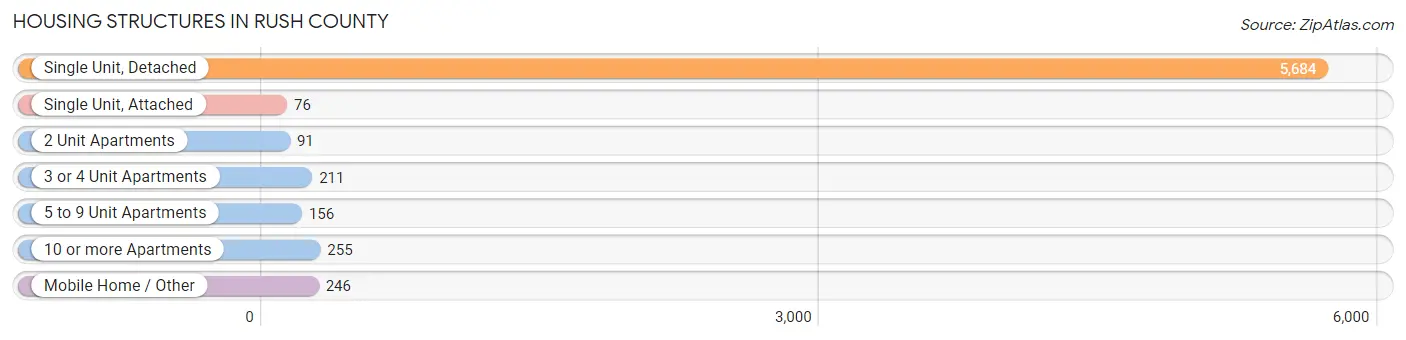
| Structure Type | # Housing Units | % Housing Units |
| Single Unit, Detached | 5,684 | 84.6% |
| Single Unit, Attached | 76 | 1.1% |
| 2 Unit Apartments | 91 | 1.3% |
| 3 or 4 Unit Apartments | 211 | 3.1% |
| 5 to 9 Unit Apartments | 156 | 2.3% |
| 10 or more Apartments | 255 | 3.8% |
| Mobile Home / Other | 246 | 3.7% |
| Total | 6,719 | 100.0% |
Housing Structures by Occupancy in Rush County
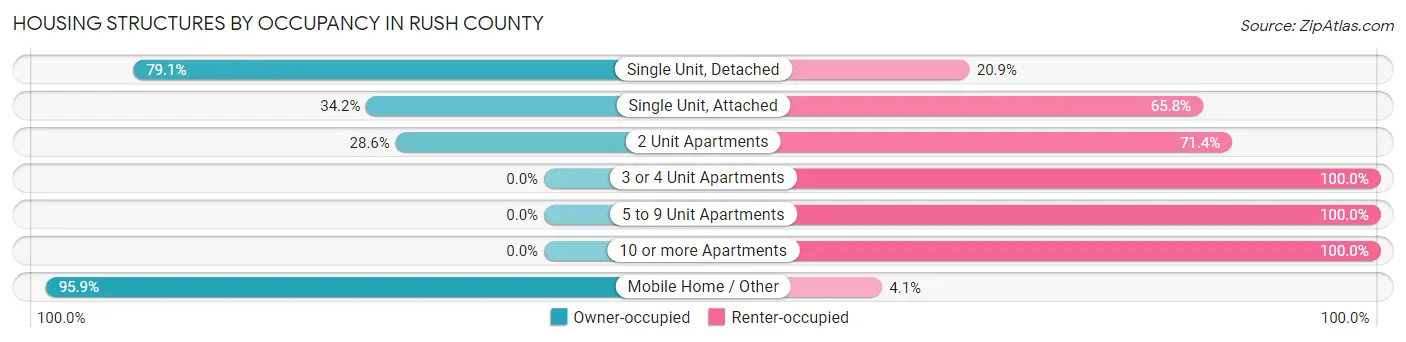
| Structure Type | Owner-occupied | Renter-occupied |
| Single Unit, Detached | 4,495 (79.1%) | 1,189 (20.9%) |
| Single Unit, Attached | 26 (34.2%) | 50 (65.8%) |
| 2 Unit Apartments | 26 (28.6%) | 65 (71.4%) |
| 3 or 4 Unit Apartments | 0 (0.0%) | 211 (100.0%) |
| 5 to 9 Unit Apartments | 0 (0.0%) | 156 (100.0%) |
| 10 or more Apartments | 0 (0.0%) | 255 (100.0%) |
| Mobile Home / Other | 236 (95.9%) | 10 (4.1%) |
| Total | 4,783 (71.2%) | 1,936 (28.8%) |
Housing Structures by Number of Rooms in Rush County
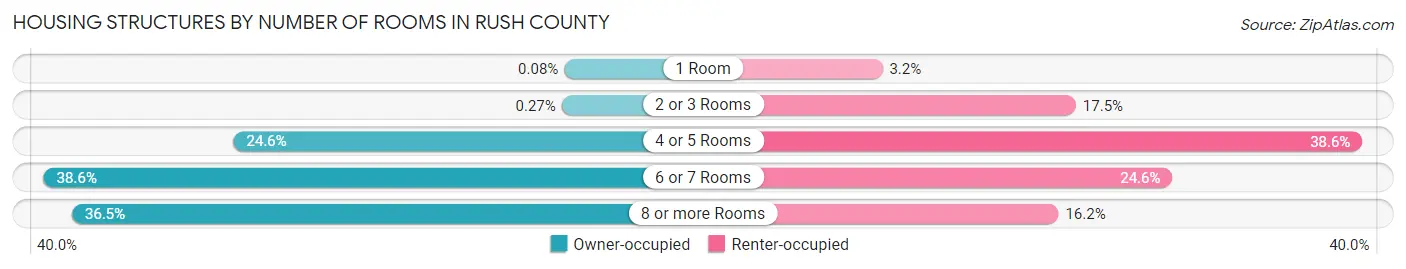
| Number of Rooms | Owner-occupied | Renter-occupied |
| 1 Room | 4 (0.1%) | 61 (3.2%) |
| 2 or 3 Rooms | 13 (0.3%) | 338 (17.5%) |
| 4 or 5 Rooms | 1,174 (24.5%) | 748 (38.6%) |
| 6 or 7 Rooms | 1,846 (38.6%) | 476 (24.6%) |
| 8 or more Rooms | 1,746 (36.5%) | 313 (16.2%) |
| Total | 4,783 (100.0%) | 1,936 (100.0%) |
Housing Structure by Heating Type in Rush County
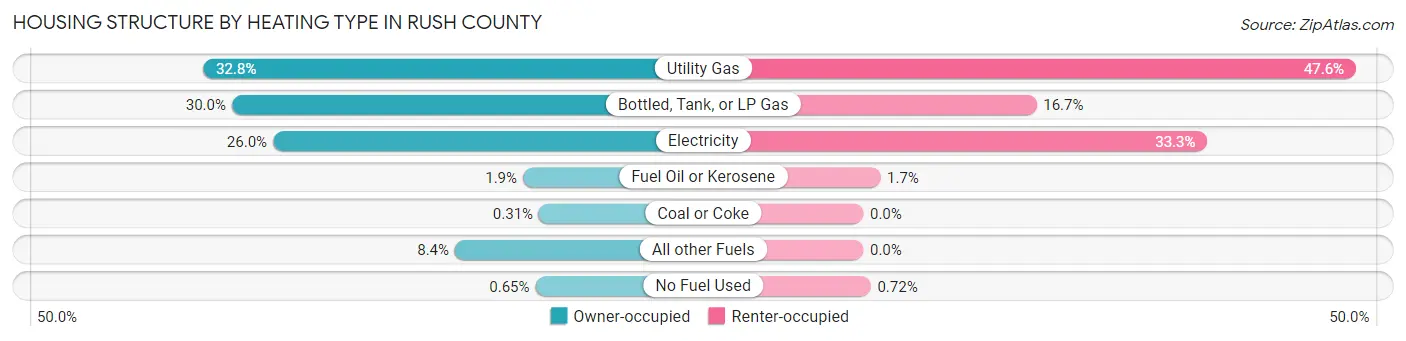
| Heating Type | Owner-occupied | Renter-occupied |
| Utility Gas | 1,567 (32.8%) | 922 (47.6%) |
| Bottled, Tank, or LP Gas | 1,434 (30.0%) | 324 (16.7%) |
| Electricity | 1,244 (26.0%) | 644 (33.3%) |
| Fuel Oil or Kerosene | 89 (1.9%) | 32 (1.7%) |
| Coal or Coke | 15 (0.3%) | 0 (0.0%) |
| All other Fuels | 403 (8.4%) | 0 (0.0%) |
| No Fuel Used | 31 (0.6%) | 14 (0.7%) |
| Total | 4,783 (100.0%) | 1,936 (100.0%) |
Household Vehicle Usage in Rush County
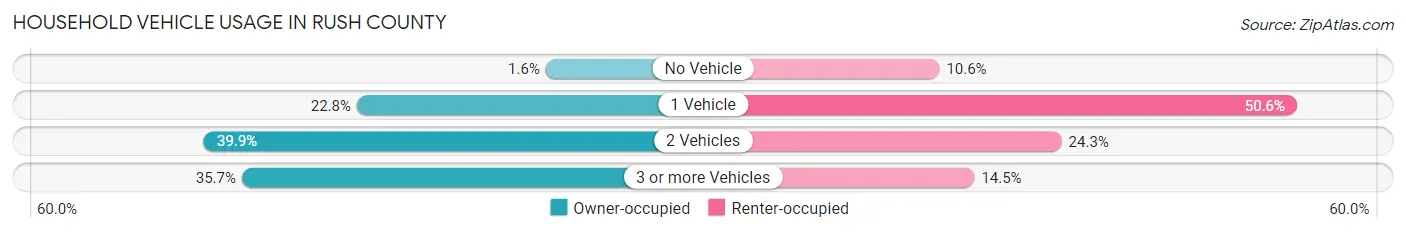
| Vehicles per Household | Owner-occupied | Renter-occupied |
| No Vehicle | 78 (1.6%) | 205 (10.6%) |
| 1 Vehicle | 1,090 (22.8%) | 980 (50.6%) |
| 2 Vehicles | 1,909 (39.9%) | 470 (24.3%) |
| 3 or more Vehicles | 1,706 (35.7%) | 281 (14.5%) |
| Total | 4,783 (100.0%) | 1,936 (100.0%) |
Real Estate & Mortgages in Rush County
Real Estate and Mortgage Overview in Rush County
| Characteristic | Without Mortgage | With Mortgage |
| Housing Units | 2,061 | 2,722 |
| Median Property Value | $130,100 | $159,900 |
| Median Household Income | $58,890 | $311 |
| Monthly Housing Costs | $449 | $94 |
| Real Estate Taxes | $776 | $82 |
Property Value by Mortgage Status in Rush County
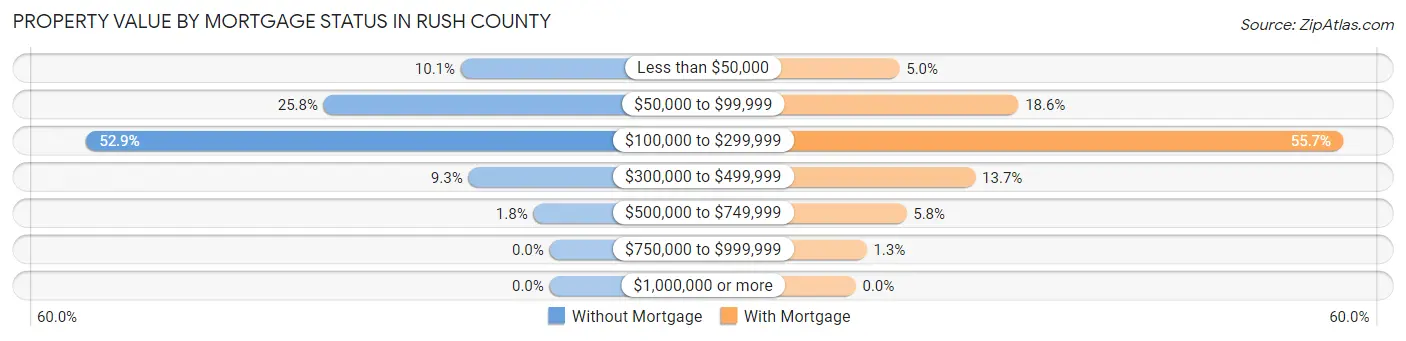
| Property Value | Without Mortgage | With Mortgage |
| Less than $50,000 | 209 (10.1%) | 136 (5.0%) |
| $50,000 to $99,999 | 532 (25.8%) | 506 (18.6%) |
| $100,000 to $299,999 | 1,091 (52.9%) | 1,516 (55.7%) |
| $300,000 to $499,999 | 191 (9.3%) | 372 (13.7%) |
| $500,000 to $749,999 | 38 (1.8%) | 158 (5.8%) |
| $750,000 to $999,999 | 0 (0.0%) | 34 (1.3%) |
| $1,000,000 or more | 0 (0.0%) | 0 (0.0%) |
| Total | 2,061 (100.0%) | 2,722 (100.0%) |
Household Income by Mortgage Status in Rush County
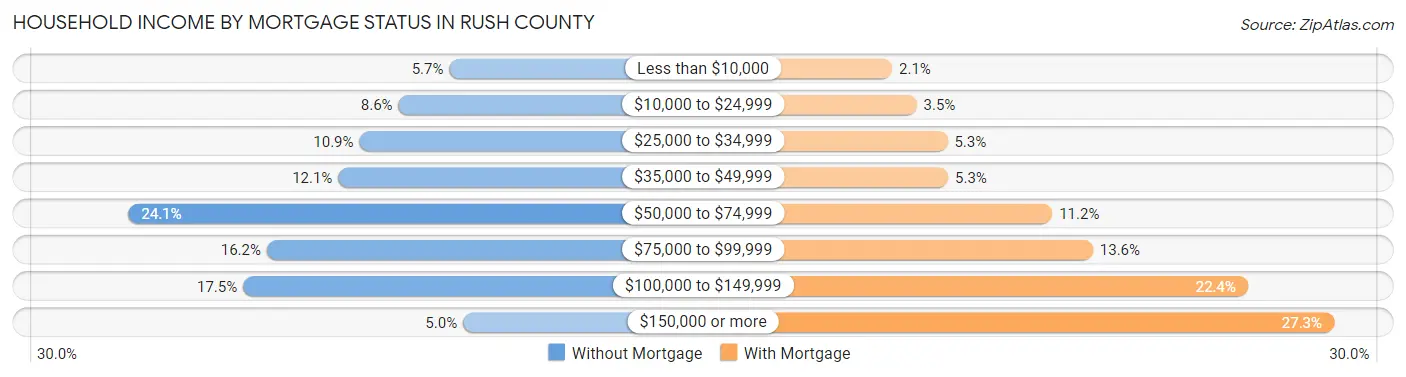
| Household Income | Without Mortgage | With Mortgage |
| Less than $10,000 | 118 (5.7%) | 57 (2.1%) |
| $10,000 to $24,999 | 178 (8.6%) | 95 (3.5%) |
| $25,000 to $34,999 | 224 (10.9%) | 143 (5.2%) |
| $35,000 to $49,999 | 249 (12.1%) | 144 (5.3%) |
| $50,000 to $74,999 | 496 (24.1%) | 306 (11.2%) |
| $75,000 to $99,999 | 333 (16.2%) | 369 (13.6%) |
| $100,000 to $149,999 | 361 (17.5%) | 610 (22.4%) |
| $150,000 or more | 102 (5.0%) | 744 (27.3%) |
| Total | 2,061 (100.0%) | 2,722 (100.0%) |
Property Value to Household Income Ratio in Rush County
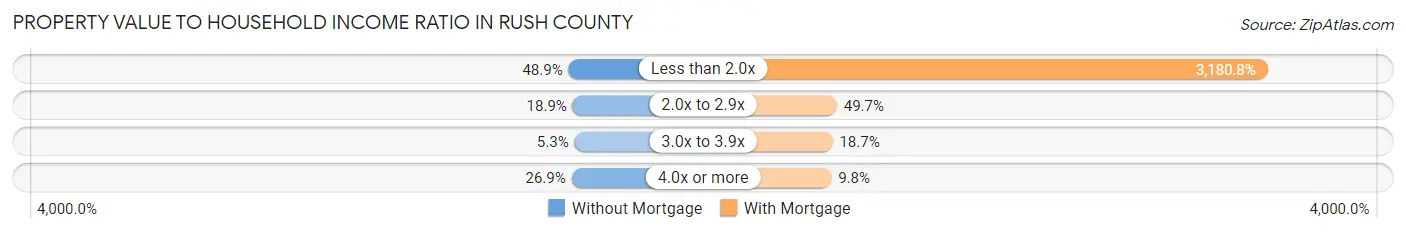
| Value-to-Income Ratio | Without Mortgage | With Mortgage |
| Less than 2.0x | 1,008 (48.9%) | 86,582 (3,180.8%) |
| 2.0x to 2.9x | 389 (18.9%) | 1,354 (49.7%) |
| 3.0x to 3.9x | 109 (5.3%) | 509 (18.7%) |
| 4.0x or more | 555 (26.9%) | 267 (9.8%) |
| Total | 2,061 (100.0%) | 2,722 (100.0%) |
Real Estate Taxes by Mortgage Status in Rush County
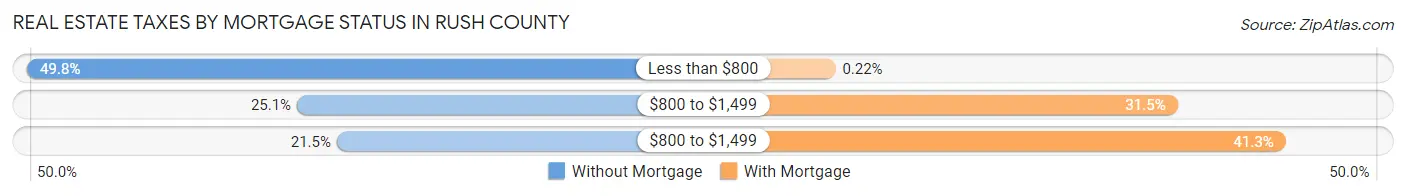
| Property Taxes | Without Mortgage | With Mortgage |
| Less than $800 | 1,026 (49.8%) | 6 (0.2%) |
| $800 to $1,499 | 518 (25.1%) | 856 (31.5%) |
| $800 to $1,499 | 443 (21.5%) | 1,125 (41.3%) |
| Total | 2,061 (100.0%) | 2,722 (100.0%) |
Health & Disability in Rush County
Health Insurance Coverage by Age in Rush County
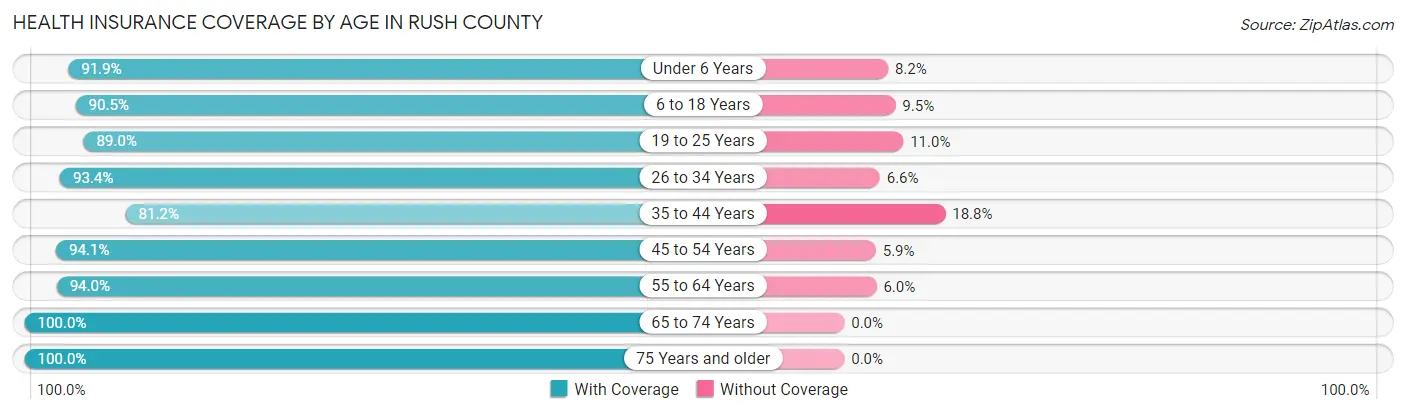
| Age Bracket | With Coverage | Without Coverage |
| Under 6 Years | 980 (91.8%) | 87 (8.2%) |
| 6 to 18 Years | 2,630 (90.5%) | 277 (9.5%) |
| 19 to 25 Years | 1,110 (89.0%) | 137 (11.0%) |
| 26 to 34 Years | 1,608 (93.4%) | 114 (6.6%) |
| 35 to 44 Years | 1,529 (81.2%) | 355 (18.8%) |
| 45 to 54 Years | 2,021 (94.1%) | 126 (5.9%) |
| 55 to 64 Years | 2,443 (94.0%) | 156 (6.0%) |
| 65 to 74 Years | 1,743 (100.0%) | 0 (0.0%) |
| 75 Years and older | 1,226 (100.0%) | 0 (0.0%) |
| Total | 15,290 (92.4%) | 1,252 (7.6%) |
Health Insurance Coverage by Citizenship Status in Rush County
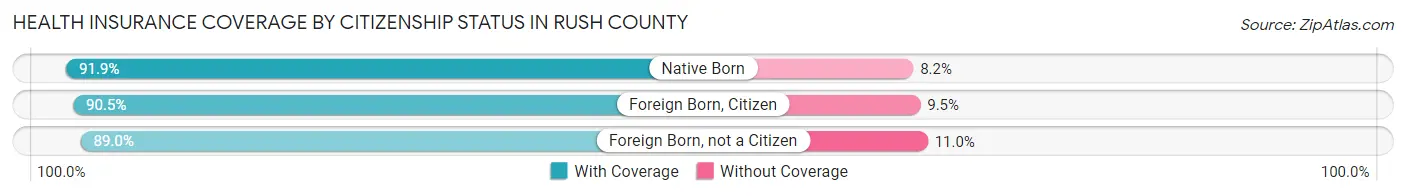
| Citizenship Status | With Coverage | Without Coverage |
| Native Born | 980 (91.8%) | 87 (8.2%) |
| Foreign Born, Citizen | 2,630 (90.5%) | 277 (9.5%) |
| Foreign Born, not a Citizen | 1,110 (89.0%) | 137 (11.0%) |
Health Insurance Coverage by Household Income in Rush County
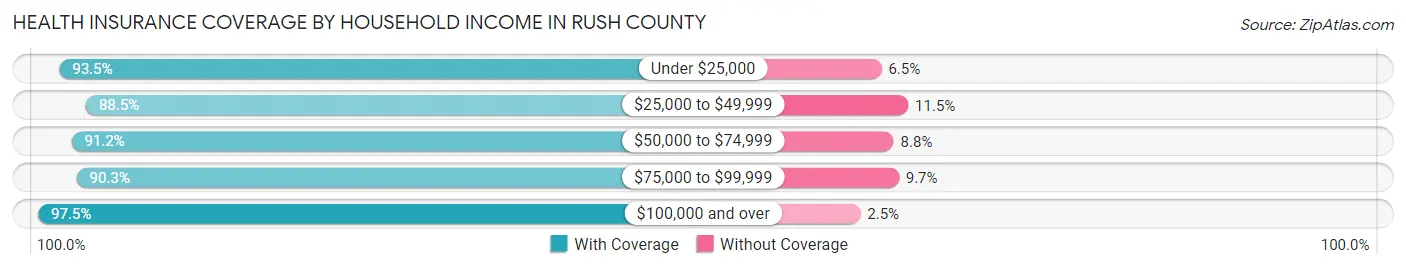
| Household Income | With Coverage | Without Coverage |
| Under $25,000 | 1,481 (93.5%) | 103 (6.5%) |
| $25,000 to $49,999 | 3,277 (88.5%) | 426 (11.5%) |
| $50,000 to $74,999 | 3,181 (91.2%) | 306 (8.8%) |
| $75,000 to $99,999 | 2,762 (90.3%) | 298 (9.7%) |
| $100,000 and over | 4,570 (97.5%) | 119 (2.5%) |
Public vs Private Health Insurance Coverage by Age in Rush County
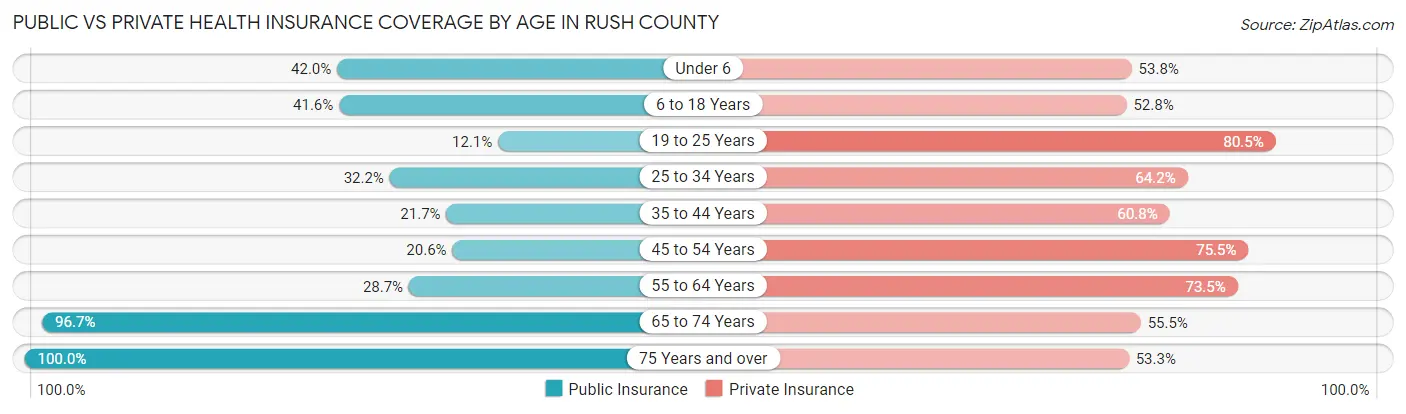
| Age Bracket | Public Insurance | Private Insurance |
| Under 6 | 448 (42.0%) | 574 (53.8%) |
| 6 to 18 Years | 1,210 (41.6%) | 1,536 (52.8%) |
| 19 to 25 Years | 151 (12.1%) | 1,004 (80.5%) |
| 25 to 34 Years | 555 (32.2%) | 1,105 (64.2%) |
| 35 to 44 Years | 409 (21.7%) | 1,146 (60.8%) |
| 45 to 54 Years | 442 (20.6%) | 1,620 (75.4%) |
| 55 to 64 Years | 745 (28.7%) | 1,909 (73.5%) |
| 65 to 74 Years | 1,686 (96.7%) | 967 (55.5%) |
| 75 Years and over | 1,226 (100.0%) | 653 (53.3%) |
| Total | 6,872 (41.5%) | 10,514 (63.6%) |
Disability Status by Sex by Age in Rush County
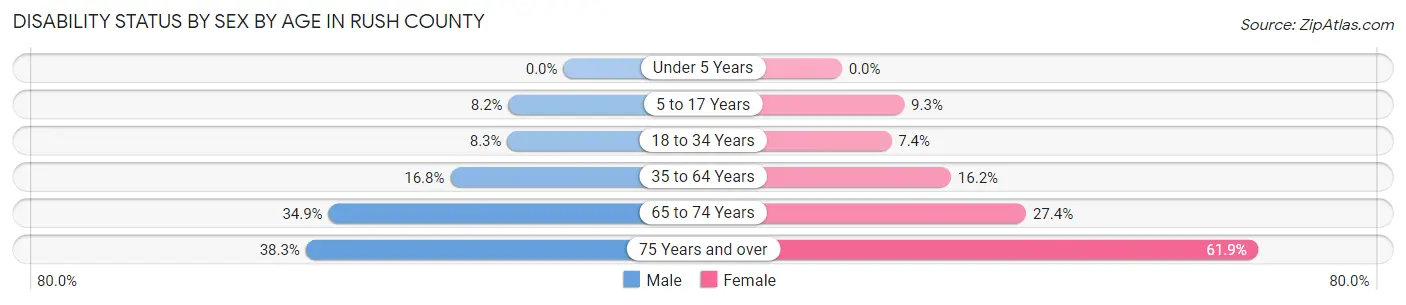
| Age Bracket | Male | Female |
| Under 5 Years | 0 (0.0%) | 0 (0.0%) |
| 5 to 17 Years | 117 (8.2%) | 127 (9.3%) |
| 18 to 34 Years | 139 (8.3%) | 114 (7.3%) |
| 35 to 64 Years | 563 (16.8%) | 531 (16.2%) |
| 65 to 74 Years | 293 (34.9%) | 247 (27.4%) |
| 75 Years and over | 189 (38.3%) | 453 (61.9%) |
Disability Class by Sex by Age in Rush County
Disability Class: Hearing Difficulty
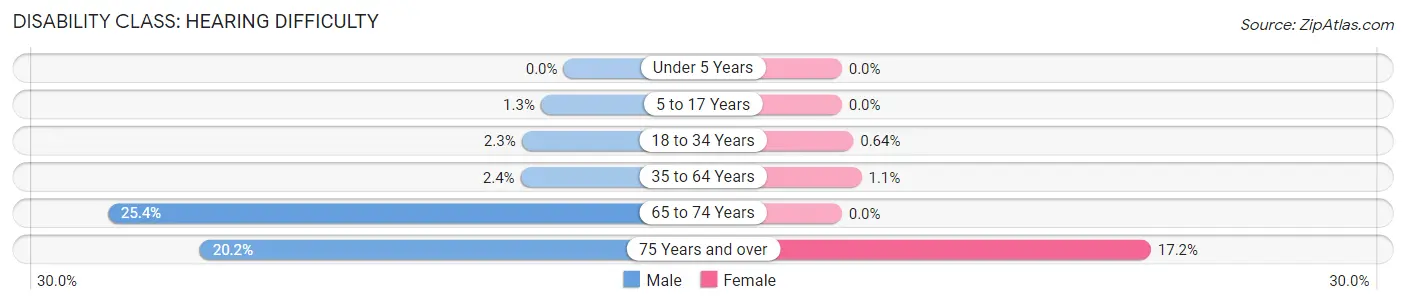
| Age Bracket | Male | Female |
| Under 5 Years | 0 (0.0%) | 0 (0.0%) |
| 5 to 17 Years | 18 (1.3%) | 0 (0.0%) |
| 18 to 34 Years | 39 (2.3%) | 10 (0.6%) |
| 35 to 64 Years | 80 (2.4%) | 36 (1.1%) |
| 65 to 74 Years | 213 (25.4%) | 0 (0.0%) |
| 75 Years and over | 100 (20.2%) | 126 (17.2%) |
Disability Class: Vision Difficulty
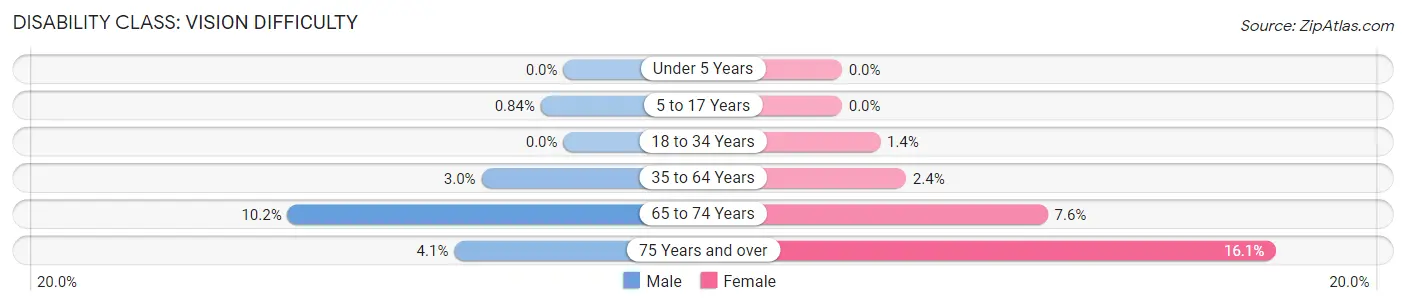
| Age Bracket | Male | Female |
| Under 5 Years | 0 (0.0%) | 0 (0.0%) |
| 5 to 17 Years | 12 (0.8%) | 0 (0.0%) |
| 18 to 34 Years | 0 (0.0%) | 22 (1.4%) |
| 35 to 64 Years | 102 (3.0%) | 78 (2.4%) |
| 65 to 74 Years | 86 (10.2%) | 69 (7.6%) |
| 75 Years and over | 20 (4.1%) | 118 (16.1%) |
Disability Class: Cognitive Difficulty
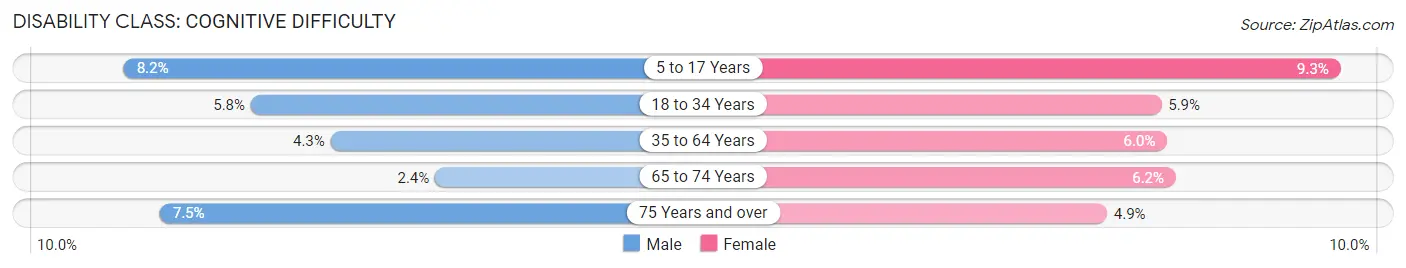
| Age Bracket | Male | Female |
| 5 to 17 Years | 117 (8.2%) | 127 (9.3%) |
| 18 to 34 Years | 97 (5.8%) | 92 (5.9%) |
| 35 to 64 Years | 145 (4.3%) | 198 (6.0%) |
| 65 to 74 Years | 20 (2.4%) | 56 (6.2%) |
| 75 Years and over | 37 (7.5%) | 36 (4.9%) |
Disability Class: Ambulatory Difficulty
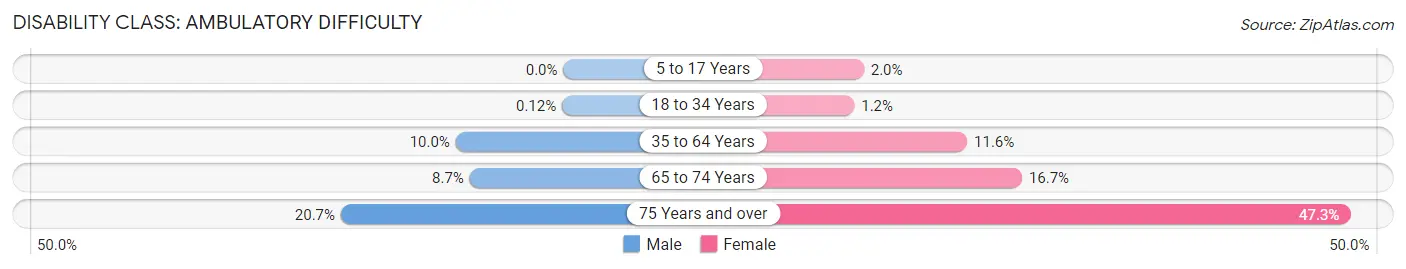
| Age Bracket | Male | Female |
| 5 to 17 Years | 0 (0.0%) | 28 (2.0%) |
| 18 to 34 Years | 2 (0.1%) | 18 (1.2%) |
| 35 to 64 Years | 335 (10.0%) | 381 (11.6%) |
| 65 to 74 Years | 73 (8.7%) | 151 (16.7%) |
| 75 Years and over | 102 (20.6%) | 346 (47.3%) |
Disability Class: Self-Care Difficulty
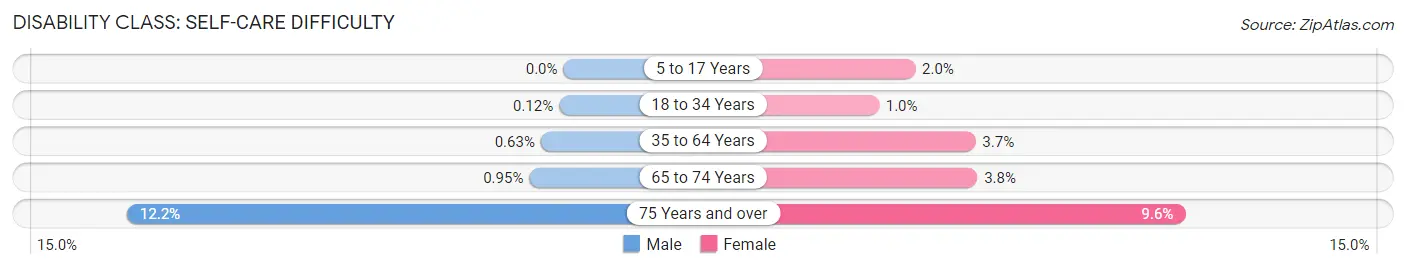
| Age Bracket | Male | Female |
| 5 to 17 Years | 0 (0.0%) | 28 (2.0%) |
| 18 to 34 Years | 2 (0.1%) | 16 (1.0%) |
| 35 to 64 Years | 21 (0.6%) | 122 (3.7%) |
| 65 to 74 Years | 8 (0.9%) | 34 (3.8%) |
| 75 Years and over | 60 (12.1%) | 70 (9.6%) |
Technology Access in Rush County
Computing Device Access in Rush County
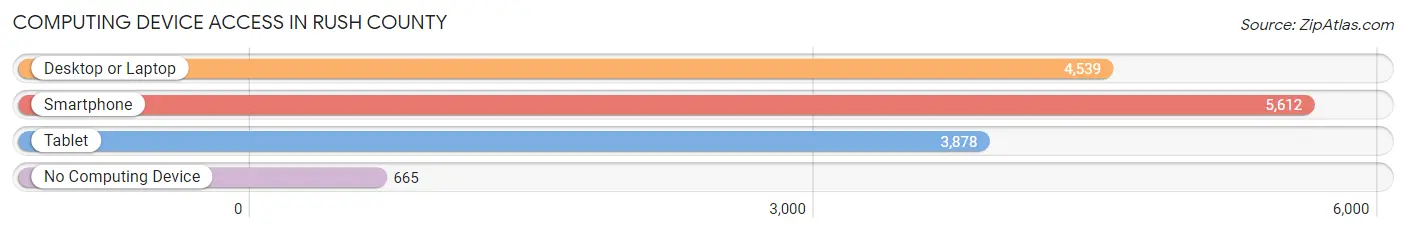
| Device Type | # Households | % Households |
| Desktop or Laptop | 4,539 | 67.5% |
| Smartphone | 5,612 | 83.5% |
| Tablet | 3,878 | 57.7% |
| No Computing Device | 665 | 9.9% |
| Total | 6,719 | 100.0% |
Internet Access in Rush County
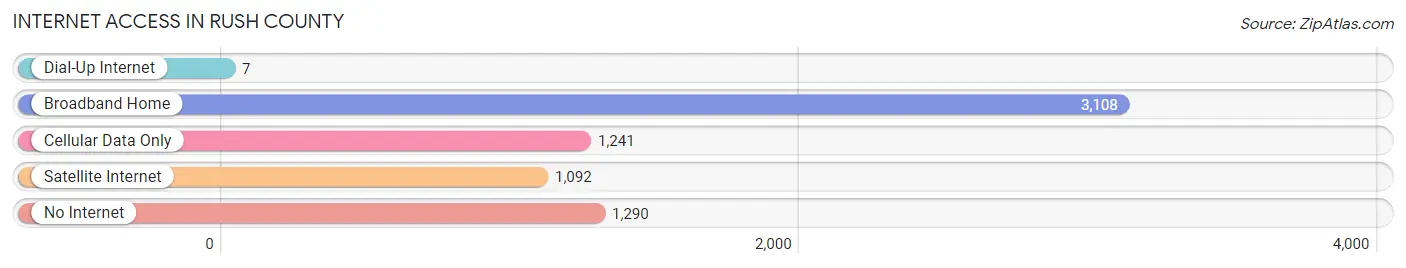
| Internet Type | # Households | % Households |
| Dial-Up Internet | 7 | 0.1% |
| Broadband Home | 3,108 | 46.3% |
| Cellular Data Only | 1,241 | 18.5% |
| Satellite Internet | 1,092 | 16.3% |
| No Internet | 1,290 | 19.2% |
| Total | 6,719 | 100.0% |
Rush County Summary
County History
Rush County, Indiana is located in the east central part of the state and is part of the Indianapolis metropolitan area. The county was established in 1822 and named after Dr. Benjamin Rush, a signer of the Declaration of Independence. The county seat is Rushville, which was founded in 1822 and is the oldest town in the county.
The first settlers in Rush County were mostly from Kentucky, Virginia, and North Carolina. They were attracted to the area by the abundance of timber and the fertile soil. The first industry in the county was milling, and the first mill was built in 1824. The county was also home to several distilleries, which produced whiskey and other spirits.
The county was an important agricultural center in the 19th century, and the county seat of Rushville was a major trading center. The county was also home to several manufacturing companies, including a furniture factory, a wagon factory, and a brickyard.
The county was also home to several notable people, including William Henry Harrison, the ninth president of the United States, and his son, Benjamin Harrison, the 23rd president. The county was also home to several Civil War generals, including William Tecumseh Sherman and Philip Sheridan.
Geography
Rush County is located in east central Indiana and is bordered by Shelby County to the north, Decatur County to the east, Fayette County to the south, and Hancock County to the west. The county covers an area of 437 square miles and is mostly flat with some rolling hills. The highest point in the county is located in the northwest corner and is 890 feet above sea level.
The county is drained by the Big Blue River, which flows through the center of the county. The county is also home to several small lakes, including Lake Cicott, Lake Pleasant, and Lake Rushville.
Economy
The economy of Rush County is largely based on agriculture and manufacturing. The county is home to several large farms, which produce corn, soybeans, wheat, and other crops. The county is also home to several manufacturing companies, including a furniture factory, a wagon factory, and a brickyard.
The county is also home to several small businesses, including restaurants, retail stores, and service providers. The county is also home to several tourist attractions, including the Rush County Historical Museum and the Rush County Fairgrounds.
Demographics
As of the 2010 census, the population of Rush County was 17,392. The population is mostly white (94.3%) with small percentages of African American (2.2%), Hispanic (1.3%), and Asian (0.7%) residents. The median household income is $45,945 and the median home value is $117,400.
The county is served by several school districts, including Rush County Schools, Rushville Consolidated Schools, and Shelby Eastern Schools. The county is also home to several higher education institutions, including Indiana University East, Ivy Tech Community College, and the University of Indianapolis.
Conclusion
Rush County, Indiana is a rural county located in east central Indiana. The county was established in 1822 and is home to several notable people, including William Henry Harrison and Benjamin Harrison. The county is largely agricultural and is home to several manufacturing companies. The population of the county is mostly white and the median household income is $45,945. The county is served by several school districts and higher education institutions.
Common Questions
What is Per Capita Income in Rush County?
Per Capita income in Rush County is $29,735.
What is the Median Family Income in Rush County?
Median Family Income in Rush County is $75,018.
What is the Median Household income in Rush County?
Median Household Income in Rush County is $62,386.
What is Income or Wage Gap in Rush County?
Income or Wage Gap in Rush County is 29.3%.
Women in Rush County earn 70.7 cents for every dollar earned by a man.
What is Family Income Deficit in Rush County?
Family Income Deficit in Rush County is $8,895.
Families that are below poverty line in Rush County earn $8,895 less on average than the poverty threshold level.
What is Inequality or Gini Index in Rush County?
Inequality or Gini Index in Rush County is 0.38.
What is the Total Population of Rush County?
Total Population of Rush County is 16,716.
What is the Total Male Population of Rush County?
Total Male Population of Rush County is 8,374.
What is the Total Female Population of Rush County?
Total Female Population of Rush County is 8,342.
What is the Ratio of Males per 100 Females in Rush County?
There are 100.38 Males per 100 Females in Rush County.
What is the Ratio of Females per 100 Males in Rush County?
There are 99.62 Females per 100 Males in Rush County.
What is the Median Population Age in Rush County?
Median Population Age in Rush County is 42.5 Years.
What is the Average Family Size in Rush County
Average Family Size in Rush County is 3.0 People.
What is the Average Household Size in Rush County
Average Household Size in Rush County is 2.5 People.
How Large is the Labor Force in Rush County?
There are 8,103 People in the Labor Forcein in Rush County.
What is the Percentage of People in the Labor Force in Rush County?
60.3% of People are in the Labor Force in Rush County.
What is the Unemployment Rate in Rush County?
Unemployment Rate in Rush County is 6.3%.