Zip Codes with the Highest Percentage of Population with a Degree in Computers and Mathematics in Boise, ID

RELATED REPORTS & OPTIONS

Computers and Mathematics
Population
Families and Households
Female Fertility
Female Fertility (Unmarried)
Race (Community Size)
Race (Percentage)
Ancestry (Community Size)
AfghanAfricanAlaska NativeAmericanApacheArabArgentineanArmenianAssyrian / Chaldean / SyriacAustralianAustrianBasqueBelgianBhutaneseBlackfeetBrazilianBritishBulgarianBurmeseCajunCanadianCelticCentral AmericanCentral American IndianCherokeeChippewaChoctawColombianComancheCosta RicanCroatianCubanCzechCzechoslovakianDanishDelawareDominicanDutchEastern EuropeanEcuadorianEgyptianEnglishEthiopianEuropeanFijianFilipinoFinnishFrenchFrench American IndianFrench CanadianGermanGerman RussianGreekGuamanian / ChamorroGuatemalanHaitianHonduranHungarianIcelanderIndian (Asian)IndonesianIranianIraqiIrishIroquoisItalianJamaicanJapaneseKoreanLaotianLatvianLebaneseLithuanianLuxembourgerMalaysianMexicanMexican American IndianMongolianMoroccanNative HawaiianNavajoNicaraguanNigerianNorthern EuropeanNorwegianPakistaniPanamanianPeruvianPolishPortuguesePuebloPuerto RicanRomanianRussianSalvadoranSamoanScandinavianScotch-IrishScottishSerbianShoshoneSiouxSlavicSlovakSloveneSomaliSouth AfricanSouth AmericanSpaniardSpanishSri LankanSubsaharan AfricanSwedishSwissSyrianThaiTurkishUkrainianVenezuelanWelshYugoslavian
Ancestry (Percentage)
AfghanAfricanAlaska NativeAmericanApacheArabArgentineanArmenianAssyrian / Chaldean / SyriacAustralianAustrianBasqueBelgianBhutaneseBlackfeetBrazilianBritishBulgarianBurmeseCajunCanadianCelticCentral AmericanCentral American IndianCherokeeChippewaChoctawColombianComancheCosta RicanCroatianCubanCzechCzechoslovakianDanishDelawareDominicanDutchEastern EuropeanEcuadorianEgyptianEnglishEthiopianEuropeanFijianFilipinoFinnishFrenchFrench American IndianFrench CanadianGermanGerman RussianGreekGuamanian / ChamorroGuatemalanHaitianHonduranHungarianIcelanderIndian (Asian)IndonesianIranianIraqiIrishIroquoisItalianJamaicanJapaneseKoreanLaotianLatvianLebaneseLithuanianLuxembourgerMalaysianMexicanMexican American IndianMongolianMoroccanNative HawaiianNavajoNicaraguanNigerianNorthern EuropeanNorwegianPakistaniPanamanianPeruvianPolishPortuguesePuebloPuerto RicanRomanianRussianSalvadoranSamoanScandinavianScotch-IrishScottishSerbianShoshoneSiouxSlavicSlovakSloveneSomaliSouth AfricanSouth AmericanSpaniardSpanishSri LankanSubsaharan AfricanSwedishSwissSyrianThaiTurkishUkrainianVenezuelanWelshYugoslavian
Immigrant Origin (Total)
Immigrant Origin (Percentage)
Income
Income (Families)
Income (Households)
Poverty
Poverty (Families)
Unemployment
Employment Occupations
Employment Industries
Employer Class
Commute Time
Commute Means
School Enrollment
Education by Degree Field
Occupancy
Finances
Physical Characteristics
Boise
Compare Zip Codes
Comparison Subject

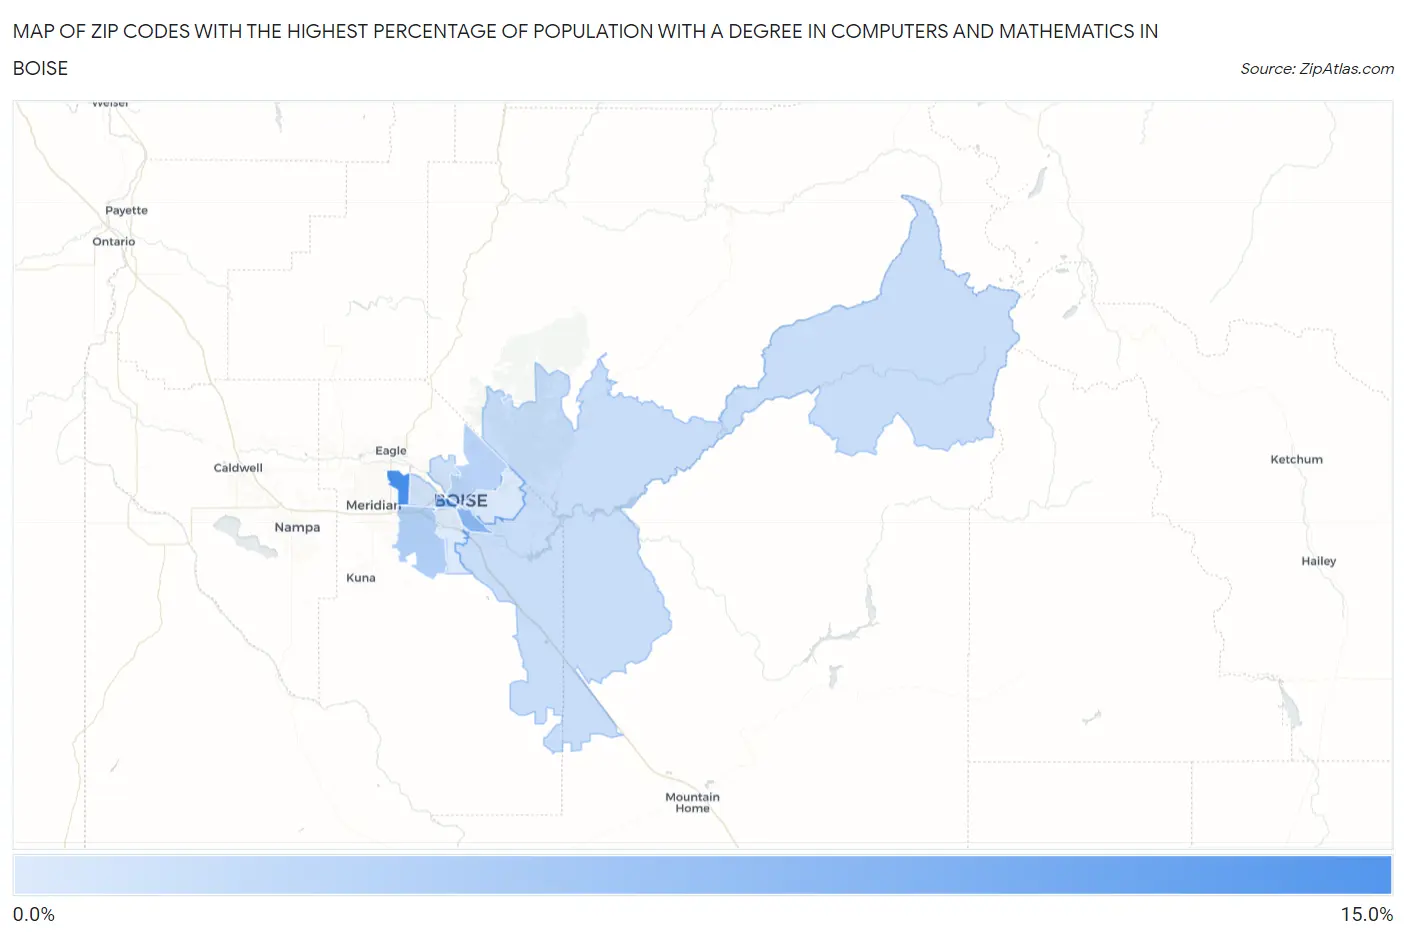
Map of Zip Codes with the Highest Percentage of Population with a Degree in Computers and Mathematics in Boise

0.0%
15.0%
Zip Codes with the Highest Percentage of Population with a Degree in Computers and Mathematics in Boise Map

Zip Codes with the Highest Percentage of Population with a Degree in Computers and Mathematics in Boise, ID

Zip Code % Graduates vs State vs National
1.8371310.9%3.5%(+7.34)#144.9%(+5.97)#1,489
2.837067.0%3.5%(+3.49)#204.9%(+2.13)#3,800
3.837094.8%3.5%(+1.27)#334.9%(-0.095)#7,991
4.837024.4%3.5%(+0.847)#404.9%(-0.522)#9,286
5.837163.4%3.5%(-0.118)#594.9%(-1.49)#12,642
6.837033.1%3.5%(-0.459)#684.9%(-1.83)#13,855
7.837043.0%3.5%(-0.561)#704.9%(-1.93)#14,198
8.837122.5%3.5%(-1.05)#824.9%(-2.42)#16,024
9.837052.3%3.5%(-1.20)#894.9%(-2.57)#16,497

Common Questions

What are the Top 5 Zip Codes with the Highest Percentage of Population with a Degree in Computers and Mathematics in Boise, ID?
Top 5 Zip Codes with the Highest Percentage of Population with a Degree in Computers and Mathematics in Boise, ID are:
#1
10.9%
#2
7.0%
#3
4.8%
#4
4.4%
#5
3.4%
What zip code has the Highest Percentage of Population with a Degree in Computers and Mathematics in Boise, ID?
83713 has the Highest Percentage of Population with a Degree in Computers and Mathematics in Boise, ID with 10.9%.
What is the Percentage of Population with a Degree in Computers and Mathematics in Idaho?
Percentage of Population with a Degree in Computers and Mathematics in Idaho is 3.5%.
What is the Percentage of Population with a Degree in Computers and Mathematics in the United States?
Percentage of Population with a Degree in Computers and Mathematics in the United States is 4.9%.