Zip Codes with the Highest Percentage of Population with a Degree in Computers and Mathematics in Idaho
RELATED REPORTS & OPTIONS
Computers and Mathematics
Idaho
Compare Zip Codes
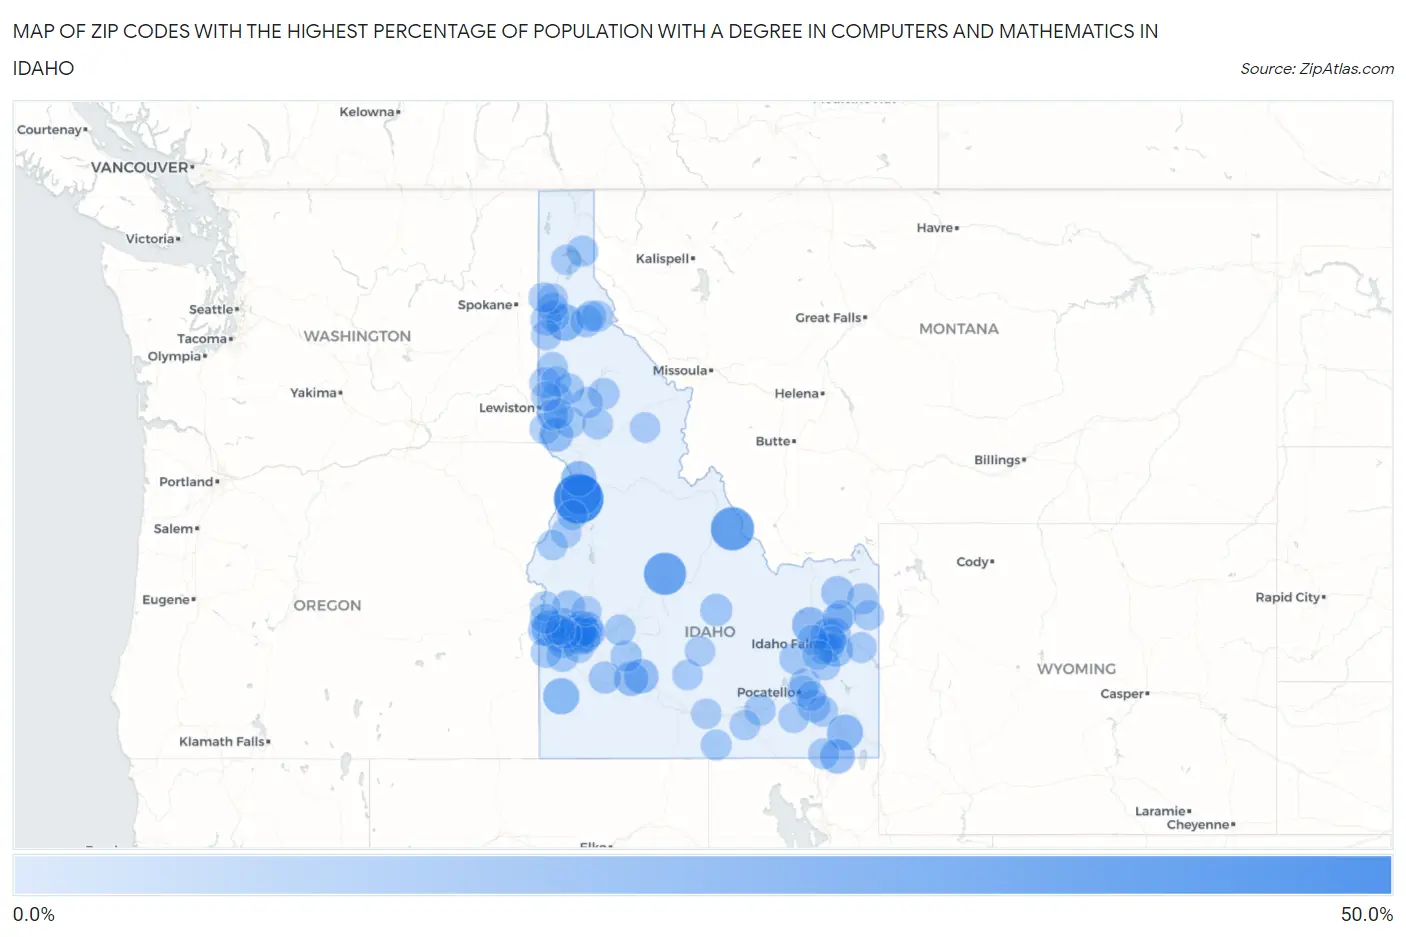
Map of Zip Codes with the Highest Percentage of Population with a Degree in Computers and Mathematics in Idaho
0.0%
50.0%
Zip Codes with the Highest Percentage of Population with a Degree in Computers and Mathematics in Idaho
| Zip Code | % Graduates | vs State | vs National | |
| 1. | 83547 | 47.2% | 3.5%(+43.6)#1 | 4.9%(+42.3)#97 |
| 2. | 83468 | 32.1% | 3.5%(+28.6)#2 | 4.9%(+27.2)#200 |
| 3. | 83278 | 29.7% | 3.5%(+26.1)#3 | 4.9%(+24.8)#233 |
| 4. | 83549 | 25.7% | 3.5%(+22.2)#4 | 4.9%(+20.8)#288 |
| 5. | 83842 | 16.7% | 3.5%(+13.1)#5 | 4.9%(+11.8)#655 |
| 6. | 83626 | 16.0% | 3.5%(+12.5)#6 | 4.9%(+11.1)#700 |
| 7. | 83650 | 15.7% | 3.5%(+12.2)#7 | 4.9%(+10.8)#732 |
| 8. | 83444 | 14.8% | 3.5%(+11.3)#8 | 4.9%(+9.92)#806 |
| 9. | 83283 | 14.6% | 3.5%(+11.1)#9 | 4.9%(+9.74)#828 |
| 10. | 83542 | 13.3% | 3.5%(+9.81)#10 | 4.9%(+8.44)#1,010 |
| 11. | 83237 | 12.3% | 3.5%(+8.80)#11 | 4.9%(+7.43)#1,161 |
| 12. | 83633 | 11.8% | 3.5%(+8.24)#12 | 4.9%(+6.87)#1,266 |
| 13. | 83623 | 11.4% | 3.5%(+7.88)#13 | 4.9%(+6.52)#1,346 |
| 14. | 83713 | 10.9% | 3.5%(+7.34)#14 | 4.9%(+5.97)#1,489 |
| 15. | 83454 | 10.3% | 3.5%(+6.73)#15 | 4.9%(+5.36)#1,670 |
| 16. | 83555 | 9.7% | 3.5%(+6.20)#16 | 4.9%(+4.83)#1,874 |
| 17. | 83427 | 9.3% | 3.5%(+5.81)#17 | 4.9%(+4.44)#2,044 |
| 18. | 83651 | 8.0% | 3.5%(+4.52)#18 | 4.9%(+3.16)#2,862 |
| 19. | 83445 | 7.5% | 3.5%(+4.02)#19 | 4.9%(+2.66)#3,293 |
| 20. | 83706 | 7.0% | 3.5%(+3.49)#20 | 4.9%(+2.13)#3,800 |
| 21. | 83250 | 6.9% | 3.5%(+3.35)#21 | 4.9%(+1.98)#3,976 |
| 22. | 83648 | 6.6% | 3.5%(+3.04)#22 | 4.9%(+1.68)#4,364 |
| 23. | 83251 | 6.4% | 3.5%(+2.91)#23 | 4.9%(+1.54)#4,555 |
| 24. | 83535 | 6.1% | 3.5%(+2.54)#24 | 4.9%(+1.17)#5,192 |
| 25. | 83850 | 5.9% | 3.5%(+2.41)#25 | 4.9%(+1.04)#5,405 |
| 26. | 83617 | 5.9% | 3.5%(+2.40)#26 | 4.9%(+1.03)#5,427 |
| 27. | 83644 | 5.8% | 3.5%(+2.25)#27 | 4.9%(+0.881)#5,723 |
| 28. | 83646 | 5.4% | 3.5%(+1.83)#28 | 4.9%(+0.461)#6,628 |
| 29. | 83642 | 5.3% | 3.5%(+1.75)#29 | 4.9%(+0.384)#6,811 |
| 30. | 83211 | 4.9% | 3.5%(+1.33)#30 | 4.9%(-0.038)#7,822 |
| 31. | 83641 | 4.8% | 3.5%(+1.31)#31 | 4.9%(-0.061)#7,893 |
| 32. | 83686 | 4.8% | 3.5%(+1.31)#32 | 4.9%(-0.062)#7,894 |
| 33. | 83709 | 4.8% | 3.5%(+1.27)#33 | 4.9%(-0.095)#7,991 |
| 34. | 83546 | 4.8% | 3.5%(+1.24)#34 | 4.9%(-0.132)#8,098 |
| 35. | 83404 | 4.7% | 3.5%(+1.20)#35 | 4.9%(-0.168)#8,196 |
| 36. | 83442 | 4.7% | 3.5%(+1.20)#36 | 4.9%(-0.170)#8,206 |
| 37. | 83676 | 4.6% | 3.5%(+1.09)#37 | 4.9%(-0.281)#8,537 |
| 38. | 83714 | 4.6% | 3.5%(+1.08)#38 | 4.9%(-0.291)#8,556 |
| 39. | 83647 | 4.6% | 3.5%(+1.05)#39 | 4.9%(-0.324)#8,648 |
| 40. | 83702 | 4.4% | 3.5%(+0.847)#40 | 4.9%(-0.522)#9,286 |
| 41. | 83221 | 4.3% | 3.5%(+0.807)#41 | 4.9%(-0.562)#9,422 |
| 42. | 83836 | 4.3% | 3.5%(+0.776)#42 | 4.9%(-0.593)#9,538 |
| 43. | 83833 | 4.2% | 3.5%(+0.720)#43 | 4.9%(-0.649)#9,697 |
| 44. | 83876 | 4.2% | 3.5%(+0.667)#44 | 4.9%(-0.702)#9,866 |
| 45. | 83849 | 4.2% | 3.5%(+0.642)#45 | 4.9%(-0.727)#9,939 |
| 46. | 83286 | 4.2% | 3.5%(+0.642)#46 | 4.9%(-0.727)#9,942 |
| 47. | 83501 | 4.1% | 3.5%(+0.563)#47 | 4.9%(-0.806)#10,180 |
| 48. | 83523 | 4.1% | 3.5%(+0.540)#48 | 4.9%(-0.829)#10,262 |
| 49. | 83420 | 4.0% | 3.5%(+0.501)#49 | 4.9%(-0.868)#10,381 |
| 50. | 83544 | 3.9% | 3.5%(+0.353)#50 | 4.9%(-1.02)#10,875 |
| 51. | 83201 | 3.8% | 3.5%(+0.253)#51 | 4.9%(-1.12)#11,268 |
| 52. | 83536 | 3.8% | 3.5%(+0.231)#52 | 4.9%(-1.14)#11,347 |
| 53. | 83540 | 3.7% | 3.5%(+0.200)#53 | 4.9%(-1.17)#11,452 |
| 54. | 83857 | 3.7% | 3.5%(+0.179)#54 | 4.9%(-1.19)#11,521 |
| 55. | 83639 | 3.7% | 3.5%(+0.145)#55 | 4.9%(-1.22)#11,646 |
| 56. | 83843 | 3.6% | 3.5%(+0.066)#56 | 4.9%(-1.30)#11,930 |
| 57. | 83634 | 3.5% | 3.5%(+0.006)#57 | 4.9%(-1.36)#12,168 |
| 58. | 83346 | 3.5% | 3.5%(-0.016)#58 | 4.9%(-1.39)#12,260 |
| 59. | 83716 | 3.4% | 3.5%(-0.118)#59 | 4.9%(-1.49)#12,642 |
| 60. | 83837 | 3.4% | 3.5%(-0.123)#60 | 4.9%(-1.49)#12,659 |
| 61. | 83537 | 3.3% | 3.5%(-0.228)#61 | 4.9%(-1.60)#13,031 |
| 62. | 83607 | 3.3% | 3.5%(-0.259)#62 | 4.9%(-1.63)#13,133 |
| 63. | 83246 | 3.2% | 3.5%(-0.286)#63 | 4.9%(-1.66)#13,233 |
| 64. | 83212 | 3.2% | 3.5%(-0.299)#64 | 4.9%(-1.67)#13,286 |
| 65. | 83202 | 3.2% | 3.5%(-0.366)#65 | 4.9%(-1.74)#13,520 |
| 66. | 83815 | 3.1% | 3.5%(-0.428)#66 | 4.9%(-1.80)#13,740 |
| 67. | 83449 | 3.1% | 3.5%(-0.448)#67 | 4.9%(-1.82)#13,812 |
| 68. | 83703 | 3.1% | 3.5%(-0.459)#68 | 4.9%(-1.83)#13,855 |
| 69. | 83448 | 3.0% | 3.5%(-0.550)#69 | 4.9%(-1.92)#14,167 |
| 70. | 83704 | 3.0% | 3.5%(-0.561)#70 | 4.9%(-1.93)#14,198 |
| 71. | 83814 | 3.0% | 3.5%(-0.567)#71 | 4.9%(-1.94)#14,221 |
| 72. | 83440 | 2.9% | 3.5%(-0.663)#72 | 4.9%(-2.03)#14,559 |
| 73. | 83854 | 2.8% | 3.5%(-0.678)#73 | 4.9%(-2.05)#14,619 |
| 74. | 83406 | 2.8% | 3.5%(-0.690)#74 | 4.9%(-2.06)#14,668 |
| 75. | 83401 | 2.7% | 3.5%(-0.812)#75 | 4.9%(-2.18)#15,110 |
| 76. | 83851 | 2.7% | 3.5%(-0.837)#76 | 4.9%(-2.21)#15,213 |
| 77. | 83524 | 2.7% | 3.5%(-0.870)#77 | 4.9%(-2.24)#15,330 |
| 78. | 83352 | 2.5% | 3.5%(-0.982)#78 | 4.9%(-2.35)#15,748 |
| 79. | 83323 | 2.5% | 3.5%(-1.01)#79 | 4.9%(-2.38)#15,837 |
| 80. | 83452 | 2.5% | 3.5%(-1.04)#80 | 4.9%(-2.40)#15,949 |
| 81. | 83612 | 2.5% | 3.5%(-1.04)#81 | 4.9%(-2.41)#15,960 |
| 82. | 83712 | 2.5% | 3.5%(-1.05)#82 | 4.9%(-2.42)#16,024 |
| 83. | 83654 | 2.5% | 3.5%(-1.06)#83 | 4.9%(-2.42)#16,030 |
| 84. | 83539 | 2.5% | 3.5%(-1.07)#84 | 4.9%(-2.43)#16,068 |
| 85. | 83236 | 2.5% | 3.5%(-1.07)#85 | 4.9%(-2.44)#16,097 |
| 86. | 83871 | 2.4% | 3.5%(-1.09)#86 | 4.9%(-2.45)#16,126 |
| 87. | 83402 | 2.3% | 3.5%(-1.18)#87 | 4.9%(-2.55)#16,443 |
| 88. | 83245 | 2.3% | 3.5%(-1.18)#88 | 4.9%(-2.55)#16,451 |
| 89. | 83705 | 2.3% | 3.5%(-1.20)#89 | 4.9%(-2.57)#16,497 |
| 90. | 83313 | 2.3% | 3.5%(-1.23)#90 | 4.9%(-2.60)#16,618 |
| 91. | 83619 | 2.3% | 3.5%(-1.23)#91 | 4.9%(-2.60)#16,623 |
| 92. | 83335 | 2.2% | 3.5%(-1.28)#92 | 4.9%(-2.65)#16,786 |
| 93. | 83860 | 2.2% | 3.5%(-1.34)#93 | 4.9%(-2.71)#17,032 |
| 94. | 83687 | 2.1% | 3.5%(-1.38)#94 | 4.9%(-2.75)#17,149 |
| 95. | 83605 | 2.1% | 3.5%(-1.39)#95 | 4.9%(-2.76)#17,184 |
| 96. | 83610 | 2.1% | 3.5%(-1.44)#96 | 4.9%(-2.81)#17,343 |
| 97. | 83629 | 2.1% | 3.5%(-1.46)#97 | 4.9%(-2.83)#17,399 |
| 98. | 83832 | 2.0% | 3.5%(-1.50)#98 | 4.9%(-2.87)#17,547 |
| 99. | 83274 | 2.0% | 3.5%(-1.56)#99 | 4.9%(-2.93)#17,738 |
| 100. | 83660 | 1.9% | 3.5%(-1.59)#100 | 4.9%(-2.96)#17,832 |
Common Questions
What are the Top 10 Zip Codes with the Highest Percentage of Population with a Degree in Computers and Mathematics in Idaho?
Top 10 Zip Codes with the Highest Percentage of Population with a Degree in Computers and Mathematics in Idaho are:
What zip code has the Highest Percentage of Population with a Degree in Computers and Mathematics in Idaho?
83547 has the Highest Percentage of Population with a Degree in Computers and Mathematics in Idaho with 47.2%.
What is the Percentage of Population with a Degree in Computers and Mathematics in the State of Idaho?
Percentage of Population with a Degree in Computers and Mathematics in Idaho is 3.5%.
What is the Percentage of Population with a Degree in Computers and Mathematics in the United States?
Percentage of Population with a Degree in Computers and Mathematics in the United States is 4.9%.