Hagerman, ID Map & Demographics
Hagerman Map

Hagerman Overview
$40,870
PER CAPITA INCOME
$82,321
AVG FAMILY INCOME
$66,250
AVG HOUSEHOLD INCOME
42.9%
WAGE / INCOME GAP [ % ]
57.1¢/ $1
WAGE / INCOME GAP [ $ ]
$13,121
FAMILY INCOME DEFICIT
0.47
INEQUALITY / GINI INDEX
1,198
TOTAL POPULATION
623
MALE POPULATION
575
FEMALE POPULATION
108.35
MALES / 100 FEMALES
92.30
FEMALES / 100 MALES
50.6
MEDIAN AGE
2.9
AVG FAMILY SIZE
2.0
AVG HOUSEHOLD SIZE
492
LABOR FORCE [ PEOPLE ]
50.5%
PERCENT IN LABOR FORCE
2.0%
UNEMPLOYMENT RATE
Hagerman Zip Codes
Hagerman Area Codes
Income in Hagerman
Income Overview in Hagerman
Per Capita Income in Hagerman is $40,870, while median incomes of families and households are $82,321 and $66,250 respectively.
| Characteristic | Number | Measure |
| Per Capita Income | 1,198 | $40,870 |
| Median Family Income | 263 | $82,321 |
| Mean Family Income | 263 | $83,184 |
| Median Household Income | 577 | $66,250 |
| Mean Household Income | 577 | $81,353 |
| Income Deficit | 263 | $13,121 |
| Wage / Income Gap (%) | 1,198 | 42.94% |
| Wage / Income Gap ($) | 1,198 | 57.06¢ per $1 |
| Gini / Inequality Index | 1,198 | 0.47 |
Earnings by Sex in Hagerman
Average Earnings in Hagerman are $40,977, $57,917 for men and $33,050 for women, a difference of 42.9%.
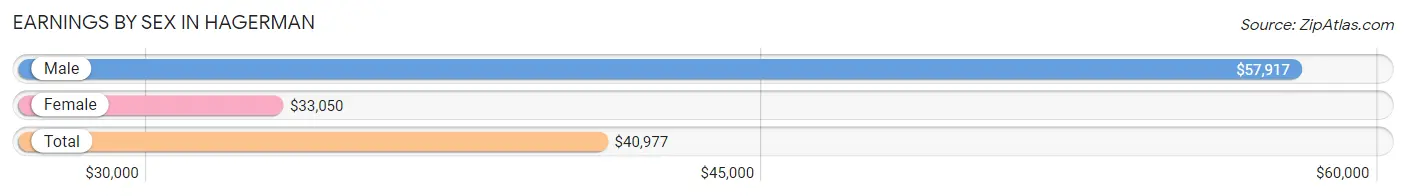
| Sex | Number | Average Earnings |
| Male | 346 (64.4%) | $57,917 |
| Female | 191 (35.6%) | $33,050 |
| Total | 537 (100.0%) | $40,977 |
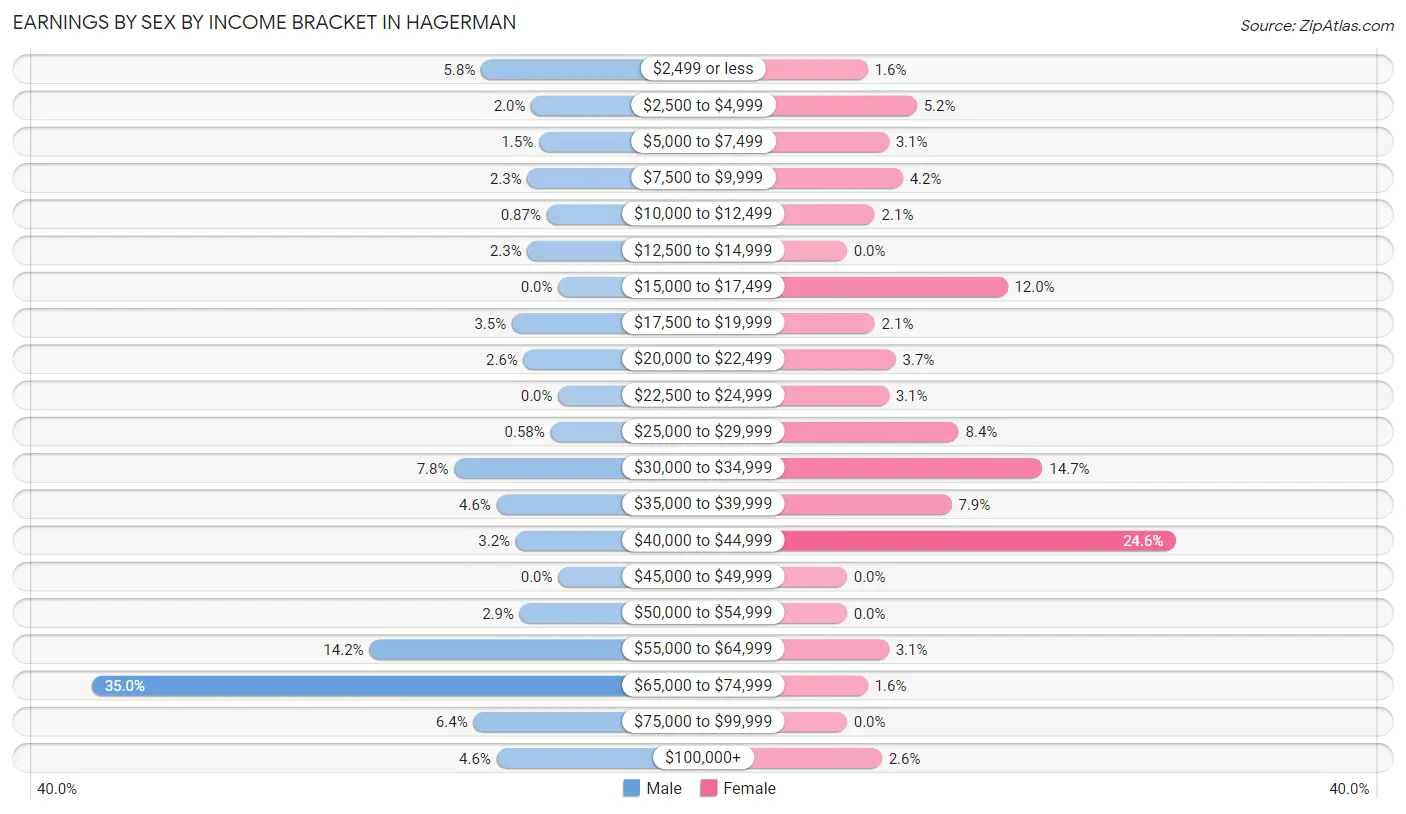
Earnings by Sex by Income Bracket in Hagerman
The most common earnings brackets in Hagerman are $65,000 to $74,999 for men (121 | 35.0%) and $40,000 to $44,999 for women (47 | 24.6%).
| Income | Male | Female |
| $2,499 or less | 20 (5.8%) | 3 (1.6%) |
| $2,500 to $4,999 | 7 (2.0%) | 10 (5.2%) |
| $5,000 to $7,499 | 5 (1.5%) | 6 (3.1%) |
| $7,500 to $9,999 | 8 (2.3%) | 8 (4.2%) |
| $10,000 to $12,499 | 3 (0.9%) | 4 (2.1%) |
| $12,500 to $14,999 | 8 (2.3%) | 0 (0.0%) |
| $15,000 to $17,499 | 0 (0.0%) | 23 (12.0%) |
| $17,500 to $19,999 | 12 (3.5%) | 4 (2.1%) |
| $20,000 to $22,499 | 9 (2.6%) | 7 (3.7%) |
| $22,500 to $24,999 | 0 (0.0%) | 6 (3.1%) |
| $25,000 to $29,999 | 2 (0.6%) | 16 (8.4%) |
| $30,000 to $34,999 | 27 (7.8%) | 28 (14.7%) |
| $35,000 to $39,999 | 16 (4.6%) | 15 (7.9%) |
| $40,000 to $44,999 | 11 (3.2%) | 47 (24.6%) |
| $45,000 to $49,999 | 0 (0.0%) | 0 (0.0%) |
| $50,000 to $54,999 | 10 (2.9%) | 0 (0.0%) |
| $55,000 to $64,999 | 49 (14.2%) | 6 (3.1%) |
| $65,000 to $74,999 | 121 (35.0%) | 3 (1.6%) |
| $75,000 to $99,999 | 22 (6.4%) | 0 (0.0%) |
| $100,000+ | 16 (4.6%) | 5 (2.6%) |
| Total | 346 (100.0%) | 191 (100.0%) |
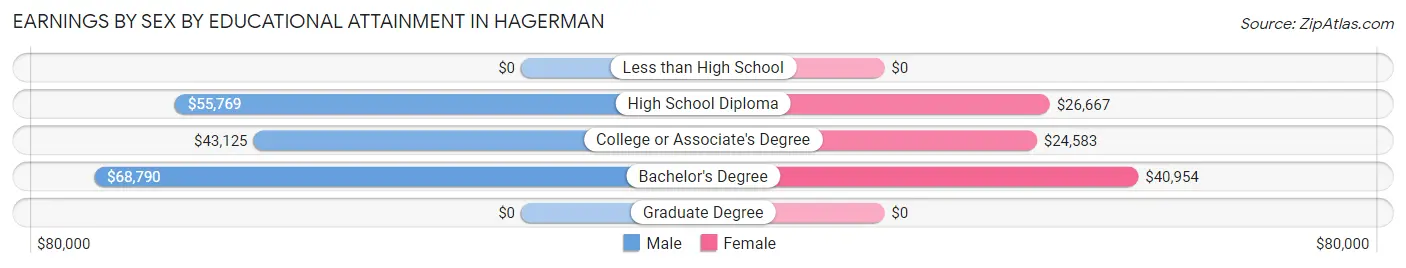
Earnings by Sex by Educational Attainment in Hagerman
Average earnings in Hagerman are $61,250 for men and $34,100 for women, a difference of 44.3%. Men with an educational attainment of bachelor's degree enjoy the highest average annual earnings of $68,790, while those with college or associate's degree education earn the least with $43,125. Women with an educational attainment of bachelor's degree earn the most with the average annual earnings of $40,954, while those with college or associate's degree education have the smallest earnings of $24,583.
| Educational Attainment | Male Income | Female Income |
| Less than High School | - | - |
| High School Diploma | $55,769 | $26,667 |
| College or Associate's Degree | $43,125 | $24,583 |
| Bachelor's Degree | $68,790 | $40,954 |
| Graduate Degree | - | - |
| Total | $61,250 | $34,100 |
Family Income in Hagerman
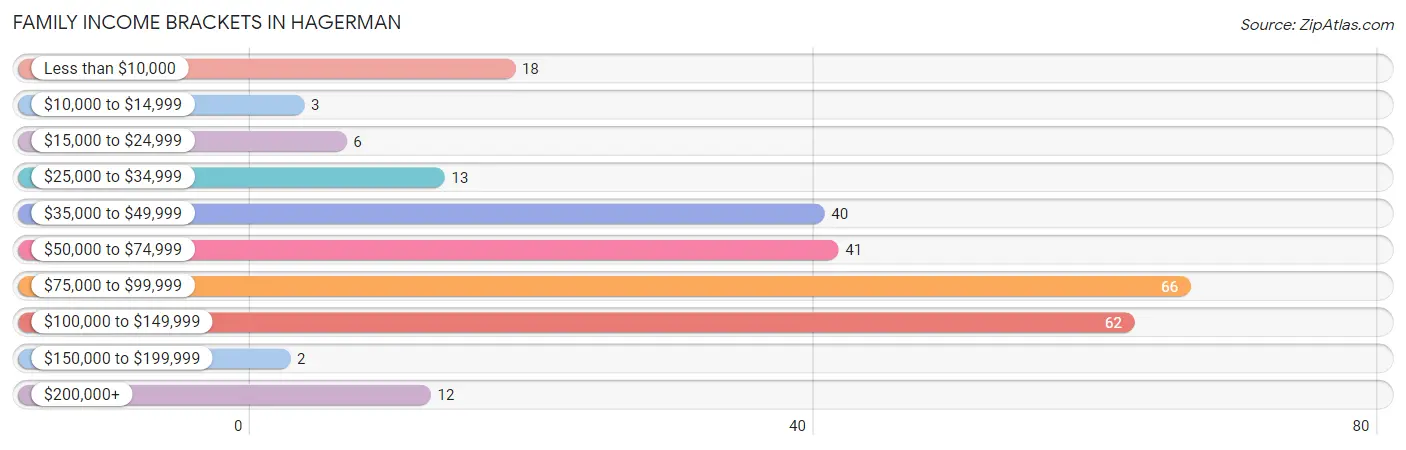
Family Income Brackets in Hagerman
According to the Hagerman family income data, there are 66 families falling into the $75,000 to $99,999 income range, which is the most common income bracket and makes up 25.1% of all families. Conversely, the $150,000 to $199,999 income bracket is the least frequent group with only 2 families (0.8%) belonging to this category.
| Income Bracket | # Families | % Families |
| Less than $10,000 | 18 | 6.8% |
| $10,000 to $14,999 | 3 | 1.1% |
| $15,000 to $24,999 | 6 | 2.3% |
| $25,000 to $34,999 | 13 | 4.9% |
| $35,000 to $49,999 | 40 | 15.2% |
| $50,000 to $74,999 | 41 | 15.6% |
| $75,000 to $99,999 | 66 | 25.1% |
| $100,000 to $149,999 | 62 | 23.6% |
| $150,000 to $199,999 | 2 | 0.8% |
| $200,000+ | 12 | 4.6% |
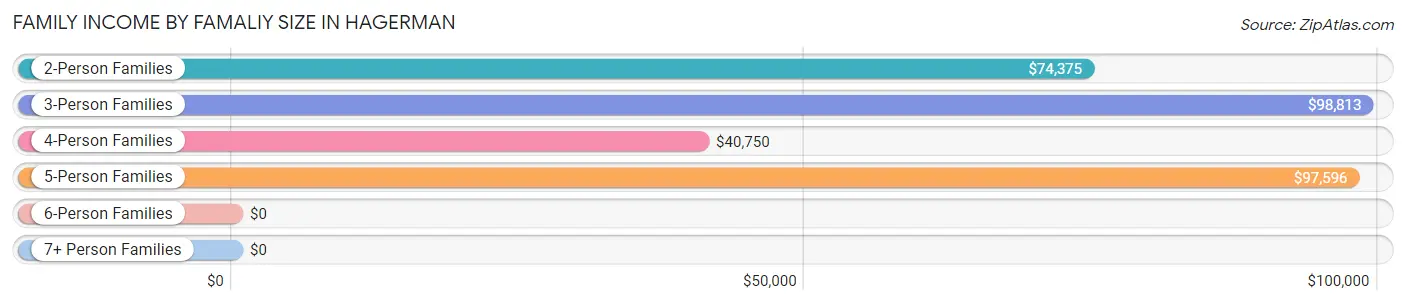
Family Income by Famaliy Size in Hagerman
3-person families (101 | 38.4%) account for the highest median family income in Hagerman with $98,813 per family, while 2-person families (117 | 44.5%) have the highest median income of $37,188 per family member.
| Income Bracket | # Families | Median Income |
| 2-Person Families | 117 (44.5%) | $74,375 |
| 3-Person Families | 101 (38.4%) | $98,813 |
| 4-Person Families | 16 (6.1%) | $40,750 |
| 5-Person Families | 25 (9.5%) | $97,596 |
| 6-Person Families | 4 (1.5%) | $0 |
| 7+ Person Families | 0 (0.0%) | $0 |
| Total | 263 (100.0%) | $82,321 |
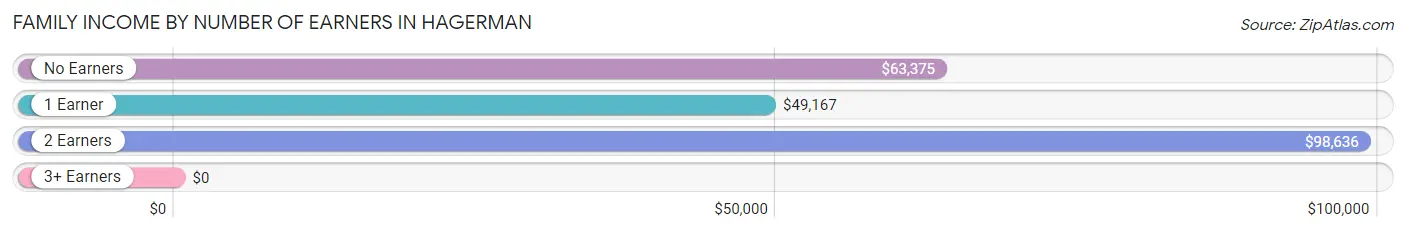
Family Income by Number of Earners in Hagerman
| Number of Earners | # Families | Median Income |
| No Earners | 71 (27.0%) | $63,375 |
| 1 Earner | 58 (22.1%) | $49,167 |
| 2 Earners | 124 (47.1%) | $98,636 |
| 3+ Earners | 10 (3.8%) | $0 |
| Total | 263 (100.0%) | $82,321 |
Household Income in Hagerman
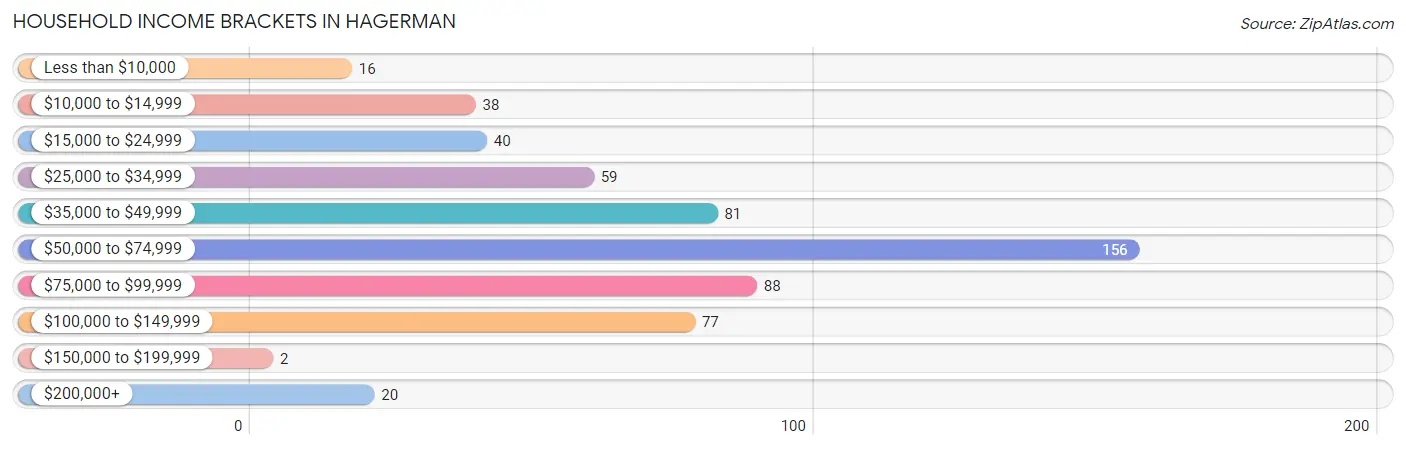
Household Income Brackets in Hagerman
With 156 households falling in the category, the $50,000 to $74,999 income range is the most frequent in Hagerman, accounting for 27.0% of all households. In contrast, only 2 households (0.4%) fall into the $150,000 to $199,999 income bracket, making it the least populous group.
| Income Bracket | # Households | % Households |
| Less than $10,000 | 16 | 2.8% |
| $10,000 to $14,999 | 38 | 6.6% |
| $15,000 to $24,999 | 40 | 6.9% |
| $25,000 to $34,999 | 59 | 10.2% |
| $35,000 to $49,999 | 81 | 14.0% |
| $50,000 to $74,999 | 156 | 27.0% |
| $75,000 to $99,999 | 88 | 15.3% |
| $100,000 to $149,999 | 77 | 13.3% |
| $150,000 to $199,999 | 2 | 0.3% |
| $200,000+ | 20 | 3.5% |
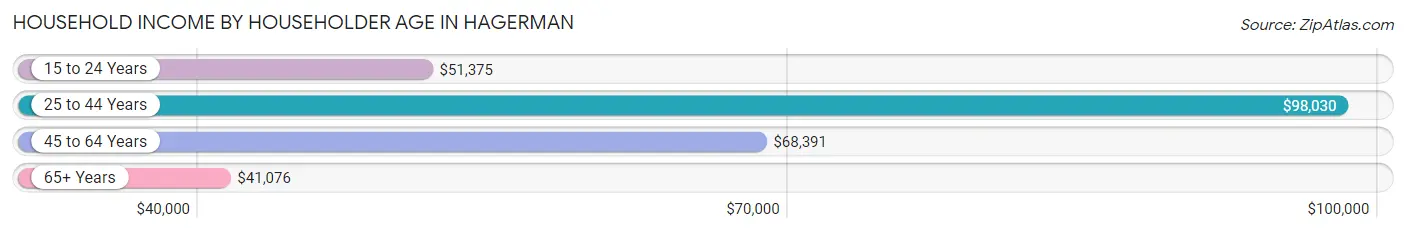
Household Income by Householder Age in Hagerman
The median household income in Hagerman is $66,250, with the highest median household income of $98,030 found in the 25 to 44 years age bracket for the primary householder. A total of 142 households (24.6%) fall into this category. Meanwhile, the 65+ years age bracket for the primary householder has the lowest median household income of $41,076, with 231 households (40.0%) in this group.
| Income Bracket | # Households | Median Income |
| 15 to 24 Years | 13 (2.2%) | $51,375 |
| 25 to 44 Years | 142 (24.6%) | $98,030 |
| 45 to 64 Years | 191 (33.1%) | $68,391 |
| 65+ Years | 231 (40.0%) | $41,076 |
| Total | 577 (100.0%) | $66,250 |
Poverty in Hagerman
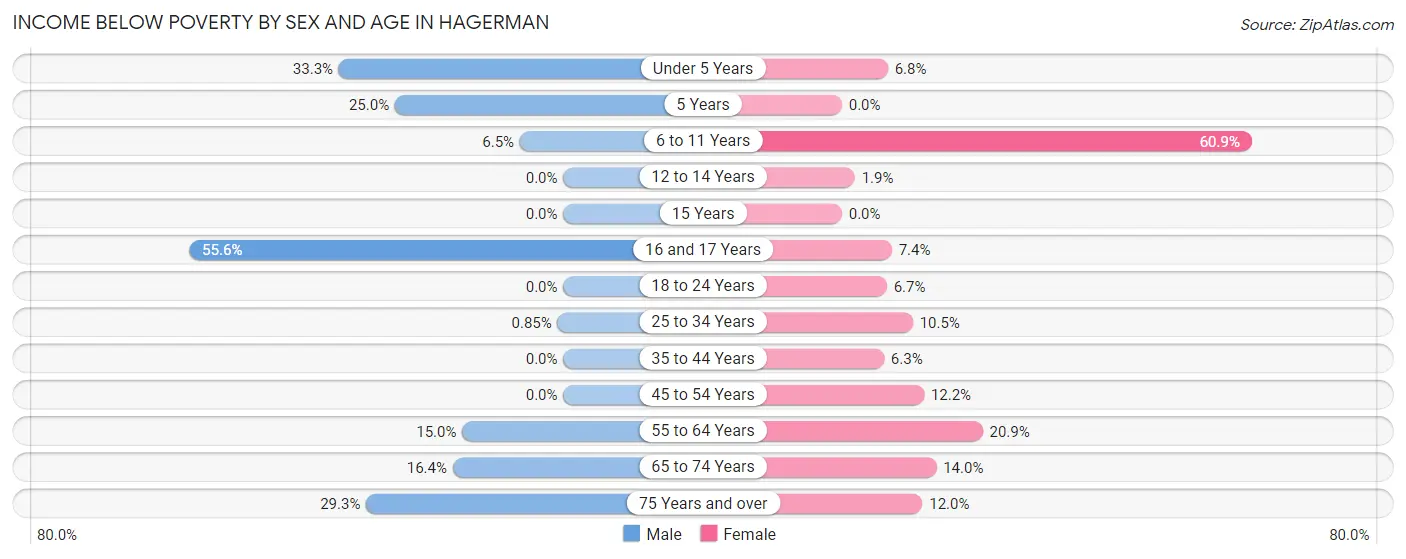
Income Below Poverty by Sex and Age in Hagerman
With 10.0% poverty level for males and 13.1% for females among the residents of Hagerman, 16 and 17 year old males and 6 to 11 year old females are the most vulnerable to poverty, with 5 males (55.6%) and 14 females (60.9%) in their respective age groups living below the poverty level.
| Age Bracket | Male | Female |
| Under 5 Years | 6 (33.3%) | 3 (6.8%) |
| 5 Years | 2 (25.0%) | 0 (0.0%) |
| 6 to 11 Years | 2 (6.5%) | 14 (60.9%) |
| 12 to 14 Years | 0 (0.0%) | 1 (1.9%) |
| 15 Years | 0 (0.0%) | 0 (0.0%) |
| 16 and 17 Years | 5 (55.6%) | 2 (7.4%) |
| 18 to 24 Years | 0 (0.0%) | 1 (6.7%) |
| 25 to 34 Years | 1 (0.9%) | 6 (10.5%) |
| 35 to 44 Years | 0 (0.0%) | 3 (6.2%) |
| 45 to 54 Years | 0 (0.0%) | 5 (12.2%) |
| 55 to 64 Years | 9 (15.0%) | 14 (20.9%) |
| 65 to 74 Years | 11 (16.4%) | 15 (14.0%) |
| 75 Years and over | 24 (29.3%) | 11 (12.0%) |
| Total | 60 (10.0%) | 75 (13.1%) |
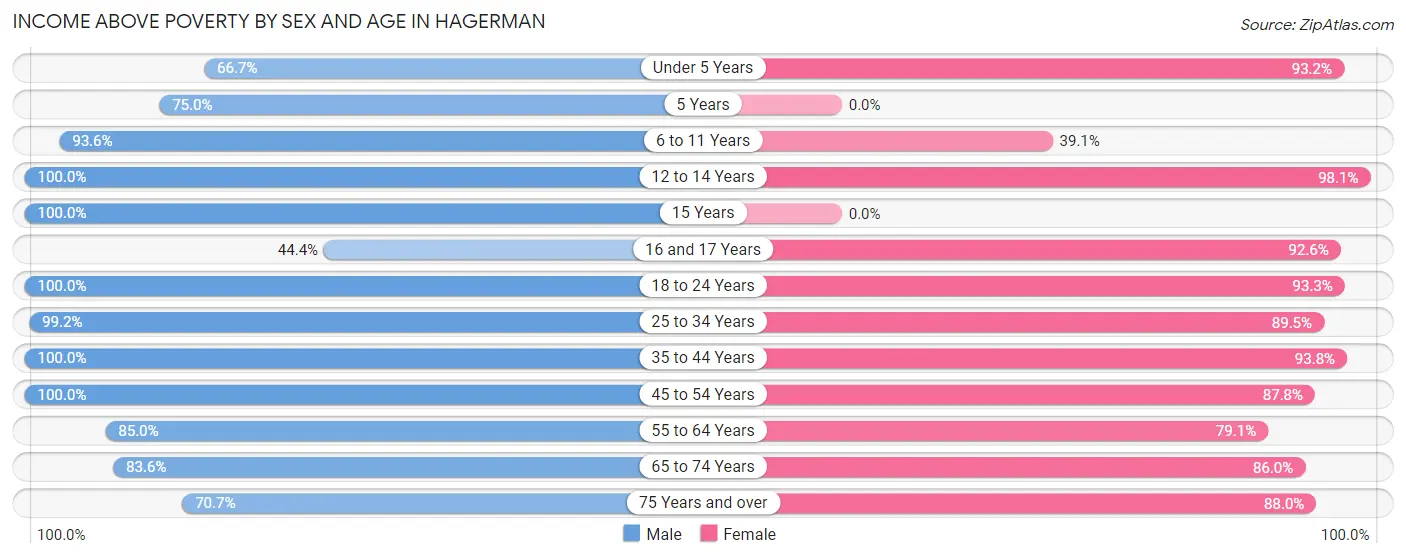
Income Above Poverty by Sex and Age in Hagerman
According to the poverty statistics in Hagerman, males aged 12 to 14 years and females aged 12 to 14 years are the age groups that are most secure financially, with 100.0% of males and 98.1% of females in these age groups living above the poverty line.
| Age Bracket | Male | Female |
| Under 5 Years | 12 (66.7%) | 41 (93.2%) |
| 5 Years | 6 (75.0%) | 0 (0.0%) |
| 6 to 11 Years | 29 (93.5%) | 9 (39.1%) |
| 12 to 14 Years | 7 (100.0%) | 51 (98.1%) |
| 15 Years | 21 (100.0%) | 0 (0.0%) |
| 16 and 17 Years | 4 (44.4%) | 25 (92.6%) |
| 18 to 24 Years | 10 (100.0%) | 14 (93.3%) |
| 25 to 34 Years | 116 (99.2%) | 51 (89.5%) |
| 35 to 44 Years | 58 (100.0%) | 45 (93.8%) |
| 45 to 54 Years | 115 (100.0%) | 36 (87.8%) |
| 55 to 64 Years | 51 (85.0%) | 53 (79.1%) |
| 65 to 74 Years | 56 (83.6%) | 92 (86.0%) |
| 75 Years and over | 58 (70.7%) | 81 (88.0%) |
| Total | 543 (90.0%) | 498 (86.9%) |
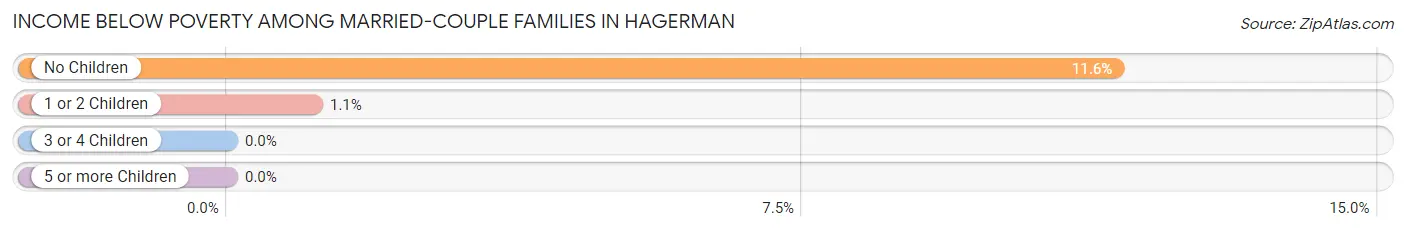
Income Below Poverty Among Married-Couple Families in Hagerman
The poverty statistics for married-couple families in Hagerman show that 6.4% or 15 of the total 233 families live below the poverty line. Families with no children have the highest poverty rate of 11.6%, comprising of 14 families. On the other hand, families with 3 or 4 children have the lowest poverty rate of 0.0%, which includes 0 families.
| Children | Above Poverty | Below Poverty |
| No Children | 107 (88.4%) | 14 (11.6%) |
| 1 or 2 Children | 89 (98.9%) | 1 (1.1%) |
| 3 or 4 Children | 22 (100.0%) | 0 (0.0%) |
| 5 or more Children | 0 (0.0%) | 0 (0.0%) |
| Total | 218 (93.6%) | 15 (6.4%) |
Income Below Poverty Among Single-Parent Households in Hagerman
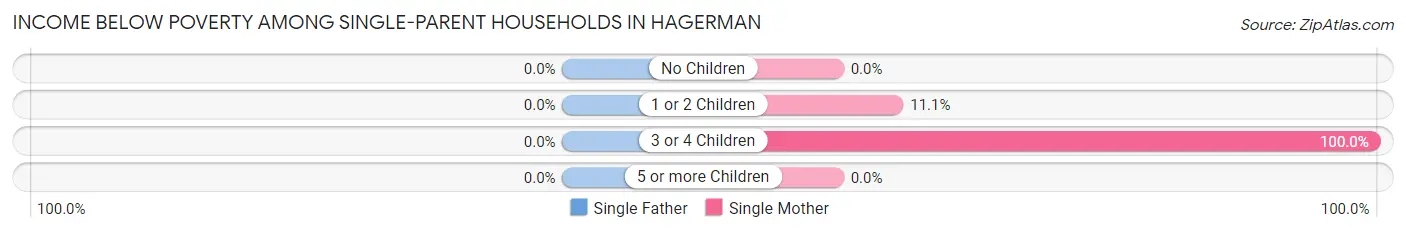
| Children | Single Father | Single Mother |
| No Children | 0 (0.0%) | 0 (0.0%) |
| 1 or 2 Children | 0 (0.0%) | 2 (11.1%) |
| 3 or 4 Children | 0 (0.0%) | 7 (100.0%) |
| 5 or more Children | 0 (0.0%) | 0 (0.0%) |
| Total | 0 (0.0%) | 9 (36.0%) |
Income Below Poverty Among Married-Couple vs Single-Parent Households in Hagerman
The poverty data for Hagerman shows that 15 of the married-couple family households (6.4%) and 9 of the single-parent households (30.0%) are living below the poverty level. Within the married-couple family households, those with no children have the highest poverty rate, with 14 households (11.6%) falling below the poverty line. Among the single-parent households, those with 3 or 4 children have the highest poverty rate, with 7 household (100.0%) living below poverty.
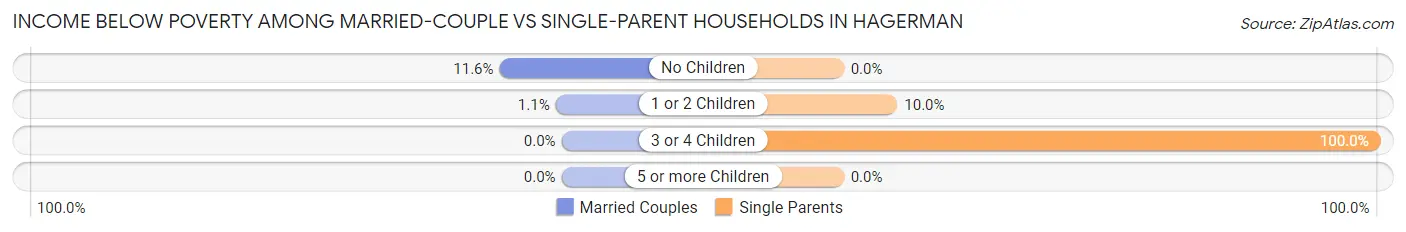
| Children | Married-Couple Families | Single-Parent Households |
| No Children | 14 (11.6%) | 0 (0.0%) |
| 1 or 2 Children | 1 (1.1%) | 2 (10.0%) |
| 3 or 4 Children | 0 (0.0%) | 7 (100.0%) |
| 5 or more Children | 0 (0.0%) | 0 (0.0%) |
| Total | 15 (6.4%) | 9 (30.0%) |
Race in Hagerman
The most populous races in Hagerman are White / Caucasian (1,130 | 94.3%), Hispanic or Latino (179 | 14.9%), and Two or more Races (49 | 4.1%).
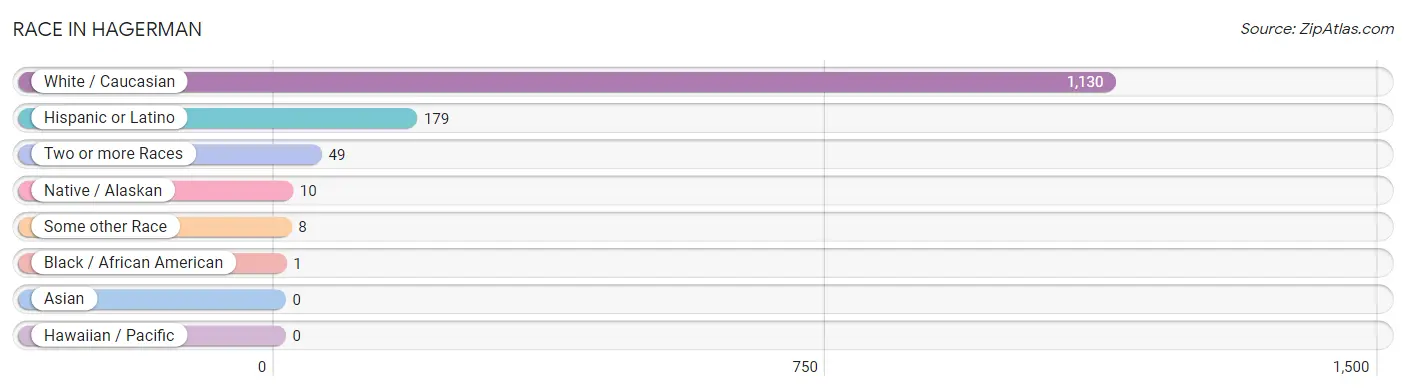
| Race | # Population | % Population |
| Asian | 0 | 0.0% |
| Black / African American | 1 | 0.1% |
| Hawaiian / Pacific | 0 | 0.0% |
| Hispanic or Latino | 179 | 14.9% |
| Native / Alaskan | 10 | 0.8% |
| White / Caucasian | 1,130 | 94.3% |
| Two or more Races | 49 | 4.1% |
| Some other Race | 8 | 0.7% |
| Total | 1,198 | 100.0% |
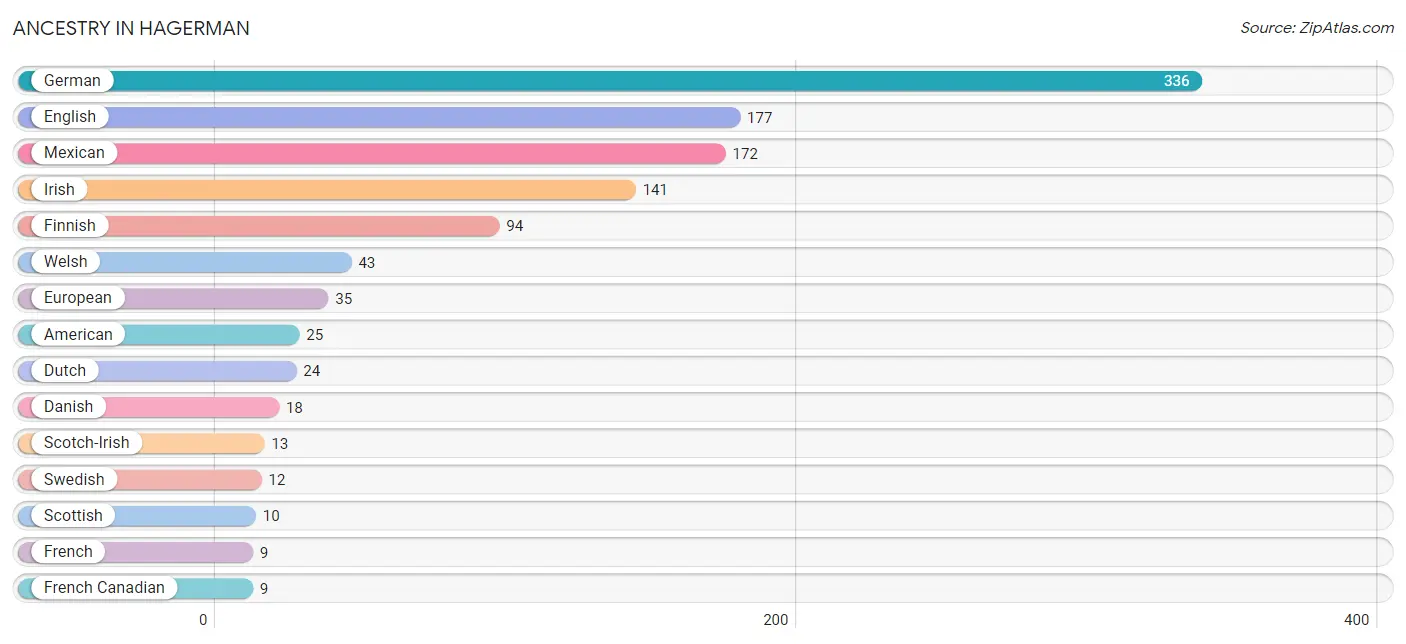
Ancestry in Hagerman
The most populous ancestries reported in Hagerman are German (336 | 28.1%), English (177 | 14.8%), Mexican (172 | 14.4%), Irish (141 | 11.8%), and Finnish (94 | 7.9%), together accounting for 76.8% of all Hagerman residents.
| Ancestry | # Population | % Population |
| American | 25 | 2.1% |
| Bhutanese | 6 | 0.5% |
| Chickasaw | 2 | 0.2% |
| Czech | 5 | 0.4% |
| Danish | 18 | 1.5% |
| Dutch | 24 | 2.0% |
| English | 177 | 14.8% |
| European | 35 | 2.9% |
| Finnish | 94 | 7.9% |
| French | 9 | 0.7% |
| French Canadian | 9 | 0.7% |
| German | 336 | 28.1% |
| Irish | 141 | 11.8% |
| Italian | 8 | 0.7% |
| Mexican | 172 | 14.4% |
| Norwegian | 9 | 0.7% |
| Romanian | 1 | 0.1% |
| Scotch-Irish | 13 | 1.1% |
| Scottish | 10 | 0.8% |
| Shoshone | 2 | 0.2% |
| Swedish | 12 | 1.0% |
| Welsh | 43 | 3.6% | View All 22 Rows |
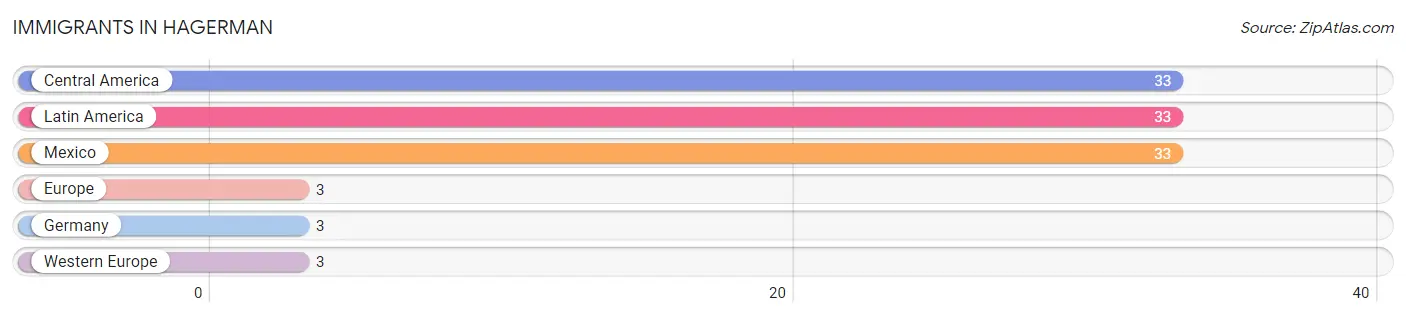
Immigrants in Hagerman
The most numerous immigrant groups reported in Hagerman came from Central America (33 | 2.8%), Latin America (33 | 2.8%), Mexico (33 | 2.8%), Europe (3 | 0.3%), and Germany (3 | 0.3%), together accounting for 8.8% of all Hagerman residents.
| Immigration Origin | # Population | % Population |
| Central America | 33 | 2.8% |
| Europe | 3 | 0.3% |
| Germany | 3 | 0.3% |
| Latin America | 33 | 2.8% |
| Mexico | 33 | 2.8% |
| Western Europe | 3 | 0.3% | View All 6 Rows |
Sex and Age in Hagerman
Sex and Age in Hagerman
The most populous age groups in Hagerman are 50 to 54 Years (107 | 17.2%) for men and 10 to 14 Years (70 | 12.2%) for women.
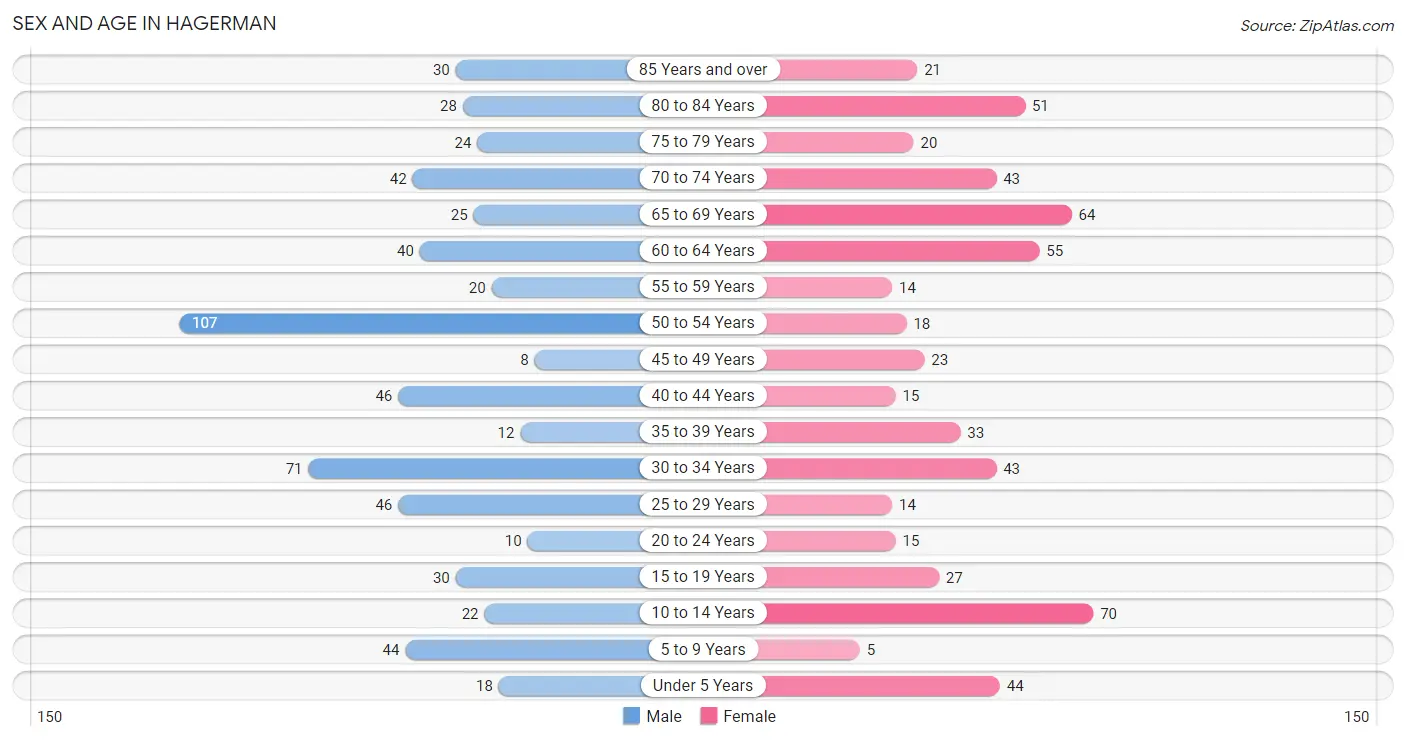
| Age Bracket | Male | Female |
| Under 5 Years | 18 (2.9%) | 44 (7.6%) |
| 5 to 9 Years | 44 (7.1%) | 5 (0.9%) |
| 10 to 14 Years | 22 (3.5%) | 70 (12.2%) |
| 15 to 19 Years | 30 (4.8%) | 27 (4.7%) |
| 20 to 24 Years | 10 (1.6%) | 15 (2.6%) |
| 25 to 29 Years | 46 (7.4%) | 14 (2.4%) |
| 30 to 34 Years | 71 (11.4%) | 43 (7.5%) |
| 35 to 39 Years | 12 (1.9%) | 33 (5.7%) |
| 40 to 44 Years | 46 (7.4%) | 15 (2.6%) |
| 45 to 49 Years | 8 (1.3%) | 23 (4.0%) |
| 50 to 54 Years | 107 (17.2%) | 18 (3.1%) |
| 55 to 59 Years | 20 (3.2%) | 14 (2.4%) |
| 60 to 64 Years | 40 (6.4%) | 55 (9.6%) |
| 65 to 69 Years | 25 (4.0%) | 64 (11.1%) |
| 70 to 74 Years | 42 (6.7%) | 43 (7.5%) |
| 75 to 79 Years | 24 (3.8%) | 20 (3.5%) |
| 80 to 84 Years | 28 (4.5%) | 51 (8.9%) |
| 85 Years and over | 30 (4.8%) | 21 (3.6%) |
| Total | 623 (100.0%) | 575 (100.0%) |
Families and Households in Hagerman
Median Family Size in Hagerman
The median family size in Hagerman is 2.90 persons per family, with single female/mother families (25 | 9.5%) accounting for the largest median family size of 3.56 persons per family. On the other hand, single male/father families (5 | 1.9%) represent the smallest median family size with 2.00 persons per family.
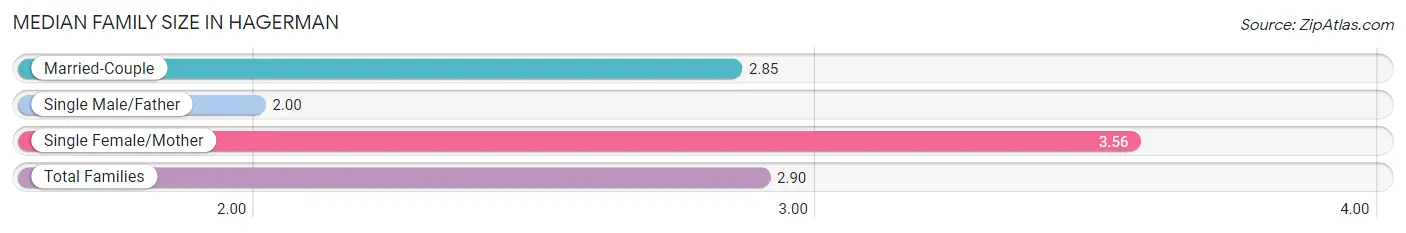
| Family Type | # Families | Family Size |
| Married-Couple | 233 (88.6%) | 2.85 |
| Single Male/Father | 5 (1.9%) | 2.00 |
| Single Female/Mother | 25 (9.5%) | 3.56 |
| Total Families | 263 (100.0%) | 2.90 |
Median Household Size in Hagerman
The median household size in Hagerman is 2.04 persons per household, with single female/mother households (25 | 4.3%) accounting for the largest median household size of 4.56 persons per household. non-family households (314 | 54.4%) represent the smallest median household size with 1.24 persons per household.
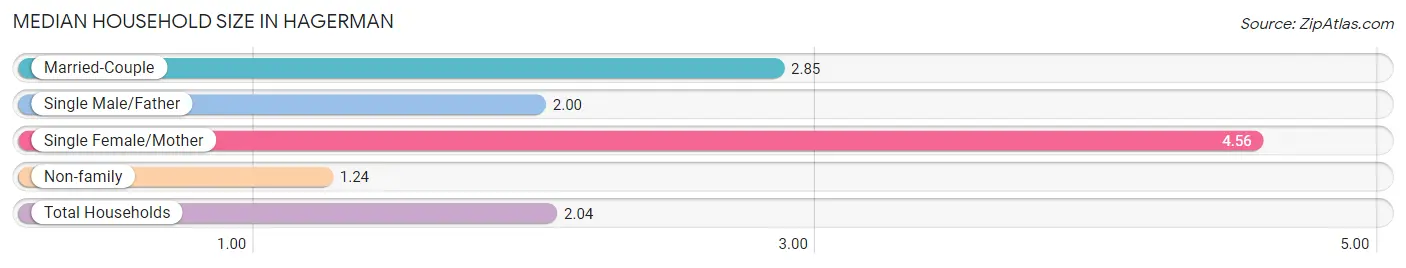
| Household Type | # Households | Household Size |
| Married-Couple | 233 (40.4%) | 2.85 |
| Single Male/Father | 5 (0.9%) | 2.00 |
| Single Female/Mother | 25 (4.3%) | 4.56 |
| Non-family | 314 (54.4%) | 1.24 |
| Total Households | 577 (100.0%) | 2.04 |
Household Size by Marriage Status in Hagerman
Out of a total of 577 households in Hagerman, 263 (45.6%) are family households, while 314 (54.4%) are nonfamily households. The most numerous type of family households are 2-person households, comprising 116, and the most common type of nonfamily households are 1-person households, comprising 275.
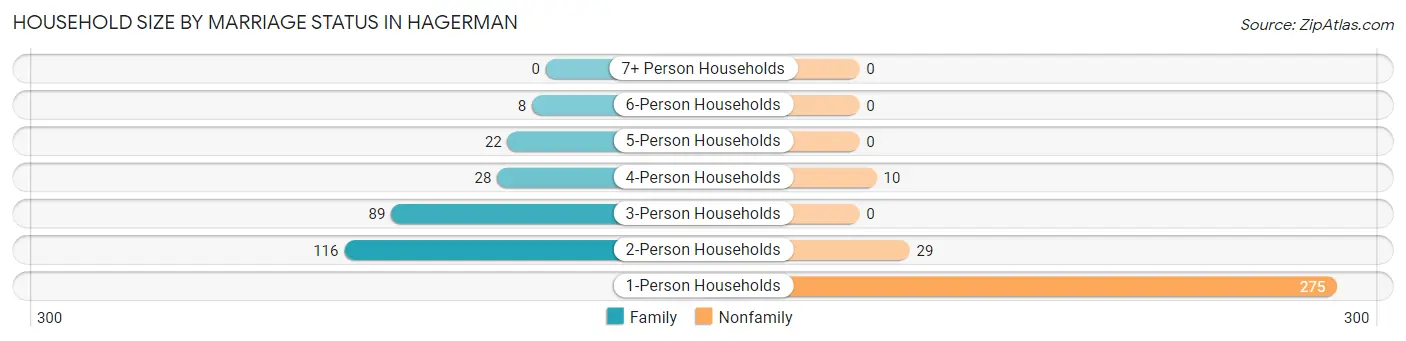
| Household Size | Family Households | Nonfamily Households |
| 1-Person Households | - | 275 (47.7%) |
| 2-Person Households | 116 (20.1%) | 29 (5.0%) |
| 3-Person Households | 89 (15.4%) | 0 (0.0%) |
| 4-Person Households | 28 (4.9%) | 10 (1.7%) |
| 5-Person Households | 22 (3.8%) | 0 (0.0%) |
| 6-Person Households | 8 (1.4%) | 0 (0.0%) |
| 7+ Person Households | 0 (0.0%) | 0 (0.0%) |
| Total | 263 (45.6%) | 314 (54.4%) |
Female Fertility in Hagerman
Fertility by Age in Hagerman
Average fertility rate in Hagerman is 120.0 births per 1,000 women. Women in the age bracket of 20 to 34 years have the highest fertility rate with 292.0 births per 1,000 women. Women in the age bracket of 20 to 34 years acount for 100.0% of all women with births.
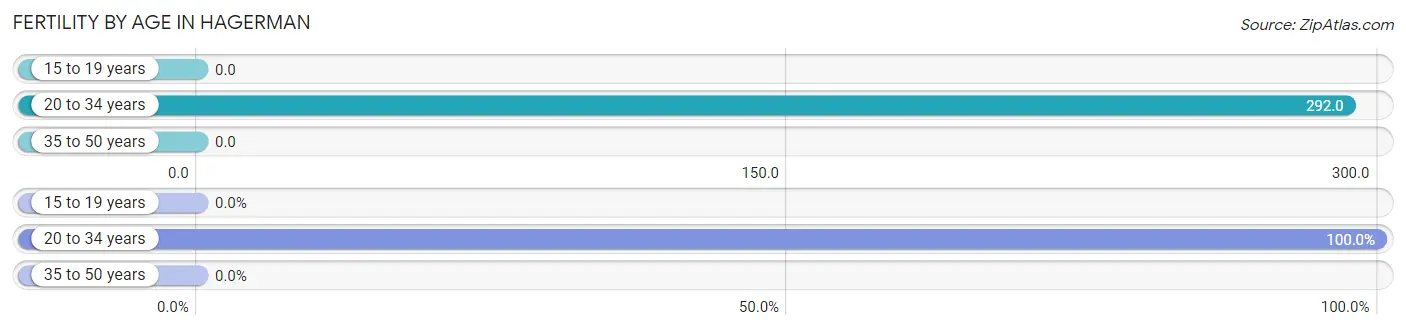
| Age Bracket | Women with Births | Births / 1,000 Women |
| 15 to 19 years | 0 (0.0%) | 0.0 |
| 20 to 34 years | 21 (100.0%) | 292.0 |
| 35 to 50 years | 0 (0.0%) | 0.0 |
| Total | 21 (100.0%) | 120.0 |
Fertility by Age by Marriage Status in Hagerman
95.2% of women with births (21) in Hagerman are married. The highest percentage of unmarried women with births falls into 20 to 34 years age bracket with 4.8% of them unmarried at the time of birth, while the lowest percentage of unmarried women with births belong to 20 to 34 years age bracket with 4.8% of them unmarried.
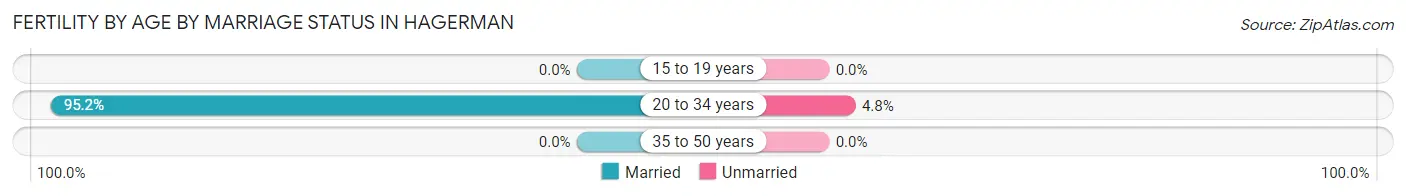
| Age Bracket | Married | Unmarried |
| 15 to 19 years | 0 (0.0%) | 0 (0.0%) |
| 20 to 34 years | 20 (95.2%) | 1 (4.8%) |
| 35 to 50 years | 0 (0.0%) | 0 (0.0%) |
| Total | 20 (95.2%) | 1 (4.8%) |
Fertility by Education in Hagerman
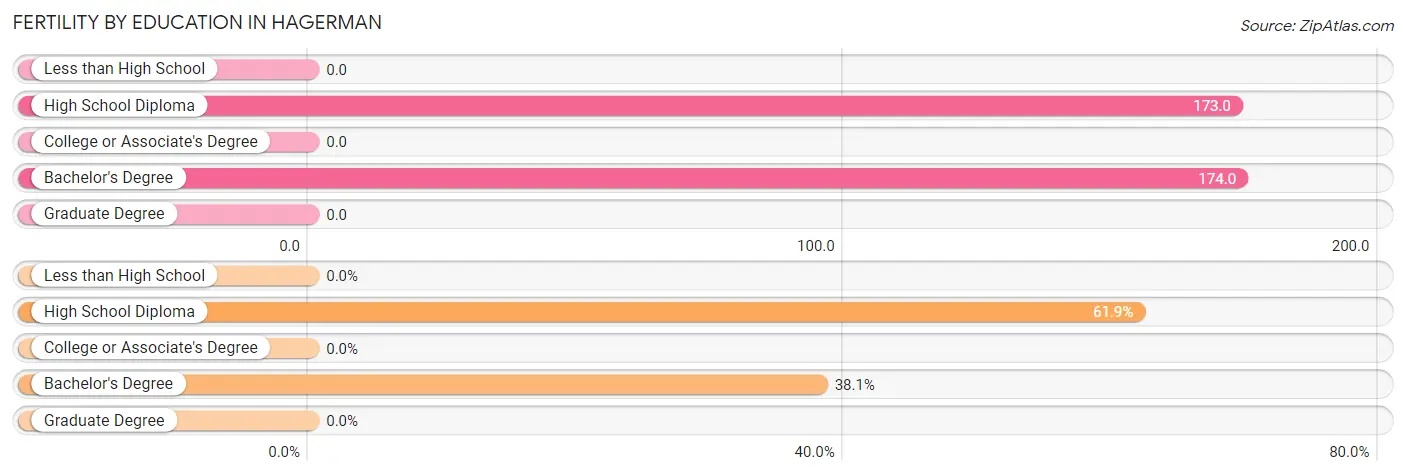
| Educational Attainment | Women with Births | Births / 1,000 Women |
| Less than High School | 0 (0.0%) | 0.0 |
| High School Diploma | 13 (61.9%) | 173.0 |
| College or Associate's Degree | 0 (0.0%) | 0.0 |
| Bachelor's Degree | 8 (38.1%) | 174.0 |
| Graduate Degree | 0 (0.0%) | 0.0 |
| Total | 21 (100.0%) | 120.0 |
Fertility by Education by Marriage Status in Hagerman
4.8% of women with births in Hagerman are unmarried. Women with the educational attainment of bachelor's degree are most likely to be married with 100.0% of them married at childbirth, while women with the educational attainment of high school diploma are least likely to be married with 7.7% of them unmarried at childbirth.
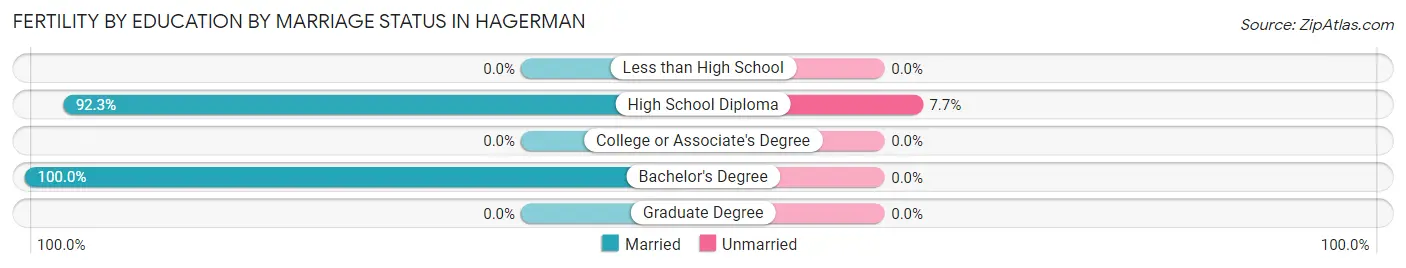
| Educational Attainment | Married | Unmarried |
| Less than High School | 0 (0.0%) | 0 (0.0%) |
| High School Diploma | 12 (92.3%) | 1 (7.7%) |
| College or Associate's Degree | 0 (0.0%) | 0 (0.0%) |
| Bachelor's Degree | 8 (100.0%) | 0 (0.0%) |
| Graduate Degree | 0 (0.0%) | 0 (0.0%) |
| Total | 20 (95.2%) | 1 (4.8%) |
Employment Characteristics in Hagerman
Employment by Class of Employer in Hagerman
Among the 468 employed individuals in Hagerman, private company employees (258 | 55.1%), federal government employees (94 | 20.1%), and state government employees (48 | 10.3%) make up the most common classes of employment.
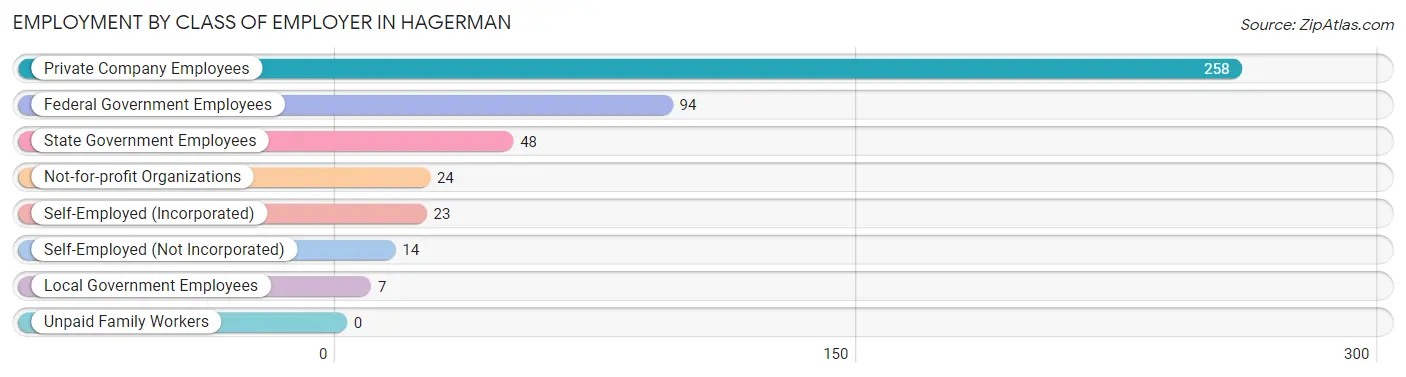
| Employer Class | # Employees | % Employees |
| Private Company Employees | 258 | 55.1% |
| Self-Employed (Incorporated) | 23 | 4.9% |
| Self-Employed (Not Incorporated) | 14 | 3.0% |
| Not-for-profit Organizations | 24 | 5.1% |
| Local Government Employees | 7 | 1.5% |
| State Government Employees | 48 | 10.3% |
| Federal Government Employees | 94 | 20.1% |
| Unpaid Family Workers | 0 | 0.0% |
| Total | 468 | 100.0% |
Employment Status by Age in Hagerman
According to the labor force statistics for Hagerman, out of the total population over 16 years of age (974), 50.5% or 492 individuals are in the labor force, with 2.0% or 10 of them unemployed. The age group with the highest labor force participation rate is 35 to 44 years, with 100.0% or 106 individuals in the labor force. Within the labor force, the 35 to 44 years age range has the highest percentage of unemployed individuals, with 5.7% or 6 of them being unemployed.
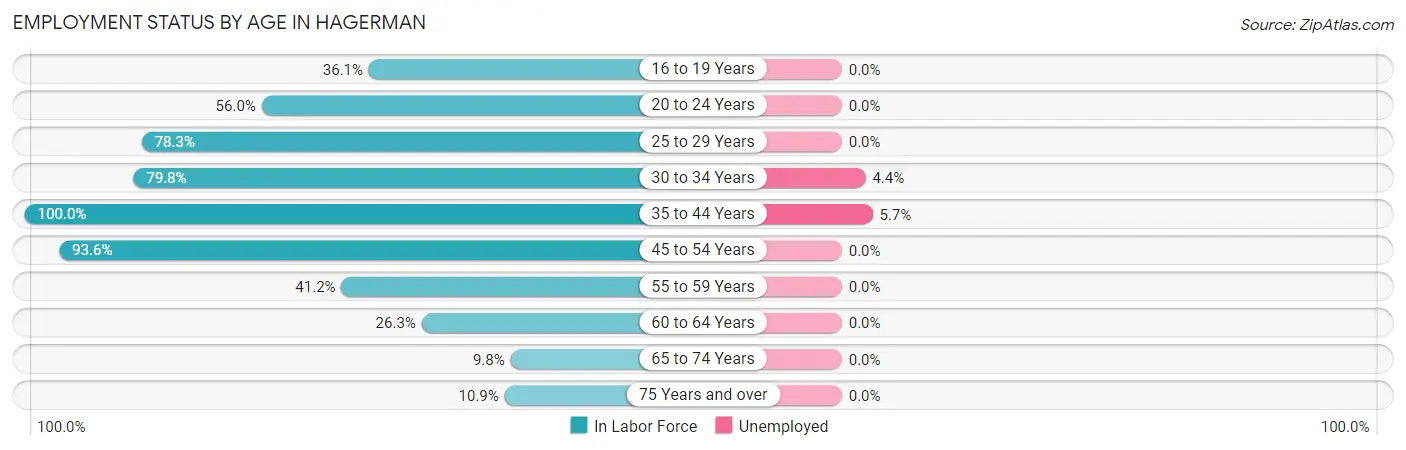
| Age Bracket | In Labor Force | Unemployed |
| 16 to 19 Years | 13 (36.1%) | 0 (0.0%) |
| 20 to 24 Years | 14 (56.0%) | 0 (0.0%) |
| 25 to 29 Years | 47 (78.3%) | 0 (0.0%) |
| 30 to 34 Years | 91 (79.8%) | 4 (4.4%) |
| 35 to 44 Years | 106 (100.0%) | 6 (5.7%) |
| 45 to 54 Years | 146 (93.6%) | 0 (0.0%) |
| 55 to 59 Years | 14 (41.2%) | 0 (0.0%) |
| 60 to 64 Years | 25 (26.3%) | 0 (0.0%) |
| 65 to 74 Years | 17 (9.8%) | 0 (0.0%) |
| 75 Years and over | 19 (10.9%) | 0 (0.0%) |
| Total | 492 (50.5%) | 10 (2.0%) |
Employment Status by Educational Attainment in Hagerman
According to labor force statistics for Hagerman, 75.9% of individuals (429) out of the total population between 25 and 64 years of age (565) are in the labor force, with 2.3% or 10 of them being unemployed. The group with the highest labor force participation rate are those with the educational attainment of bachelor's degree or higher, with 97.6% or 164 individuals in the labor force. Within the labor force, individuals with less than high school education have the highest percentage of unemployment, with 20.0% or 3 of them being unemployed.
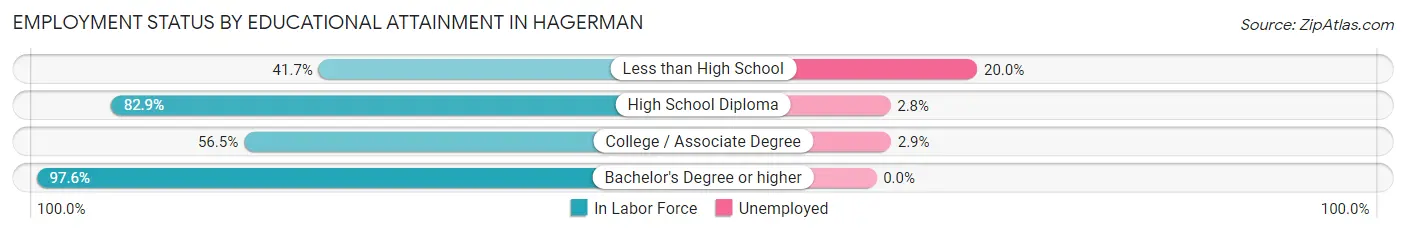
| Educational Attainment | In Labor Force | Unemployed |
| Less than High School | 15 (41.7%) | 7 (20.0%) |
| High School Diploma | 145 (82.9%) | 5 (2.8%) |
| College / Associate Degree | 105 (56.5%) | 5 (2.9%) |
| Bachelor's Degree or higher | 164 (97.6%) | 0 (0.0%) |
| Total | 429 (75.9%) | 13 (2.3%) |
Employment Occupations by Sex in Hagerman
Management, Business, Science and Arts Occupations
The most common Management, Business, Science and Arts occupations in Hagerman are Management (14 | 2.9%), Health Diagnosing & Treating (4 | 0.8%), and Health Technologists (4 | 0.8%).
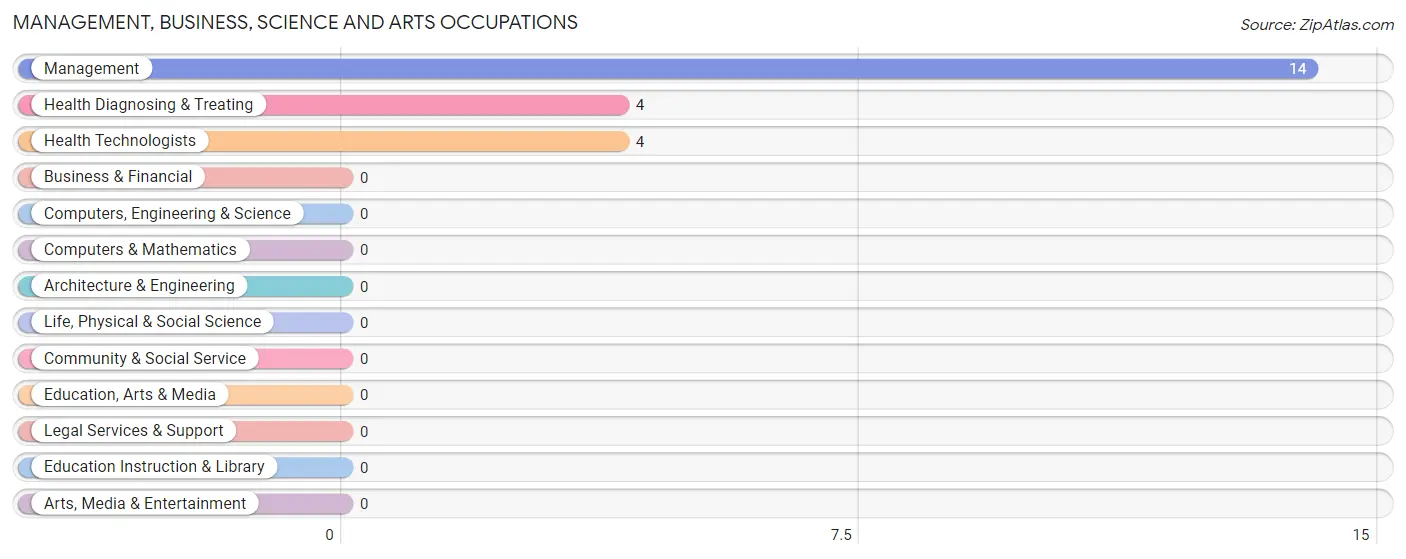
Management, Business, Science and Arts Occupations by Sex
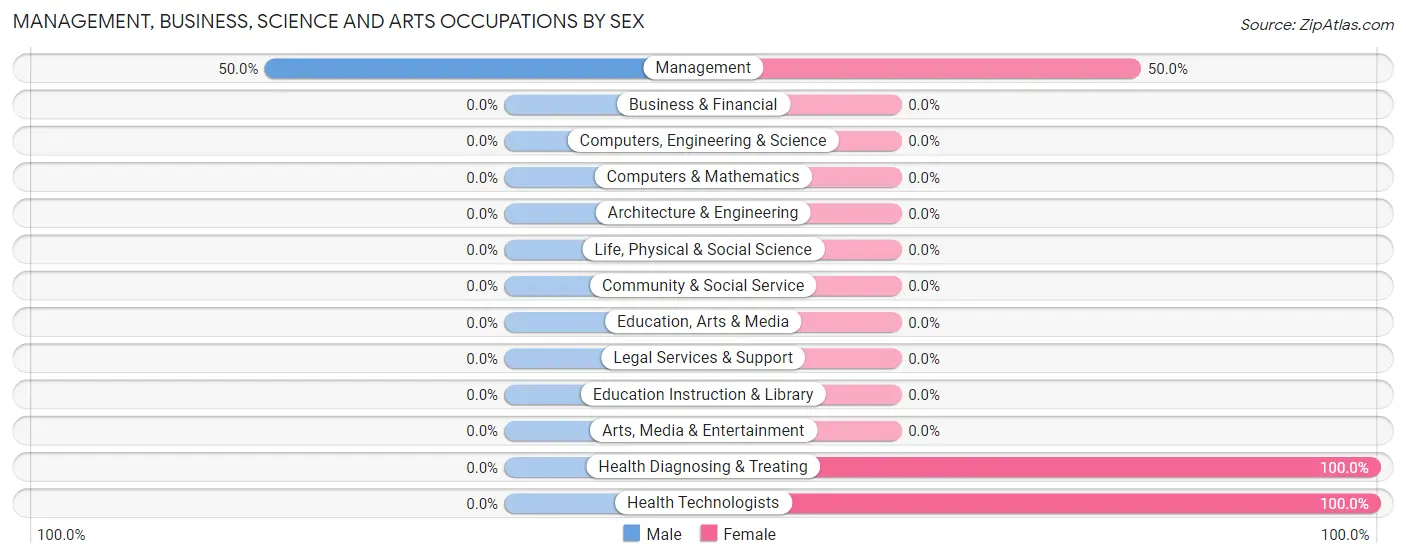
| Occupation | Male | Female |
| Management | 7 (50.0%) | 7 (50.0%) |
| Business & Financial | 0 (0.0%) | 0 (0.0%) |
| Computers, Engineering & Science | 0 (0.0%) | 0 (0.0%) |
| Computers & Mathematics | 0 (0.0%) | 0 (0.0%) |
| Architecture & Engineering | 0 (0.0%) | 0 (0.0%) |
| Life, Physical & Social Science | 0 (0.0%) | 0 (0.0%) |
| Community & Social Service | 0 (0.0%) | 0 (0.0%) |
| Education, Arts & Media | 0 (0.0%) | 0 (0.0%) |
| Legal Services & Support | 0 (0.0%) | 0 (0.0%) |
| Education Instruction & Library | 0 (0.0%) | 0 (0.0%) |
| Arts, Media & Entertainment | 0 (0.0%) | 0 (0.0%) |
| Health Diagnosing & Treating | 0 (0.0%) | 4 (100.0%) |
| Health Technologists | 0 (0.0%) | 4 (100.0%) |
| Total (Category) | 7 (38.9%) | 11 (61.1%) |
| Total (Overall) | 302 (62.7%) | 180 (37.3%) |
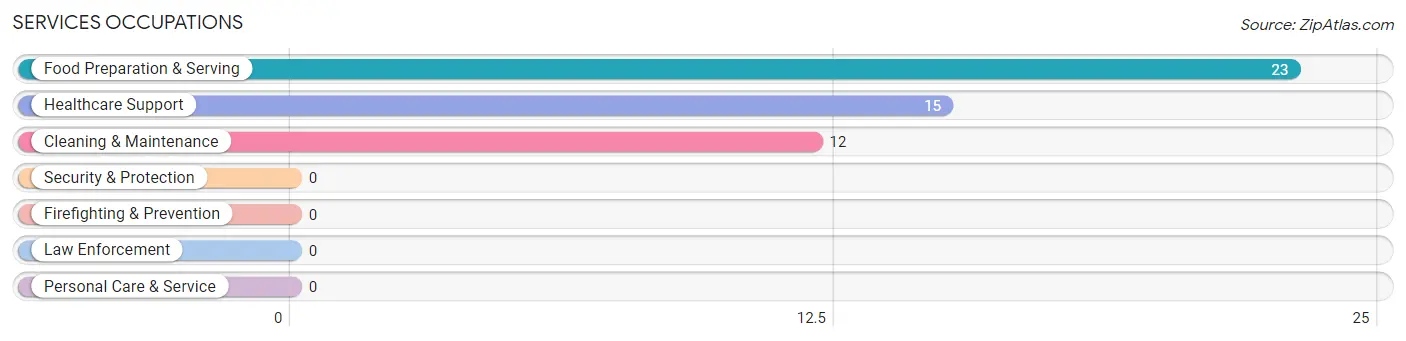
Services Occupations
The most common Services occupations in Hagerman are Food Preparation & Serving (23 | 4.8%), Healthcare Support (15 | 3.1%), and Cleaning & Maintenance (12 | 2.5%).
Services Occupations by Sex
Within the Services occupations in Hagerman, the most male-oriented occupations are Cleaning & Maintenance (58.3%), and Food Preparation & Serving (8.7%), while the most female-oriented occupations are Healthcare Support (100.0%), Food Preparation & Serving (91.3%), and Cleaning & Maintenance (41.7%).
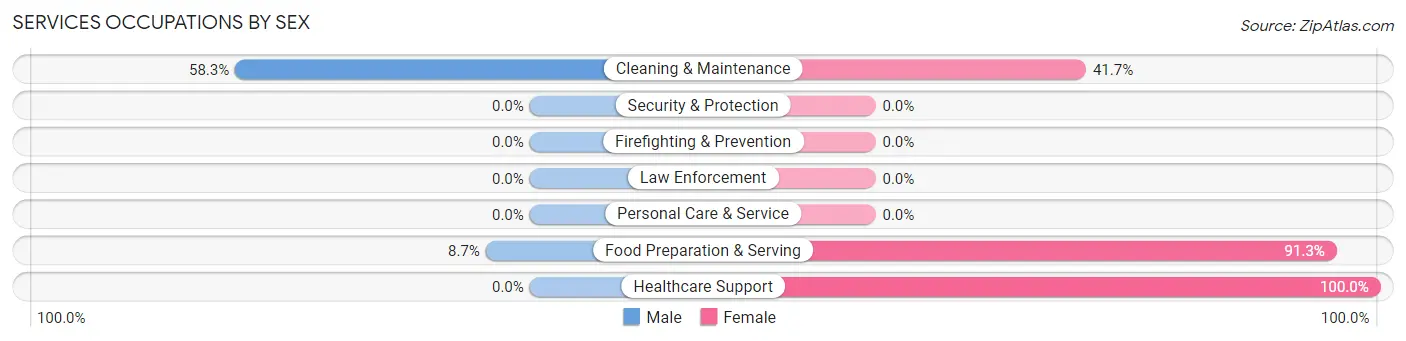
| Occupation | Male | Female |
| Healthcare Support | 0 (0.0%) | 15 (100.0%) |
| Security & Protection | 0 (0.0%) | 0 (0.0%) |
| Firefighting & Prevention | 0 (0.0%) | 0 (0.0%) |
| Law Enforcement | 0 (0.0%) | 0 (0.0%) |
| Food Preparation & Serving | 2 (8.7%) | 21 (91.3%) |
| Cleaning & Maintenance | 7 (58.3%) | 5 (41.7%) |
| Personal Care & Service | 0 (0.0%) | 0 (0.0%) |
| Total (Category) | 9 (18.0%) | 41 (82.0%) |
| Total (Overall) | 302 (62.7%) | 180 (37.3%) |
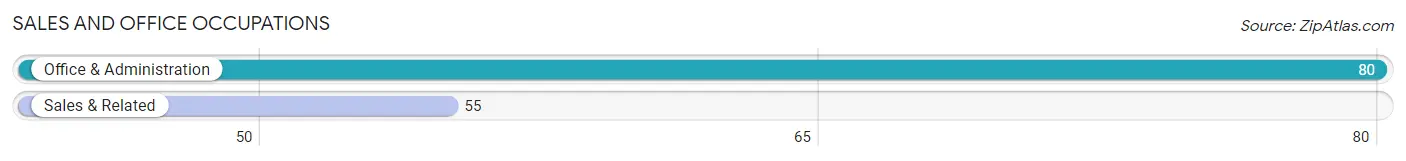
Sales and Office Occupations
The most common Sales and Office occupations in Hagerman are Office & Administration (80 | 16.6%), and Sales & Related (55 | 11.4%).
Sales and Office Occupations by Sex
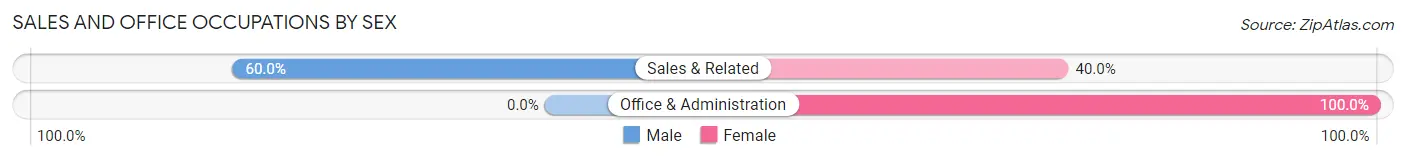
| Occupation | Male | Female |
| Sales & Related | 33 (60.0%) | 22 (40.0%) |
| Office & Administration | 0 (0.0%) | 80 (100.0%) |
| Total (Category) | 33 (24.4%) | 102 (75.6%) |
| Total (Overall) | 302 (62.7%) | 180 (37.3%) |
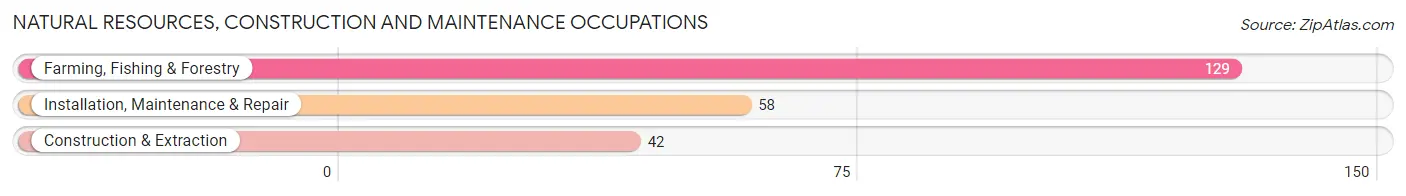
Natural Resources, Construction and Maintenance Occupations
The most common Natural Resources, Construction and Maintenance occupations in Hagerman are Farming, Fishing & Forestry (129 | 26.8%), Installation, Maintenance & Repair (58 | 12.0%), and Construction & Extraction (42 | 8.7%).
Natural Resources, Construction and Maintenance Occupations by Sex
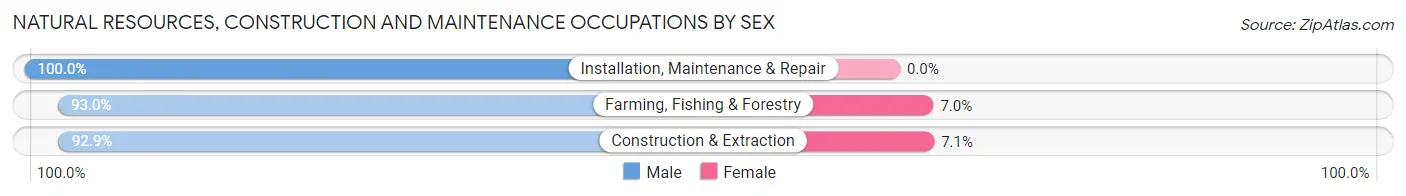
| Occupation | Male | Female |
| Farming, Fishing & Forestry | 120 (93.0%) | 9 (7.0%) |
| Construction & Extraction | 39 (92.9%) | 3 (7.1%) |
| Installation, Maintenance & Repair | 58 (100.0%) | 0 (0.0%) |
| Total (Category) | 217 (94.8%) | 12 (5.2%) |
| Total (Overall) | 302 (62.7%) | 180 (37.3%) |
Production, Transportation and Moving Occupations
The most common Production, Transportation and Moving occupations in Hagerman are Production (27 | 5.6%), Transportation (15 | 3.1%), and Material Moving (8 | 1.7%).
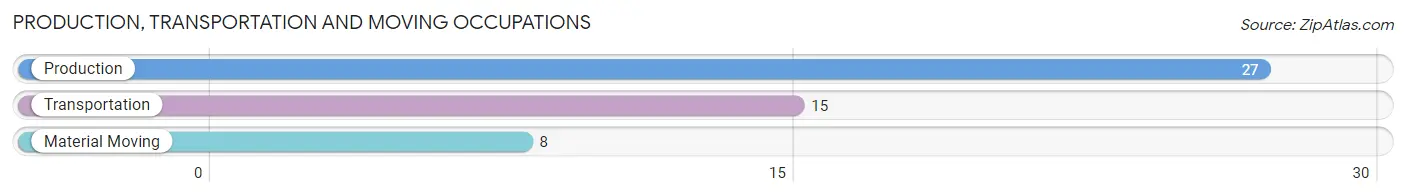
Production, Transportation and Moving Occupations by Sex
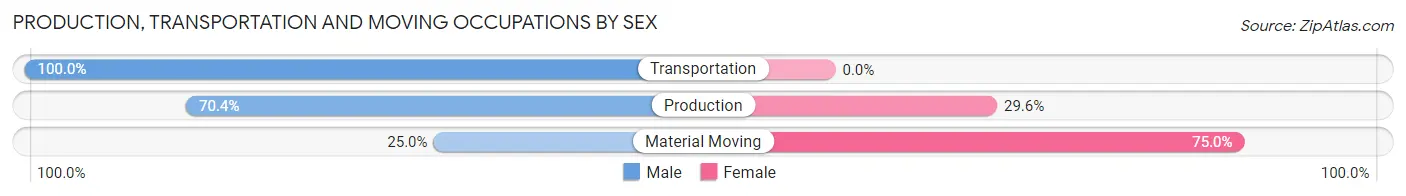
| Occupation | Male | Female |
| Production | 19 (70.4%) | 8 (29.6%) |
| Transportation | 15 (100.0%) | 0 (0.0%) |
| Material Moving | 2 (25.0%) | 6 (75.0%) |
| Total (Category) | 36 (72.0%) | 14 (28.0%) |
| Total (Overall) | 302 (62.7%) | 180 (37.3%) |
Employment Industries by Sex in Hagerman
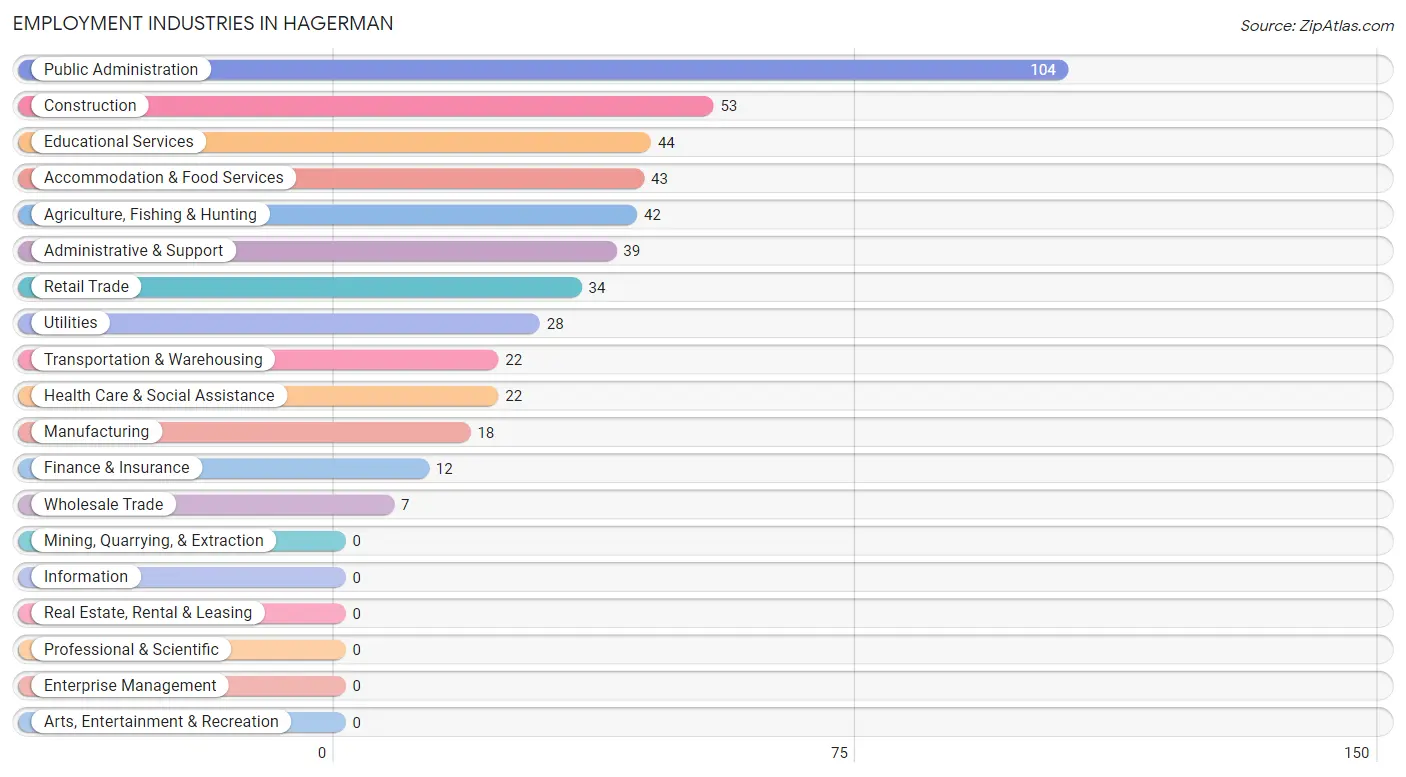
Employment Industries in Hagerman
The major employment industries in Hagerman include Public Administration (104 | 21.6%), Construction (53 | 11.0%), Educational Services (44 | 9.1%), Accommodation & Food Services (43 | 8.9%), and Agriculture, Fishing & Hunting (42 | 8.7%).
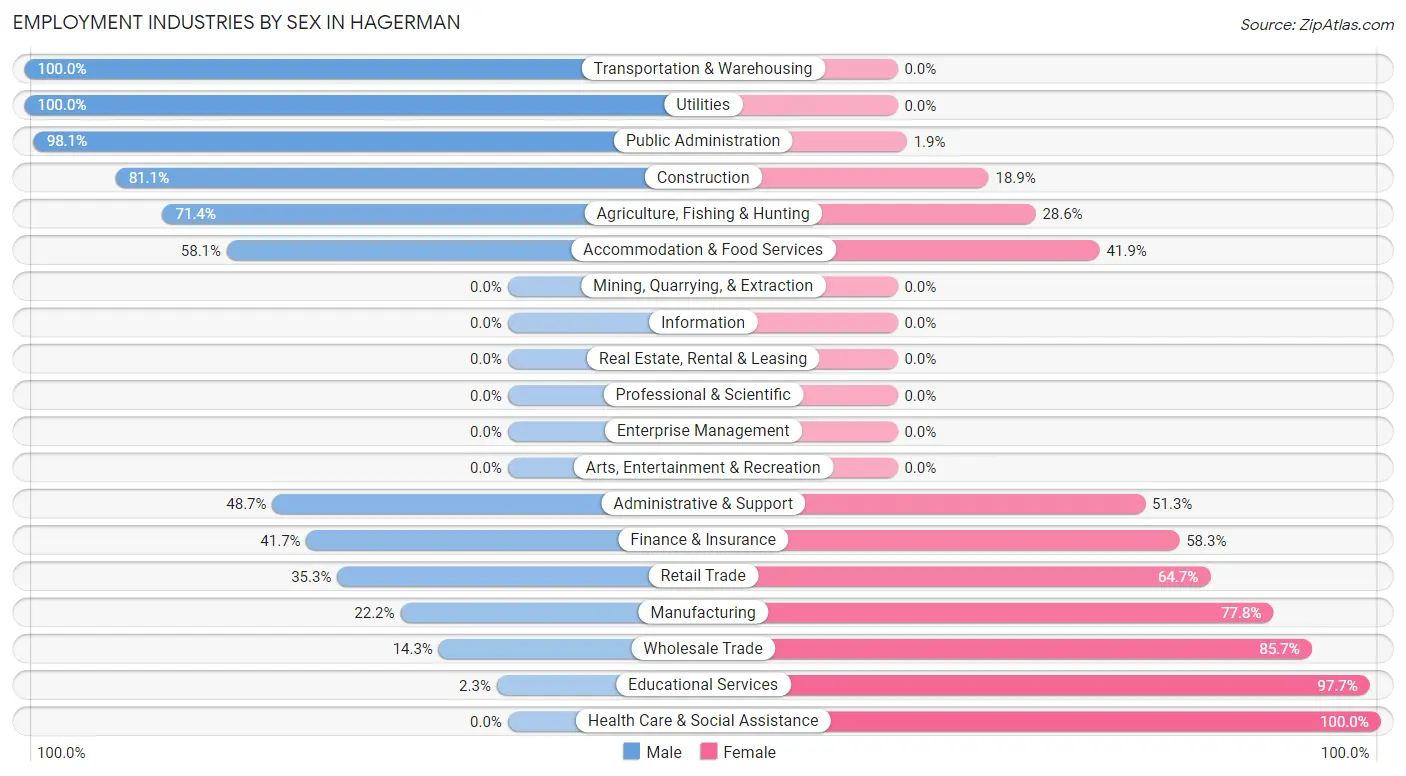
Employment Industries by Sex in Hagerman
The Hagerman industries that see more men than women are Transportation & Warehousing (100.0%), Utilities (100.0%), and Public Administration (98.1%), whereas the industries that tend to have a higher number of women are Health Care & Social Assistance (100.0%), Educational Services (97.7%), and Wholesale Trade (85.7%).
| Industry | Male | Female |
| Agriculture, Fishing & Hunting | 30 (71.4%) | 12 (28.6%) |
| Mining, Quarrying, & Extraction | 0 (0.0%) | 0 (0.0%) |
| Construction | 43 (81.1%) | 10 (18.9%) |
| Manufacturing | 4 (22.2%) | 14 (77.8%) |
| Wholesale Trade | 1 (14.3%) | 6 (85.7%) |
| Retail Trade | 12 (35.3%) | 22 (64.7%) |
| Transportation & Warehousing | 22 (100.0%) | 0 (0.0%) |
| Utilities | 28 (100.0%) | 0 (0.0%) |
| Information | 0 (0.0%) | 0 (0.0%) |
| Finance & Insurance | 5 (41.7%) | 7 (58.3%) |
| Real Estate, Rental & Leasing | 0 (0.0%) | 0 (0.0%) |
| Professional & Scientific | 0 (0.0%) | 0 (0.0%) |
| Enterprise Management | 0 (0.0%) | 0 (0.0%) |
| Administrative & Support | 19 (48.7%) | 20 (51.3%) |
| Educational Services | 1 (2.3%) | 43 (97.7%) |
| Health Care & Social Assistance | 0 (0.0%) | 22 (100.0%) |
| Arts, Entertainment & Recreation | 0 (0.0%) | 0 (0.0%) |
| Accommodation & Food Services | 25 (58.1%) | 18 (41.9%) |
| Public Administration | 102 (98.1%) | 2 (1.9%) |
| Total | 302 (62.7%) | 180 (37.3%) |
Education in Hagerman
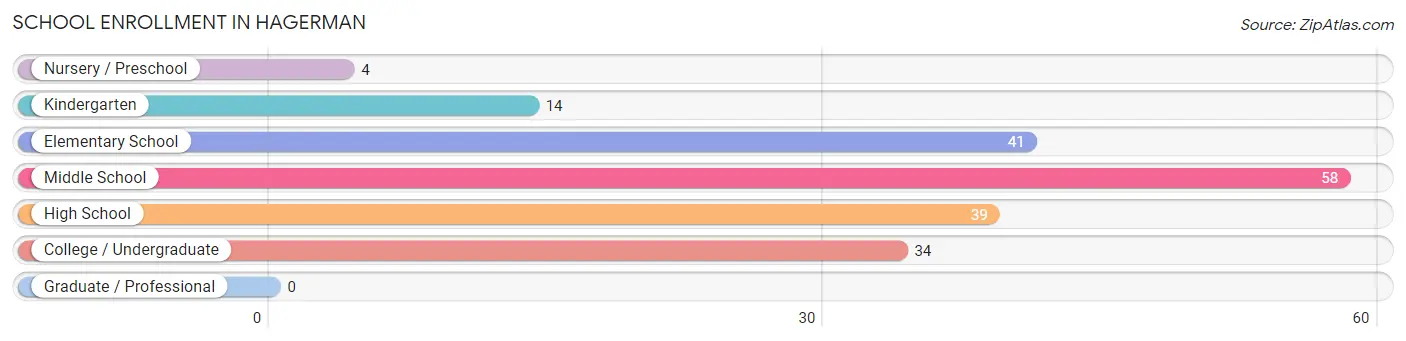
School Enrollment in Hagerman
The most common levels of schooling among the 190 students in Hagerman are middle school (58 | 30.5%), elementary school (41 | 21.6%), and high school (39 | 20.5%).
| School Level | # Students | % Students |
| Nursery / Preschool | 4 | 2.1% |
| Kindergarten | 14 | 7.4% |
| Elementary School | 41 | 21.6% |
| Middle School | 58 | 30.5% |
| High School | 39 | 20.5% |
| College / Undergraduate | 34 | 17.9% |
| Graduate / Professional | 0 | 0.0% |
| Total | 190 | 100.0% |
School Enrollment by Age by Funding Source in Hagerman
Out of a total of 190 students who are enrolled in schools in Hagerman, 10 (5.3%) attend a private institution, while the remaining 180 (94.7%) are enrolled in public schools. The age group of 35 years and over has the highest likelihood of being enrolled in private schools, with 10 (37.0% in the age bracket) enrolled. Conversely, the age group of 5 to 9 year old has the lowest likelihood of being enrolled in a private school, with 49 (100.0% in the age bracket) attending a public institution.
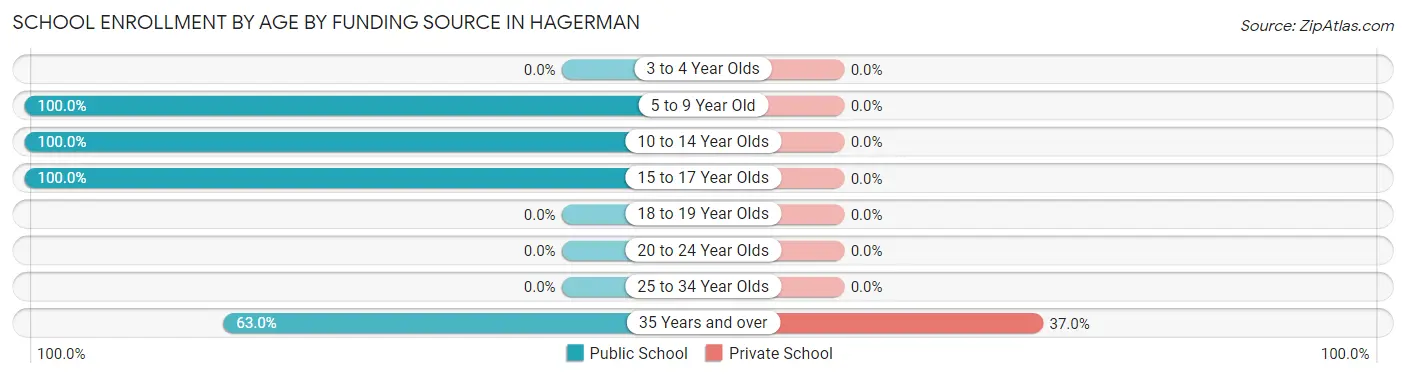
| Age Bracket | Public School | Private School |
| 3 to 4 Year Olds | 0 (0.0%) | 0 (0.0%) |
| 5 to 9 Year Old | 49 (100.0%) | 0 (0.0%) |
| 10 to 14 Year Olds | 57 (100.0%) | 0 (0.0%) |
| 15 to 17 Year Olds | 57 (100.0%) | 0 (0.0%) |
| 18 to 19 Year Olds | 0 (0.0%) | 0 (0.0%) |
| 20 to 24 Year Olds | 0 (0.0%) | 0 (0.0%) |
| 25 to 34 Year Olds | 0 (0.0%) | 0 (0.0%) |
| 35 Years and over | 17 (63.0%) | 10 (37.0%) |
| Total | 180 (94.7%) | 10 (5.3%) |
Educational Attainment by Field of Study in Hagerman
Multidisciplinary studies (94 | 38.4%), communications (49 | 20.0%), business (21 | 8.6%), arts & humanities (19 | 7.8%), and education (15 | 6.1%) are the most common fields of study among 245 individuals in Hagerman who have obtained a bachelor's degree or higher.
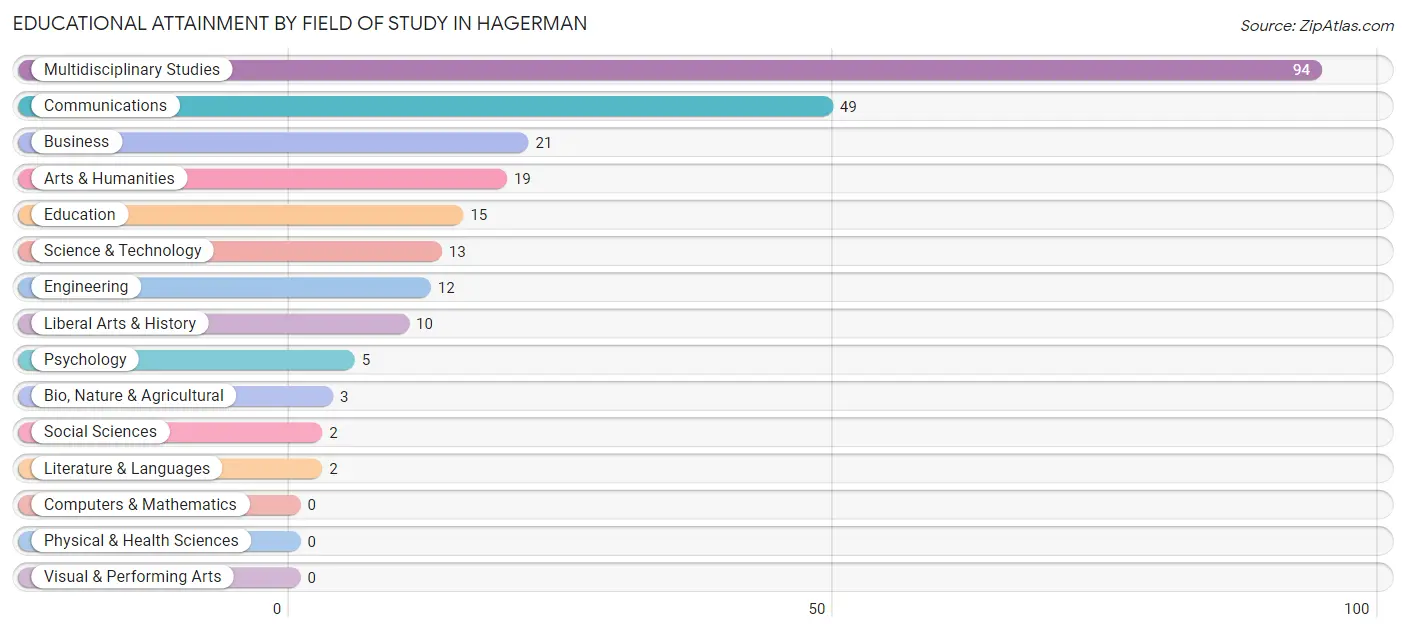
| Field of Study | # Graduates | % Graduates |
| Computers & Mathematics | 0 | 0.0% |
| Bio, Nature & Agricultural | 3 | 1.2% |
| Physical & Health Sciences | 0 | 0.0% |
| Psychology | 5 | 2.0% |
| Social Sciences | 2 | 0.8% |
| Engineering | 12 | 4.9% |
| Multidisciplinary Studies | 94 | 38.4% |
| Science & Technology | 13 | 5.3% |
| Business | 21 | 8.6% |
| Education | 15 | 6.1% |
| Literature & Languages | 2 | 0.8% |
| Liberal Arts & History | 10 | 4.1% |
| Visual & Performing Arts | 0 | 0.0% |
| Communications | 49 | 20.0% |
| Arts & Humanities | 19 | 7.8% |
| Total | 245 | 100.0% |
Transportation & Commute in Hagerman
Vehicle Availability by Sex in Hagerman
The most prevalent vehicle ownership categories in Hagerman are males with 2 vehicles (148, accounting for 49.7%) and females with 2 vehicles (34, making up 87.1%).
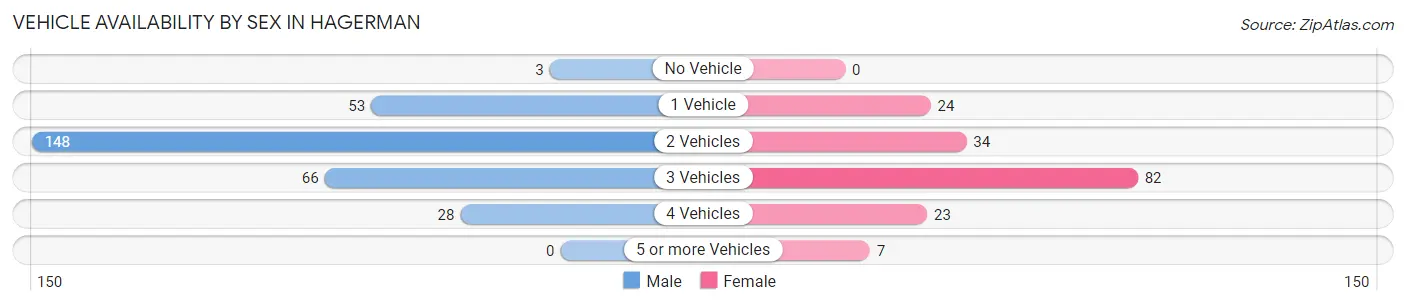
| Vehicles Available | Male | Female |
| No Vehicle | 3 (1.0%) | 0 (0.0%) |
| 1 Vehicle | 53 (17.8%) | 24 (14.1%) |
| 2 Vehicles | 148 (49.7%) | 34 (20.0%) |
| 3 Vehicles | 66 (22.2%) | 82 (48.2%) |
| 4 Vehicles | 28 (9.4%) | 23 (13.5%) |
| 5 or more Vehicles | 0 (0.0%) | 7 (4.1%) |
| Total | 298 (100.0%) | 170 (100.0%) |
Commute Time in Hagerman
The most frequently occuring commute durations in Hagerman are 20 to 24 minutes (122 commuters, 26.2%), 5 to 9 minutes (101 commuters, 21.7%), and 45 to 59 minutes (75 commuters, 16.1%).
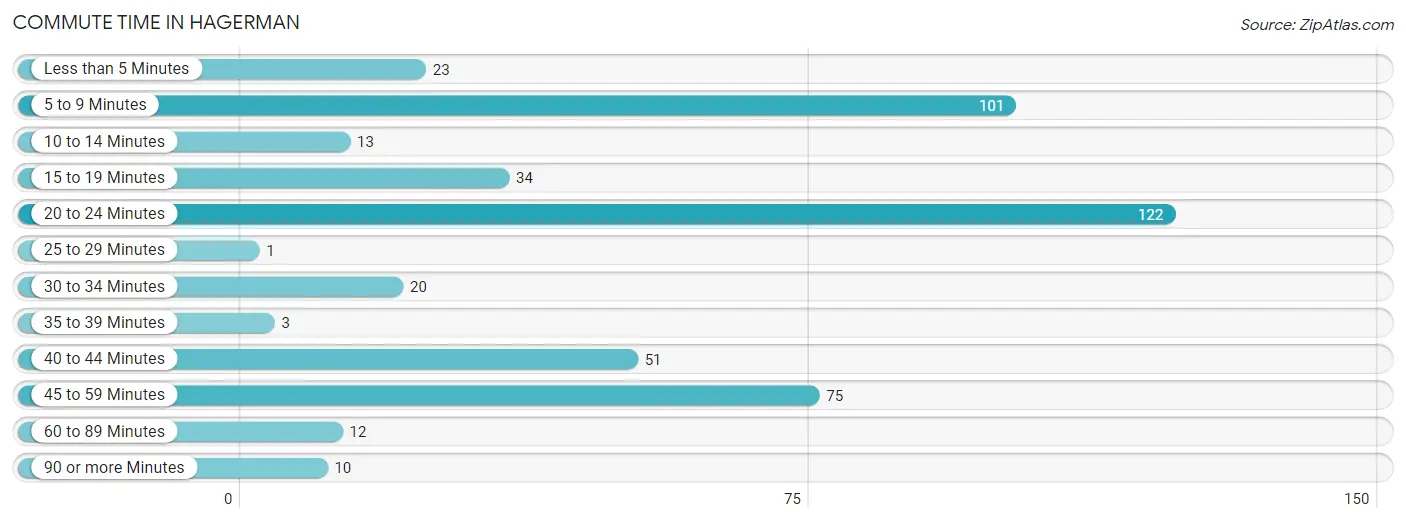
| Commute Time | # Commuters | % Commuters |
| Less than 5 Minutes | 23 | 5.0% |
| 5 to 9 Minutes | 101 | 21.7% |
| 10 to 14 Minutes | 13 | 2.8% |
| 15 to 19 Minutes | 34 | 7.3% |
| 20 to 24 Minutes | 122 | 26.2% |
| 25 to 29 Minutes | 1 | 0.2% |
| 30 to 34 Minutes | 20 | 4.3% |
| 35 to 39 Minutes | 3 | 0.6% |
| 40 to 44 Minutes | 51 | 11.0% |
| 45 to 59 Minutes | 75 | 16.1% |
| 60 to 89 Minutes | 12 | 2.6% |
| 90 or more Minutes | 10 | 2.1% |
Commute Time by Sex in Hagerman
The most common commute times in Hagerman are 20 to 24 minutes (117 commuters, 39.3%) for males and 40 to 44 minutes (48 commuters, 28.7%) for females.
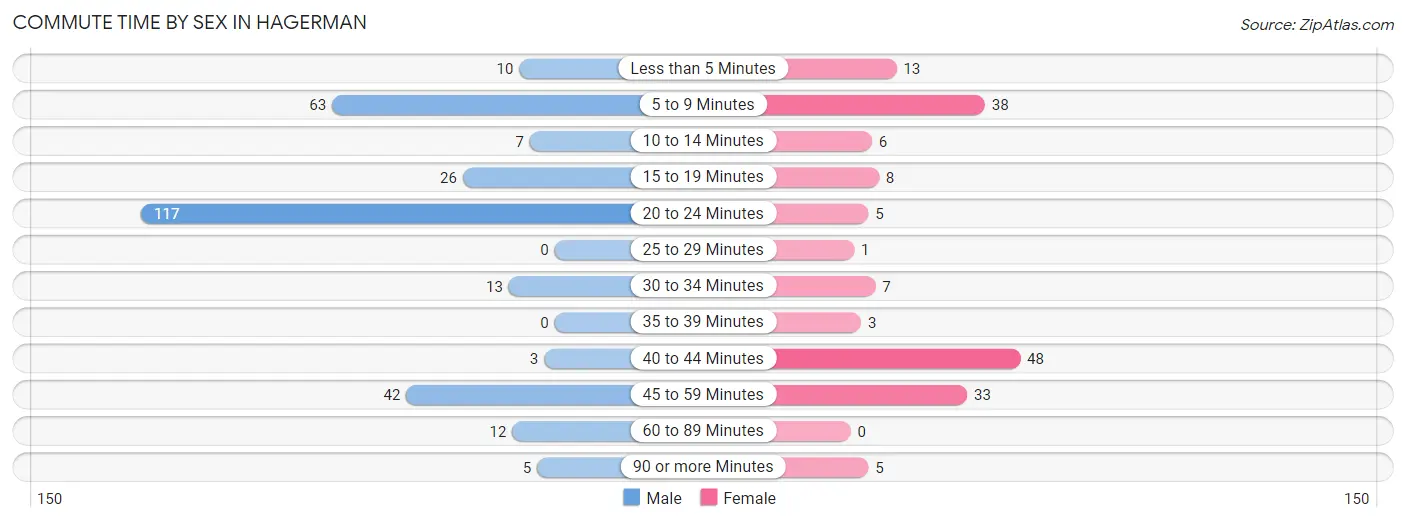
| Commute Time | Male | Female |
| Less than 5 Minutes | 10 (3.4%) | 13 (7.8%) |
| 5 to 9 Minutes | 63 (21.1%) | 38 (22.8%) |
| 10 to 14 Minutes | 7 (2.4%) | 6 (3.6%) |
| 15 to 19 Minutes | 26 (8.7%) | 8 (4.8%) |
| 20 to 24 Minutes | 117 (39.3%) | 5 (3.0%) |
| 25 to 29 Minutes | 0 (0.0%) | 1 (0.6%) |
| 30 to 34 Minutes | 13 (4.4%) | 7 (4.2%) |
| 35 to 39 Minutes | 0 (0.0%) | 3 (1.8%) |
| 40 to 44 Minutes | 3 (1.0%) | 48 (28.7%) |
| 45 to 59 Minutes | 42 (14.1%) | 33 (19.8%) |
| 60 to 89 Minutes | 12 (4.0%) | 0 (0.0%) |
| 90 or more Minutes | 5 (1.7%) | 5 (3.0%) |
Time of Departure to Work by Sex in Hagerman
The most frequent times of departure to work in Hagerman are 7:30 AM to 7:59 AM (115, 38.6%) for males and 6:30 AM to 6:59 AM (54, 32.3%) for females.
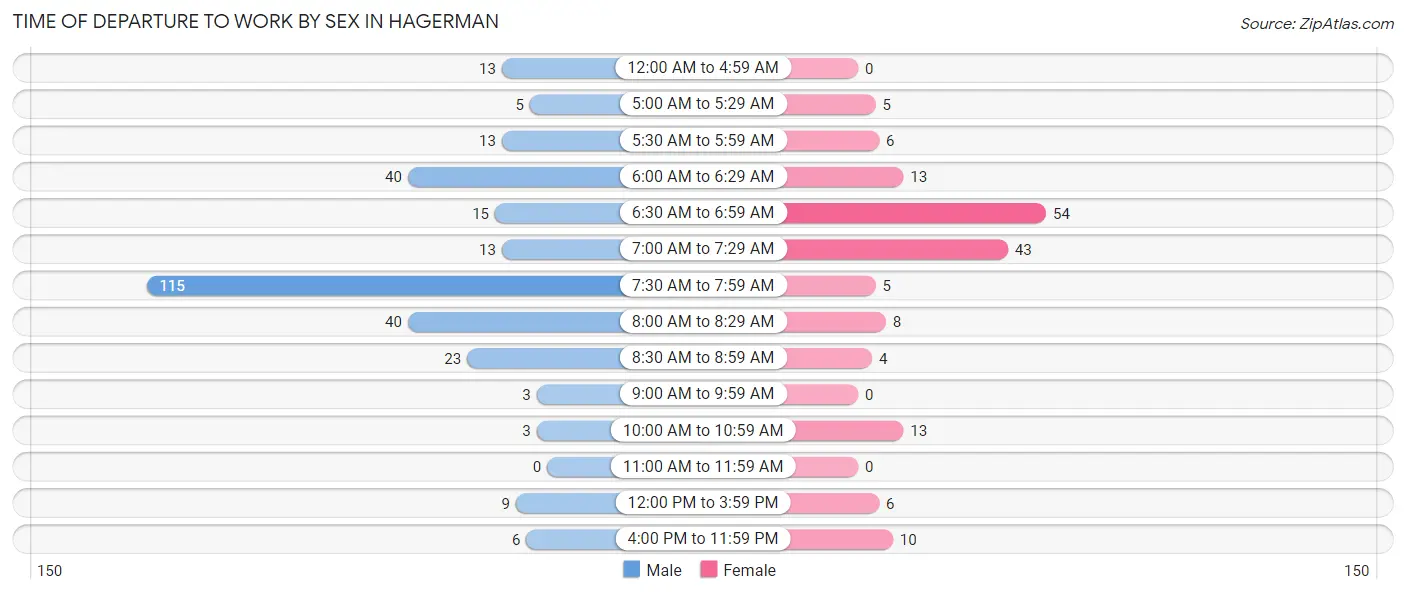
| Time of Departure | Male | Female |
| 12:00 AM to 4:59 AM | 13 (4.4%) | 0 (0.0%) |
| 5:00 AM to 5:29 AM | 5 (1.7%) | 5 (3.0%) |
| 5:30 AM to 5:59 AM | 13 (4.4%) | 6 (3.6%) |
| 6:00 AM to 6:29 AM | 40 (13.4%) | 13 (7.8%) |
| 6:30 AM to 6:59 AM | 15 (5.0%) | 54 (32.3%) |
| 7:00 AM to 7:29 AM | 13 (4.4%) | 43 (25.8%) |
| 7:30 AM to 7:59 AM | 115 (38.6%) | 5 (3.0%) |
| 8:00 AM to 8:29 AM | 40 (13.4%) | 8 (4.8%) |
| 8:30 AM to 8:59 AM | 23 (7.7%) | 4 (2.4%) |
| 9:00 AM to 9:59 AM | 3 (1.0%) | 0 (0.0%) |
| 10:00 AM to 10:59 AM | 3 (1.0%) | 13 (7.8%) |
| 11:00 AM to 11:59 AM | 0 (0.0%) | 0 (0.0%) |
| 12:00 PM to 3:59 PM | 9 (3.0%) | 6 (3.6%) |
| 4:00 PM to 11:59 PM | 6 (2.0%) | 10 (6.0%) |
| Total | 298 (100.0%) | 167 (100.0%) |
Housing Occupancy in Hagerman
Occupancy by Ownership in Hagerman
Of the total 577 dwellings in Hagerman, owner-occupied units account for 464 (80.4%), while renter-occupied units make up 113 (19.6%).
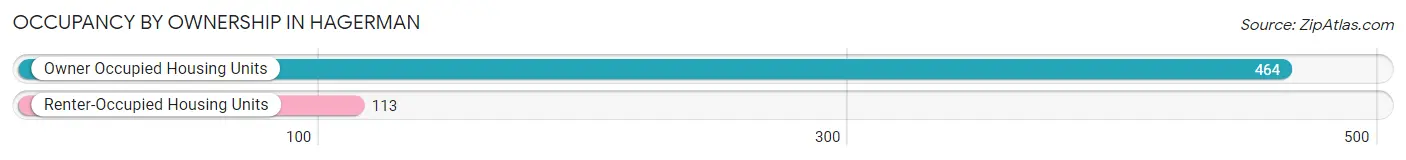
| Occupancy | # Housing Units | % Housing Units |
| Owner Occupied Housing Units | 464 | 80.4% |
| Renter-Occupied Housing Units | 113 | 19.6% |
| Total Occupied Housing Units | 577 | 100.0% |
Occupancy by Household Size in Hagerman
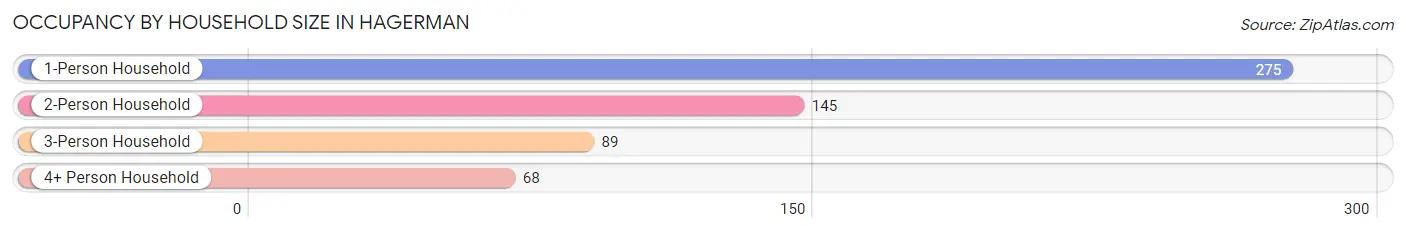
| Household Size | # Housing Units | % Housing Units |
| 1-Person Household | 275 | 47.7% |
| 2-Person Household | 145 | 25.1% |
| 3-Person Household | 89 | 15.4% |
| 4+ Person Household | 68 | 11.8% |
| Total Housing Units | 577 | 100.0% |
Occupancy by Ownership by Household Size in Hagerman
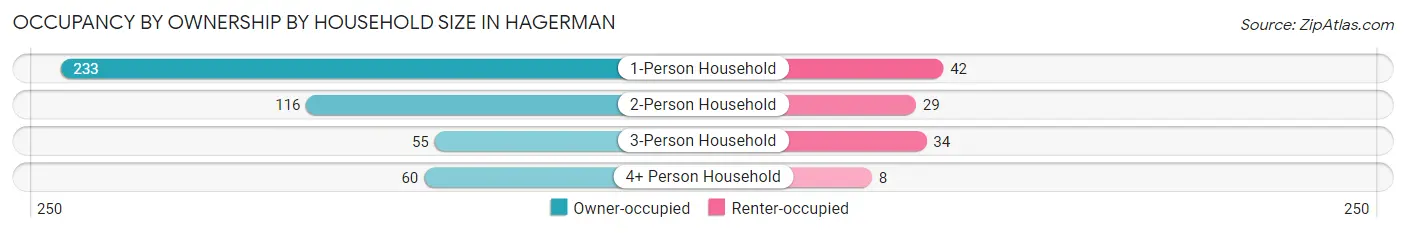
| Household Size | Owner-occupied | Renter-occupied |
| 1-Person Household | 233 (84.7%) | 42 (15.3%) |
| 2-Person Household | 116 (80.0%) | 29 (20.0%) |
| 3-Person Household | 55 (61.8%) | 34 (38.2%) |
| 4+ Person Household | 60 (88.2%) | 8 (11.8%) |
| Total Housing Units | 464 (80.4%) | 113 (19.6%) |
Occupancy by Educational Attainment in Hagerman
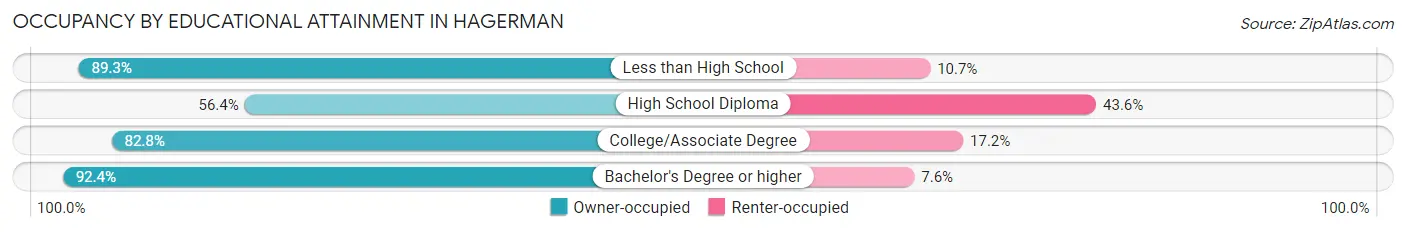
| Household Size | Owner-occupied | Renter-occupied |
| Less than High School | 50 (89.3%) | 6 (10.7%) |
| High School Diploma | 75 (56.4%) | 58 (43.6%) |
| College/Associate Degree | 168 (82.8%) | 35 (17.2%) |
| Bachelor's Degree or higher | 171 (92.4%) | 14 (7.6%) |
Occupancy by Age of Householder in Hagerman
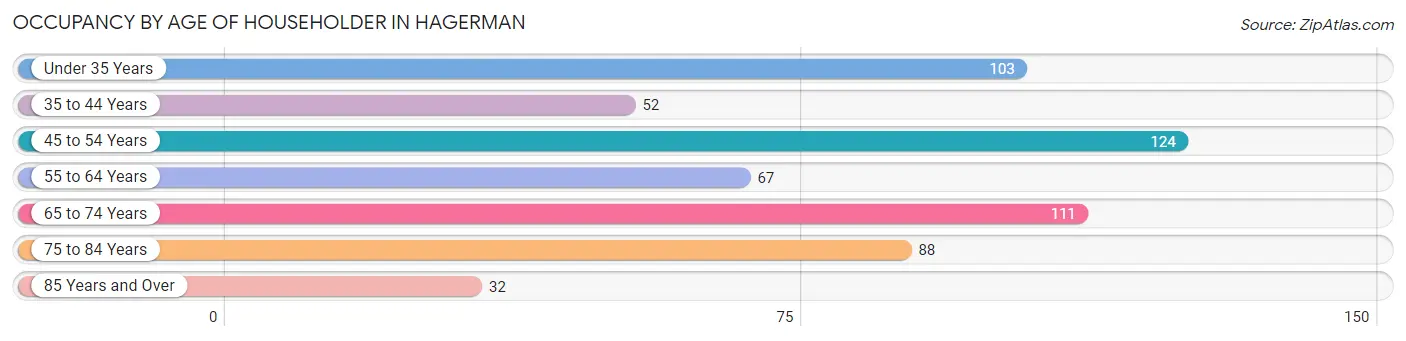
| Age Bracket | # Households | % Households |
| Under 35 Years | 103 | 17.8% |
| 35 to 44 Years | 52 | 9.0% |
| 45 to 54 Years | 124 | 21.5% |
| 55 to 64 Years | 67 | 11.6% |
| 65 to 74 Years | 111 | 19.2% |
| 75 to 84 Years | 88 | 15.2% |
| 85 Years and Over | 32 | 5.6% |
| Total | 577 | 100.0% |
Housing Finances in Hagerman
Median Income by Occupancy in Hagerman
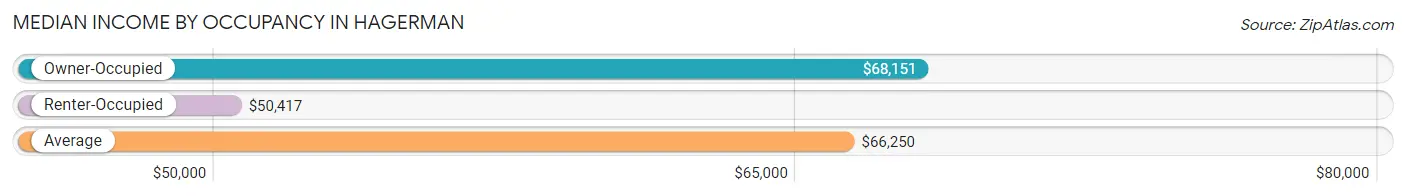
| Occupancy Type | # Households | Median Income |
| Owner-Occupied | 464 (80.4%) | $68,151 |
| Renter-Occupied | 113 (19.6%) | $50,417 |
| Average | 577 (100.0%) | $66,250 |
Occupancy by Householder Income Bracket in Hagerman
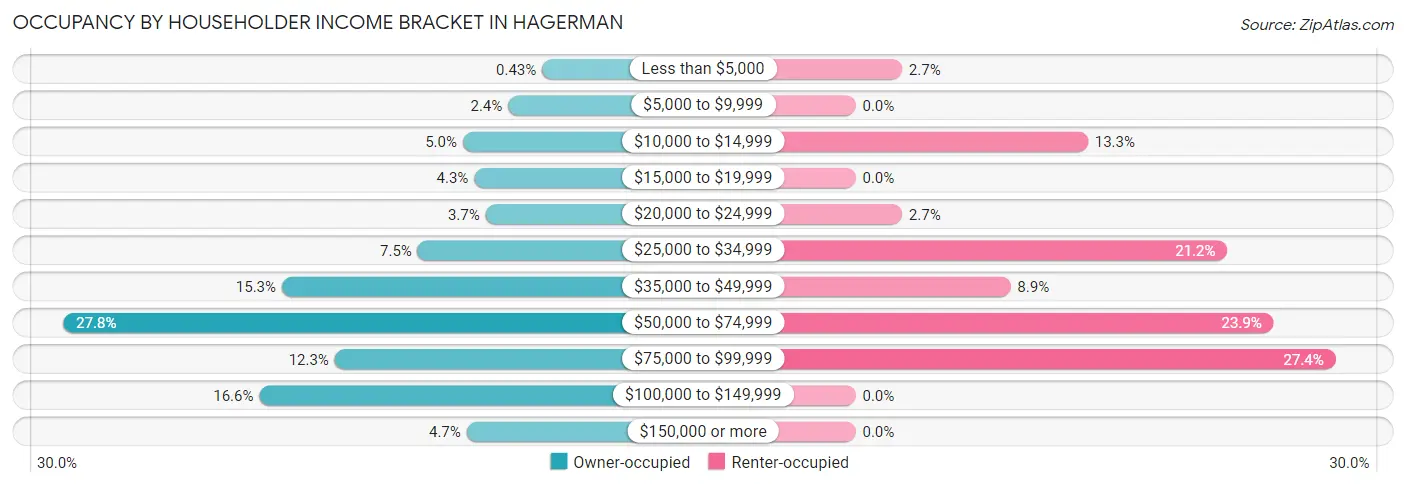
| Income Bracket | Owner-occupied | Renter-occupied |
| Less than $5,000 | 2 (0.4%) | 3 (2.6%) |
| $5,000 to $9,999 | 11 (2.4%) | 0 (0.0%) |
| $10,000 to $14,999 | 23 (5.0%) | 15 (13.3%) |
| $15,000 to $19,999 | 20 (4.3%) | 0 (0.0%) |
| $20,000 to $24,999 | 17 (3.7%) | 3 (2.6%) |
| $25,000 to $34,999 | 35 (7.5%) | 24 (21.2%) |
| $35,000 to $49,999 | 71 (15.3%) | 10 (8.8%) |
| $50,000 to $74,999 | 129 (27.8%) | 27 (23.9%) |
| $75,000 to $99,999 | 57 (12.3%) | 31 (27.4%) |
| $100,000 to $149,999 | 77 (16.6%) | 0 (0.0%) |
| $150,000 or more | 22 (4.7%) | 0 (0.0%) |
| Total | 464 (100.0%) | 113 (100.0%) |
Monthly Housing Cost Tiers in Hagerman
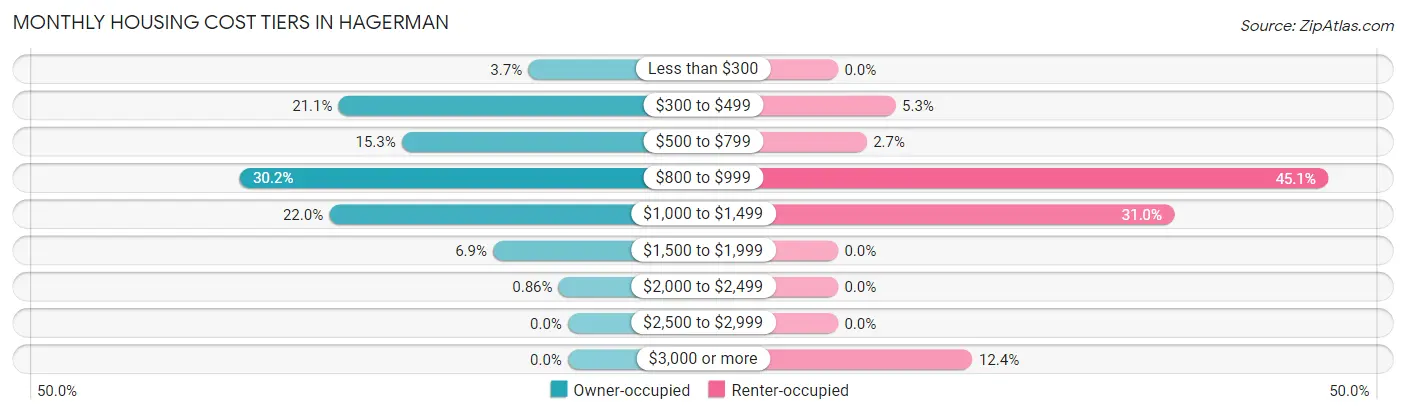
| Monthly Cost | Owner-occupied | Renter-occupied |
| Less than $300 | 17 (3.7%) | 0 (0.0%) |
| $300 to $499 | 98 (21.1%) | 6 (5.3%) |
| $500 to $799 | 71 (15.3%) | 3 (2.6%) |
| $800 to $999 | 140 (30.2%) | 51 (45.1%) |
| $1,000 to $1,499 | 102 (22.0%) | 35 (31.0%) |
| $1,500 to $1,999 | 32 (6.9%) | 0 (0.0%) |
| $2,000 to $2,499 | 4 (0.9%) | 0 (0.0%) |
| $2,500 to $2,999 | 0 (0.0%) | 0 (0.0%) |
| $3,000 or more | 0 (0.0%) | 14 (12.4%) |
| Total | 464 (100.0%) | 113 (100.0%) |
Physical Housing Characteristics in Hagerman
Housing Structures in Hagerman
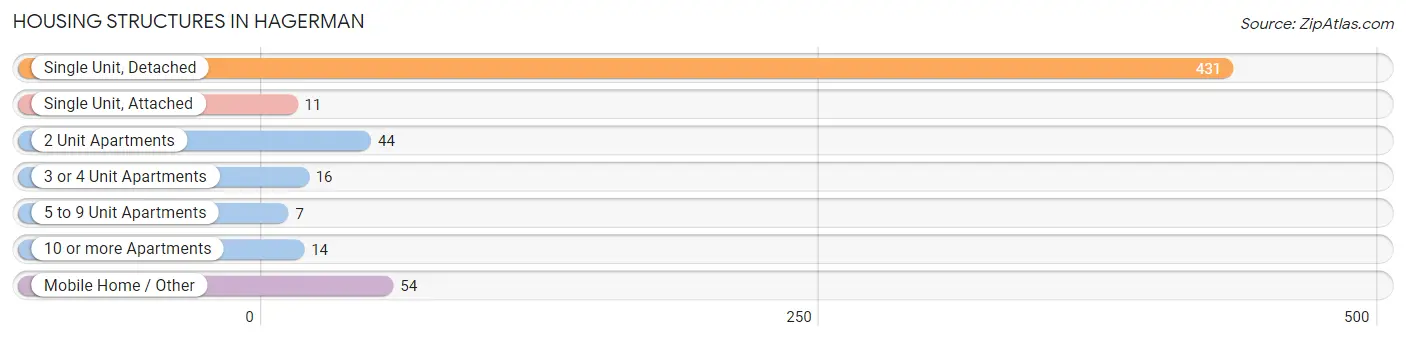
| Structure Type | # Housing Units | % Housing Units |
| Single Unit, Detached | 431 | 74.7% |
| Single Unit, Attached | 11 | 1.9% |
| 2 Unit Apartments | 44 | 7.6% |
| 3 or 4 Unit Apartments | 16 | 2.8% |
| 5 to 9 Unit Apartments | 7 | 1.2% |
| 10 or more Apartments | 14 | 2.4% |
| Mobile Home / Other | 54 | 9.4% |
| Total | 577 | 100.0% |
Housing Structures by Occupancy in Hagerman
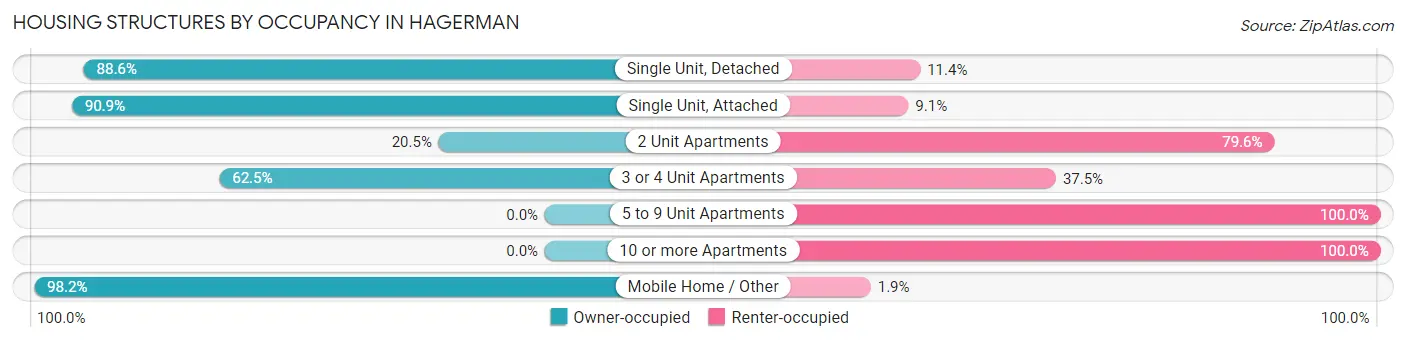
| Structure Type | Owner-occupied | Renter-occupied |
| Single Unit, Detached | 382 (88.6%) | 49 (11.4%) |
| Single Unit, Attached | 10 (90.9%) | 1 (9.1%) |
| 2 Unit Apartments | 9 (20.4%) | 35 (79.5%) |
| 3 or 4 Unit Apartments | 10 (62.5%) | 6 (37.5%) |
| 5 to 9 Unit Apartments | 0 (0.0%) | 7 (100.0%) |
| 10 or more Apartments | 0 (0.0%) | 14 (100.0%) |
| Mobile Home / Other | 53 (98.2%) | 1 (1.8%) |
| Total | 464 (80.4%) | 113 (19.6%) |
Housing Structures by Number of Rooms in Hagerman
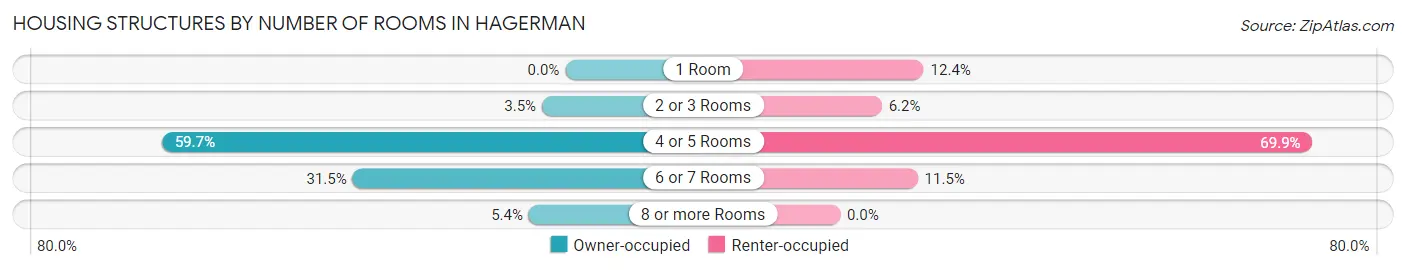
| Number of Rooms | Owner-occupied | Renter-occupied |
| 1 Room | 0 (0.0%) | 14 (12.4%) |
| 2 or 3 Rooms | 16 (3.5%) | 7 (6.2%) |
| 4 or 5 Rooms | 277 (59.7%) | 79 (69.9%) |
| 6 or 7 Rooms | 146 (31.5%) | 13 (11.5%) |
| 8 or more Rooms | 25 (5.4%) | 0 (0.0%) |
| Total | 464 (100.0%) | 113 (100.0%) |
Housing Structure by Heating Type in Hagerman
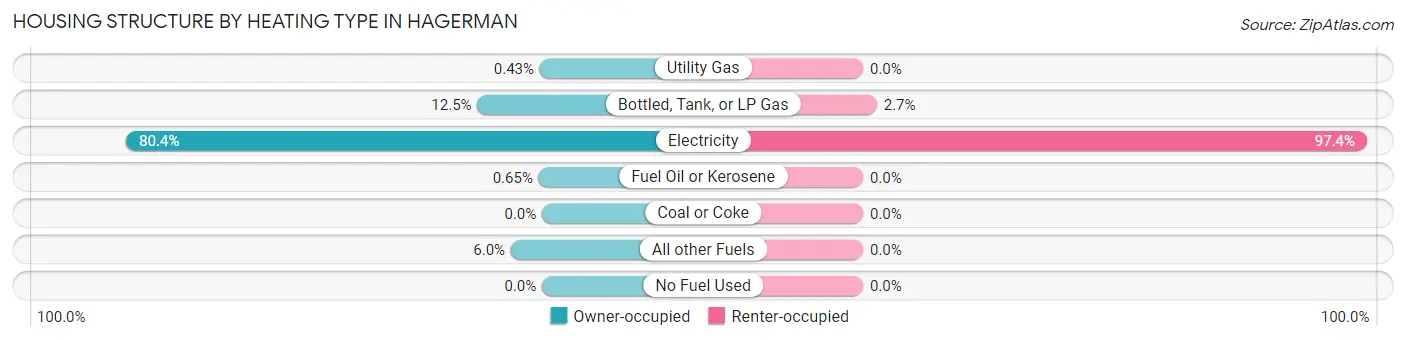
| Heating Type | Owner-occupied | Renter-occupied |
| Utility Gas | 2 (0.4%) | 0 (0.0%) |
| Bottled, Tank, or LP Gas | 58 (12.5%) | 3 (2.6%) |
| Electricity | 373 (80.4%) | 110 (97.4%) |
| Fuel Oil or Kerosene | 3 (0.6%) | 0 (0.0%) |
| Coal or Coke | 0 (0.0%) | 0 (0.0%) |
| All other Fuels | 28 (6.0%) | 0 (0.0%) |
| No Fuel Used | 0 (0.0%) | 0 (0.0%) |
| Total | 464 (100.0%) | 113 (100.0%) |
Household Vehicle Usage in Hagerman
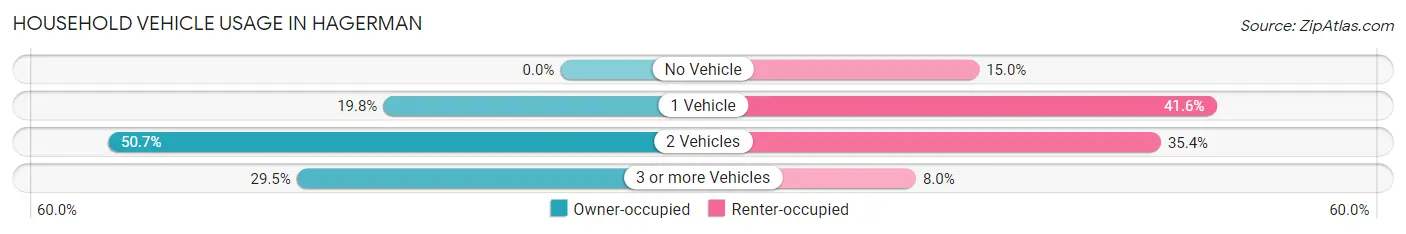
| Vehicles per Household | Owner-occupied | Renter-occupied |
| No Vehicle | 0 (0.0%) | 17 (15.0%) |
| 1 Vehicle | 92 (19.8%) | 47 (41.6%) |
| 2 Vehicles | 235 (50.6%) | 40 (35.4%) |
| 3 or more Vehicles | 137 (29.5%) | 9 (8.0%) |
| Total | 464 (100.0%) | 113 (100.0%) |
Real Estate & Mortgages in Hagerman
Real Estate and Mortgage Overview in Hagerman
| Characteristic | Without Mortgage | With Mortgage |
| Housing Units | 181 | 283 |
| Median Property Value | $202,000 | $119,400 |
| Median Household Income | $40,651 | $17 |
| Monthly Housing Costs | $466 | $0 |
| Real Estate Taxes | $1,247 | $0 |
Property Value by Mortgage Status in Hagerman
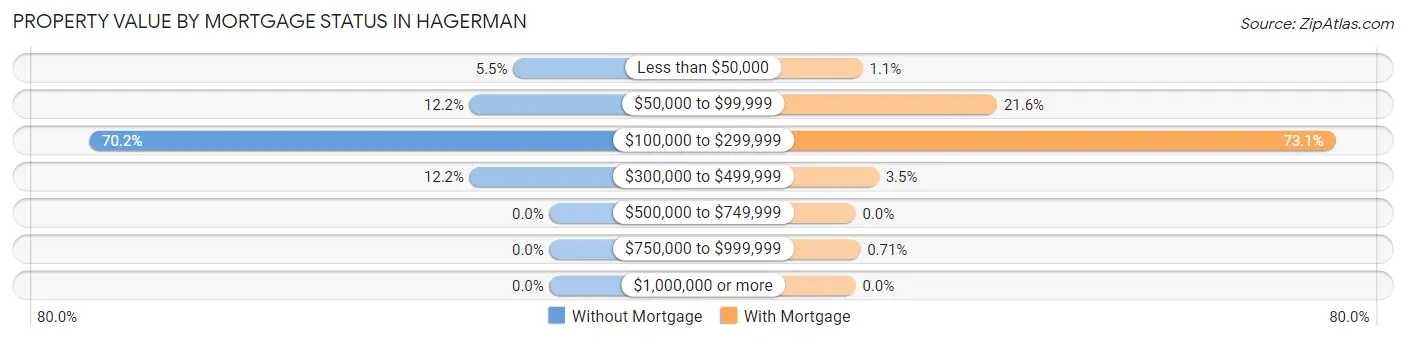
| Property Value | Without Mortgage | With Mortgage |
| Less than $50,000 | 10 (5.5%) | 3 (1.1%) |
| $50,000 to $99,999 | 22 (12.1%) | 61 (21.5%) |
| $100,000 to $299,999 | 127 (70.2%) | 207 (73.1%) |
| $300,000 to $499,999 | 22 (12.1%) | 10 (3.5%) |
| $500,000 to $749,999 | 0 (0.0%) | 0 (0.0%) |
| $750,000 to $999,999 | 0 (0.0%) | 2 (0.7%) |
| $1,000,000 or more | 0 (0.0%) | 0 (0.0%) |
| Total | 181 (100.0%) | 283 (100.0%) |
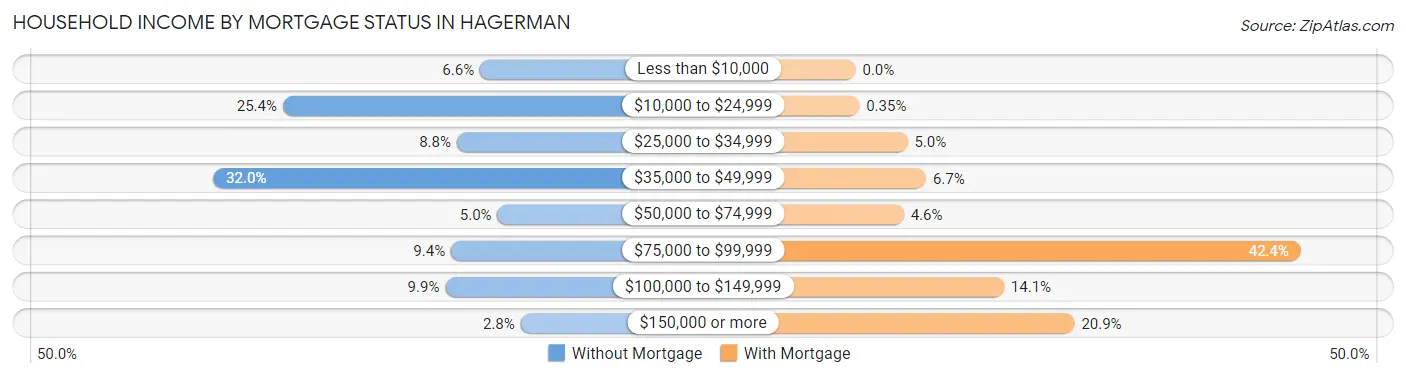
Household Income by Mortgage Status in Hagerman
| Household Income | Without Mortgage | With Mortgage |
| Less than $10,000 | 12 (6.6%) | 0 (0.0%) |
| $10,000 to $24,999 | 46 (25.4%) | 1 (0.4%) |
| $25,000 to $34,999 | 16 (8.8%) | 14 (5.0%) |
| $35,000 to $49,999 | 58 (32.0%) | 19 (6.7%) |
| $50,000 to $74,999 | 9 (5.0%) | 13 (4.6%) |
| $75,000 to $99,999 | 17 (9.4%) | 120 (42.4%) |
| $100,000 to $149,999 | 18 (9.9%) | 40 (14.1%) |
| $150,000 or more | 5 (2.8%) | 59 (20.8%) |
| Total | 181 (100.0%) | 283 (100.0%) |
Property Value to Household Income Ratio in Hagerman
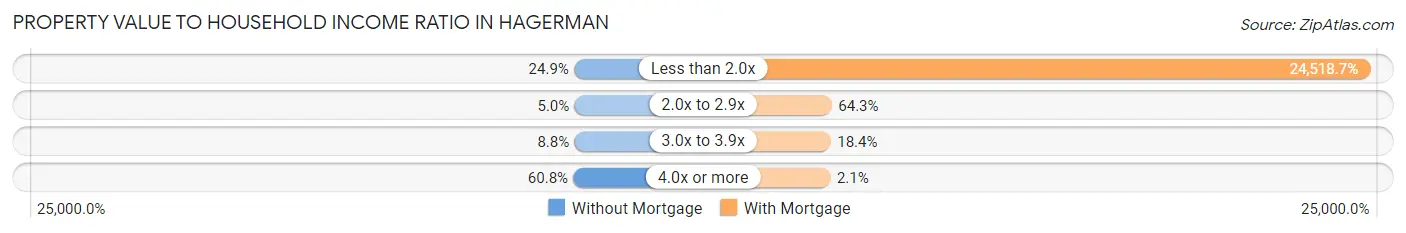
| Value-to-Income Ratio | Without Mortgage | With Mortgage |
| Less than 2.0x | 45 (24.9%) | 69,388 (24,518.7%) |
| 2.0x to 2.9x | 9 (5.0%) | 182 (64.3%) |
| 3.0x to 3.9x | 16 (8.8%) | 52 (18.4%) |
| 4.0x or more | 110 (60.8%) | 6 (2.1%) |
| Total | 181 (100.0%) | 283 (100.0%) |
Real Estate Taxes by Mortgage Status in Hagerman
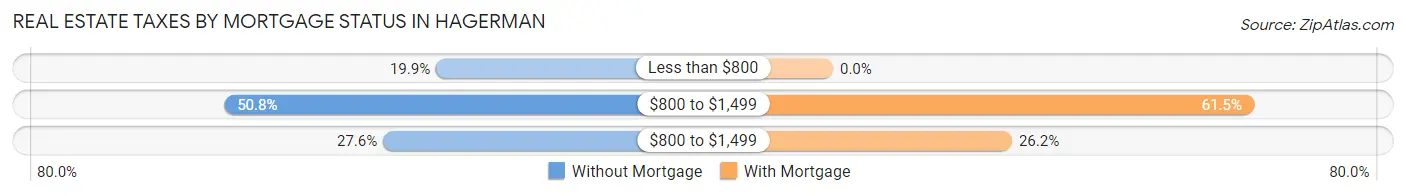
| Property Taxes | Without Mortgage | With Mortgage |
| Less than $800 | 36 (19.9%) | 0 (0.0%) |
| $800 to $1,499 | 92 (50.8%) | 174 (61.5%) |
| $800 to $1,499 | 50 (27.6%) | 74 (26.2%) |
| Total | 181 (100.0%) | 283 (100.0%) |
Health & Disability in Hagerman
Health Insurance Coverage by Age in Hagerman
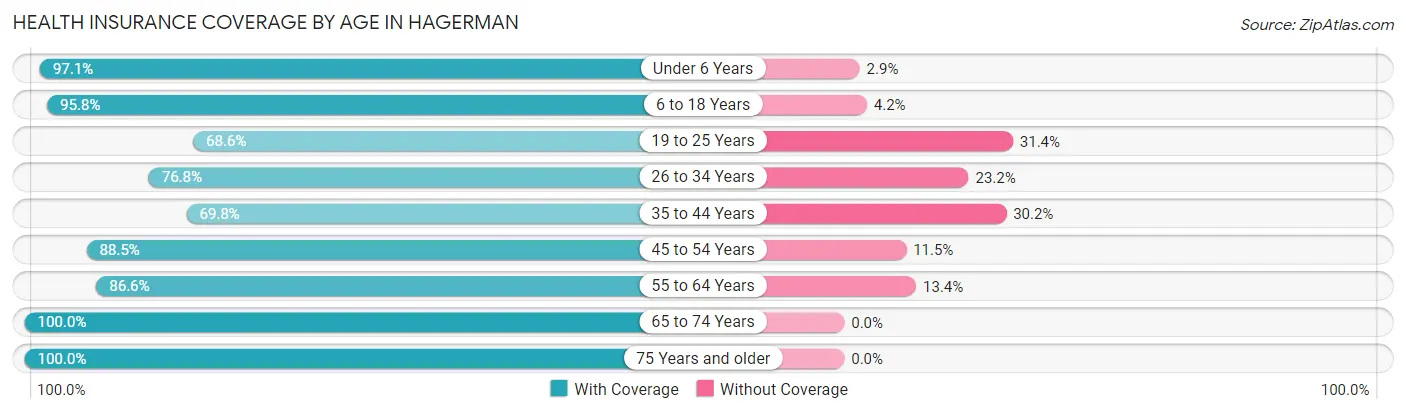
| Age Bracket | With Coverage | Without Coverage |
| Under 6 Years | 68 (97.1%) | 2 (2.9%) |
| 6 to 18 Years | 182 (95.8%) | 8 (4.2%) |
| 19 to 25 Years | 24 (68.6%) | 11 (31.4%) |
| 26 to 34 Years | 126 (76.8%) | 38 (23.2%) |
| 35 to 44 Years | 74 (69.8%) | 32 (30.2%) |
| 45 to 54 Years | 138 (88.5%) | 18 (11.5%) |
| 55 to 64 Years | 110 (86.6%) | 17 (13.4%) |
| 65 to 74 Years | 174 (100.0%) | 0 (0.0%) |
| 75 Years and older | 174 (100.0%) | 0 (0.0%) |
| Total | 1,070 (89.5%) | 126 (10.5%) |
Health Insurance Coverage by Citizenship Status in Hagerman
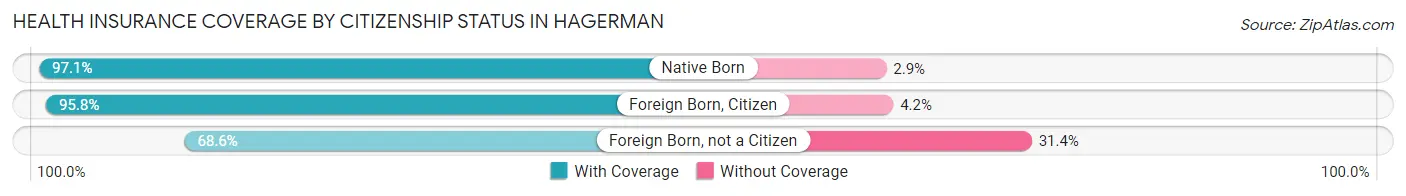
| Citizenship Status | With Coverage | Without Coverage |
| Native Born | 68 (97.1%) | 2 (2.9%) |
| Foreign Born, Citizen | 182 (95.8%) | 8 (4.2%) |
| Foreign Born, not a Citizen | 24 (68.6%) | 11 (31.4%) |
Health Insurance Coverage by Household Income in Hagerman
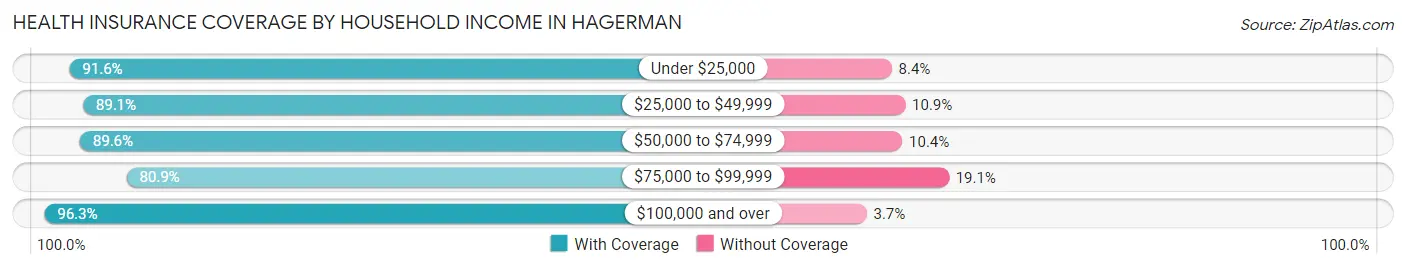
| Household Income | With Coverage | Without Coverage |
| Under $25,000 | 109 (91.6%) | 10 (8.4%) |
| $25,000 to $49,999 | 261 (89.1%) | 32 (10.9%) |
| $50,000 to $74,999 | 251 (89.6%) | 29 (10.4%) |
| $75,000 to $99,999 | 195 (80.9%) | 46 (19.1%) |
| $100,000 and over | 234 (96.3%) | 9 (3.7%) |
Public vs Private Health Insurance Coverage by Age in Hagerman
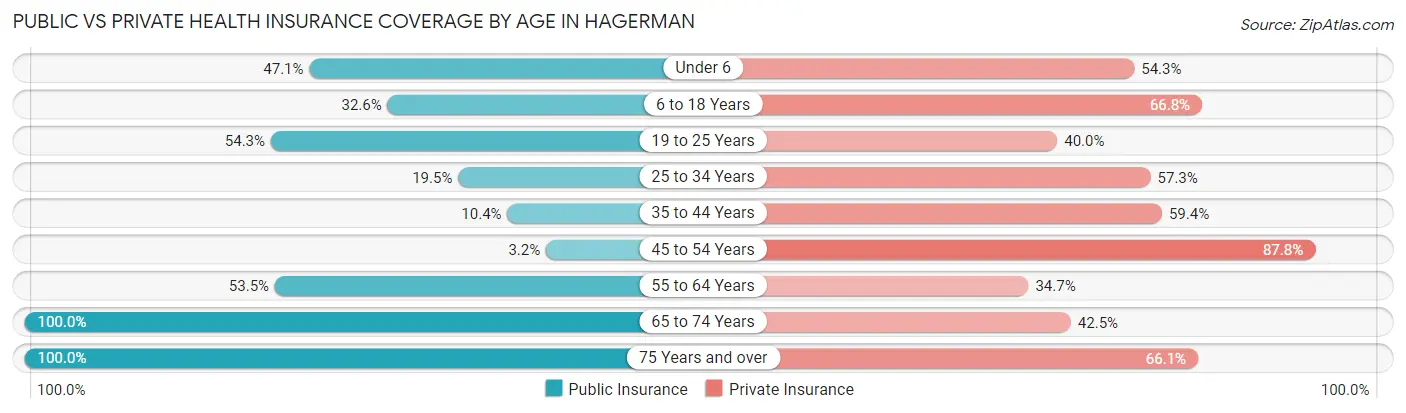
| Age Bracket | Public Insurance | Private Insurance |
| Under 6 | 33 (47.1%) | 38 (54.3%) |
| 6 to 18 Years | 62 (32.6%) | 127 (66.8%) |
| 19 to 25 Years | 19 (54.3%) | 14 (40.0%) |
| 25 to 34 Years | 32 (19.5%) | 94 (57.3%) |
| 35 to 44 Years | 11 (10.4%) | 63 (59.4%) |
| 45 to 54 Years | 5 (3.2%) | 137 (87.8%) |
| 55 to 64 Years | 68 (53.5%) | 44 (34.6%) |
| 65 to 74 Years | 174 (100.0%) | 74 (42.5%) |
| 75 Years and over | 174 (100.0%) | 115 (66.1%) |
| Total | 578 (48.3%) | 706 (59.0%) |
Disability Status by Sex by Age in Hagerman
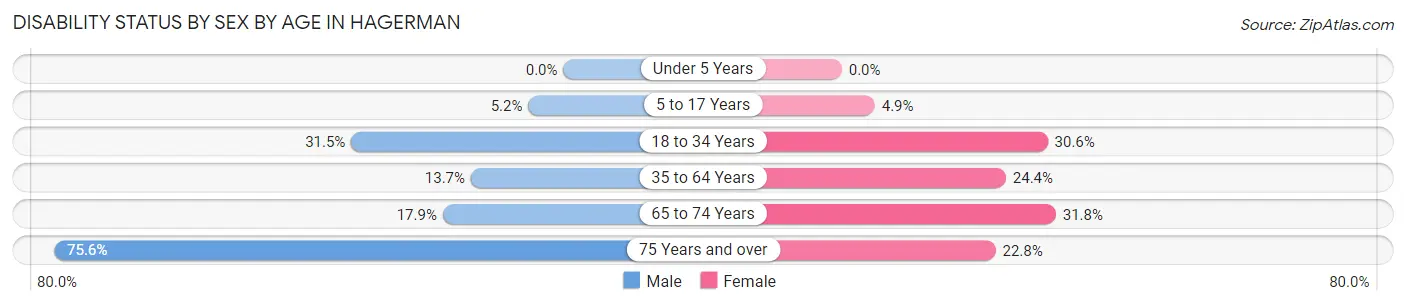
| Age Bracket | Male | Female |
| Under 5 Years | 0 (0.0%) | 0 (0.0%) |
| 5 to 17 Years | 5 (5.2%) | 5 (4.9%) |
| 18 to 34 Years | 40 (31.5%) | 22 (30.6%) |
| 35 to 64 Years | 32 (13.7%) | 38 (24.4%) |
| 65 to 74 Years | 12 (17.9%) | 34 (31.8%) |
| 75 Years and over | 62 (75.6%) | 21 (22.8%) |
Disability Class by Sex by Age in Hagerman
Disability Class: Hearing Difficulty
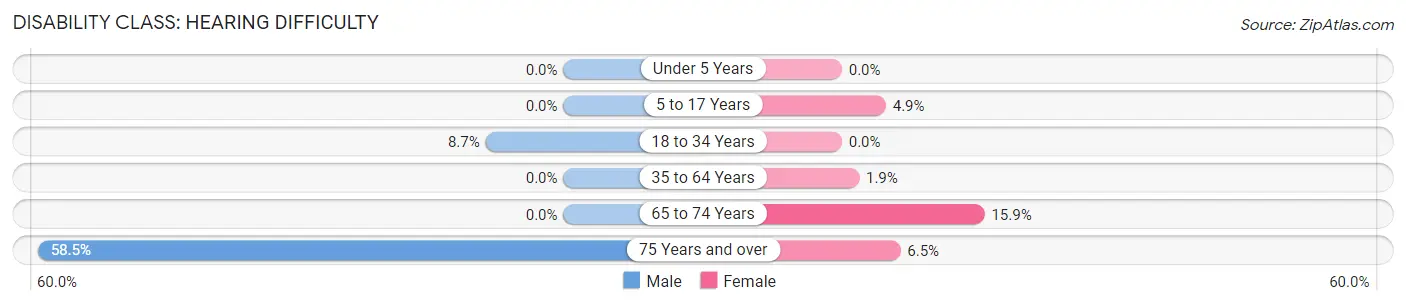
| Age Bracket | Male | Female |
| Under 5 Years | 0 (0.0%) | 0 (0.0%) |
| 5 to 17 Years | 0 (0.0%) | 5 (4.9%) |
| 18 to 34 Years | 11 (8.7%) | 0 (0.0%) |
| 35 to 64 Years | 0 (0.0%) | 3 (1.9%) |
| 65 to 74 Years | 0 (0.0%) | 17 (15.9%) |
| 75 Years and over | 48 (58.5%) | 6 (6.5%) |
Disability Class: Vision Difficulty
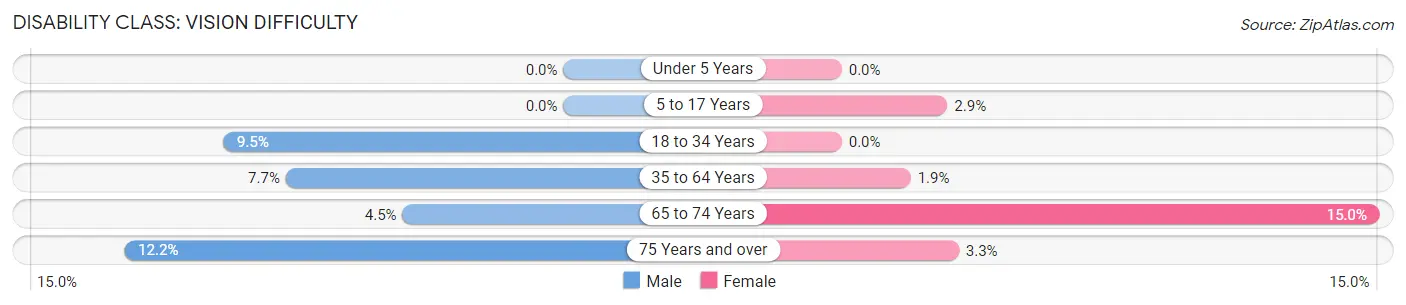
| Age Bracket | Male | Female |
| Under 5 Years | 0 (0.0%) | 0 (0.0%) |
| 5 to 17 Years | 0 (0.0%) | 3 (2.9%) |
| 18 to 34 Years | 12 (9.5%) | 0 (0.0%) |
| 35 to 64 Years | 18 (7.7%) | 3 (1.9%) |
| 65 to 74 Years | 3 (4.5%) | 16 (14.9%) |
| 75 Years and over | 10 (12.2%) | 3 (3.3%) |
Disability Class: Cognitive Difficulty
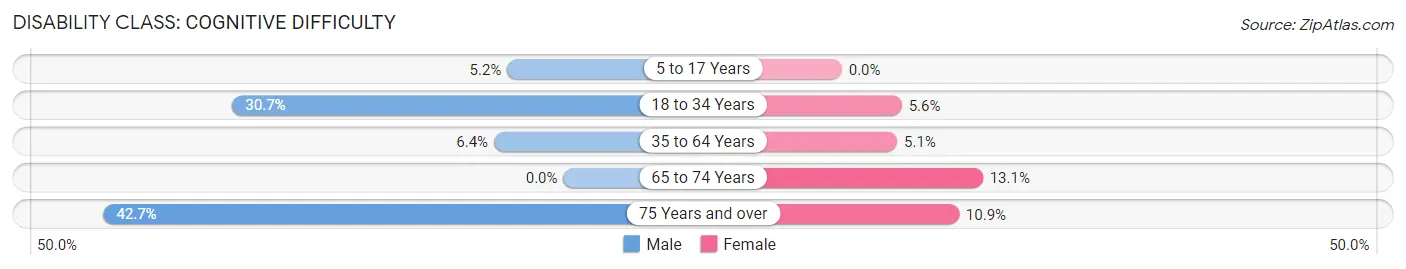
| Age Bracket | Male | Female |
| 5 to 17 Years | 5 (5.2%) | 0 (0.0%) |
| 18 to 34 Years | 39 (30.7%) | 4 (5.6%) |
| 35 to 64 Years | 15 (6.4%) | 8 (5.1%) |
| 65 to 74 Years | 0 (0.0%) | 14 (13.1%) |
| 75 Years and over | 35 (42.7%) | 10 (10.9%) |
Disability Class: Ambulatory Difficulty
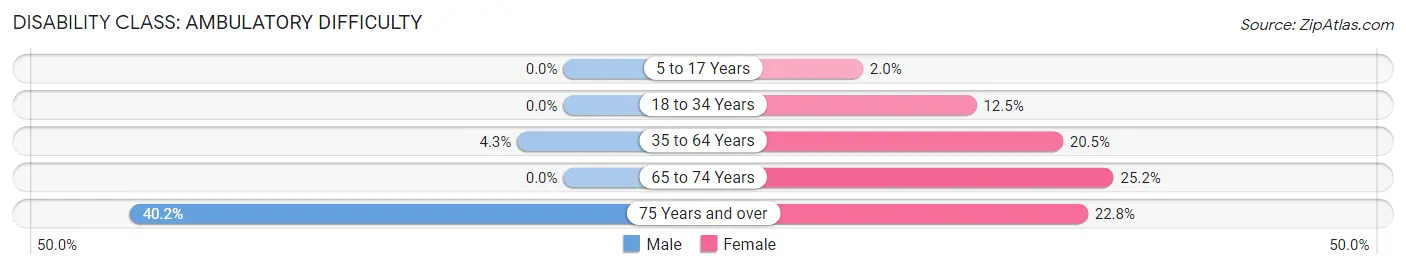
| Age Bracket | Male | Female |
| 5 to 17 Years | 0 (0.0%) | 2 (2.0%) |
| 18 to 34 Years | 0 (0.0%) | 9 (12.5%) |
| 35 to 64 Years | 10 (4.3%) | 32 (20.5%) |
| 65 to 74 Years | 0 (0.0%) | 27 (25.2%) |
| 75 Years and over | 33 (40.2%) | 21 (22.8%) |
Disability Class: Self-Care Difficulty
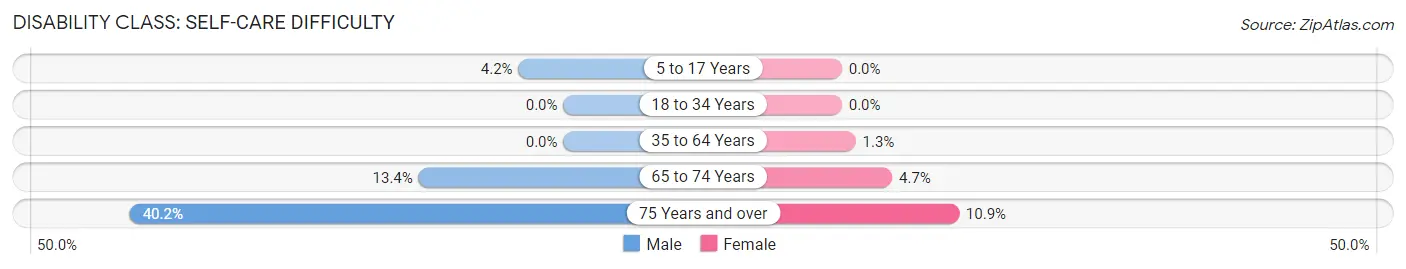
| Age Bracket | Male | Female |
| 5 to 17 Years | 4 (4.2%) | 0 (0.0%) |
| 18 to 34 Years | 0 (0.0%) | 0 (0.0%) |
| 35 to 64 Years | 0 (0.0%) | 2 (1.3%) |
| 65 to 74 Years | 9 (13.4%) | 5 (4.7%) |
| 75 Years and over | 33 (40.2%) | 10 (10.9%) |
Technology Access in Hagerman
Computing Device Access in Hagerman
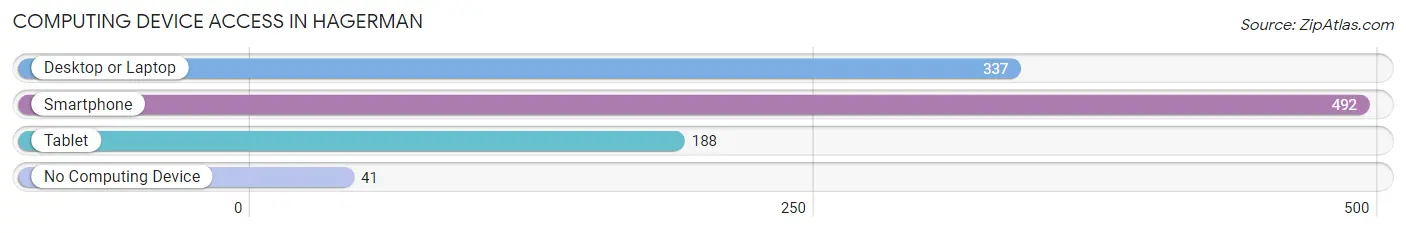
| Device Type | # Households | % Households |
| Desktop or Laptop | 337 | 58.4% |
| Smartphone | 492 | 85.3% |
| Tablet | 188 | 32.6% |
| No Computing Device | 41 | 7.1% |
| Total | 577 | 100.0% |
Internet Access in Hagerman
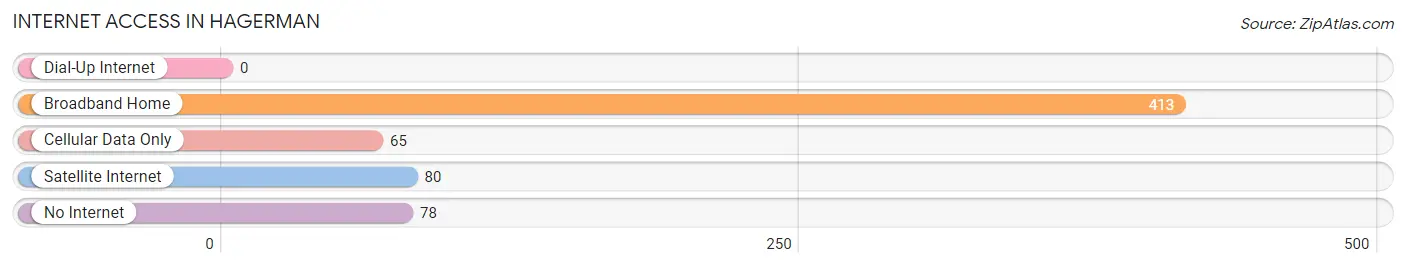
| Internet Type | # Households | % Households |
| Dial-Up Internet | 0 | 0.0% |
| Broadband Home | 413 | 71.6% |
| Cellular Data Only | 65 | 11.3% |
| Satellite Internet | 80 | 13.9% |
| No Internet | 78 | 13.5% |
| Total | 577 | 100.0% |
Hagerman Summary
Hagerman is a small city located in Gooding County, Idaho. It is situated in the Snake River Valley, approximately 40 miles south of Twin Falls. The city is named after William Hagerman, a former president of the Oregon Short Line Railroad. The population of Hagerman was 1,764 at the 2010 census.
History
Hagerman was founded in 1906 by the Oregon Short Line Railroad. The railroad was built to connect the Snake River Valley to the rest of the country. The city was named after William Hagerman, the president of the railroad. The first settlers in the area were farmers and ranchers who were attracted to the fertile soil and abundant water.
The city was incorporated in 1909 and the first mayor was elected in 1910. The city grew rapidly and by 1920, the population had reached 1,000. The city was a major agricultural center and was known for its production of potatoes, sugar beets, and alfalfa.
In the 1930s, the city was hit hard by the Great Depression. Many of the businesses in the city closed and the population declined. However, the city was able to recover and by the 1950s, the population had grown to 1,500.
Geography
Hagerman is located in the Snake River Valley, approximately 40 miles south of Twin Falls. The city is situated at an elevation of 4,000 feet and is surrounded by rolling hills and farmland. The city is located near the Snake River, which provides a source of irrigation for the surrounding area.
The climate in Hagerman is semi-arid, with hot summers and cold winters. The average annual temperature is 54 degrees Fahrenheit. The average annual precipitation is 8.5 inches.
Economy
The economy of Hagerman is largely based on agriculture. The city is known for its production of potatoes, sugar beets, and alfalfa. The city is also home to several food processing plants, including a potato chip factory and a frozen food plant.
The city is also home to several small businesses, including restaurants, retail stores, and service providers. The city is also home to a branch of the College of Southern Idaho, which provides educational opportunities to the local community.
Demographics
As of the 2010 census, the population of Hagerman was 1,764. The racial makeup of the city was 95.3% White, 0.3% African American, 0.7% Native American, 0.3% Asian, 0.1% Pacific Islander, 1.2% from other races, and 2.2% from two or more races. Hispanic or Latino of any race were 4.2% of the population.
The median income for a household in the city was $35,938, and the median income for a family was $41,250. The per capita income for the city was $17,845. About 11.2% of families and 14.2% of the population were below the poverty line, including 18.2% of those under age 18 and 8.3% of those age 65 or over.
Common Questions
What is Per Capita Income in Hagerman?
Per Capita income in Hagerman is $40,870.
What is the Median Family Income in Hagerman?
Median Family Income in Hagerman is $82,321.
What is the Median Household income in Hagerman?
Median Household Income in Hagerman is $66,250.
What is Income or Wage Gap in Hagerman?
Income or Wage Gap in Hagerman is 42.9%.
Women in Hagerman earn 57.1 cents for every dollar earned by a man.
What is Family Income Deficit in Hagerman?
Family Income Deficit in Hagerman is $13,121.
Families that are below poverty line in Hagerman earn $13,121 less on average than the poverty threshold level.
What is Inequality or Gini Index in Hagerman?
Inequality or Gini Index in Hagerman is 0.47.
What is the Total Population of Hagerman?
Total Population of Hagerman is 1,198.
What is the Total Male Population of Hagerman?
Total Male Population of Hagerman is 623.
What is the Total Female Population of Hagerman?
Total Female Population of Hagerman is 575.
What is the Ratio of Males per 100 Females in Hagerman?
There are 108.35 Males per 100 Females in Hagerman.
What is the Ratio of Females per 100 Males in Hagerman?
There are 92.30 Females per 100 Males in Hagerman.
What is the Median Population Age in Hagerman?
Median Population Age in Hagerman is 50.6 Years.
What is the Average Family Size in Hagerman
Average Family Size in Hagerman is 2.9 People.
What is the Average Household Size in Hagerman
Average Household Size in Hagerman is 2.0 People.
How Large is the Labor Force in Hagerman?
There are 492 People in the Labor Forcein in Hagerman.
What is the Percentage of People in the Labor Force in Hagerman?
50.5% of People are in the Labor Force in Hagerman.
What is the Unemployment Rate in Hagerman?
Unemployment Rate in Hagerman is 2.0%.