Bliss, ID Map & Demographics
Bliss Map
Bliss Overview
$21,366
PER CAPITA INCOME
$72,500
AVG FAMILY INCOME
$64,545
AVG HOUSEHOLD INCOME
46.5%
WAGE / INCOME GAP [ % ]
53.5¢/ $1
WAGE / INCOME GAP [ $ ]
0.27
INEQUALITY / GINI INDEX
281
TOTAL POPULATION
100
MALE POPULATION
181
FEMALE POPULATION
55.25
MALES / 100 FEMALES
181.00
FEMALES / 100 MALES
37.4
MEDIAN AGE
3.2
AVG FAMILY SIZE
2.7
AVG HOUSEHOLD SIZE
117
LABOR FORCE [ PEOPLE ]
66.1%
PERCENT IN LABOR FORCE
19.7%
UNEMPLOYMENT RATE
Bliss Zip Codes
Bliss Area Codes
Income in Bliss
Income Overview in Bliss
Per Capita Income in Bliss is $21,366, while median incomes of families and households are $72,500 and $64,545 respectively.
| Characteristic | Number | Measure |
| Per Capita Income | 281 | $21,366 |
| Median Family Income | 74 | $72,500 |
| Mean Family Income | 74 | $65,426 |
| Median Household Income | 104 | $64,545 |
| Mean Household Income | 104 | $55,487 |
| Income Deficit | 74 | $0 |
| Wage / Income Gap (%) | 281 | 46.48% |
| Wage / Income Gap ($) | 281 | 53.52¢ per $1 |
| Gini / Inequality Index | 281 | 0.27 |
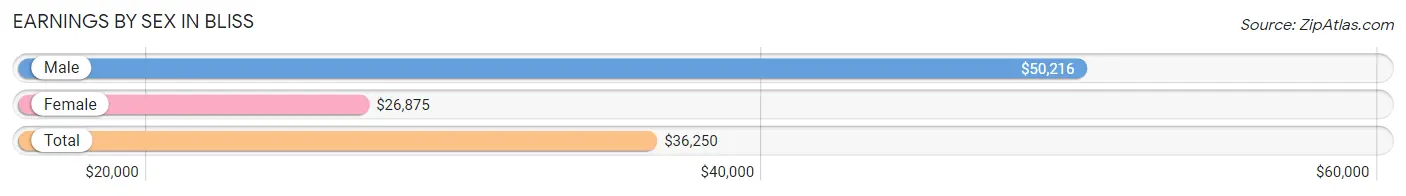
Earnings by Sex in Bliss
Average Earnings in Bliss are $36,250, $50,216 for men and $26,875 for women, a difference of 46.5%.
| Sex | Number | Average Earnings |
| Male | 73 (58.9%) | $50,216 |
| Female | 51 (41.1%) | $26,875 |
| Total | 124 (100.0%) | $36,250 |
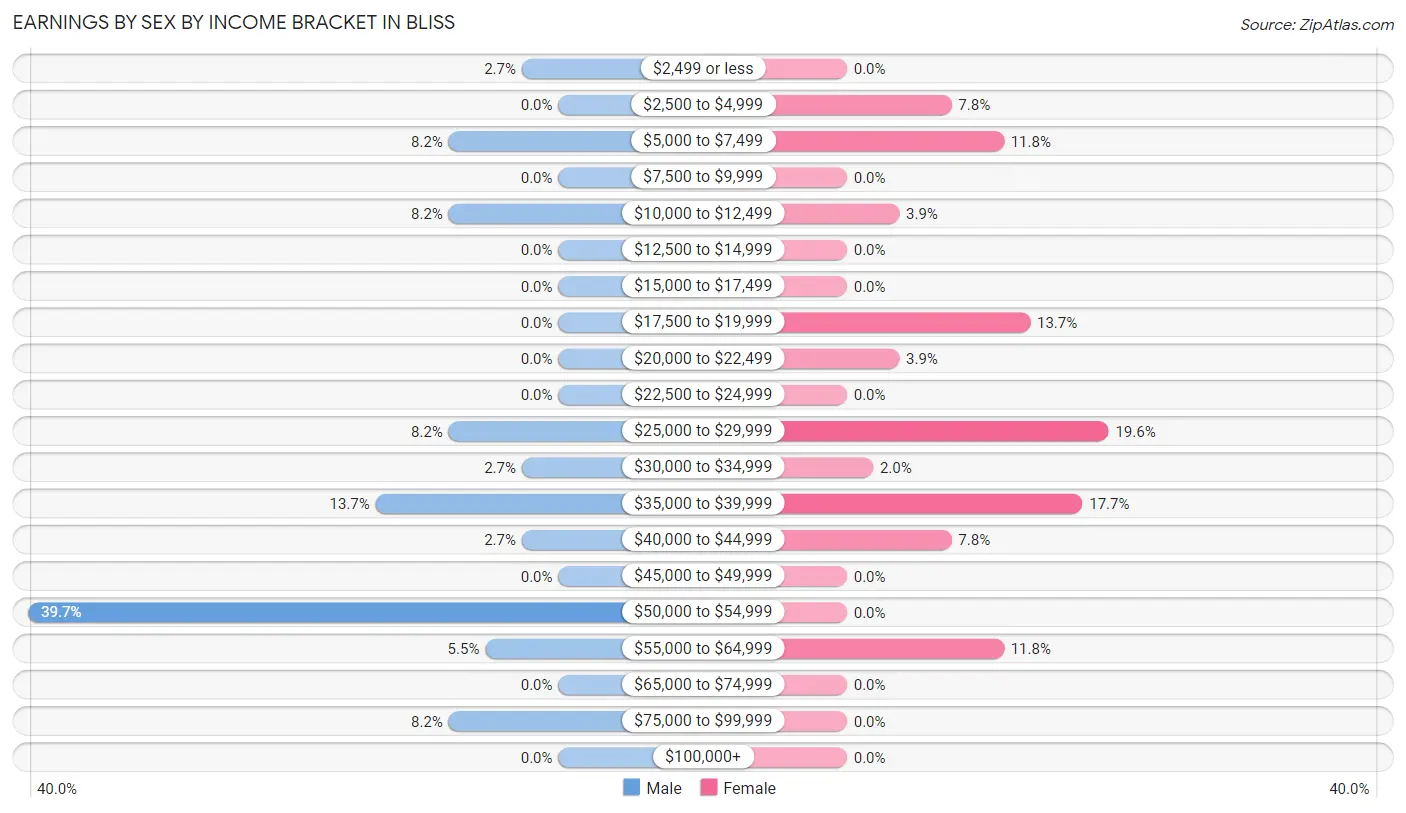
Earnings by Sex by Income Bracket in Bliss
The most common earnings brackets in Bliss are $50,000 to $54,999 for men (29 | 39.7%) and $25,000 to $29,999 for women (10 | 19.6%).
| Income | Male | Female |
| $2,499 or less | 2 (2.7%) | 0 (0.0%) |
| $2,500 to $4,999 | 0 (0.0%) | 4 (7.8%) |
| $5,000 to $7,499 | 6 (8.2%) | 6 (11.8%) |
| $7,500 to $9,999 | 0 (0.0%) | 0 (0.0%) |
| $10,000 to $12,499 | 6 (8.2%) | 2 (3.9%) |
| $12,500 to $14,999 | 0 (0.0%) | 0 (0.0%) |
| $15,000 to $17,499 | 0 (0.0%) | 0 (0.0%) |
| $17,500 to $19,999 | 0 (0.0%) | 7 (13.7%) |
| $20,000 to $22,499 | 0 (0.0%) | 2 (3.9%) |
| $22,500 to $24,999 | 0 (0.0%) | 0 (0.0%) |
| $25,000 to $29,999 | 6 (8.2%) | 10 (19.6%) |
| $30,000 to $34,999 | 2 (2.7%) | 1 (2.0%) |
| $35,000 to $39,999 | 10 (13.7%) | 9 (17.6%) |
| $40,000 to $44,999 | 2 (2.7%) | 4 (7.8%) |
| $45,000 to $49,999 | 0 (0.0%) | 0 (0.0%) |
| $50,000 to $54,999 | 29 (39.7%) | 0 (0.0%) |
| $55,000 to $64,999 | 4 (5.5%) | 6 (11.8%) |
| $65,000 to $74,999 | 0 (0.0%) | 0 (0.0%) |
| $75,000 to $99,999 | 6 (8.2%) | 0 (0.0%) |
| $100,000+ | 0 (0.0%) | 0 (0.0%) |
| Total | 73 (100.0%) | 51 (100.0%) |
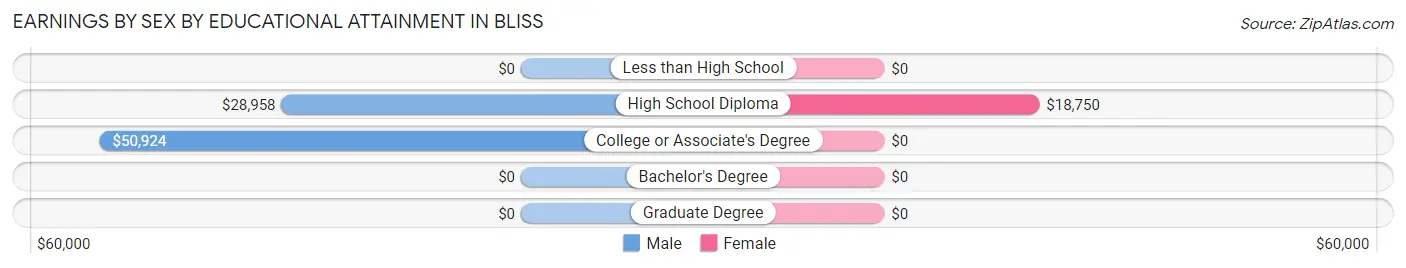
Earnings by Sex by Educational Attainment in Bliss
Average earnings in Bliss are $50,043 for men and $29,063 for women, a difference of 41.9%. Men with an educational attainment of college or associate's degree enjoy the highest average annual earnings of $50,924, while those with high school diploma education earn the least with $28,958. Women with an educational attainment of high school diploma earn the most with the average annual earnings of $18,750, while those with high school diploma education have the smallest earnings of $18,750.
| Educational Attainment | Male Income | Female Income |
| Less than High School | - | - |
| High School Diploma | $28,958 | $18,750 |
| College or Associate's Degree | $50,924 | $0 |
| Bachelor's Degree | - | - |
| Graduate Degree | - | - |
| Total | $50,043 | $29,063 |
Family Income in Bliss
Family Income Brackets in Bliss
According to the Bliss family income data, there are 33 families falling into the $75,000 to $99,999 income range, which is the most common income bracket and makes up 44.6% of all families.
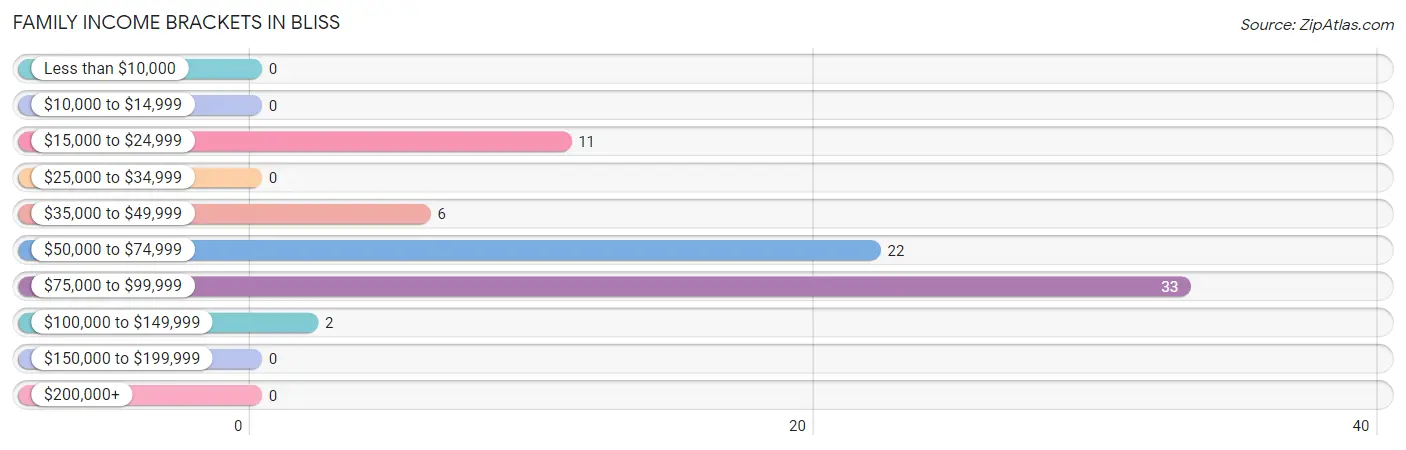
| Income Bracket | # Families | % Families |
| Less than $10,000 | 0 | 0.0% |
| $10,000 to $14,999 | 0 | 0.0% |
| $15,000 to $24,999 | 11 | 14.9% |
| $25,000 to $34,999 | 0 | 0.0% |
| $35,000 to $49,999 | 6 | 8.1% |
| $50,000 to $74,999 | 22 | 29.7% |
| $75,000 to $99,999 | 33 | 44.6% |
| $100,000 to $149,999 | 2 | 2.7% |
| $150,000 to $199,999 | 0 | 0.0% |
| $200,000+ | 0 | 0.0% |
Family Income by Famaliy Size in Bliss
2-person families (59 | 79.7%) account for the highest median family income in Bliss with $77,880 per family, while 2-person families (59 | 79.7%) have the highest median income of $38,940 per family member.
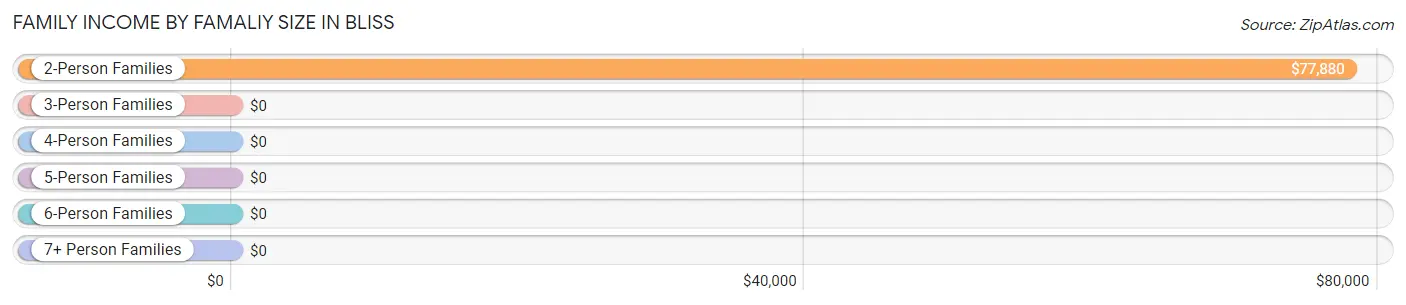
| Income Bracket | # Families | Median Income |
| 2-Person Families | 59 (79.7%) | $77,880 |
| 3-Person Families | 2 (2.7%) | $0 |
| 4-Person Families | 3 (4.1%) | $0 |
| 5-Person Families | 10 (13.5%) | $0 |
| 6-Person Families | 0 (0.0%) | $0 |
| 7+ Person Families | 0 (0.0%) | $0 |
| Total | 74 (100.0%) | $72,500 |
Family Income by Number of Earners in Bliss
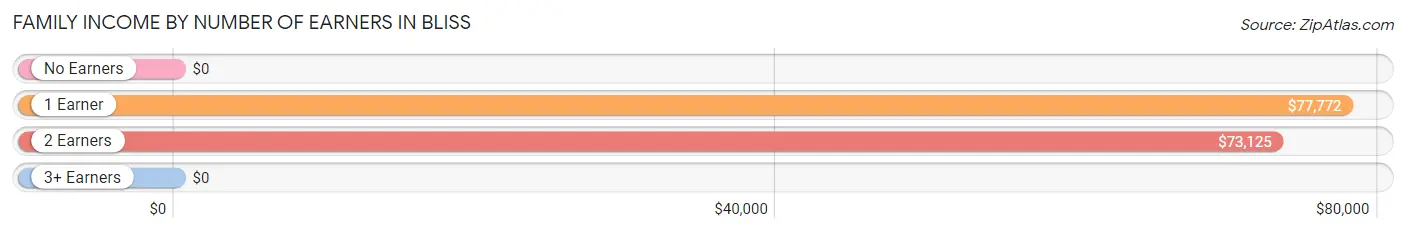
| Number of Earners | # Families | Median Income |
| No Earners | 6 (8.1%) | $0 |
| 1 Earner | 41 (55.4%) | $77,772 |
| 2 Earners | 27 (36.5%) | $73,125 |
| 3+ Earners | 0 (0.0%) | $0 |
| Total | 74 (100.0%) | $72,500 |
Household Income in Bliss
Household Income Brackets in Bliss
With 33 households falling in the category, the $75,000 to $99,999 income range is the most frequent in Bliss, accounting for 31.7% of all households.
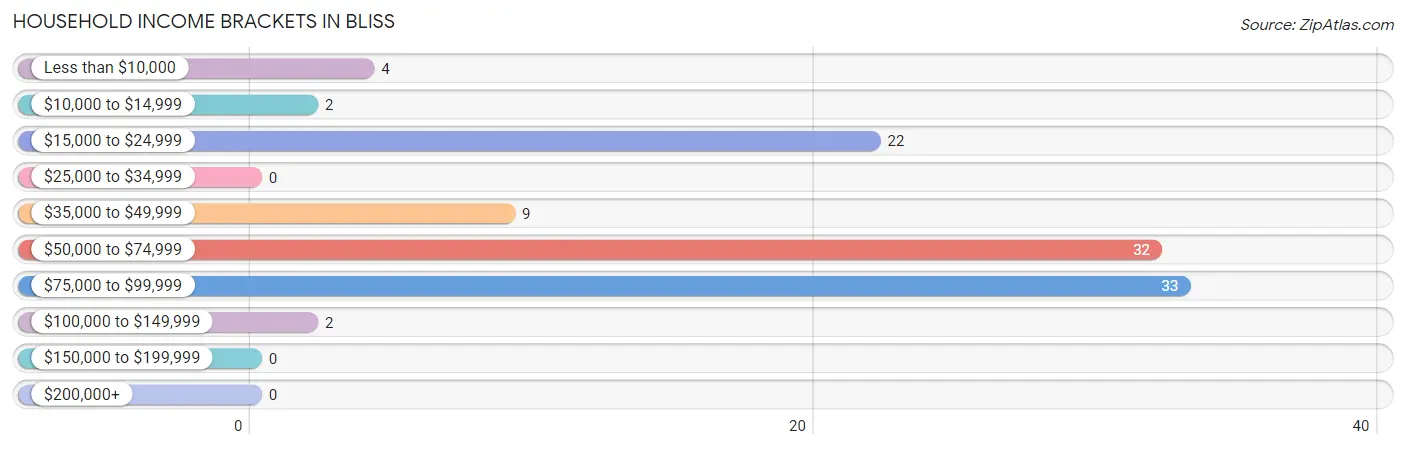
| Income Bracket | # Households | % Households |
| Less than $10,000 | 4 | 3.8% |
| $10,000 to $14,999 | 2 | 1.9% |
| $15,000 to $24,999 | 22 | 21.2% |
| $25,000 to $34,999 | 0 | 0.0% |
| $35,000 to $49,999 | 9 | 8.7% |
| $50,000 to $74,999 | 32 | 30.8% |
| $75,000 to $99,999 | 33 | 31.7% |
| $100,000 to $149,999 | 2 | 1.9% |
| $150,000 to $199,999 | 0 | 0.0% |
| $200,000+ | 0 | 0.0% |
Household Income by Householder Age in Bliss
The median household income in Bliss is $64,545, with the highest median household income of $77,935 found in the 65+ years age bracket for the primary householder. A total of 38 households (36.5%) fall into this category. Meanwhile, the 15 to 24 years age bracket for the primary householder has the lowest median household income of $0, with 4 households (3.8%) in this group.
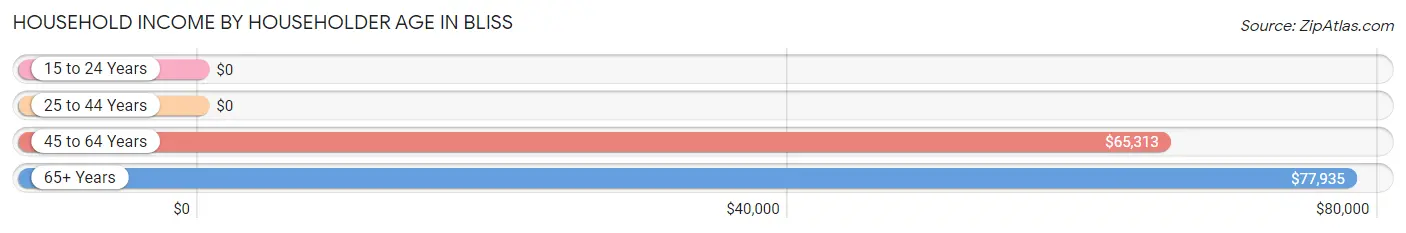
| Income Bracket | # Households | Median Income |
| 15 to 24 Years | 4 (3.8%) | $0 |
| 25 to 44 Years | 21 (20.2%) | $0 |
| 45 to 64 Years | 41 (39.4%) | $65,313 |
| 65+ Years | 38 (36.5%) | $77,935 |
| Total | 104 (100.0%) | $64,545 |
Poverty in Bliss
Income Below Poverty by Sex and Age in Bliss
With 5.0% poverty level for males and 7.7% for females among the residents of Bliss, 25 to 34 year old males and 18 to 24 year old females are the most vulnerable to poverty, with 1 males (100.0%) and 4 females (100.0%) in their respective age groups living below the poverty level.
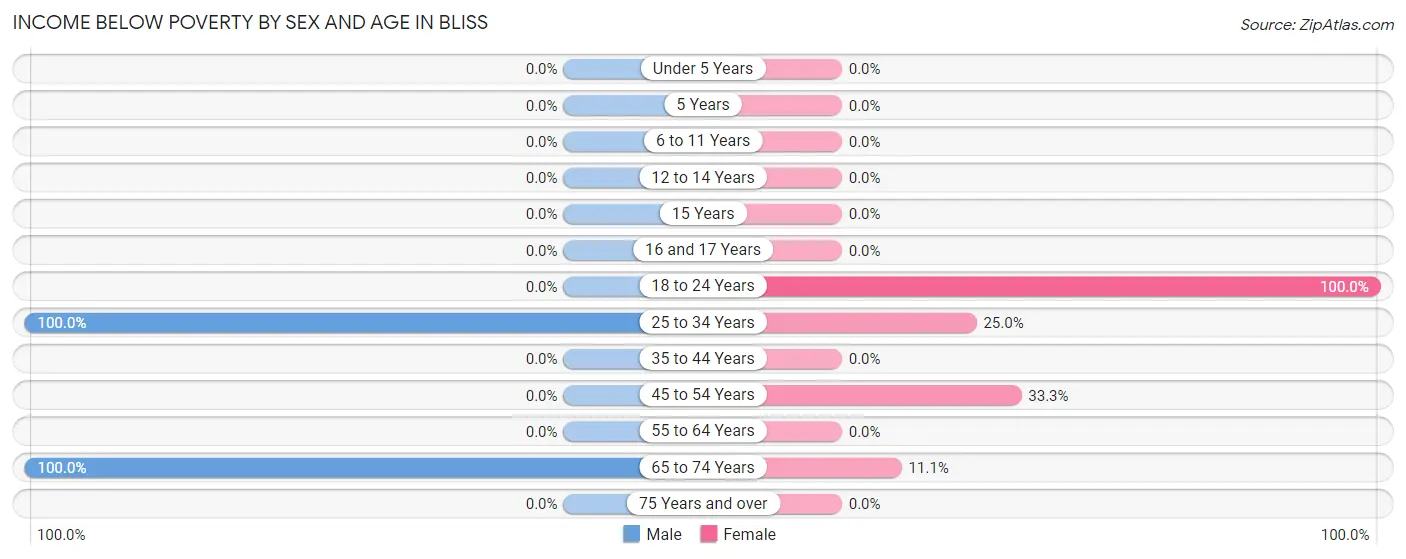
| Age Bracket | Male | Female |
| Under 5 Years | 0 (0.0%) | 0 (0.0%) |
| 5 Years | 0 (0.0%) | 0 (0.0%) |
| 6 to 11 Years | 0 (0.0%) | 0 (0.0%) |
| 12 to 14 Years | 0 (0.0%) | 0 (0.0%) |
| 15 Years | 0 (0.0%) | 0 (0.0%) |
| 16 and 17 Years | 0 (0.0%) | 0 (0.0%) |
| 18 to 24 Years | 0 (0.0%) | 4 (100.0%) |
| 25 to 34 Years | 1 (100.0%) | 2 (25.0%) |
| 35 to 44 Years | 0 (0.0%) | 0 (0.0%) |
| 45 to 54 Years | 0 (0.0%) | 7 (33.3%) |
| 55 to 64 Years | 0 (0.0%) | 0 (0.0%) |
| 65 to 74 Years | 4 (100.0%) | 1 (11.1%) |
| 75 Years and over | 0 (0.0%) | 0 (0.0%) |
| Total | 5 (5.0%) | 14 (7.7%) |
Income Above Poverty by Sex and Age in Bliss
According to the poverty statistics in Bliss, males aged 5 years and females aged under 5 years are the age groups that are most secure financially, with 100.0% of males and 100.0% of females in these age groups living above the poverty line.
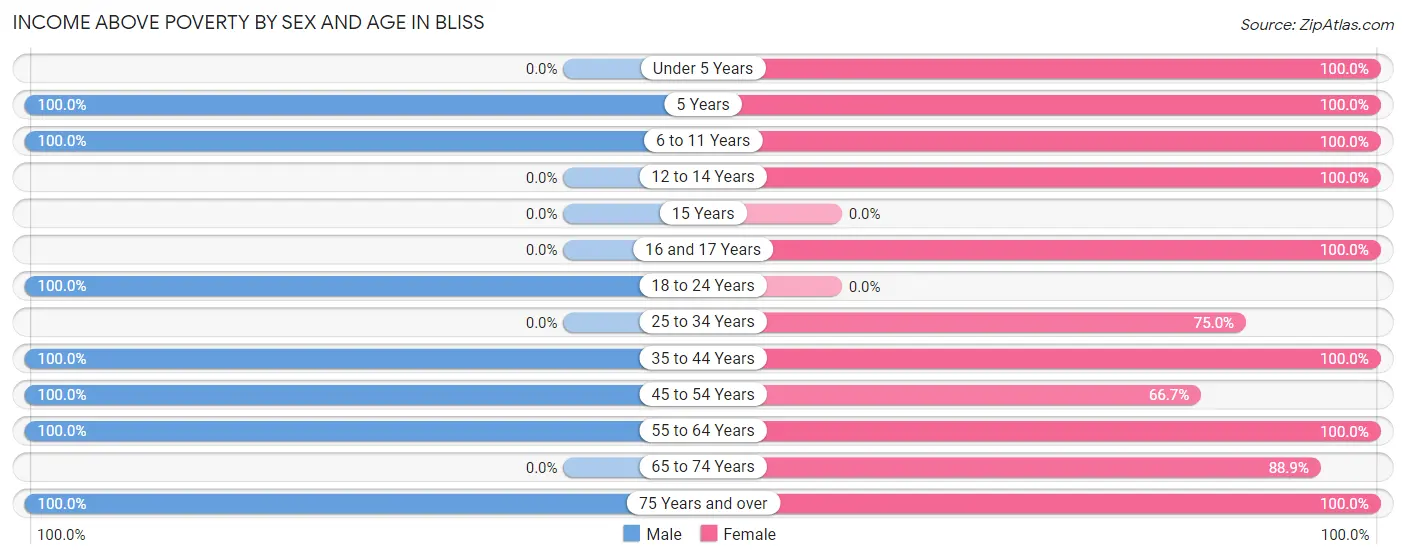
| Age Bracket | Male | Female |
| Under 5 Years | 0 (0.0%) | 3 (100.0%) |
| 5 Years | 2 (100.0%) | 15 (100.0%) |
| 6 to 11 Years | 10 (100.0%) | 39 (100.0%) |
| 12 to 14 Years | 0 (0.0%) | 35 (100.0%) |
| 15 Years | 0 (0.0%) | 0 (0.0%) |
| 16 and 17 Years | 0 (0.0%) | 4 (100.0%) |
| 18 to 24 Years | 4 (100.0%) | 0 (0.0%) |
| 25 to 34 Years | 0 (0.0%) | 6 (75.0%) |
| 35 to 44 Years | 17 (100.0%) | 13 (100.0%) |
| 45 to 54 Years | 9 (100.0%) | 14 (66.7%) |
| 55 to 64 Years | 23 (100.0%) | 17 (100.0%) |
| 65 to 74 Years | 0 (0.0%) | 8 (88.9%) |
| 75 Years and over | 30 (100.0%) | 13 (100.0%) |
| Total | 95 (95.0%) | 167 (92.3%) |
Income Below Poverty Among Married-Couple Families in Bliss
The poverty statistics for married-couple families in Bliss show that 6.8% or 4 of the total 59 families live below the poverty line. Families with no children have the highest poverty rate of 8.7%, comprising of 4 families. On the other hand, families with 1 or 2 children have the lowest poverty rate of 0.0%, which includes 0 families.
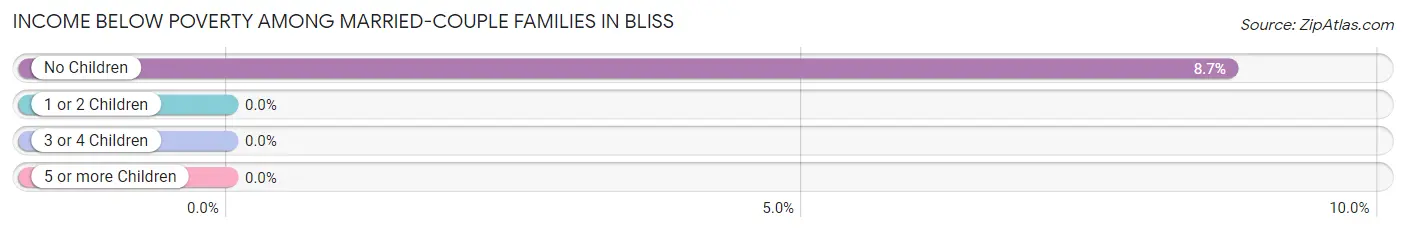
| Children | Above Poverty | Below Poverty |
| No Children | 42 (91.3%) | 4 (8.7%) |
| 1 or 2 Children | 3 (100.0%) | 0 (0.0%) |
| 3 or 4 Children | 10 (100.0%) | 0 (0.0%) |
| 5 or more Children | 0 (0.0%) | 0 (0.0%) |
| Total | 55 (93.2%) | 4 (6.8%) |
Income Below Poverty Among Single-Parent Households in Bliss
| Children | Single Father | Single Mother |
| No Children | 0 (0.0%) | 0 (0.0%) |
| 1 or 2 Children | 0 (0.0%) | 0 (0.0%) |
| 3 or 4 Children | 0 (0.0%) | 0 (0.0%) |
| 5 or more Children | 0 (0.0%) | 0 (0.0%) |
| Total | 0 (0.0%) | 0 (0.0%) |
Income Below Poverty Among Married-Couple vs Single-Parent Households in Bliss
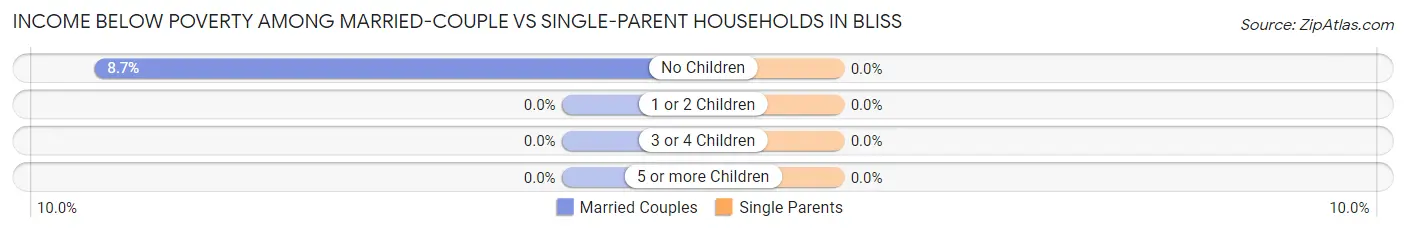
| Children | Married-Couple Families | Single-Parent Households |
| No Children | 4 (8.7%) | 0 (0.0%) |
| 1 or 2 Children | 0 (0.0%) | 0 (0.0%) |
| 3 or 4 Children | 0 (0.0%) | 0 (0.0%) |
| 5 or more Children | 0 (0.0%) | 0 (0.0%) |
| Total | 4 (6.8%) | 0 (0.0%) |
Race in Bliss
The most populous races in Bliss are White / Caucasian (254 | 90.4%), Hispanic or Latino (147 | 52.3%), and Some other Race (16 | 5.7%).
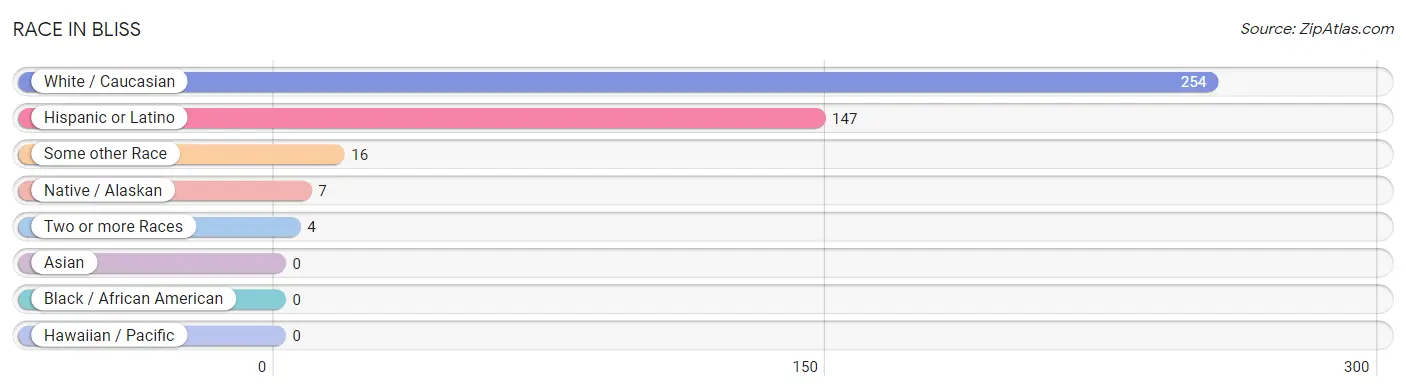
| Race | # Population | % Population |
| Asian | 0 | 0.0% |
| Black / African American | 0 | 0.0% |
| Hawaiian / Pacific | 0 | 0.0% |
| Hispanic or Latino | 147 | 52.3% |
| Native / Alaskan | 7 | 2.5% |
| White / Caucasian | 254 | 90.4% |
| Two or more Races | 4 | 1.4% |
| Some other Race | 16 | 5.7% |
| Total | 281 | 100.0% |
Ancestry in Bliss
The most populous ancestries reported in Bliss are Mexican (144 | 51.2%), English (50 | 17.8%), Irish (18 | 6.4%), German (17 | 6.0%), and Sioux (7 | 2.5%), together accounting for 84.0% of all Bliss residents.
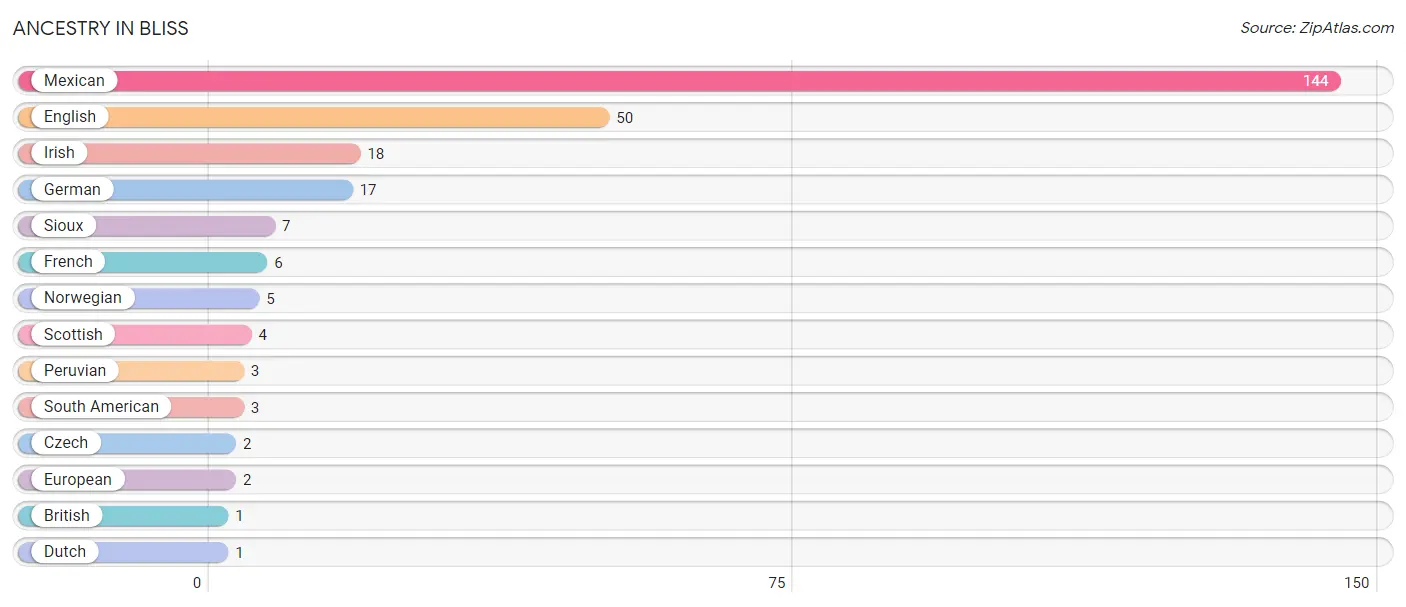
| Ancestry | # Population | % Population |
| British | 1 | 0.4% |
| Czech | 2 | 0.7% |
| Dutch | 1 | 0.4% |
| English | 50 | 17.8% |
| European | 2 | 0.7% |
| French | 6 | 2.1% |
| German | 17 | 6.0% |
| Irish | 18 | 6.4% |
| Mexican | 144 | 51.2% |
| Norwegian | 5 | 1.8% |
| Peruvian | 3 | 1.1% |
| Scottish | 4 | 1.4% |
| Sioux | 7 | 2.5% |
| South American | 3 | 1.1% | View All 14 Rows |
Immigrants in Bliss
The most numerous immigrant groups reported in Bliss came from Latin America (60 | 21.3%), Central America (57 | 20.3%), Mexico (57 | 20.3%), Peru (3 | 1.1%), and South America (3 | 1.1%), together accounting for 64.1% of all Bliss residents.
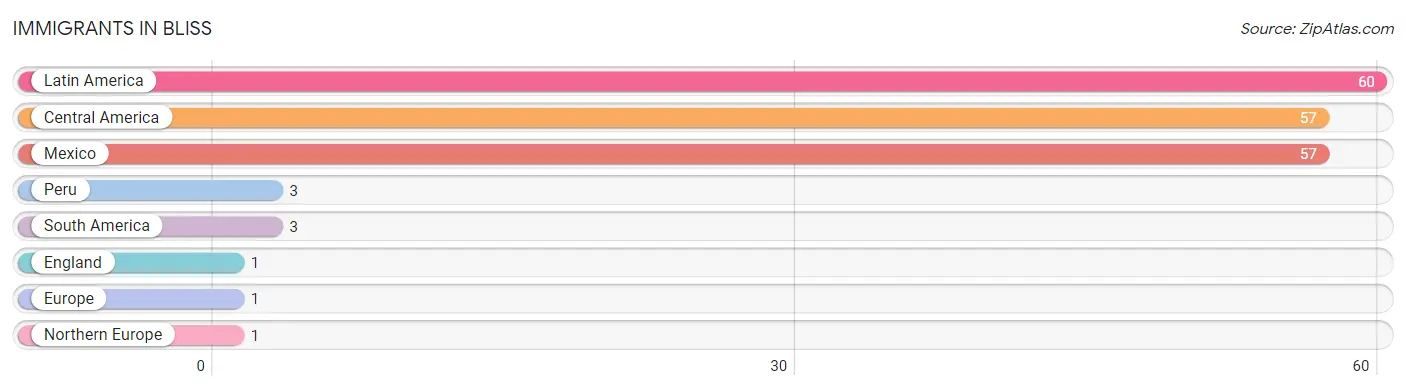
| Immigration Origin | # Population | % Population |
| Central America | 57 | 20.3% |
| England | 1 | 0.4% |
| Europe | 1 | 0.4% |
| Latin America | 60 | 21.3% |
| Mexico | 57 | 20.3% |
| Northern Europe | 1 | 0.4% |
| Peru | 3 | 1.1% |
| South America | 3 | 1.1% | View All 8 Rows |
Sex and Age in Bliss
Sex and Age in Bliss
The most populous age groups in Bliss are 80 to 84 Years (23 | 23.0%) for men and 10 to 14 Years (50 | 27.6%) for women.
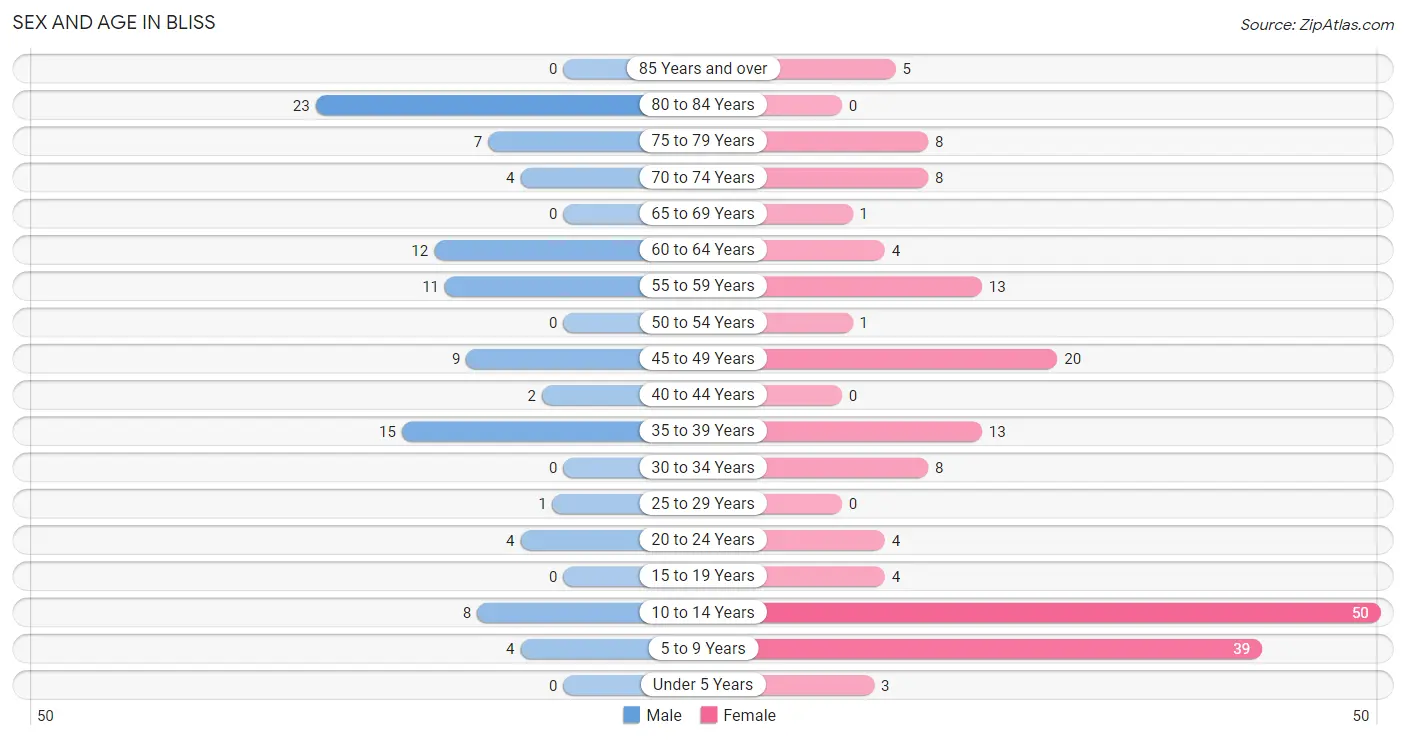
| Age Bracket | Male | Female |
| Under 5 Years | 0 (0.0%) | 3 (1.7%) |
| 5 to 9 Years | 4 (4.0%) | 39 (21.5%) |
| 10 to 14 Years | 8 (8.0%) | 50 (27.6%) |
| 15 to 19 Years | 0 (0.0%) | 4 (2.2%) |
| 20 to 24 Years | 4 (4.0%) | 4 (2.2%) |
| 25 to 29 Years | 1 (1.0%) | 0 (0.0%) |
| 30 to 34 Years | 0 (0.0%) | 8 (4.4%) |
| 35 to 39 Years | 15 (15.0%) | 13 (7.2%) |
| 40 to 44 Years | 2 (2.0%) | 0 (0.0%) |
| 45 to 49 Years | 9 (9.0%) | 20 (11.1%) |
| 50 to 54 Years | 0 (0.0%) | 1 (0.5%) |
| 55 to 59 Years | 11 (11.0%) | 13 (7.2%) |
| 60 to 64 Years | 12 (12.0%) | 4 (2.2%) |
| 65 to 69 Years | 0 (0.0%) | 1 (0.5%) |
| 70 to 74 Years | 4 (4.0%) | 8 (4.4%) |
| 75 to 79 Years | 7 (7.0%) | 8 (4.4%) |
| 80 to 84 Years | 23 (23.0%) | 0 (0.0%) |
| 85 Years and over | 0 (0.0%) | 5 (2.8%) |
| Total | 100 (100.0%) | 181 (100.0%) |
Families and Households in Bliss
Median Family Size in Bliss
The median family size in Bliss is 3.18 persons per family, with married-couple families (59 | 79.7%) accounting for the largest median family size of 3.51 persons per family. On the other hand, single female/mother families (11 | 14.9%) represent the smallest median family size with 1.82 persons per family.
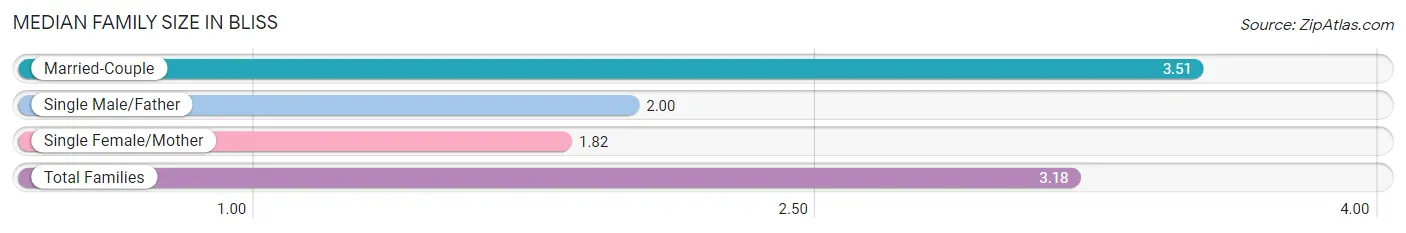
| Family Type | # Families | Family Size |
| Married-Couple | 59 (79.7%) | 3.51 |
| Single Male/Father | 4 (5.4%) | 2.00 |
| Single Female/Mother | 11 (14.9%) | 1.82 |
| Total Families | 74 (100.0%) | 3.18 |
Median Household Size in Bliss
The median household size in Bliss is 2.70 persons per household, with single male/father households (4 | 3.8%) accounting for the largest median household size of 3.75 persons per household. non-family households (30 | 28.8%) represent the smallest median household size with 1.30 persons per household.
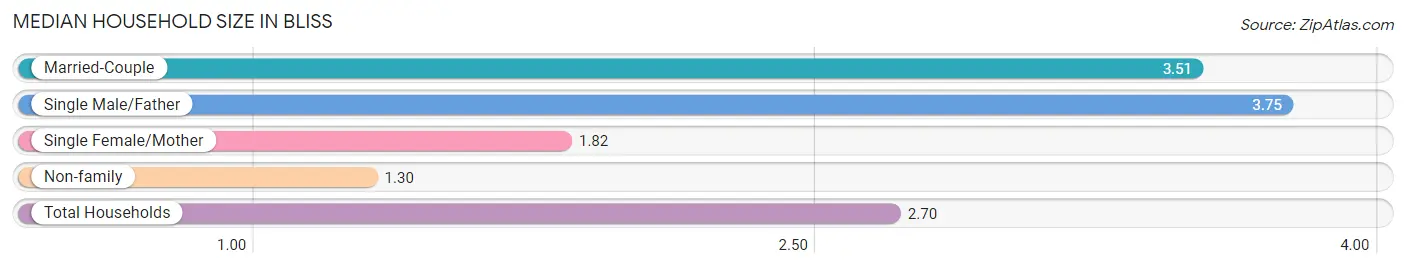
| Household Type | # Households | Household Size |
| Married-Couple | 59 (56.7%) | 3.51 |
| Single Male/Father | 4 (3.8%) | 3.75 |
| Single Female/Mother | 11 (10.6%) | 1.82 |
| Non-family | 30 (28.8%) | 1.30 |
| Total Households | 104 (100.0%) | 2.70 |
Household Size by Marriage Status in Bliss
Out of a total of 104 households in Bliss, 74 (71.2%) are family households, while 30 (28.8%) are nonfamily households. The most numerous type of family households are 2-person households, comprising 55, and the most common type of nonfamily households are 1-person households, comprising 26.
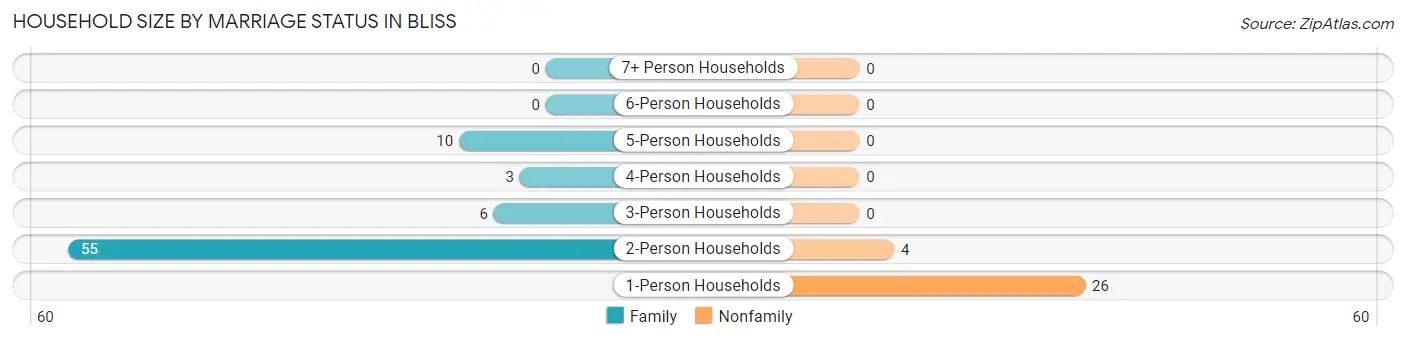
| Household Size | Family Households | Nonfamily Households |
| 1-Person Households | - | 26 (25.0%) |
| 2-Person Households | 55 (52.9%) | 4 (3.8%) |
| 3-Person Households | 6 (5.8%) | 0 (0.0%) |
| 4-Person Households | 3 (2.9%) | 0 (0.0%) |
| 5-Person Households | 10 (9.6%) | 0 (0.0%) |
| 6-Person Households | 0 (0.0%) | 0 (0.0%) |
| 7+ Person Households | 0 (0.0%) | 0 (0.0%) |
| Total | 74 (71.2%) | 30 (28.8%) |
Female Fertility in Bliss
Fertility by Age in Bliss
Average fertility rate in Bliss is 41.0 births per 1,000 women. Women in the age bracket of 35 to 50 years have the highest fertility rate with 61.0 births per 1,000 women. Women in the age bracket of 35 to 50 years acount for 100.0% of all women with births.
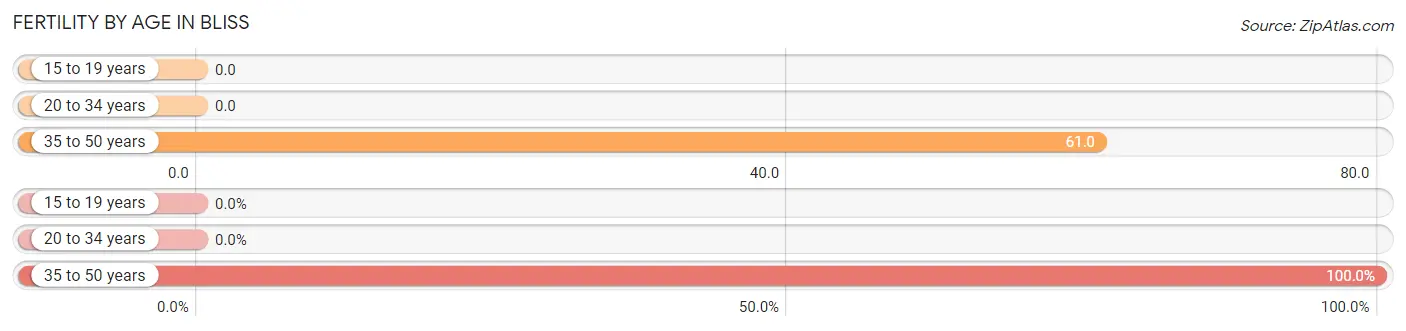
| Age Bracket | Women with Births | Births / 1,000 Women |
| 15 to 19 years | 0 (0.0%) | 0.0 |
| 20 to 34 years | 0 (0.0%) | 0.0 |
| 35 to 50 years | 2 (100.0%) | 61.0 |
| Total | 2 (100.0%) | 41.0 |
Fertility by Age by Marriage Status in Bliss
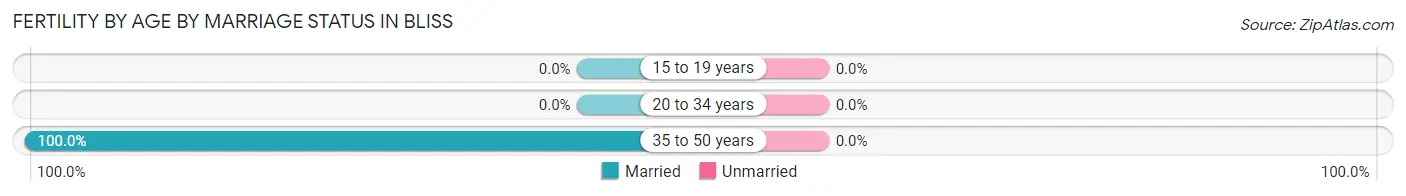
| Age Bracket | Married | Unmarried |
| 15 to 19 years | 0 (0.0%) | 0 (0.0%) |
| 20 to 34 years | 0 (0.0%) | 0 (0.0%) |
| 35 to 50 years | 2 (100.0%) | 0 (0.0%) |
| Total | 2 (100.0%) | 0 (0.0%) |
Fertility by Education in Bliss
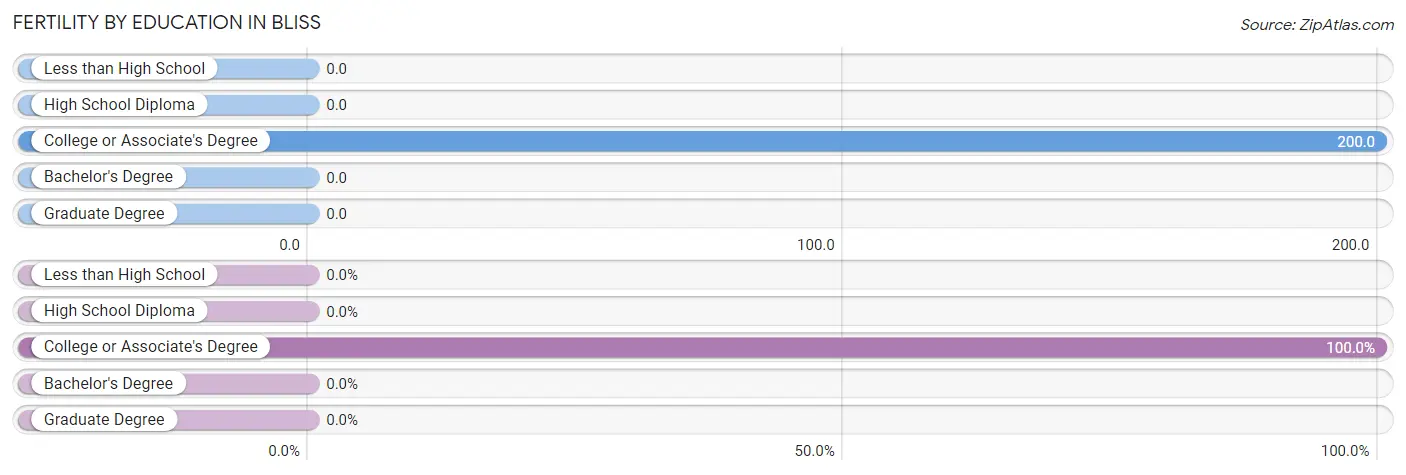
| Educational Attainment | Women with Births | Births / 1,000 Women |
| Less than High School | 0 (0.0%) | 0.0 |
| High School Diploma | 0 (0.0%) | 0.0 |
| College or Associate's Degree | 2 (100.0%) | 200.0 |
| Bachelor's Degree | 0 (0.0%) | 0.0 |
| Graduate Degree | 0 (0.0%) | 0.0 |
| Total | 2 (100.0%) | 41.0 |
Fertility by Education by Marriage Status in Bliss
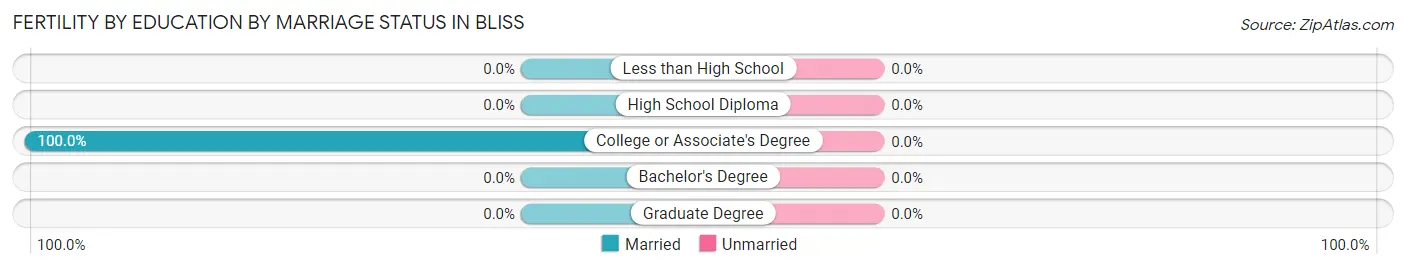
| Educational Attainment | Married | Unmarried |
| Less than High School | 0 (0.0%) | 0 (0.0%) |
| High School Diploma | 0 (0.0%) | 0 (0.0%) |
| College or Associate's Degree | 2 (100.0%) | 0 (0.0%) |
| Bachelor's Degree | 0 (0.0%) | 0 (0.0%) |
| Graduate Degree | 0 (0.0%) | 0 (0.0%) |
| Total | 2 (100.0%) | 0 (0.0%) |
Employment Characteristics in Bliss
Employment by Class of Employer in Bliss
Among the 88 employed individuals in Bliss, private company employees (55 | 62.5%), self-employed (not incorporated) (19 | 21.6%), and state government employees (10 | 11.4%) make up the most common classes of employment.
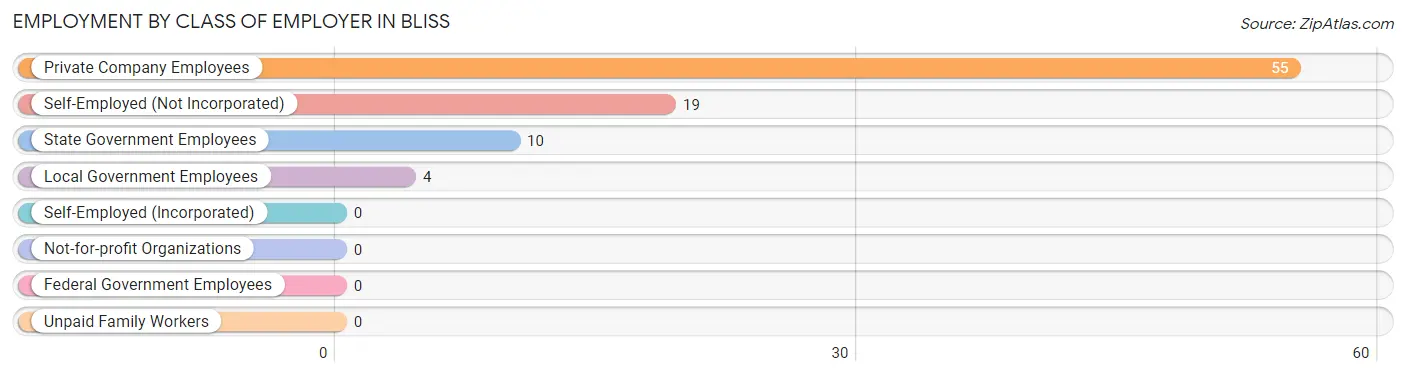
| Employer Class | # Employees | % Employees |
| Private Company Employees | 55 | 62.5% |
| Self-Employed (Incorporated) | 0 | 0.0% |
| Self-Employed (Not Incorporated) | 19 | 21.6% |
| Not-for-profit Organizations | 0 | 0.0% |
| Local Government Employees | 4 | 4.5% |
| State Government Employees | 10 | 11.4% |
| Federal Government Employees | 0 | 0.0% |
| Unpaid Family Workers | 0 | 0.0% |
| Total | 88 | 100.0% |
Employment Status by Age in Bliss
According to the labor force statistics for Bliss, out of the total population over 16 years of age (177), 66.1% or 117 individuals are in the labor force, with 19.7% or 23 of them unemployed. The age group with the highest labor force participation rate is 16 to 19 years, with 100.0% or 4 individuals in the labor force. Within the labor force, the 75 years and over age range has the highest percentage of unemployed individuals, with 100.0% or 23 of them being unemployed.
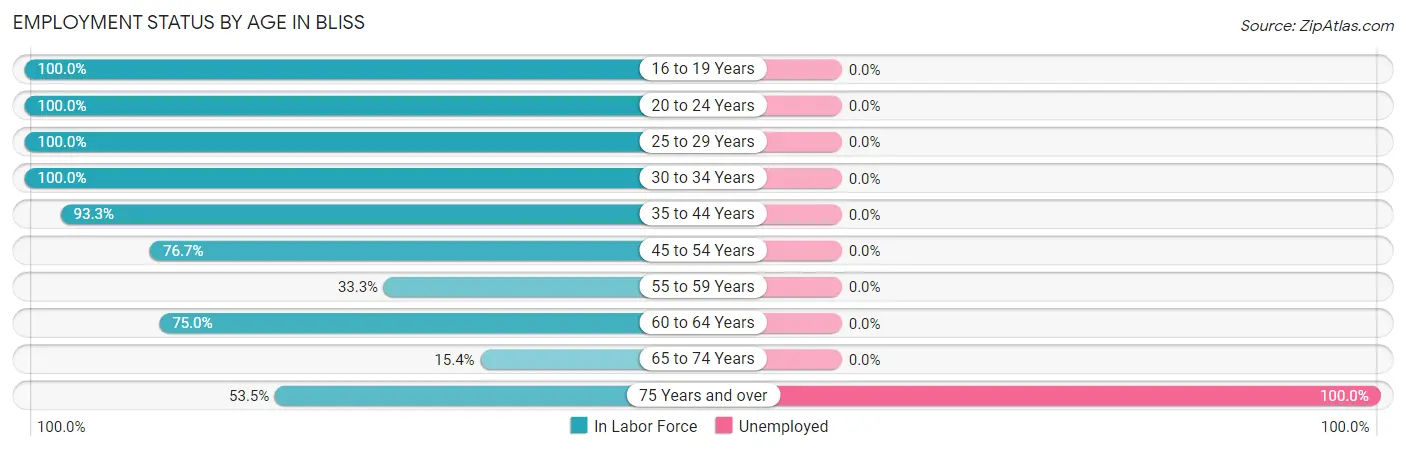
| Age Bracket | In Labor Force | Unemployed |
| 16 to 19 Years | 4 (100.0%) | 0 (0.0%) |
| 20 to 24 Years | 8 (100.0%) | 0 (0.0%) |
| 25 to 29 Years | 1 (100.0%) | 0 (0.0%) |
| 30 to 34 Years | 8 (100.0%) | 0 (0.0%) |
| 35 to 44 Years | 28 (93.3%) | 0 (0.0%) |
| 45 to 54 Years | 23 (76.7%) | 0 (0.0%) |
| 55 to 59 Years | 8 (33.3%) | 0 (0.0%) |
| 60 to 64 Years | 12 (75.0%) | 0 (0.0%) |
| 65 to 74 Years | 2 (15.4%) | 0 (0.0%) |
| 75 Years and over | 23 (53.5%) | 23 (100.0%) |
| Total | 117 (66.1%) | 23 (19.7%) |
Employment Status by Educational Attainment in Bliss
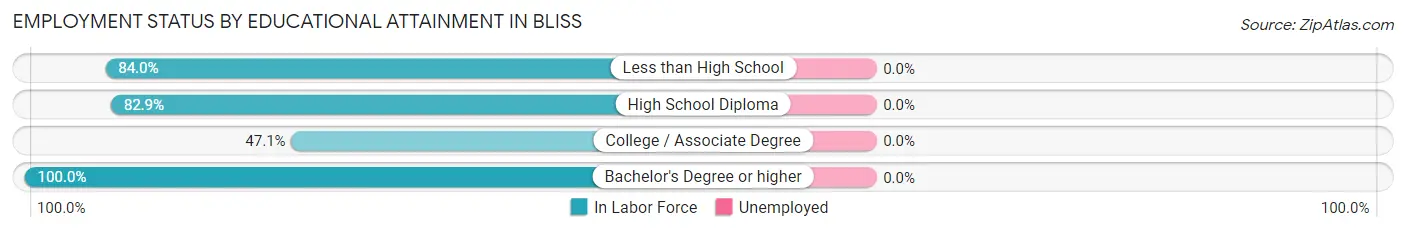
| Educational Attainment | In Labor Force | Unemployed |
| Less than High School | 21 (84.0%) | 0 (0.0%) |
| High School Diploma | 34 (82.9%) | 0 (0.0%) |
| College / Associate Degree | 16 (47.1%) | 0 (0.0%) |
| Bachelor's Degree or higher | 9 (100.0%) | 0 (0.0%) |
| Total | 80 (73.4%) | 0 (0.0%) |
Employment Occupations by Sex in Bliss
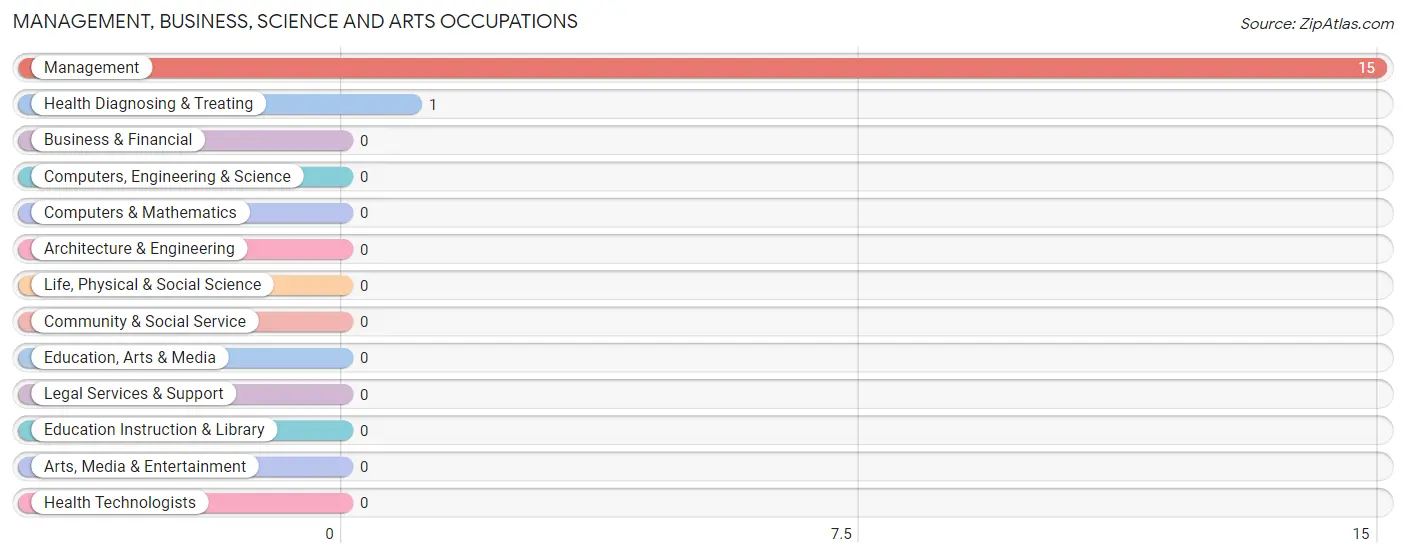
Management, Business, Science and Arts Occupations
The most common Management, Business, Science and Arts occupations in Bliss are Management (15 | 16.0%), and Health Diagnosing & Treating (1 | 1.1%).
Management, Business, Science and Arts Occupations by Sex
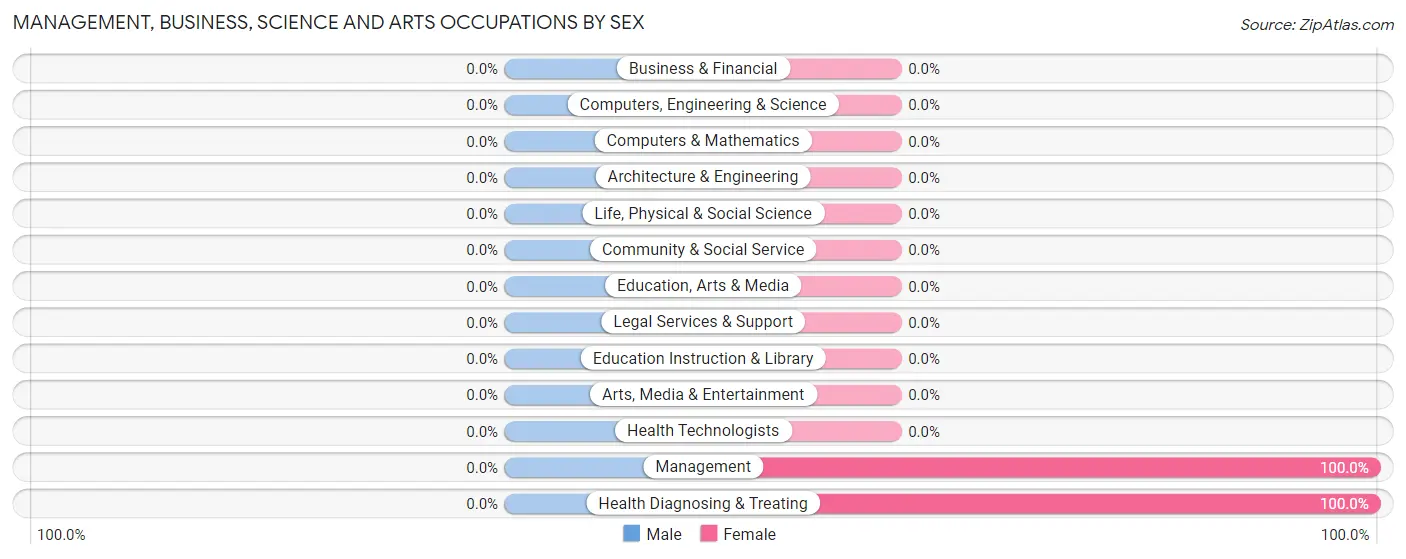
| Occupation | Male | Female |
| Management | 0 (0.0%) | 15 (100.0%) |
| Business & Financial | 0 (0.0%) | 0 (0.0%) |
| Computers, Engineering & Science | 0 (0.0%) | 0 (0.0%) |
| Computers & Mathematics | 0 (0.0%) | 0 (0.0%) |
| Architecture & Engineering | 0 (0.0%) | 0 (0.0%) |
| Life, Physical & Social Science | 0 (0.0%) | 0 (0.0%) |
| Community & Social Service | 0 (0.0%) | 0 (0.0%) |
| Education, Arts & Media | 0 (0.0%) | 0 (0.0%) |
| Legal Services & Support | 0 (0.0%) | 0 (0.0%) |
| Education Instruction & Library | 0 (0.0%) | 0 (0.0%) |
| Arts, Media & Entertainment | 0 (0.0%) | 0 (0.0%) |
| Health Diagnosing & Treating | 0 (0.0%) | 1 (100.0%) |
| Health Technologists | 0 (0.0%) | 0 (0.0%) |
| Total (Category) | 0 (0.0%) | 16 (100.0%) |
| Total (Overall) | 45 (47.9%) | 49 (52.1%) |
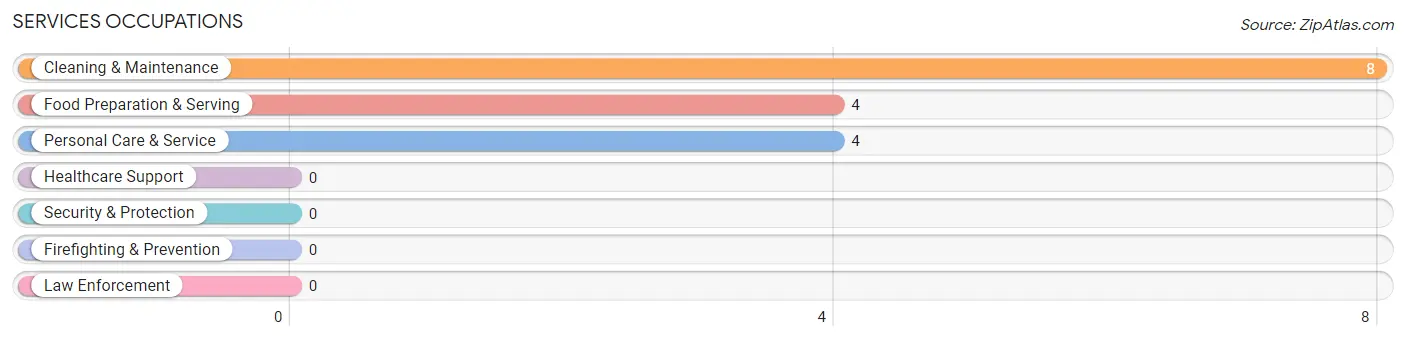
Services Occupations
The most common Services occupations in Bliss are Cleaning & Maintenance (8 | 8.5%), Food Preparation & Serving (4 | 4.3%), and Personal Care & Service (4 | 4.3%).
Services Occupations by Sex
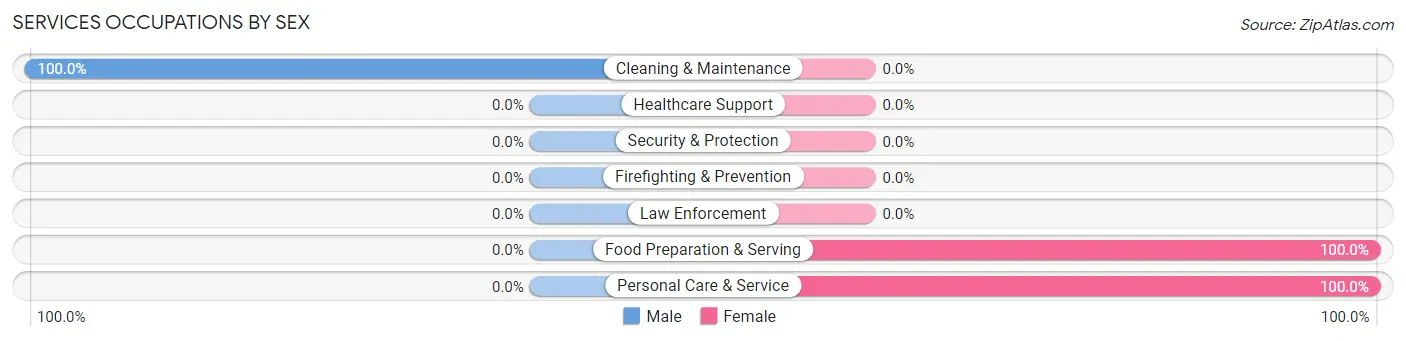
| Occupation | Male | Female |
| Healthcare Support | 0 (0.0%) | 0 (0.0%) |
| Security & Protection | 0 (0.0%) | 0 (0.0%) |
| Firefighting & Prevention | 0 (0.0%) | 0 (0.0%) |
| Law Enforcement | 0 (0.0%) | 0 (0.0%) |
| Food Preparation & Serving | 0 (0.0%) | 4 (100.0%) |
| Cleaning & Maintenance | 8 (100.0%) | 0 (0.0%) |
| Personal Care & Service | 0 (0.0%) | 4 (100.0%) |
| Total (Category) | 8 (50.0%) | 8 (50.0%) |
| Total (Overall) | 45 (47.9%) | 49 (52.1%) |
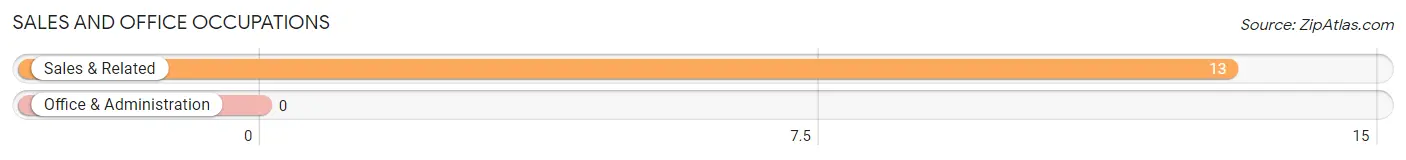
Sales and Office Occupations
The most common Sales and Office occupations in Bliss are , and Sales & Related (13 | 13.8%).
Sales and Office Occupations by Sex
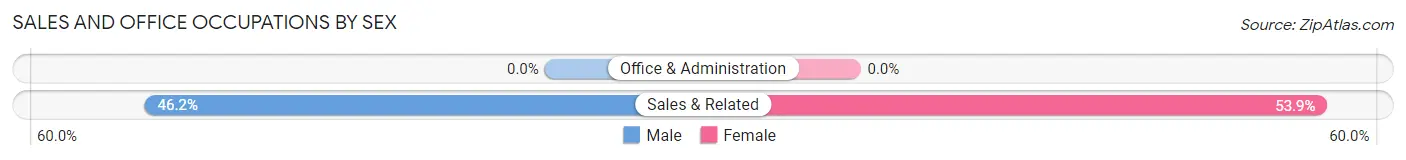
| Occupation | Male | Female |
| Sales & Related | 6 (46.2%) | 7 (53.8%) |
| Office & Administration | 0 (0.0%) | 0 (0.0%) |
| Total (Category) | 6 (46.2%) | 7 (53.8%) |
| Total (Overall) | 45 (47.9%) | 49 (52.1%) |
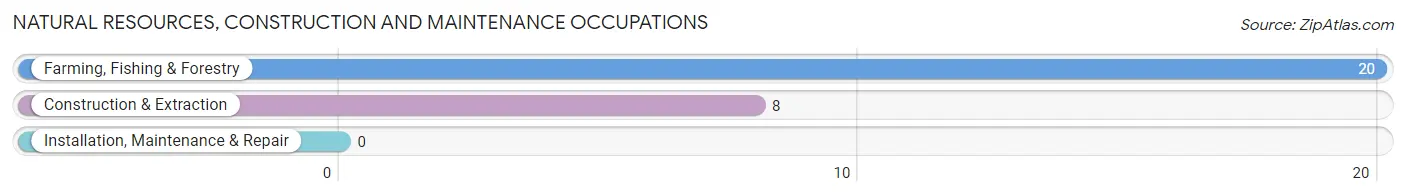
Natural Resources, Construction and Maintenance Occupations
The most common Natural Resources, Construction and Maintenance occupations in Bliss are Farming, Fishing & Forestry (20 | 21.3%), and Construction & Extraction (8 | 8.5%).
Natural Resources, Construction and Maintenance Occupations by Sex
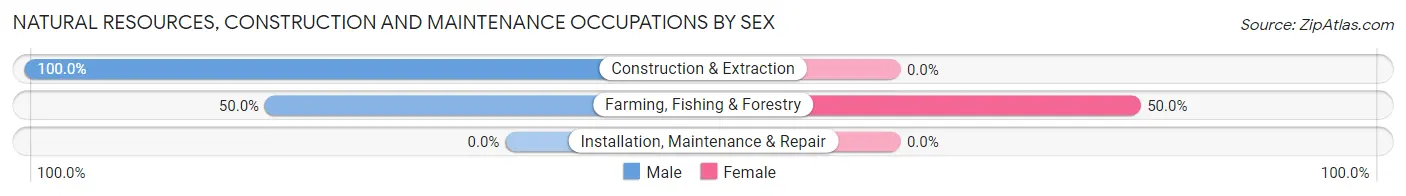
| Occupation | Male | Female |
| Farming, Fishing & Forestry | 10 (50.0%) | 10 (50.0%) |
| Construction & Extraction | 8 (100.0%) | 0 (0.0%) |
| Installation, Maintenance & Repair | 0 (0.0%) | 0 (0.0%) |
| Total (Category) | 18 (64.3%) | 10 (35.7%) |
| Total (Overall) | 45 (47.9%) | 49 (52.1%) |
Production, Transportation and Moving Occupations
The most common Production, Transportation and Moving occupations in Bliss are Material Moving (17 | 18.1%), and Transportation (4 | 4.3%).
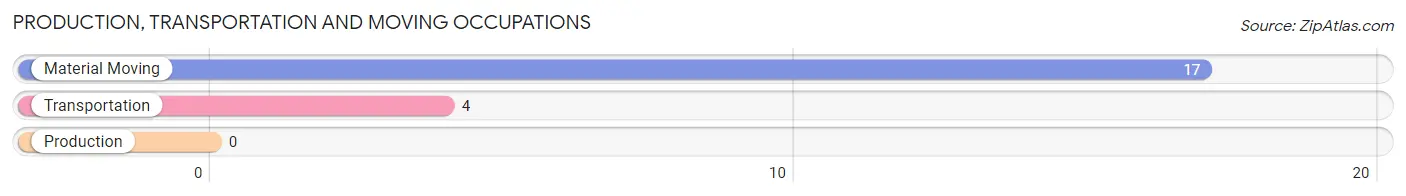
Production, Transportation and Moving Occupations by Sex
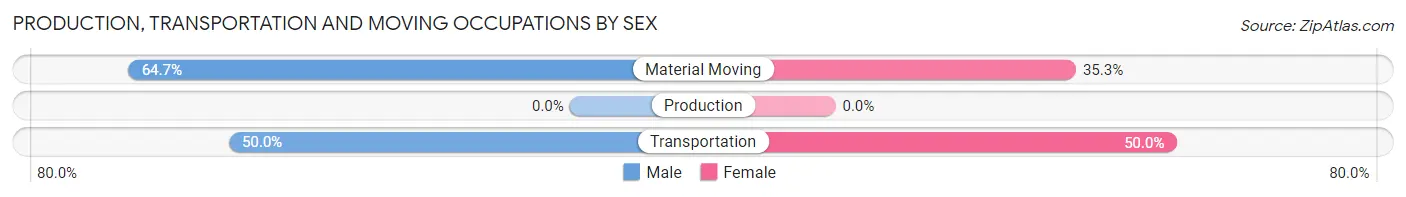
| Occupation | Male | Female |
| Production | 0 (0.0%) | 0 (0.0%) |
| Transportation | 2 (50.0%) | 2 (50.0%) |
| Material Moving | 11 (64.7%) | 6 (35.3%) |
| Total (Category) | 13 (61.9%) | 8 (38.1%) |
| Total (Overall) | 45 (47.9%) | 49 (52.1%) |
Employment Industries by Sex in Bliss
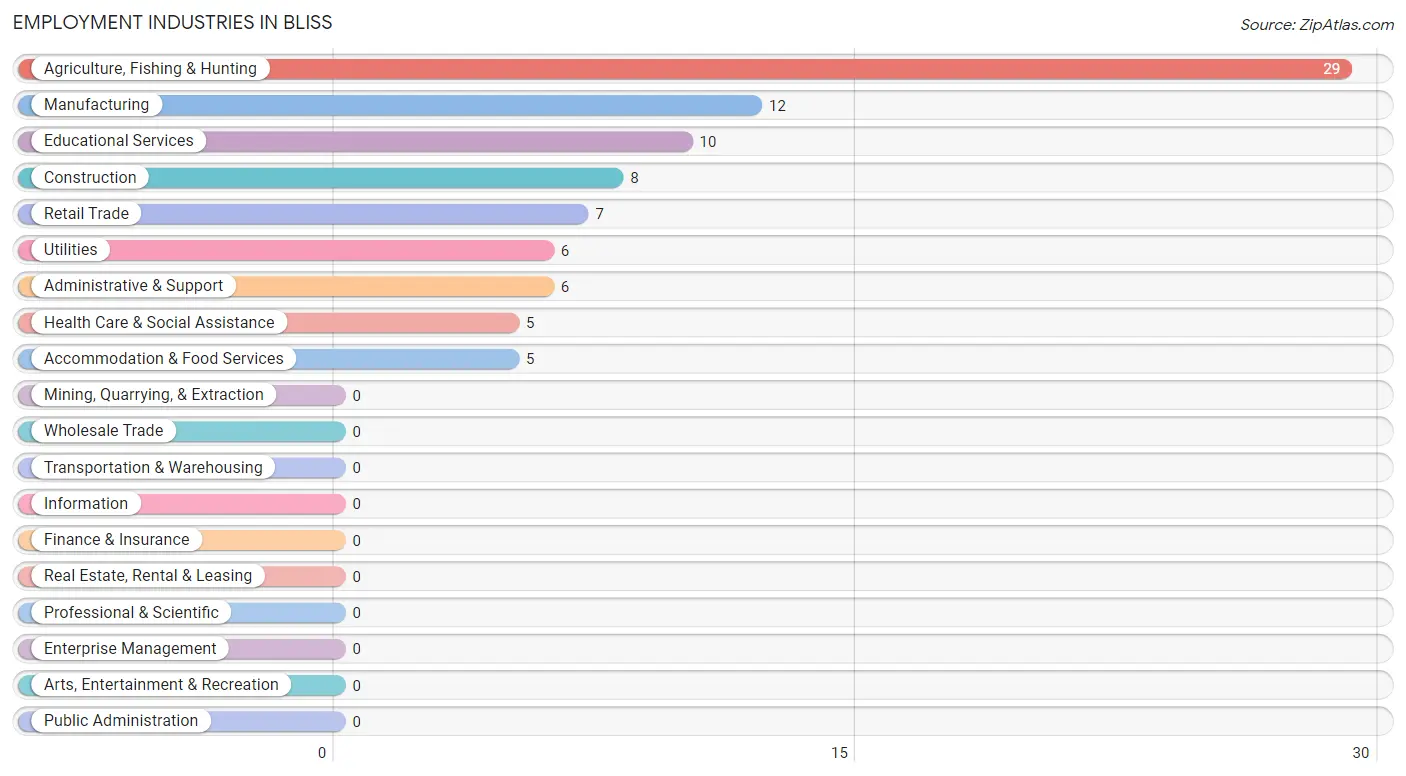
Employment Industries in Bliss
The major employment industries in Bliss include Agriculture, Fishing & Hunting (29 | 30.8%), Manufacturing (12 | 12.8%), Educational Services (10 | 10.6%), Construction (8 | 8.5%), and Retail Trade (7 | 7.4%).
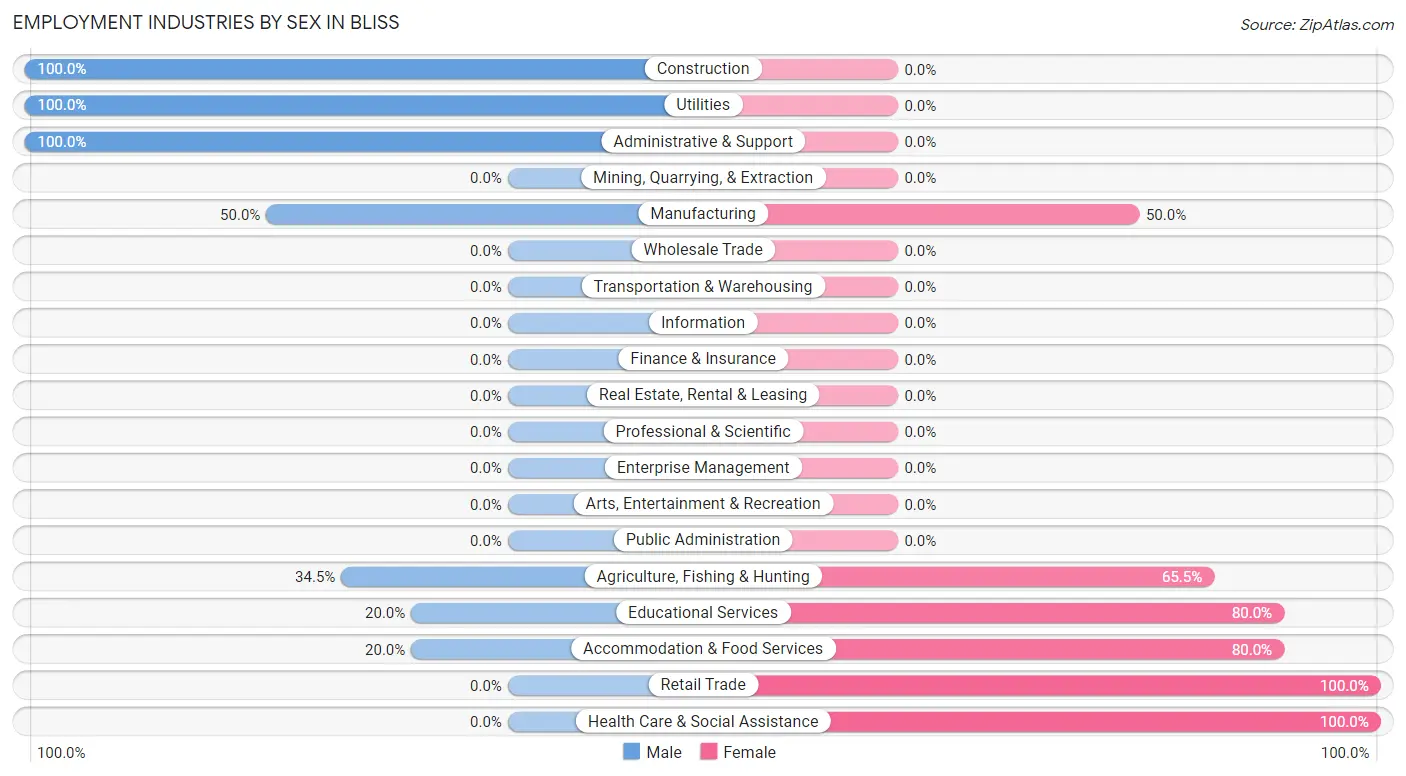
Employment Industries by Sex in Bliss
The Bliss industries that see more men than women are Construction (100.0%), Utilities (100.0%), and Administrative & Support (100.0%), whereas the industries that tend to have a higher number of women are Retail Trade (100.0%), Health Care & Social Assistance (100.0%), and Educational Services (80.0%).
| Industry | Male | Female |
| Agriculture, Fishing & Hunting | 10 (34.5%) | 19 (65.5%) |
| Mining, Quarrying, & Extraction | 0 (0.0%) | 0 (0.0%) |
| Construction | 8 (100.0%) | 0 (0.0%) |
| Manufacturing | 6 (50.0%) | 6 (50.0%) |
| Wholesale Trade | 0 (0.0%) | 0 (0.0%) |
| Retail Trade | 0 (0.0%) | 7 (100.0%) |
| Transportation & Warehousing | 0 (0.0%) | 0 (0.0%) |
| Utilities | 6 (100.0%) | 0 (0.0%) |
| Information | 0 (0.0%) | 0 (0.0%) |
| Finance & Insurance | 0 (0.0%) | 0 (0.0%) |
| Real Estate, Rental & Leasing | 0 (0.0%) | 0 (0.0%) |
| Professional & Scientific | 0 (0.0%) | 0 (0.0%) |
| Enterprise Management | 0 (0.0%) | 0 (0.0%) |
| Administrative & Support | 6 (100.0%) | 0 (0.0%) |
| Educational Services | 2 (20.0%) | 8 (80.0%) |
| Health Care & Social Assistance | 0 (0.0%) | 5 (100.0%) |
| Arts, Entertainment & Recreation | 0 (0.0%) | 0 (0.0%) |
| Accommodation & Food Services | 1 (20.0%) | 4 (80.0%) |
| Public Administration | 0 (0.0%) | 0 (0.0%) |
| Total | 45 (47.9%) | 49 (52.1%) |
Education in Bliss
School Enrollment in Bliss
The most common levels of schooling among the 105 students in Bliss are middle school (50 | 47.6%), elementary school (34 | 32.4%), and kindergarten (15 | 14.3%).
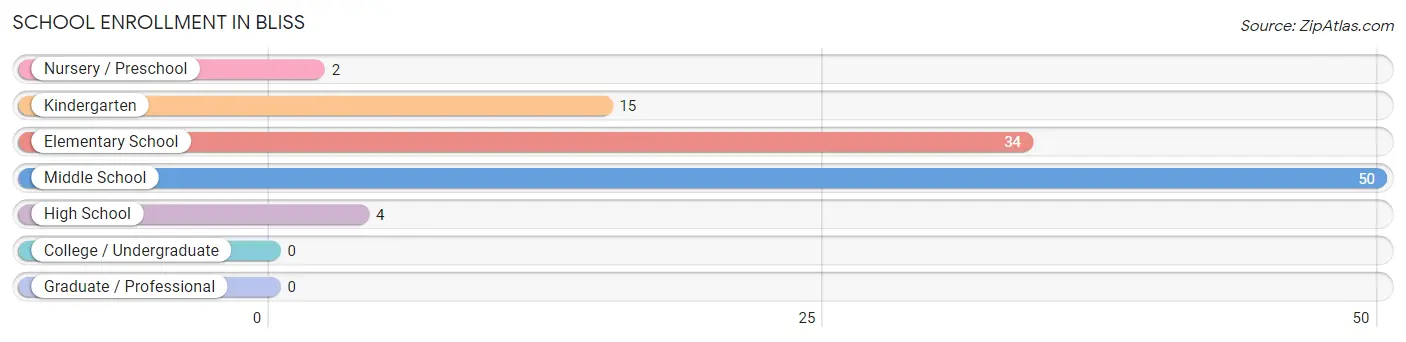
| School Level | # Students | % Students |
| Nursery / Preschool | 2 | 1.9% |
| Kindergarten | 15 | 14.3% |
| Elementary School | 34 | 32.4% |
| Middle School | 50 | 47.6% |
| High School | 4 | 3.8% |
| College / Undergraduate | 0 | 0.0% |
| Graduate / Professional | 0 | 0.0% |
| Total | 105 | 100.0% |
School Enrollment by Age by Funding Source in Bliss
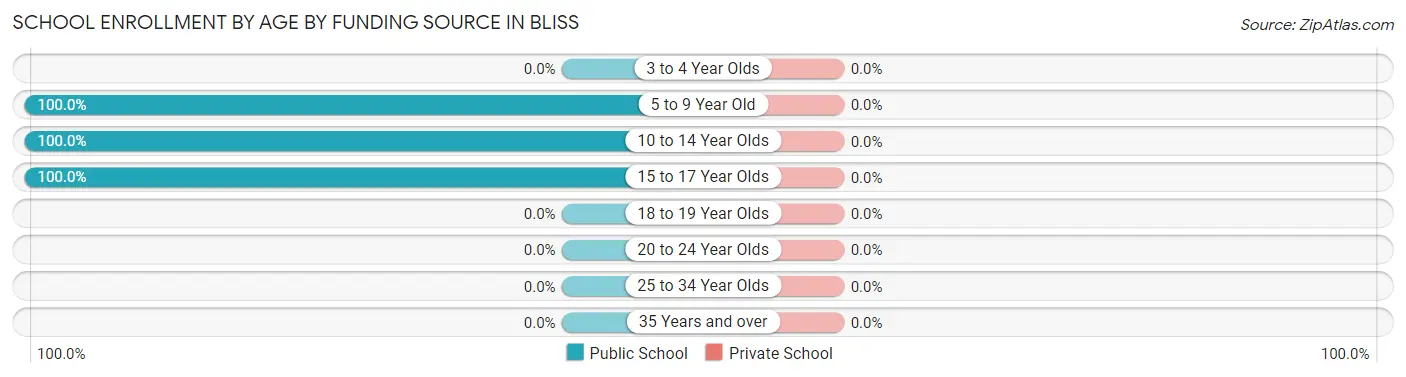
| Age Bracket | Public School | Private School |
| 3 to 4 Year Olds | 0 (0.0%) | 0 (0.0%) |
| 5 to 9 Year Old | 43 (100.0%) | 0 (0.0%) |
| 10 to 14 Year Olds | 58 (100.0%) | 0 (0.0%) |
| 15 to 17 Year Olds | 4 (100.0%) | 0 (0.0%) |
| 18 to 19 Year Olds | 0 (0.0%) | 0 (0.0%) |
| 20 to 24 Year Olds | 0 (0.0%) | 0 (0.0%) |
| 25 to 34 Year Olds | 0 (0.0%) | 0 (0.0%) |
| 35 Years and over | 0 (0.0%) | 0 (0.0%) |
| Total | 105 (100.0%) | 0 (0.0%) |
Educational Attainment by Field of Study in Bliss
Bio, nature & agricultural (9 | 81.8%), and education (2 | 18.2%) are the most common fields of study among 11 individuals in Bliss who have obtained a bachelor's degree or higher.
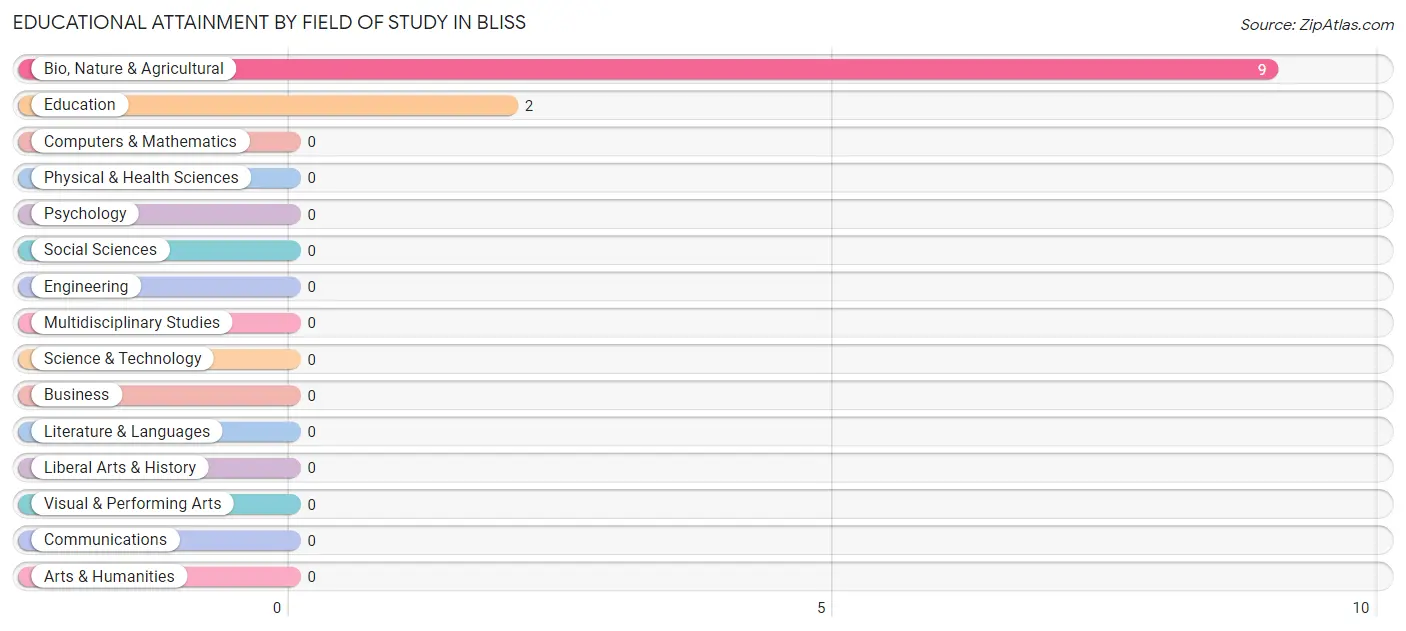
| Field of Study | # Graduates | % Graduates |
| Computers & Mathematics | 0 | 0.0% |
| Bio, Nature & Agricultural | 9 | 81.8% |
| Physical & Health Sciences | 0 | 0.0% |
| Psychology | 0 | 0.0% |
| Social Sciences | 0 | 0.0% |
| Engineering | 0 | 0.0% |
| Multidisciplinary Studies | 0 | 0.0% |
| Science & Technology | 0 | 0.0% |
| Business | 0 | 0.0% |
| Education | 2 | 18.2% |
| Literature & Languages | 0 | 0.0% |
| Liberal Arts & History | 0 | 0.0% |
| Visual & Performing Arts | 0 | 0.0% |
| Communications | 0 | 0.0% |
| Arts & Humanities | 0 | 0.0% |
| Total | 11 | 100.0% |
Transportation & Commute in Bliss
Vehicle Availability by Sex in Bliss
The most prevalent vehicle ownership categories in Bliss are males with 3 vehicles (15, accounting for 38.5%) and females with 3 vehicles (12, making up 30.6%).
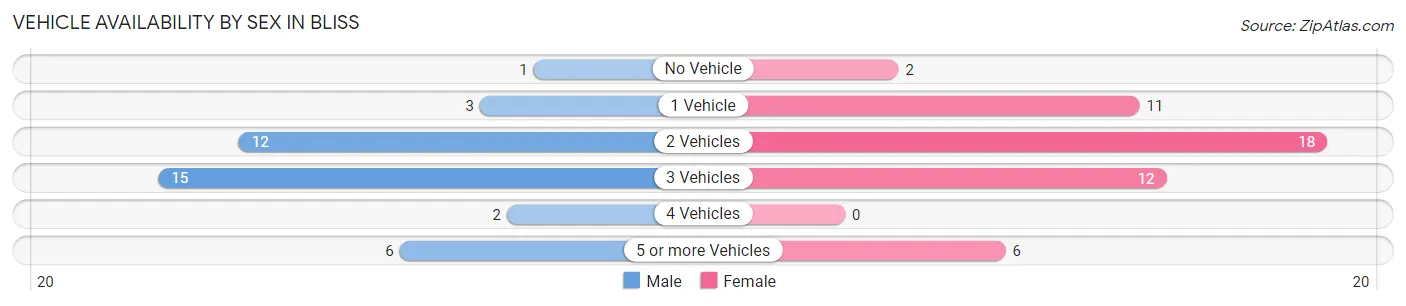
| Vehicles Available | Male | Female |
| No Vehicle | 1 (2.6%) | 2 (4.1%) |
| 1 Vehicle | 3 (7.7%) | 11 (22.5%) |
| 2 Vehicles | 12 (30.8%) | 18 (36.7%) |
| 3 Vehicles | 15 (38.5%) | 12 (24.5%) |
| 4 Vehicles | 2 (5.1%) | 0 (0.0%) |
| 5 or more Vehicles | 6 (15.4%) | 6 (12.2%) |
| Total | 39 (100.0%) | 49 (100.0%) |
Commute Time in Bliss
The most frequently occuring commute durations in Bliss are 20 to 24 minutes (23 commuters, 27.1%), 5 to 9 minutes (16 commuters, 18.8%), and 15 to 19 minutes (13 commuters, 15.3%).
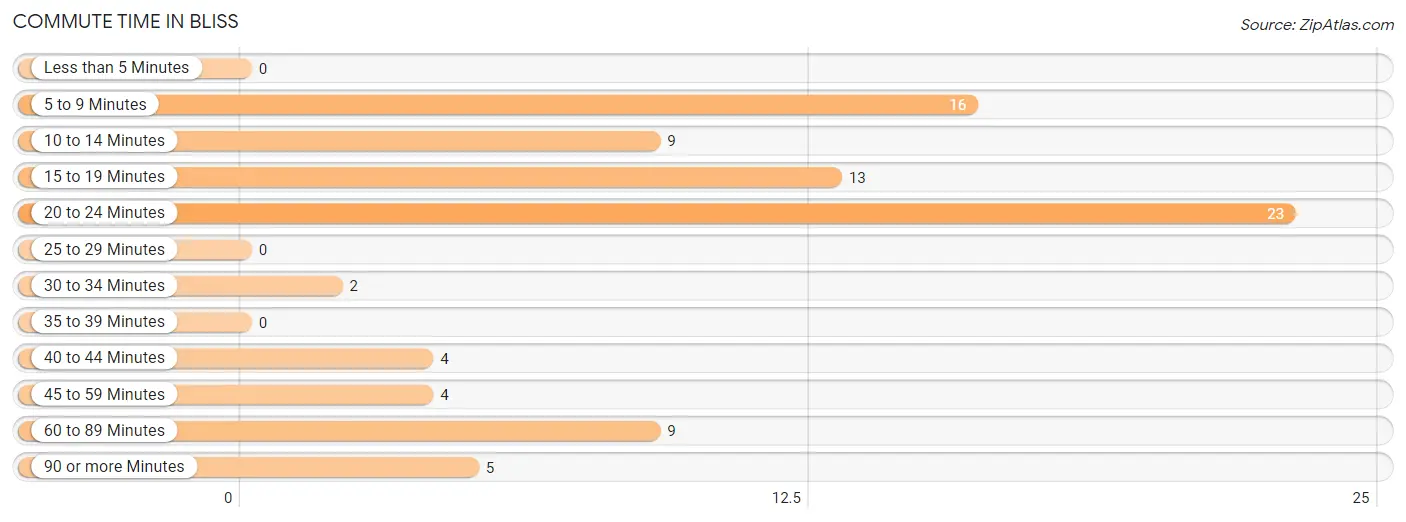
| Commute Time | # Commuters | % Commuters |
| Less than 5 Minutes | 0 | 0.0% |
| 5 to 9 Minutes | 16 | 18.8% |
| 10 to 14 Minutes | 9 | 10.6% |
| 15 to 19 Minutes | 13 | 15.3% |
| 20 to 24 Minutes | 23 | 27.1% |
| 25 to 29 Minutes | 0 | 0.0% |
| 30 to 34 Minutes | 2 | 2.4% |
| 35 to 39 Minutes | 0 | 0.0% |
| 40 to 44 Minutes | 4 | 4.7% |
| 45 to 59 Minutes | 4 | 4.7% |
| 60 to 89 Minutes | 9 | 10.6% |
| 90 or more Minutes | 5 | 5.9% |
Commute Time by Sex in Bliss
The most common commute times in Bliss are 20 to 24 minutes (19 commuters, 50.0%) for males and 5 to 9 minutes (12 commuters, 25.5%) for females.
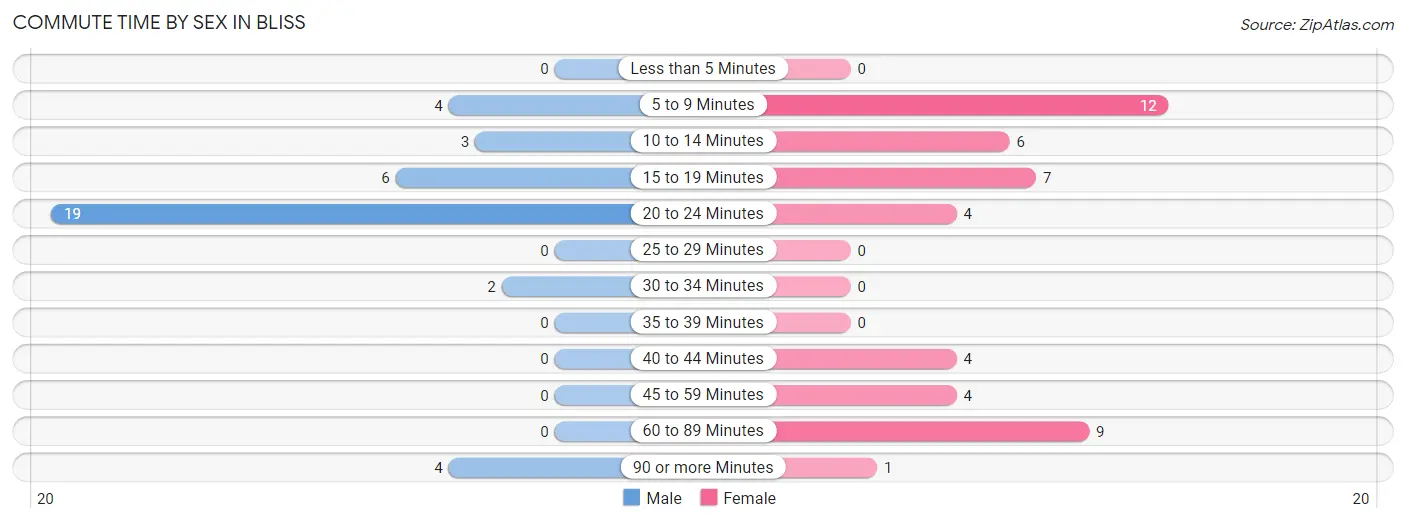
| Commute Time | Male | Female |
| Less than 5 Minutes | 0 (0.0%) | 0 (0.0%) |
| 5 to 9 Minutes | 4 (10.5%) | 12 (25.5%) |
| 10 to 14 Minutes | 3 (7.9%) | 6 (12.8%) |
| 15 to 19 Minutes | 6 (15.8%) | 7 (14.9%) |
| 20 to 24 Minutes | 19 (50.0%) | 4 (8.5%) |
| 25 to 29 Minutes | 0 (0.0%) | 0 (0.0%) |
| 30 to 34 Minutes | 2 (5.3%) | 0 (0.0%) |
| 35 to 39 Minutes | 0 (0.0%) | 0 (0.0%) |
| 40 to 44 Minutes | 0 (0.0%) | 4 (8.5%) |
| 45 to 59 Minutes | 0 (0.0%) | 4 (8.5%) |
| 60 to 89 Minutes | 0 (0.0%) | 9 (19.2%) |
| 90 or more Minutes | 4 (10.5%) | 1 (2.1%) |
Time of Departure to Work by Sex in Bliss
The most frequent times of departure to work in Bliss are 4:00 PM to 11:59 PM (13, 34.2%) for males and 12:00 AM to 4:59 AM (9, 19.2%) for females.
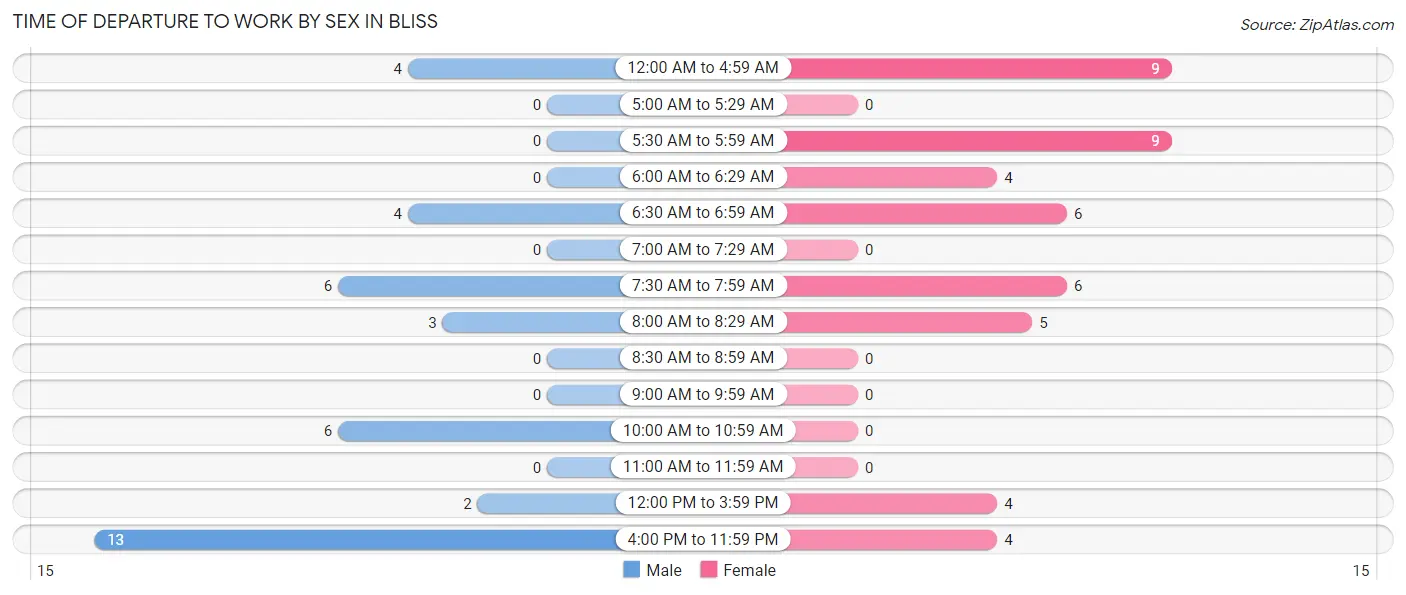
| Time of Departure | Male | Female |
| 12:00 AM to 4:59 AM | 4 (10.5%) | 9 (19.2%) |
| 5:00 AM to 5:29 AM | 0 (0.0%) | 0 (0.0%) |
| 5:30 AM to 5:59 AM | 0 (0.0%) | 9 (19.2%) |
| 6:00 AM to 6:29 AM | 0 (0.0%) | 4 (8.5%) |
| 6:30 AM to 6:59 AM | 4 (10.5%) | 6 (12.8%) |
| 7:00 AM to 7:29 AM | 0 (0.0%) | 0 (0.0%) |
| 7:30 AM to 7:59 AM | 6 (15.8%) | 6 (12.8%) |
| 8:00 AM to 8:29 AM | 3 (7.9%) | 5 (10.6%) |
| 8:30 AM to 8:59 AM | 0 (0.0%) | 0 (0.0%) |
| 9:00 AM to 9:59 AM | 0 (0.0%) | 0 (0.0%) |
| 10:00 AM to 10:59 AM | 6 (15.8%) | 0 (0.0%) |
| 11:00 AM to 11:59 AM | 0 (0.0%) | 0 (0.0%) |
| 12:00 PM to 3:59 PM | 2 (5.3%) | 4 (8.5%) |
| 4:00 PM to 11:59 PM | 13 (34.2%) | 4 (8.5%) |
| Total | 38 (100.0%) | 47 (100.0%) |
Housing Occupancy in Bliss
Occupancy by Ownership in Bliss
Of the total 104 dwellings in Bliss, owner-occupied units account for 77 (74.0%), while renter-occupied units make up 27 (26.0%).
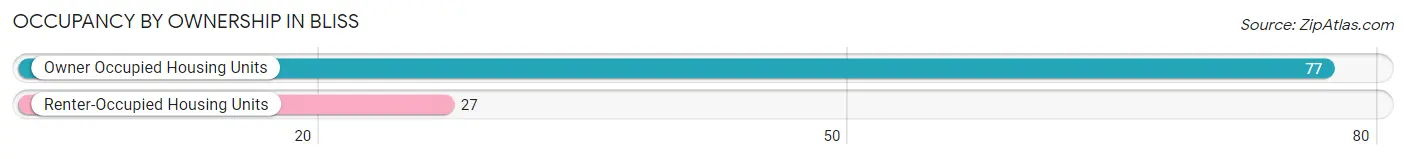
| Occupancy | # Housing Units | % Housing Units |
| Owner Occupied Housing Units | 77 | 74.0% |
| Renter-Occupied Housing Units | 27 | 26.0% |
| Total Occupied Housing Units | 104 | 100.0% |
Occupancy by Household Size in Bliss
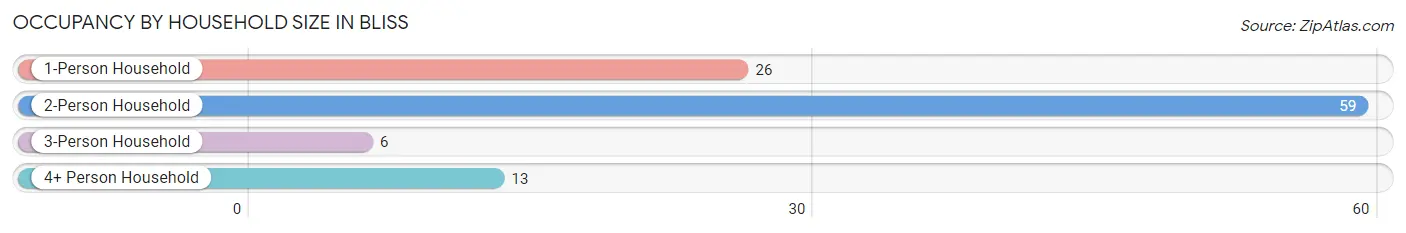
| Household Size | # Housing Units | % Housing Units |
| 1-Person Household | 26 | 25.0% |
| 2-Person Household | 59 | 56.7% |
| 3-Person Household | 6 | 5.8% |
| 4+ Person Household | 13 | 12.5% |
| Total Housing Units | 104 | 100.0% |
Occupancy by Ownership by Household Size in Bliss
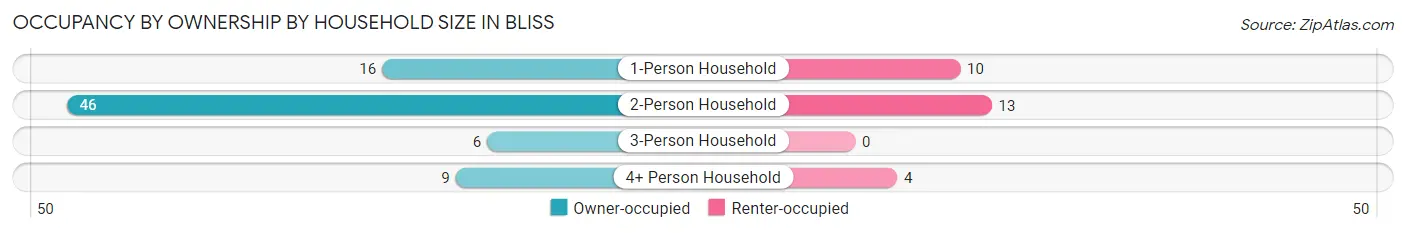
| Household Size | Owner-occupied | Renter-occupied |
| 1-Person Household | 16 (61.5%) | 10 (38.5%) |
| 2-Person Household | 46 (78.0%) | 13 (22.0%) |
| 3-Person Household | 6 (100.0%) | 0 (0.0%) |
| 4+ Person Household | 9 (69.2%) | 4 (30.8%) |
| Total Housing Units | 77 (74.0%) | 27 (26.0%) |
Occupancy by Educational Attainment in Bliss
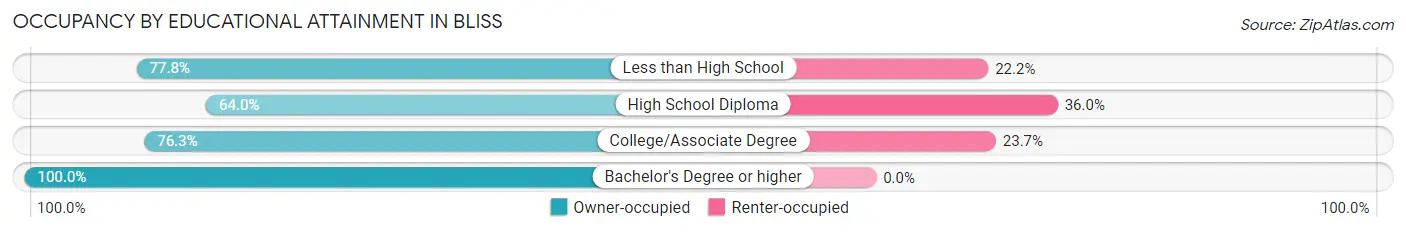
| Household Size | Owner-occupied | Renter-occupied |
| Less than High School | 14 (77.8%) | 4 (22.2%) |
| High School Diploma | 16 (64.0%) | 9 (36.0%) |
| College/Associate Degree | 45 (76.3%) | 14 (23.7%) |
| Bachelor's Degree or higher | 2 (100.0%) | 0 (0.0%) |
Occupancy by Age of Householder in Bliss
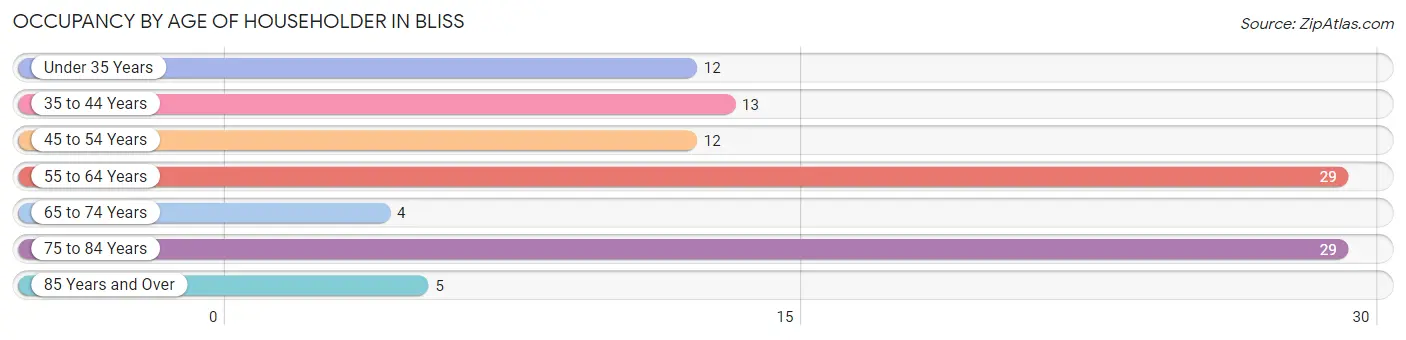
| Age Bracket | # Households | % Households |
| Under 35 Years | 12 | 11.5% |
| 35 to 44 Years | 13 | 12.5% |
| 45 to 54 Years | 12 | 11.5% |
| 55 to 64 Years | 29 | 27.9% |
| 65 to 74 Years | 4 | 3.8% |
| 75 to 84 Years | 29 | 27.9% |
| 85 Years and Over | 5 | 4.8% |
| Total | 104 | 100.0% |
Housing Finances in Bliss
Median Income by Occupancy in Bliss
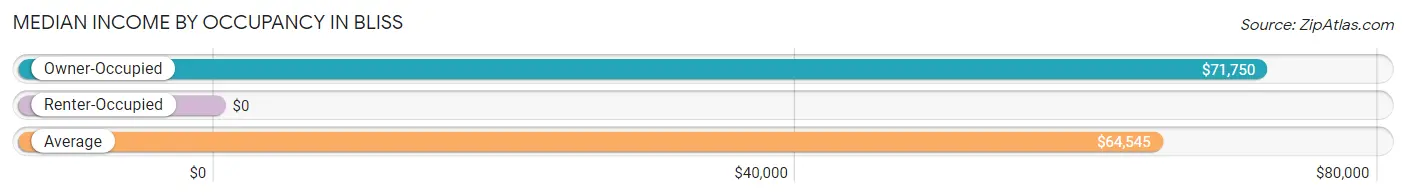
| Occupancy Type | # Households | Median Income |
| Owner-Occupied | 77 (74.0%) | $71,750 |
| Renter-Occupied | 27 (26.0%) | $0 |
| Average | 104 (100.0%) | $64,545 |
Occupancy by Householder Income Bracket in Bliss
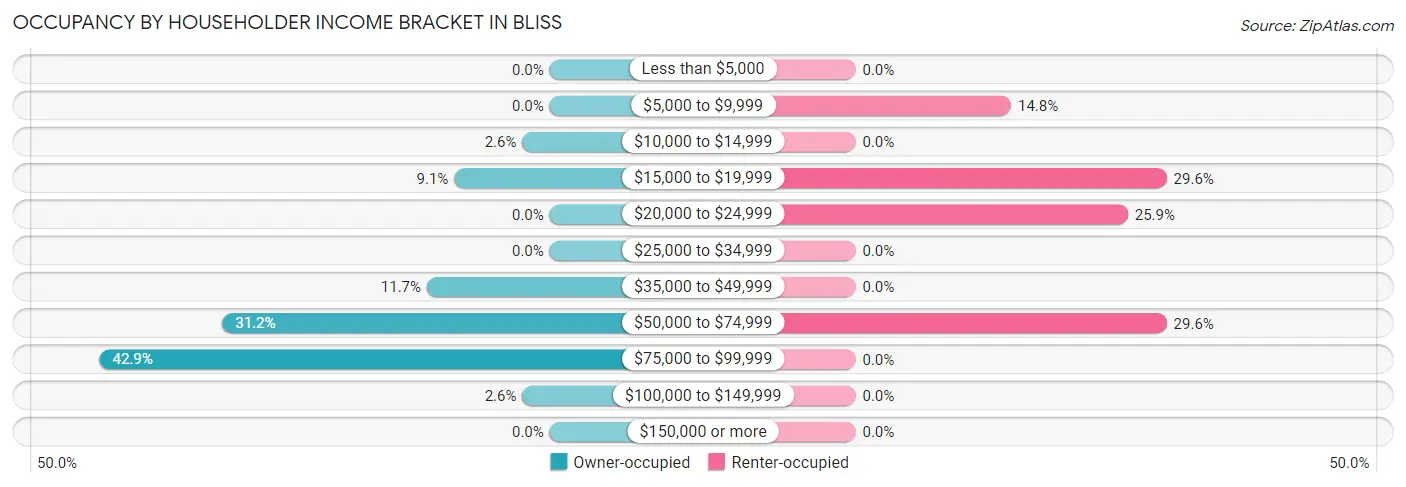
| Income Bracket | Owner-occupied | Renter-occupied |
| Less than $5,000 | 0 (0.0%) | 0 (0.0%) |
| $5,000 to $9,999 | 0 (0.0%) | 4 (14.8%) |
| $10,000 to $14,999 | 2 (2.6%) | 0 (0.0%) |
| $15,000 to $19,999 | 7 (9.1%) | 8 (29.6%) |
| $20,000 to $24,999 | 0 (0.0%) | 7 (25.9%) |
| $25,000 to $34,999 | 0 (0.0%) | 0 (0.0%) |
| $35,000 to $49,999 | 9 (11.7%) | 0 (0.0%) |
| $50,000 to $74,999 | 24 (31.2%) | 8 (29.6%) |
| $75,000 to $99,999 | 33 (42.9%) | 0 (0.0%) |
| $100,000 to $149,999 | 2 (2.6%) | 0 (0.0%) |
| $150,000 or more | 0 (0.0%) | 0 (0.0%) |
| Total | 77 (100.0%) | 27 (100.0%) |
Monthly Housing Cost Tiers in Bliss
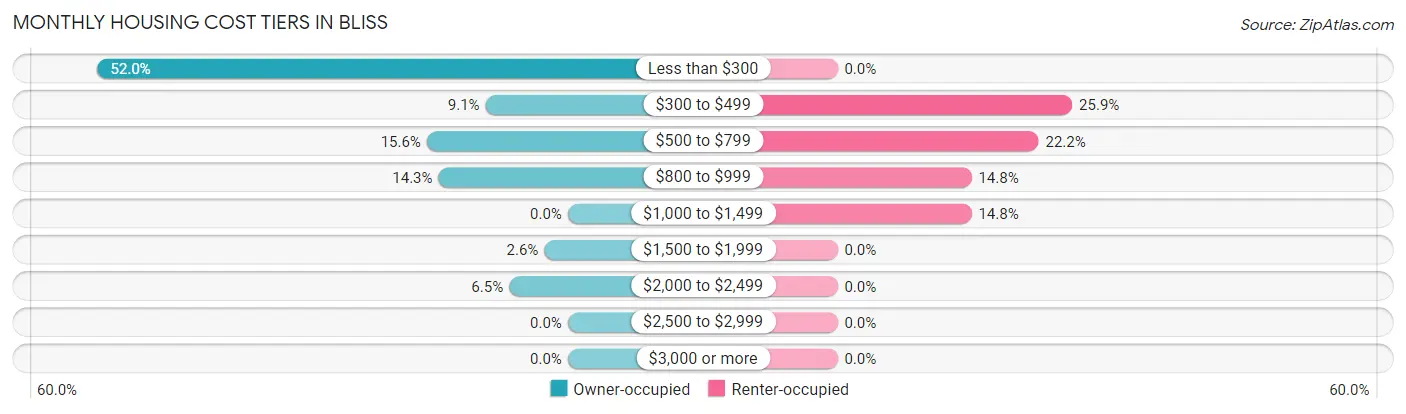
| Monthly Cost | Owner-occupied | Renter-occupied |
| Less than $300 | 40 (51.9%) | 0 (0.0%) |
| $300 to $499 | 7 (9.1%) | 7 (25.9%) |
| $500 to $799 | 12 (15.6%) | 6 (22.2%) |
| $800 to $999 | 11 (14.3%) | 4 (14.8%) |
| $1,000 to $1,499 | 0 (0.0%) | 4 (14.8%) |
| $1,500 to $1,999 | 2 (2.6%) | 0 (0.0%) |
| $2,000 to $2,499 | 5 (6.5%) | 0 (0.0%) |
| $2,500 to $2,999 | 0 (0.0%) | 0 (0.0%) |
| $3,000 or more | 0 (0.0%) | 0 (0.0%) |
| Total | 77 (100.0%) | 27 (100.0%) |
Physical Housing Characteristics in Bliss
Housing Structures in Bliss
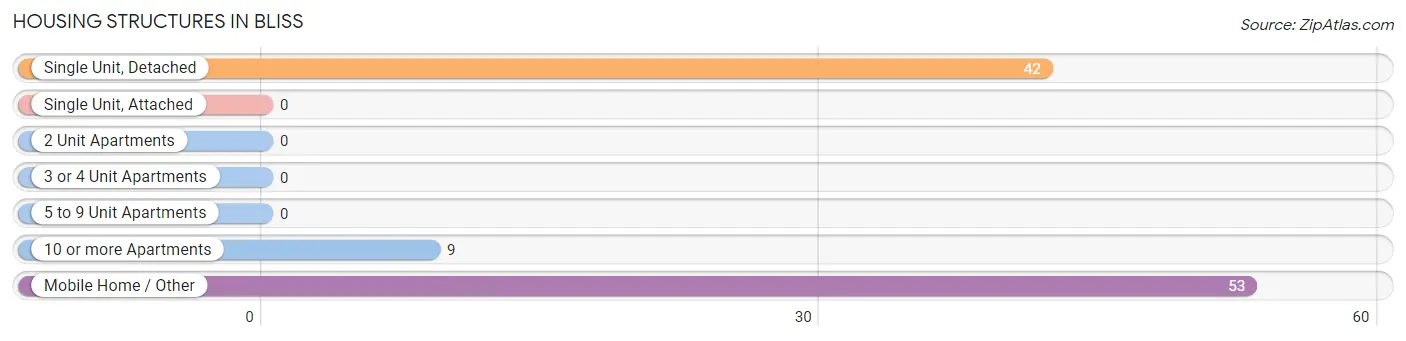
| Structure Type | # Housing Units | % Housing Units |
| Single Unit, Detached | 42 | 40.4% |
| Single Unit, Attached | 0 | 0.0% |
| 2 Unit Apartments | 0 | 0.0% |
| 3 or 4 Unit Apartments | 0 | 0.0% |
| 5 to 9 Unit Apartments | 0 | 0.0% |
| 10 or more Apartments | 9 | 8.6% |
| Mobile Home / Other | 53 | 51.0% |
| Total | 104 | 100.0% |
Housing Structures by Occupancy in Bliss
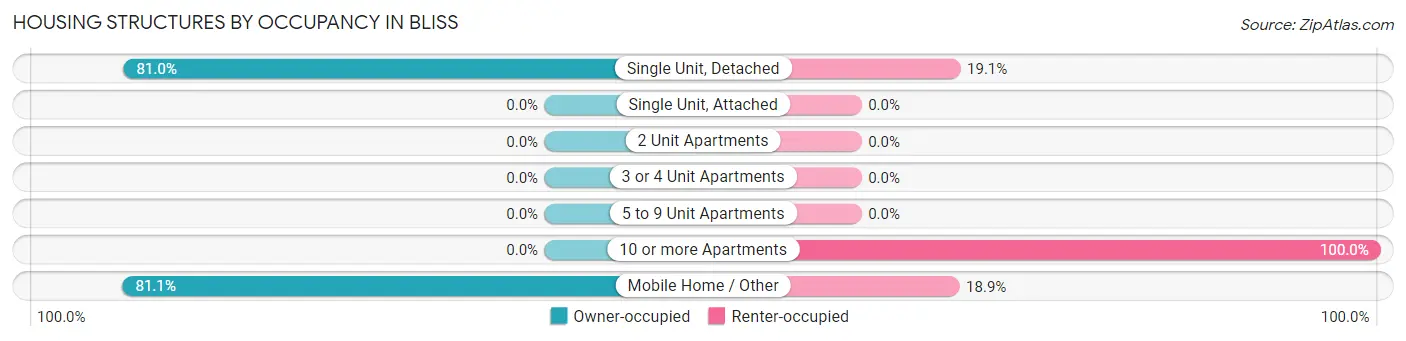
| Structure Type | Owner-occupied | Renter-occupied |
| Single Unit, Detached | 34 (80.9%) | 8 (19.1%) |
| Single Unit, Attached | 0 (0.0%) | 0 (0.0%) |
| 2 Unit Apartments | 0 (0.0%) | 0 (0.0%) |
| 3 or 4 Unit Apartments | 0 (0.0%) | 0 (0.0%) |
| 5 to 9 Unit Apartments | 0 (0.0%) | 0 (0.0%) |
| 10 or more Apartments | 0 (0.0%) | 9 (100.0%) |
| Mobile Home / Other | 43 (81.1%) | 10 (18.9%) |
| Total | 77 (74.0%) | 27 (26.0%) |
Housing Structures by Number of Rooms in Bliss
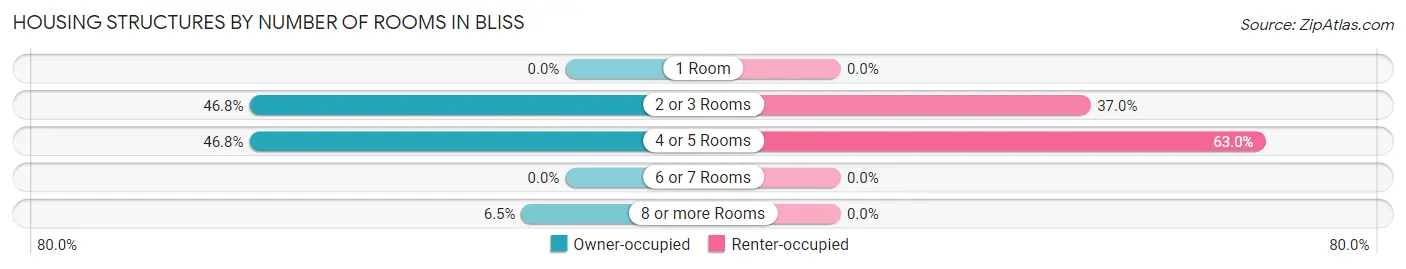
| Number of Rooms | Owner-occupied | Renter-occupied |
| 1 Room | 0 (0.0%) | 0 (0.0%) |
| 2 or 3 Rooms | 36 (46.8%) | 10 (37.0%) |
| 4 or 5 Rooms | 36 (46.8%) | 17 (63.0%) |
| 6 or 7 Rooms | 0 (0.0%) | 0 (0.0%) |
| 8 or more Rooms | 5 (6.5%) | 0 (0.0%) |
| Total | 77 (100.0%) | 27 (100.0%) |
Housing Structure by Heating Type in Bliss
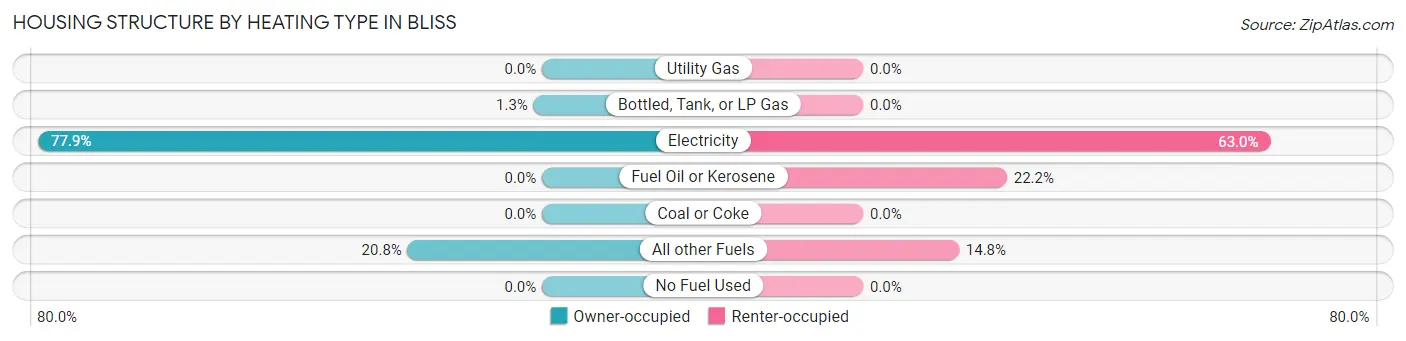
| Heating Type | Owner-occupied | Renter-occupied |
| Utility Gas | 0 (0.0%) | 0 (0.0%) |
| Bottled, Tank, or LP Gas | 1 (1.3%) | 0 (0.0%) |
| Electricity | 60 (77.9%) | 17 (63.0%) |
| Fuel Oil or Kerosene | 0 (0.0%) | 6 (22.2%) |
| Coal or Coke | 0 (0.0%) | 0 (0.0%) |
| All other Fuels | 16 (20.8%) | 4 (14.8%) |
| No Fuel Used | 0 (0.0%) | 0 (0.0%) |
| Total | 77 (100.0%) | 27 (100.0%) |
Household Vehicle Usage in Bliss
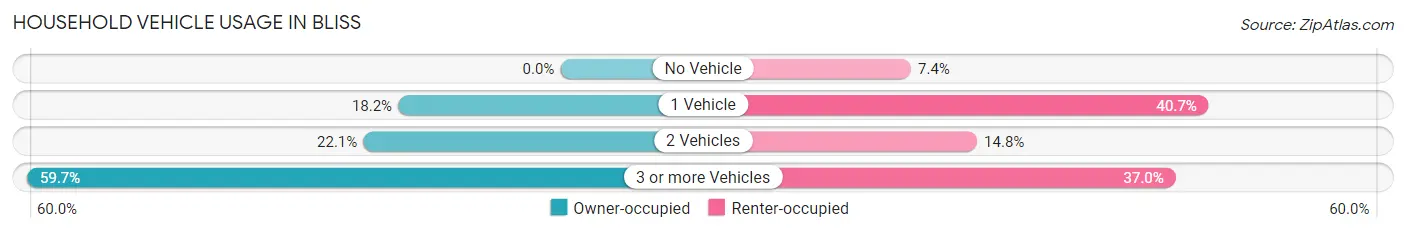
| Vehicles per Household | Owner-occupied | Renter-occupied |
| No Vehicle | 0 (0.0%) | 2 (7.4%) |
| 1 Vehicle | 14 (18.2%) | 11 (40.7%) |
| 2 Vehicles | 17 (22.1%) | 4 (14.8%) |
| 3 or more Vehicles | 46 (59.7%) | 10 (37.0%) |
| Total | 77 (100.0%) | 27 (100.0%) |
Real Estate & Mortgages in Bliss
Real Estate and Mortgage Overview in Bliss
| Characteristic | Without Mortgage | With Mortgage |
| Housing Units | 44 | 33 |
| Median Property Value | - | - |
| Median Household Income | $77,609 | $0 |
| Monthly Housing Costs | $275 | $0 |
| Real Estate Taxes | $252 | $0 |
Property Value by Mortgage Status in Bliss
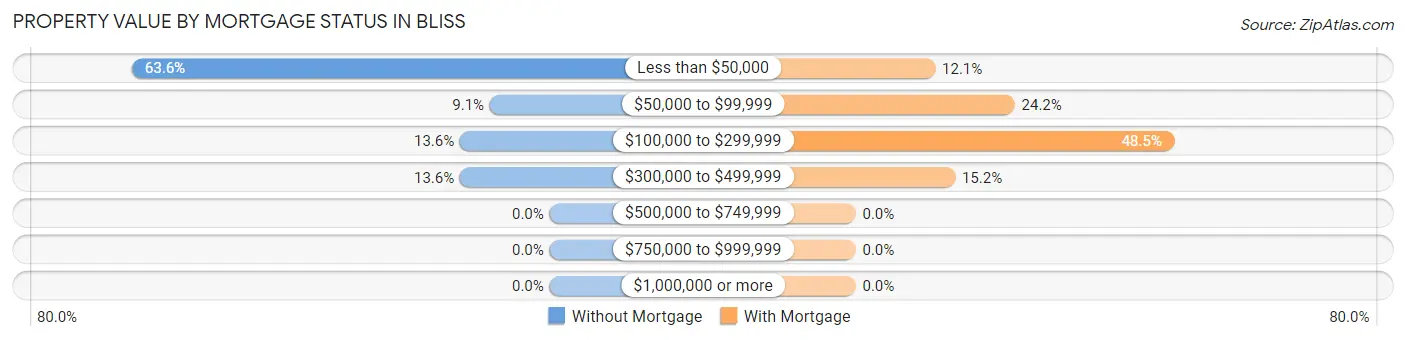
| Property Value | Without Mortgage | With Mortgage |
| Less than $50,000 | 28 (63.6%) | 4 (12.1%) |
| $50,000 to $99,999 | 4 (9.1%) | 8 (24.2%) |
| $100,000 to $299,999 | 6 (13.6%) | 16 (48.5%) |
| $300,000 to $499,999 | 6 (13.6%) | 5 (15.1%) |
| $500,000 to $749,999 | 0 (0.0%) | 0 (0.0%) |
| $750,000 to $999,999 | 0 (0.0%) | 0 (0.0%) |
| $1,000,000 or more | 0 (0.0%) | 0 (0.0%) |
| Total | 44 (100.0%) | 33 (100.0%) |
Household Income by Mortgage Status in Bliss
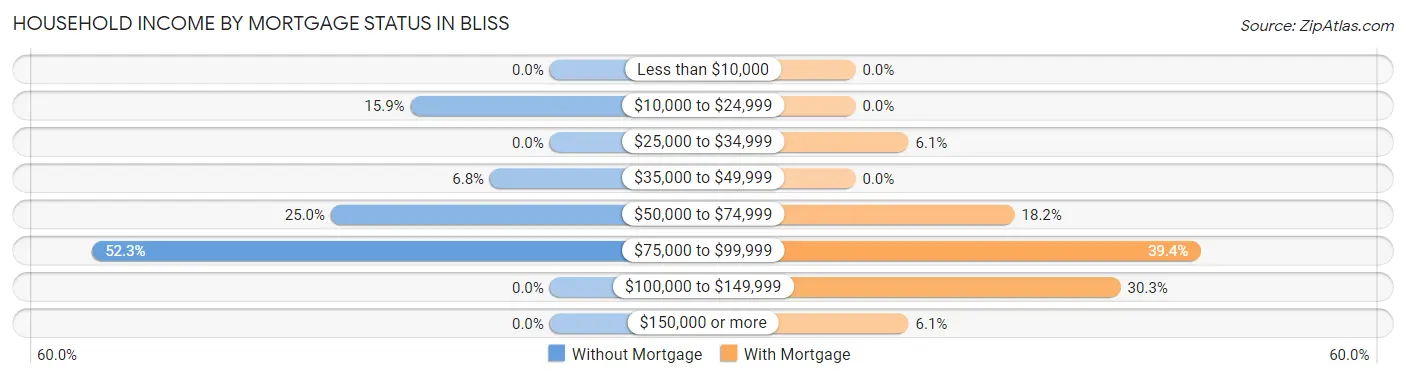
| Household Income | Without Mortgage | With Mortgage |
| Less than $10,000 | 0 (0.0%) | 0 (0.0%) |
| $10,000 to $24,999 | 7 (15.9%) | 0 (0.0%) |
| $25,000 to $34,999 | 0 (0.0%) | 2 (6.1%) |
| $35,000 to $49,999 | 3 (6.8%) | 0 (0.0%) |
| $50,000 to $74,999 | 11 (25.0%) | 6 (18.2%) |
| $75,000 to $99,999 | 23 (52.3%) | 13 (39.4%) |
| $100,000 to $149,999 | 0 (0.0%) | 10 (30.3%) |
| $150,000 or more | 0 (0.0%) | 2 (6.1%) |
| Total | 44 (100.0%) | 33 (100.0%) |
Property Value to Household Income Ratio in Bliss
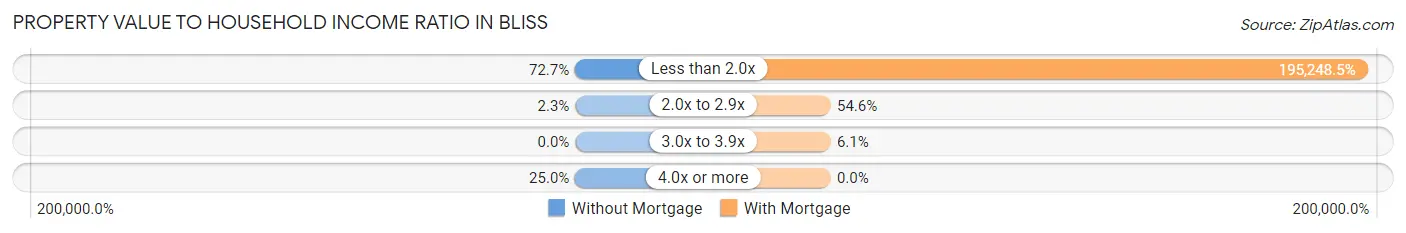
| Value-to-Income Ratio | Without Mortgage | With Mortgage |
| Less than 2.0x | 32 (72.7%) | 64,432 (195,248.5%) |
| 2.0x to 2.9x | 1 (2.3%) | 18 (54.5%) |
| 3.0x to 3.9x | 0 (0.0%) | 2 (6.1%) |
| 4.0x or more | 11 (25.0%) | 0 (0.0%) |
| Total | 44 (100.0%) | 33 (100.0%) |
Real Estate Taxes by Mortgage Status in Bliss
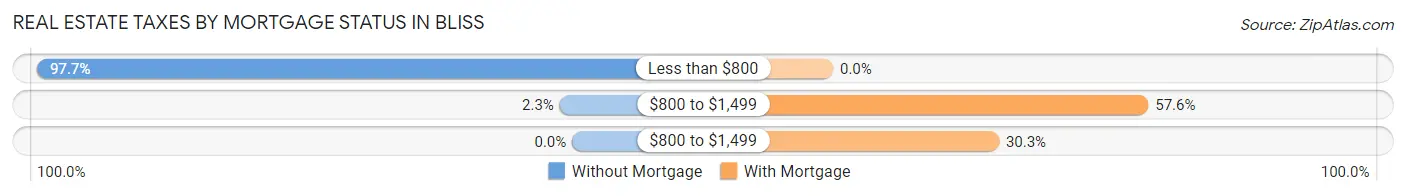
| Property Taxes | Without Mortgage | With Mortgage |
| Less than $800 | 43 (97.7%) | 0 (0.0%) |
| $800 to $1,499 | 1 (2.3%) | 19 (57.6%) |
| $800 to $1,499 | 0 (0.0%) | 10 (30.3%) |
| Total | 44 (100.0%) | 33 (100.0%) |
Health & Disability in Bliss
Health Insurance Coverage by Age in Bliss
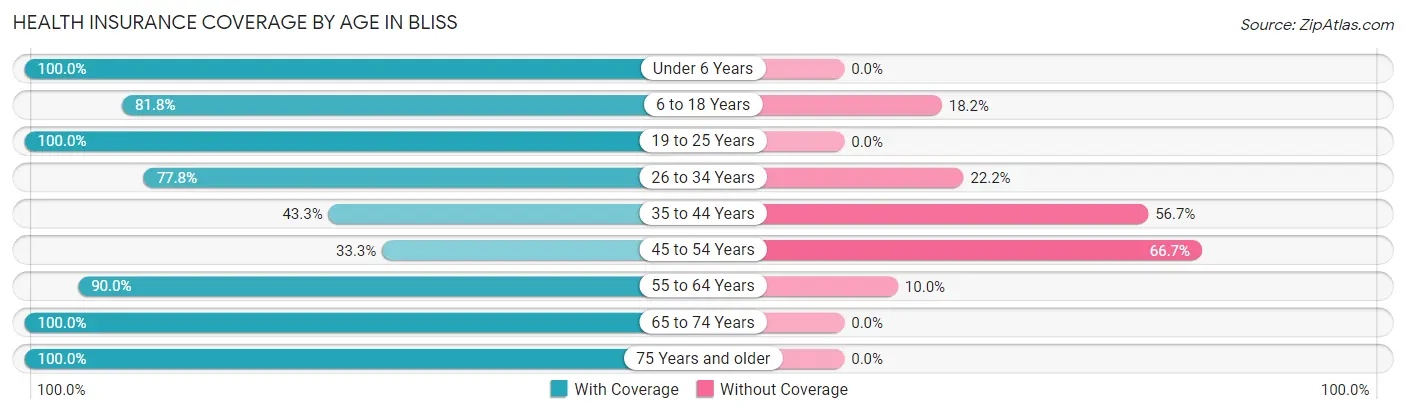
| Age Bracket | With Coverage | Without Coverage |
| Under 6 Years | 20 (100.0%) | 0 (0.0%) |
| 6 to 18 Years | 72 (81.8%) | 16 (18.2%) |
| 19 to 25 Years | 8 (100.0%) | 0 (0.0%) |
| 26 to 34 Years | 7 (77.8%) | 2 (22.2%) |
| 35 to 44 Years | 13 (43.3%) | 17 (56.7%) |
| 45 to 54 Years | 10 (33.3%) | 20 (66.7%) |
| 55 to 64 Years | 36 (90.0%) | 4 (10.0%) |
| 65 to 74 Years | 13 (100.0%) | 0 (0.0%) |
| 75 Years and older | 43 (100.0%) | 0 (0.0%) |
| Total | 222 (79.0%) | 59 (21.0%) |
Health Insurance Coverage by Citizenship Status in Bliss
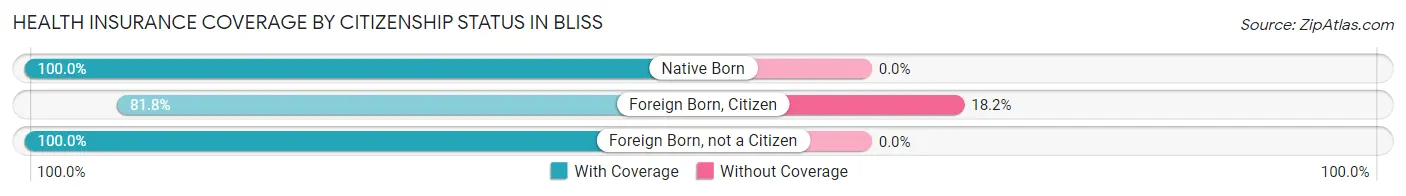
| Citizenship Status | With Coverage | Without Coverage |
| Native Born | 20 (100.0%) | 0 (0.0%) |
| Foreign Born, Citizen | 72 (81.8%) | 16 (18.2%) |
| Foreign Born, not a Citizen | 8 (100.0%) | 0 (0.0%) |
Health Insurance Coverage by Household Income in Bliss
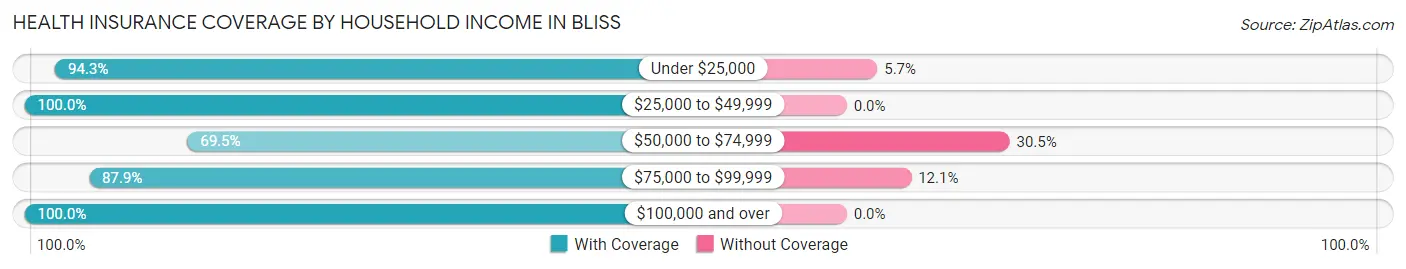
| Household Income | With Coverage | Without Coverage |
| Under $25,000 | 33 (94.3%) | 2 (5.7%) |
| $25,000 to $49,999 | 16 (100.0%) | 0 (0.0%) |
| $50,000 to $74,999 | 114 (69.5%) | 50 (30.5%) |
| $75,000 to $99,999 | 51 (87.9%) | 7 (12.1%) |
| $100,000 and over | 8 (100.0%) | 0 (0.0%) |
Public vs Private Health Insurance Coverage by Age in Bliss
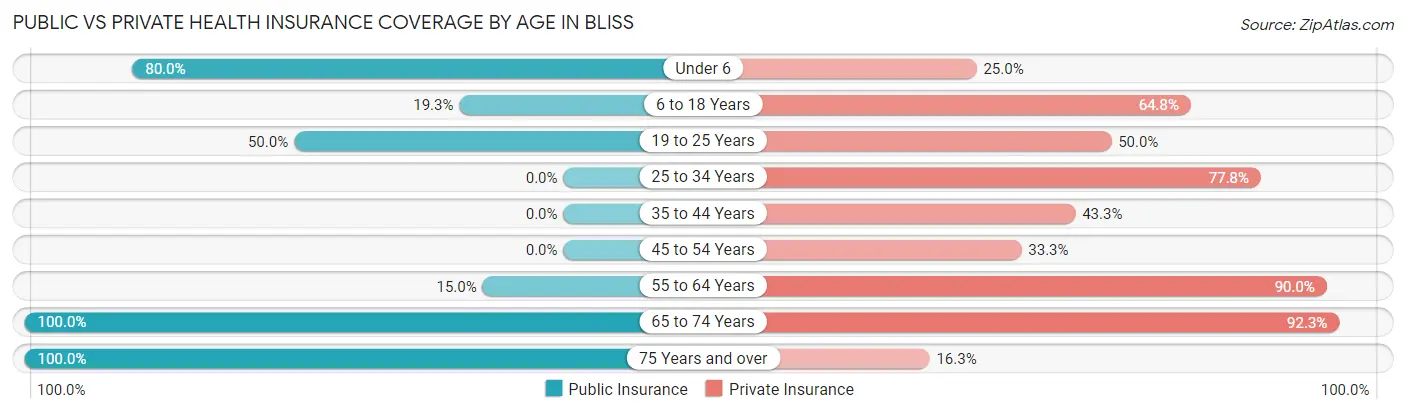
| Age Bracket | Public Insurance | Private Insurance |
| Under 6 | 16 (80.0%) | 5 (25.0%) |
| 6 to 18 Years | 17 (19.3%) | 57 (64.8%) |
| 19 to 25 Years | 4 (50.0%) | 4 (50.0%) |
| 25 to 34 Years | 0 (0.0%) | 7 (77.8%) |
| 35 to 44 Years | 0 (0.0%) | 13 (43.3%) |
| 45 to 54 Years | 0 (0.0%) | 10 (33.3%) |
| 55 to 64 Years | 6 (15.0%) | 36 (90.0%) |
| 65 to 74 Years | 13 (100.0%) | 12 (92.3%) |
| 75 Years and over | 43 (100.0%) | 7 (16.3%) |
| Total | 99 (35.2%) | 151 (53.7%) |
Disability Status by Sex by Age in Bliss
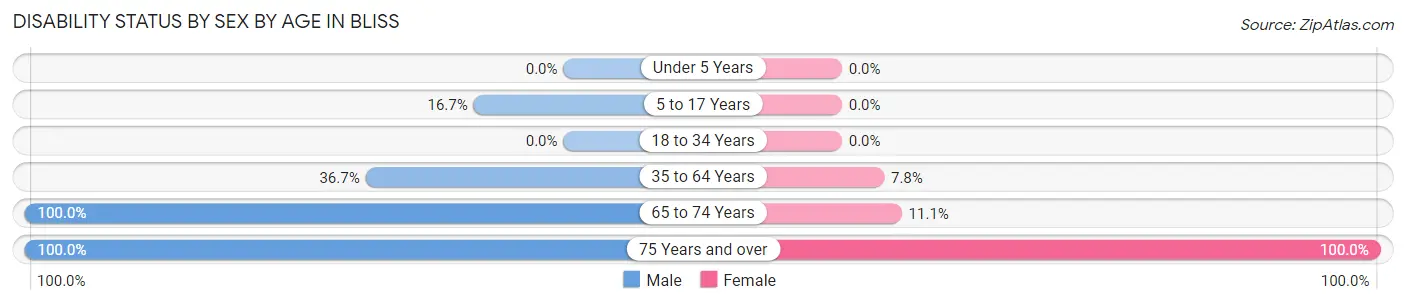
| Age Bracket | Male | Female |
| Under 5 Years | 0 (0.0%) | 0 (0.0%) |
| 5 to 17 Years | 2 (16.7%) | 0 (0.0%) |
| 18 to 34 Years | 0 (0.0%) | 0 (0.0%) |
| 35 to 64 Years | 18 (36.7%) | 4 (7.8%) |
| 65 to 74 Years | 4 (100.0%) | 1 (11.1%) |
| 75 Years and over | 30 (100.0%) | 13 (100.0%) |
Disability Class by Sex by Age in Bliss
Disability Class: Hearing Difficulty
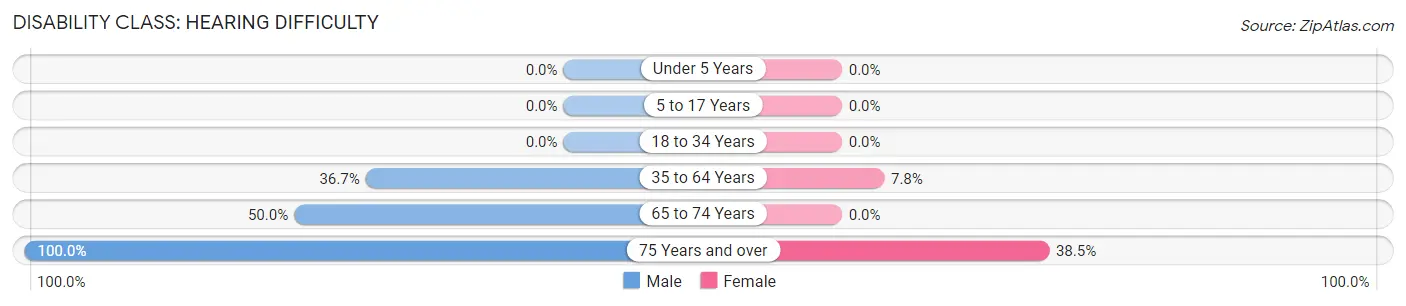
| Age Bracket | Male | Female |
| Under 5 Years | 0 (0.0%) | 0 (0.0%) |
| 5 to 17 Years | 0 (0.0%) | 0 (0.0%) |
| 18 to 34 Years | 0 (0.0%) | 0 (0.0%) |
| 35 to 64 Years | 18 (36.7%) | 4 (7.8%) |
| 65 to 74 Years | 2 (50.0%) | 0 (0.0%) |
| 75 Years and over | 30 (100.0%) | 5 (38.5%) |
Disability Class: Vision Difficulty
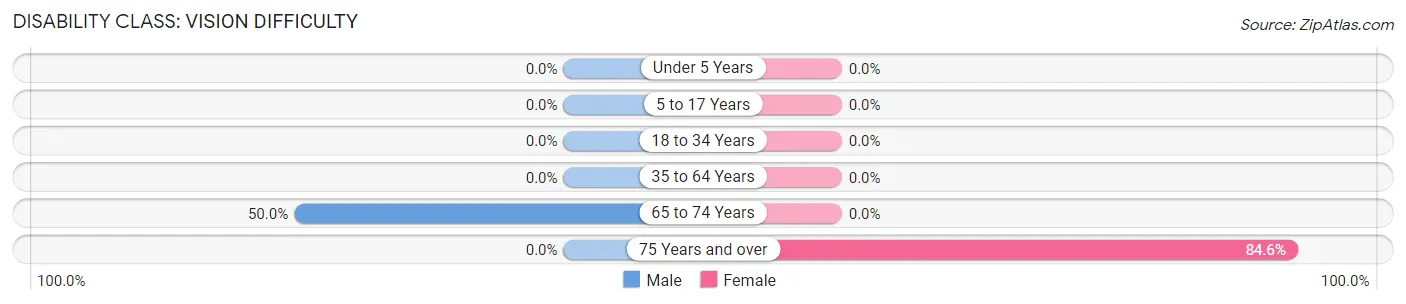
| Age Bracket | Male | Female |
| Under 5 Years | 0 (0.0%) | 0 (0.0%) |
| 5 to 17 Years | 0 (0.0%) | 0 (0.0%) |
| 18 to 34 Years | 0 (0.0%) | 0 (0.0%) |
| 35 to 64 Years | 0 (0.0%) | 0 (0.0%) |
| 65 to 74 Years | 2 (50.0%) | 0 (0.0%) |
| 75 Years and over | 0 (0.0%) | 11 (84.6%) |
Disability Class: Cognitive Difficulty
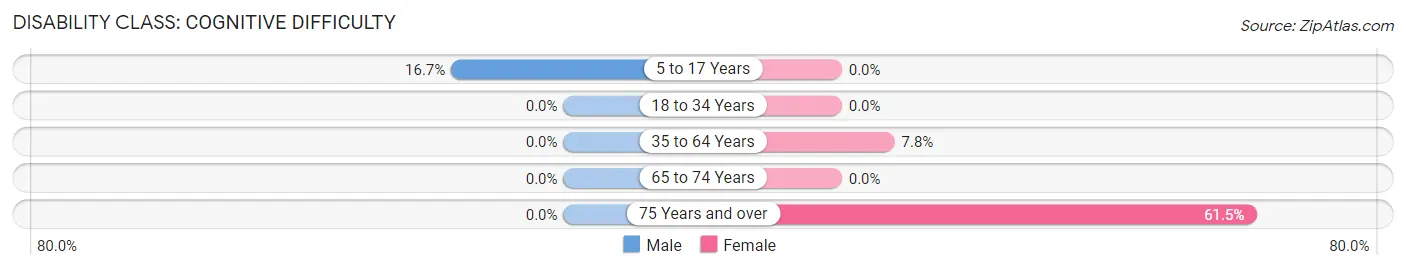
| Age Bracket | Male | Female |
| 5 to 17 Years | 2 (16.7%) | 0 (0.0%) |
| 18 to 34 Years | 0 (0.0%) | 0 (0.0%) |
| 35 to 64 Years | 0 (0.0%) | 4 (7.8%) |
| 65 to 74 Years | 0 (0.0%) | 0 (0.0%) |
| 75 Years and over | 0 (0.0%) | 8 (61.5%) |
Disability Class: Ambulatory Difficulty
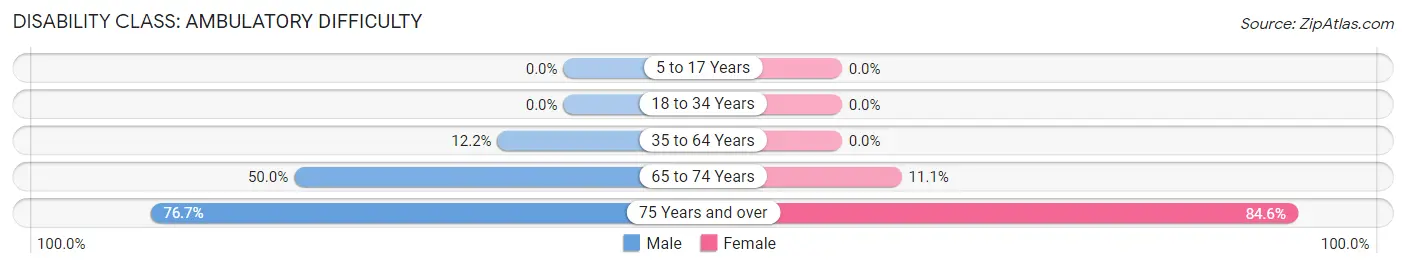
| Age Bracket | Male | Female |
| 5 to 17 Years | 0 (0.0%) | 0 (0.0%) |
| 18 to 34 Years | 0 (0.0%) | 0 (0.0%) |
| 35 to 64 Years | 6 (12.2%) | 0 (0.0%) |
| 65 to 74 Years | 2 (50.0%) | 1 (11.1%) |
| 75 Years and over | 23 (76.7%) | 11 (84.6%) |
Disability Class: Self-Care Difficulty
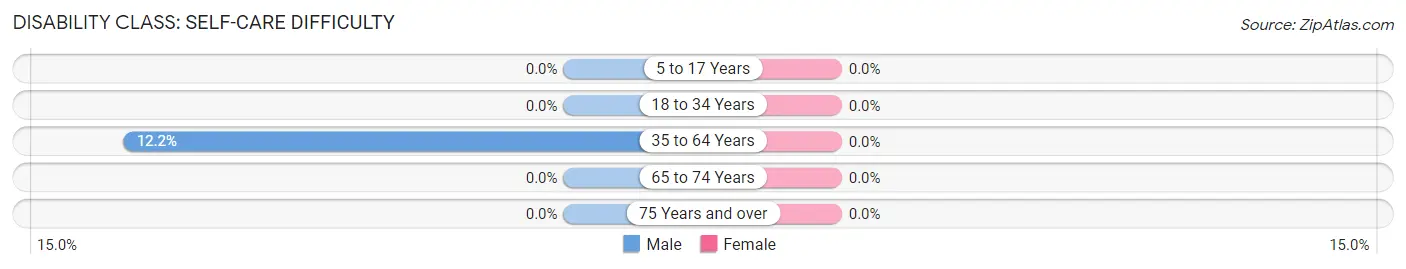
| Age Bracket | Male | Female |
| 5 to 17 Years | 0 (0.0%) | 0 (0.0%) |
| 18 to 34 Years | 0 (0.0%) | 0 (0.0%) |
| 35 to 64 Years | 6 (12.2%) | 0 (0.0%) |
| 65 to 74 Years | 0 (0.0%) | 0 (0.0%) |
| 75 Years and over | 0 (0.0%) | 0 (0.0%) |
Technology Access in Bliss
Computing Device Access in Bliss
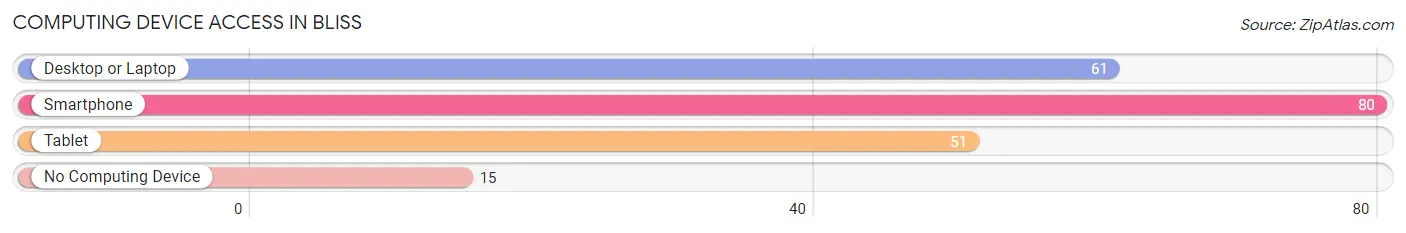
| Device Type | # Households | % Households |
| Desktop or Laptop | 61 | 58.7% |
| Smartphone | 80 | 76.9% |
| Tablet | 51 | 49.0% |
| No Computing Device | 15 | 14.4% |
| Total | 104 | 100.0% |
Internet Access in Bliss
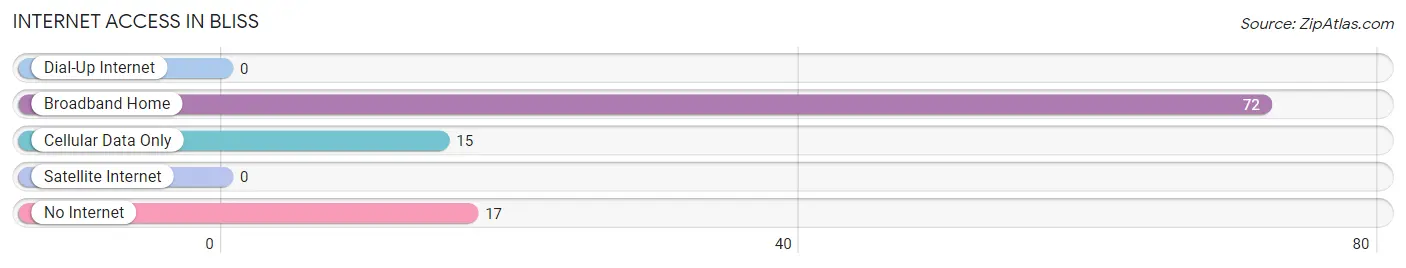
| Internet Type | # Households | % Households |
| Dial-Up Internet | 0 | 0.0% |
| Broadband Home | 72 | 69.2% |
| Cellular Data Only | 15 | 14.4% |
| Satellite Internet | 0 | 0.0% |
| No Internet | 17 | 16.4% |
| Total | 104 | 100.0% |
Bliss Summary
Bliss is a small city located in the southwestern region of Idaho, in the United States. It is situated in the Snake River Plain, a large area of flat land that stretches across the state. The city is located in Gooding County, and is the county seat. As of the 2010 census, the population of Bliss was 537.
History
The area that is now Bliss was first settled in the late 1800s by Mormon pioneers. The city was originally known as "Gooding City," after the county it was located in. In 1891, the name was changed to "Bliss," after the Bliss family, who were among the first settlers in the area.
The city was officially incorporated in 1901. At the time, the economy of the city was largely based on agriculture, with many of the residents working as farmers. In the early 1900s, the city also became a hub for the railroad industry, with the Oregon Short Line Railroad running through the city.
Geography
Bliss is located in the Snake River Plain, a large area of flat land that stretches across the state. The city is situated at an elevation of 3,845 feet (1,172 m). The city is located in Gooding County, and is the county seat.
The climate in Bliss is semi-arid, with hot summers and cold winters. The average annual temperature is around 50°F (10°C). The average annual precipitation is around 11 inches (279 mm).
Economy
The economy of Bliss is largely based on agriculture. The city is home to several farms, which produce a variety of crops, including potatoes, wheat, corn, and alfalfa. The city is also home to several food processing plants, which process the crops grown in the area.
In addition to agriculture, the city is also home to several businesses, including a lumber mill, a furniture factory, and a metal fabrication plant. The city is also home to several retail stores, restaurants, and other businesses.
Demographics
As of the 2010 census, the population of Bliss was 537. The racial makeup of the city was 95.3% White, 0.2% African American, 0.4% Native American, 0.2% Asian, 0.2% Pacific Islander, 0.7% from other races, and 2.2% from two or more races. Hispanic or Latino of any race were 2.2% of the population.
The median household income in Bliss was $35,938, and the median family income was $41,250. The per capita income in the city was $17,845. About 11.2% of the population was below the poverty line.
Common Questions
What is Per Capita Income in Bliss?
Per Capita income in Bliss is $21,366.
What is the Median Family Income in Bliss?
Median Family Income in Bliss is $72,500.
What is the Median Household income in Bliss?
Median Household Income in Bliss is $64,545.
What is Income or Wage Gap in Bliss?
Income or Wage Gap in Bliss is 46.5%.
Women in Bliss earn 53.5 cents for every dollar earned by a man.
What is Inequality or Gini Index in Bliss?
Inequality or Gini Index in Bliss is 0.27.
What is the Total Population of Bliss?
Total Population of Bliss is 281.
What is the Total Male Population of Bliss?
Total Male Population of Bliss is 100.
What is the Total Female Population of Bliss?
Total Female Population of Bliss is 181.
What is the Ratio of Males per 100 Females in Bliss?
There are 55.25 Males per 100 Females in Bliss.
What is the Ratio of Females per 100 Males in Bliss?
There are 181.00 Females per 100 Males in Bliss.
What is the Median Population Age in Bliss?
Median Population Age in Bliss is 37.4 Years.
What is the Average Family Size in Bliss
Average Family Size in Bliss is 3.2 People.
What is the Average Household Size in Bliss
Average Household Size in Bliss is 2.7 People.
How Large is the Labor Force in Bliss?
There are 117 People in the Labor Forcein in Bliss.
What is the Percentage of People in the Labor Force in Bliss?
66.1% of People are in the Labor Force in Bliss.
What is the Unemployment Rate in Bliss?
Unemployment Rate in Bliss is 19.7%.