Zip Codes with the Lowest Poverty Level Among Children Under the Age of 5 in Idaho
RELATED REPORTS & OPTIONS
Lowest Poverty | Child 0-5
Idaho
Compare Zip Codes
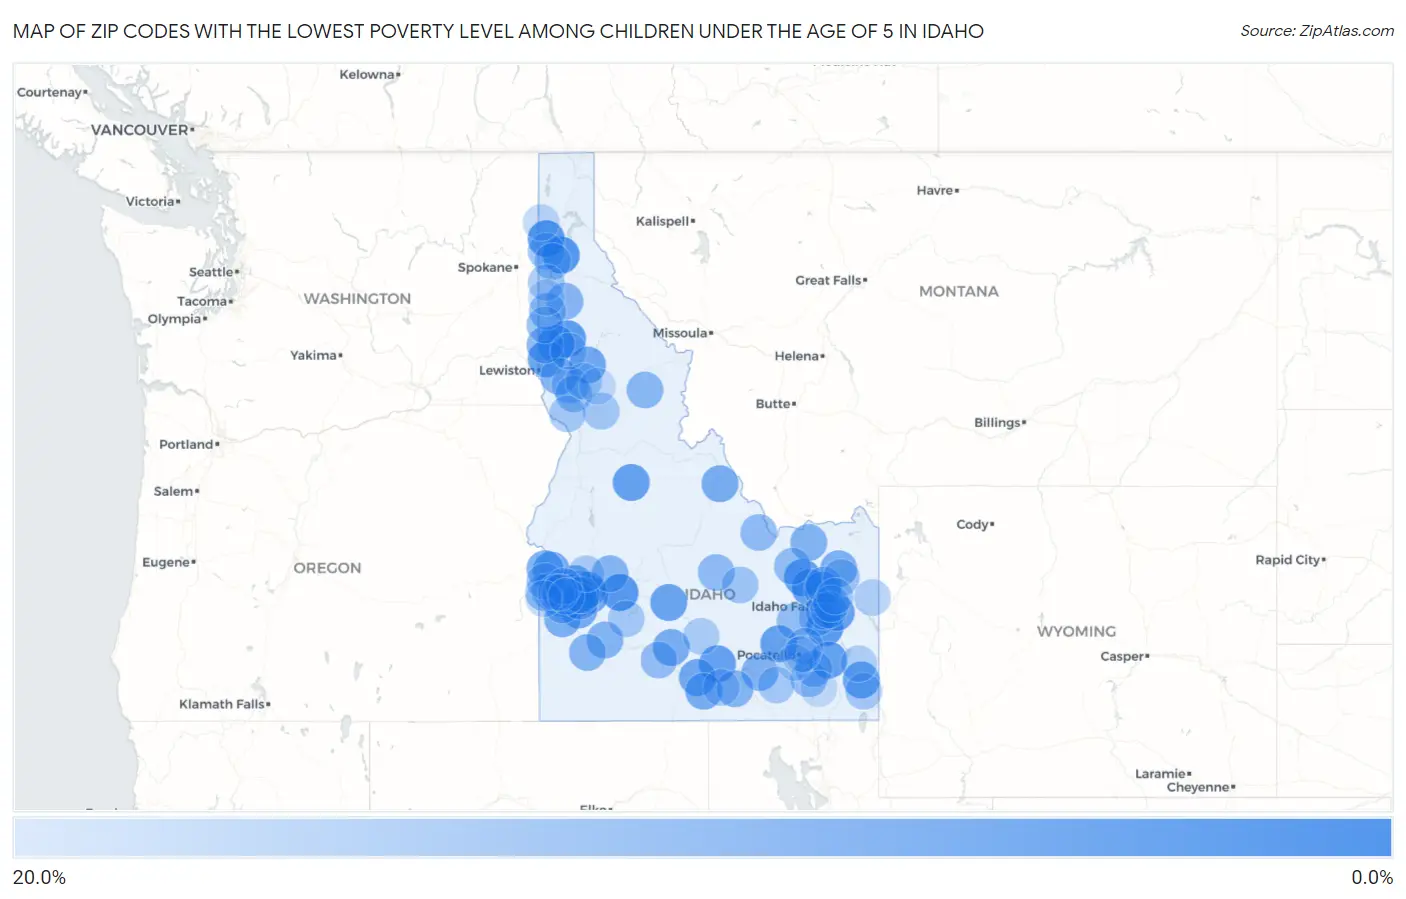
Map of Zip Codes with the Lowest Poverty Level Among Children Under the Age of 5 in Idaho
20.0%
0.0%
Zip Codes with the Lowest Poverty Level Among Children Under the Age of 5 in Idaho
| Zip Code | Child Poverty | vs State | vs National | |
| 1. | 83716 | 1.2% | 15.8%(-14.6)#1 | 18.1%(-16.8)#392 |
| 2. | 83835 | 1.3% | 15.8%(-14.5)#2 | 18.1%(-16.8)#425 |
| 3. | 83236 | 1.5% | 15.8%(-14.3)#3 | 18.1%(-16.6)#527 |
| 4. | 83869 | 1.6% | 15.8%(-14.2)#4 | 18.1%(-16.5)#585 |
| 5. | 83823 | 2.1% | 15.8%(-13.7)#5 | 18.1%(-16.0)#888 |
| 6. | 83871 | 2.9% | 15.8%(-12.9)#6 | 18.1%(-15.2)#1,429 |
| 7. | 83217 | 3.0% | 15.8%(-12.8)#7 | 18.1%(-15.1)#1,492 |
| 8. | 83450 | 3.0% | 15.8%(-12.8)#8 | 18.1%(-15.0)#1,521 |
| 9. | 83347 | 3.6% | 15.8%(-12.2)#9 | 18.1%(-14.5)#1,868 |
| 10. | 83444 | 3.6% | 15.8%(-12.2)#10 | 18.1%(-14.4)#1,911 |
| 11. | 83427 | 3.6% | 15.8%(-12.2)#11 | 18.1%(-14.4)#1,913 |
| 12. | 83210 | 3.7% | 15.8%(-12.1)#12 | 18.1%(-14.4)#1,937 |
| 13. | 83611 | 3.7% | 15.8%(-12.1)#13 | 18.1%(-14.4)#1,955 |
| 14. | 83832 | 4.0% | 15.8%(-11.8)#14 | 18.1%(-14.1)#2,171 |
| 15. | 83239 | 4.4% | 15.8%(-11.4)#15 | 18.1%(-13.6)#2,514 |
| 16. | 83327 | 4.7% | 15.8%(-11.1)#16 | 18.1%(-13.4)#2,690 |
| 17. | 83712 | 5.0% | 15.8%(-10.8)#17 | 18.1%(-13.1)#2,874 |
| 18. | 83642 | 5.0% | 15.8%(-10.8)#18 | 18.1%(-13.1)#2,892 |
| 19. | 83544 | 5.6% | 15.8%(-10.2)#19 | 18.1%(-12.5)#3,313 |
| 20. | 83325 | 5.8% | 15.8%(-10.0)#20 | 18.1%(-12.3)#3,451 |
| 21. | 83634 | 6.0% | 15.8%(-9.85)#21 | 18.1%(-12.1)#3,569 |
| 22. | 83616 | 6.2% | 15.8%(-9.65)#22 | 18.1%(-11.9)#3,701 |
| 23. | 83655 | 6.5% | 15.8%(-9.33)#23 | 18.1%(-11.6)#3,916 |
| 24. | 83344 | 6.7% | 15.8%(-9.13)#24 | 18.1%(-11.4)#4,044 |
| 25. | 83330 | 6.8% | 15.8%(-9.03)#25 | 18.1%(-11.3)#4,124 |
| 26. | 83467 | 7.2% | 15.8%(-8.63)#26 | 18.1%(-10.9)#4,401 |
| 27. | 83669 | 7.2% | 15.8%(-8.56)#27 | 18.1%(-10.8)#4,442 |
| 28. | 83619 | 7.4% | 15.8%(-8.37)#28 | 18.1%(-10.6)#4,562 |
| 29. | 83641 | 7.5% | 15.8%(-8.27)#29 | 18.1%(-10.5)#4,618 |
| 30. | 83714 | 7.9% | 15.8%(-7.85)#30 | 18.1%(-10.1)#4,879 |
| 31. | 83651 | 8.0% | 15.8%(-7.79)#31 | 18.1%(-10.1)#4,932 |
| 32. | 83438 | 8.1% | 15.8%(-7.69)#32 | 18.1%(-9.95)#4,987 |
| 33. | 83703 | 8.5% | 15.8%(-7.29)#33 | 18.1%(-9.55)#5,260 |
| 34. | 83211 | 8.7% | 15.8%(-7.05)#34 | 18.1%(-9.32)#5,440 |
| 35. | 83702 | 8.8% | 15.8%(-7.00)#35 | 18.1%(-9.26)#5,472 |
| 36. | 83423 | 8.9% | 15.8%(-6.91)#36 | 18.1%(-9.17)#5,534 |
| 37. | 83648 | 9.0% | 15.8%(-6.76)#37 | 18.1%(-9.02)#5,637 |
| 38. | 83431 | 9.1% | 15.8%(-6.71)#38 | 18.1%(-8.97)#5,675 |
| 39. | 83631 | 9.4% | 15.8%(-6.42)#39 | 18.1%(-8.69)#5,868 |
| 40. | 83686 | 9.5% | 15.8%(-6.28)#40 | 18.1%(-8.55)#5,953 |
| 41. | 83311 | 9.5% | 15.8%(-6.27)#41 | 18.1%(-8.54)#5,981 |
| 42. | 83524 | 9.7% | 15.8%(-6.12)#42 | 18.1%(-8.39)#6,069 |
| 43. | 83843 | 9.7% | 15.8%(-6.10)#43 | 18.1%(-8.36)#6,076 |
| 44. | 83861 | 9.7% | 15.8%(-6.05)#44 | 18.1%(-8.32)#6,105 |
| 45. | 83624 | 9.8% | 15.8%(-5.99)#45 | 18.1%(-8.26)#6,136 |
| 46. | 83646 | 9.8% | 15.8%(-5.96)#46 | 18.1%(-8.23)#6,151 |
| 47. | 83539 | 10.2% | 15.8%(-5.63)#47 | 18.1%(-7.89)#6,359 |
| 48. | 83713 | 10.9% | 15.8%(-4.85)#48 | 18.1%(-7.12)#6,810 |
| 49. | 83870 | 11.1% | 15.8%(-4.69)#49 | 18.1%(-6.95)#6,921 |
| 50. | 83464 | 11.1% | 15.8%(-4.69)#50 | 18.1%(-6.95)#6,925 |
| 51. | 83251 | 11.3% | 15.8%(-4.53)#51 | 18.1%(-6.80)#7,011 |
| 52. | 83274 | 11.5% | 15.8%(-4.33)#52 | 18.1%(-6.60)#7,128 |
| 53. | 83626 | 11.7% | 15.8%(-4.13)#53 | 18.1%(-6.40)#7,247 |
| 54. | 83855 | 11.8% | 15.8%(-4.03)#54 | 18.1%(-6.30)#7,309 |
| 55. | 83435 | 11.8% | 15.8%(-4.03)#55 | 18.1%(-6.30)#7,322 |
| 56. | 83404 | 11.8% | 15.8%(-3.96)#56 | 18.1%(-6.22)#7,358 |
| 57. | 83214 | 12.0% | 15.8%(-3.80)#57 | 18.1%(-6.06)#7,465 |
| 58. | 83434 | 12.0% | 15.8%(-3.75)#58 | 18.1%(-6.01)#7,494 |
| 59. | 83250 | 12.1% | 15.8%(-3.74)#59 | 18.1%(-6.00)#7,501 |
| 60. | 83332 | 12.2% | 15.8%(-3.64)#60 | 18.1%(-5.90)#7,549 |
| 61. | 83523 | 12.3% | 15.8%(-3.52)#61 | 18.1%(-5.78)#7,625 |
| 62. | 83221 | 12.4% | 15.8%(-3.43)#62 | 18.1%(-5.70)#7,681 |
| 63. | 83526 | 12.5% | 15.8%(-3.30)#63 | 18.1%(-5.56)#7,787 |
| 64. | 83676 | 12.7% | 15.8%(-3.05)#64 | 18.1%(-5.32)#7,892 |
| 65. | 83448 | 13.0% | 15.8%(-2.79)#65 | 18.1%(-5.05)#8,050 |
| 66. | 83709 | 13.2% | 15.8%(-2.61)#66 | 18.1%(-4.87)#8,148 |
| 67. | 83406 | 13.2% | 15.8%(-2.60)#67 | 18.1%(-4.87)#8,152 |
| 68. | 83858 | 13.3% | 15.8%(-2.53)#68 | 18.1%(-4.79)#8,196 |
| 69. | 83660 | 13.3% | 15.8%(-2.46)#69 | 18.1%(-4.73)#8,226 |
| 70. | 83202 | 13.5% | 15.8%(-2.26)#70 | 18.1%(-4.53)#8,362 |
| 71. | 83255 | 13.6% | 15.8%(-2.22)#71 | 18.1%(-4.48)#8,392 |
| 72. | 83815 | 13.7% | 15.8%(-2.10)#72 | 18.1%(-4.37)#8,455 |
| 73. | 83876 | 14.4% | 15.8%(-1.35)#73 | 18.1%(-3.62)#8,914 |
| 74. | 83704 | 14.6% | 15.8%(-1.18)#74 | 18.1%(-3.44)#9,001 |
| 75. | 83530 | 14.6% | 15.8%(-1.16)#75 | 18.1%(-3.43)#9,006 |
| 76. | 83401 | 14.8% | 15.8%(-0.994)#76 | 18.1%(-3.26)#9,092 |
| 77. | 83254 | 15.0% | 15.8%(-0.837)#77 | 18.1%(-3.10)#9,185 |
| 78. | 83271 | 15.0% | 15.8%(-0.798)#78 | 18.1%(-3.06)#9,216 |
| 79. | 83647 | 15.0% | 15.8%(-0.773)#79 | 18.1%(-3.04)#9,227 |
| 80. | 83522 | 15.1% | 15.8%(-0.744)#80 | 18.1%(-3.01)#9,243 |
| 81. | 83607 | 15.5% | 15.8%(-0.331)#81 | 18.1%(-2.60)#9,488 |
| 82. | 83629 | 15.6% | 15.8%(-0.224)#82 | 18.1%(-2.49)#9,528 |
| 83. | 83318 | 15.8% | 15.8%(-0.029)#83 | 18.1%(-2.29)#9,628 |
| 84. | 83349 | 16.1% | 15.8%(+0.273)#84 | 18.1%(-1.99)#9,798 |
| 85. | 83442 | 16.1% | 15.8%(+0.304)#85 | 18.1%(-1.96)#9,819 |
| 86. | 83543 | 16.2% | 15.8%(+0.418)#86 | 18.1%(-1.85)#9,866 |
| 87. | 83209 | 16.4% | 15.8%(+0.595)#87 | 18.1%(-1.67)#9,973 |
| 88. | 83455 | 16.6% | 15.8%(+0.757)#88 | 18.1%(-1.51)#10,057 |
| 89. | 83276 | 16.7% | 15.8%(+0.869)#89 | 18.1%(-1.40)#10,100 |
| 90. | 83822 | 17.8% | 15.8%(+2.01)#90 | 18.1%(-0.255)#10,621 |
| 91. | 83644 | 17.9% | 15.8%(+2.09)#91 | 18.1%(-0.174)#10,663 |
| 92. | 83605 | 18.0% | 15.8%(+2.16)#92 | 18.1%(-0.105)#10,698 |
| 93. | 83204 | 19.0% | 15.8%(+3.22)#93 | 18.1%(+0.958)#11,174 |
| 94. | 83628 | 19.2% | 15.8%(+3.45)#94 | 18.1%(+1.18)#11,289 |
| 95. | 83537 | 19.4% | 15.8%(+3.56)#95 | 18.1%(+1.29)#11,341 |
| 96. | 83536 | 19.4% | 15.8%(+3.60)#96 | 18.1%(+1.33)#11,357 |
| 97. | 83851 | 19.4% | 15.8%(+3.65)#97 | 18.1%(+1.38)#11,380 |
| 98. | 83234 | 19.5% | 15.8%(+3.71)#98 | 18.1%(+1.45)#11,412 |
| 99. | 83201 | 19.8% | 15.8%(+4.00)#99 | 18.1%(+1.74)#11,538 |
| 100. | 83687 | 19.8% | 15.8%(+4.01)#100 | 18.1%(+1.75)#11,542 |
Common Questions
What are the Top 10 Zip Codes with the Lowest Poverty Level Among Children Under the Age of 5 in Idaho?
Top 10 Zip Codes with the Lowest Poverty Level Among Children Under the Age of 5 in Idaho are:
What zip code has the Lowest Poverty Level Among Children Under the Age of 5 in Idaho?
83716 has the Lowest Poverty Level Among Children Under the Age of 5 in Idaho with 1.2%.
What is the Poverty Level Among Children Under the Age of 5 in the State of Idaho?
Poverty Level Among Children Under the Age of 5 in Idaho is 15.8%.
What is the Poverty Level Among Children Under the Age of 5 in the United States?
Poverty Level Among Children Under the Age of 5 in the United States is 18.1%.