McCaysville, GA Map & Demographics
McCaysville Map

McCaysville Overview
$24,692
PER CAPITA INCOME
$53,906
AVG FAMILY INCOME
$43,553
AVG HOUSEHOLD INCOME
5.8%
WAGE / INCOME GAP [ % ]
94.2¢/ $1
WAGE / INCOME GAP [ $ ]
0.42
INEQUALITY / GINI INDEX
1,639
TOTAL POPULATION
825
MALE POPULATION
814
FEMALE POPULATION
101.35
MALES / 100 FEMALES
98.67
FEMALES / 100 MALES
37.7
MEDIAN AGE
2.9
AVG FAMILY SIZE
2.1
AVG HOUSEHOLD SIZE
788
LABOR FORCE [ PEOPLE ]
59.1%
PERCENT IN LABOR FORCE
0.4%
UNEMPLOYMENT RATE
Income in McCaysville
Income Overview in McCaysville
Per Capita Income in McCaysville is $24,692, while median incomes of families and households are $53,906 and $43,553 respectively.
| Characteristic | Number | Measure |
| Per Capita Income | 1,639 | $24,692 |
| Median Family Income | 424 | $53,906 |
| Mean Family Income | 424 | $65,472 |
| Median Household Income | 764 | $43,553 |
| Mean Household Income | 764 | $54,438 |
| Income Deficit | 424 | $0 |
| Wage / Income Gap (%) | 1,639 | 5.84% |
| Wage / Income Gap ($) | 1,639 | 94.16¢ per $1 |
| Gini / Inequality Index | 1,639 | 0.42 |
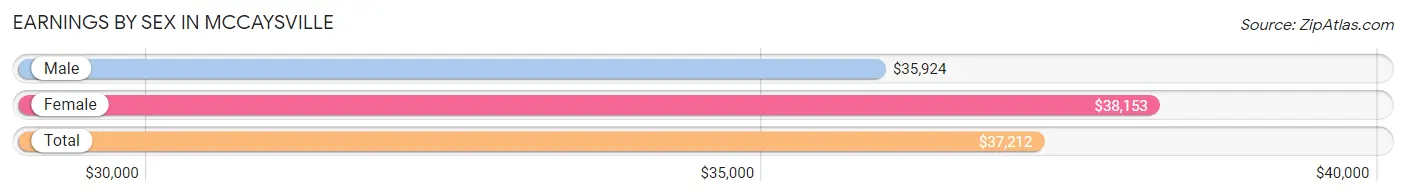
Earnings by Sex in McCaysville
Average Earnings in McCaysville are $37,212, $35,924 for men and $38,153 for women, a difference of 5.8%.
| Sex | Number | Average Earnings |
| Male | 479 (60.2%) | $35,924 |
| Female | 317 (39.8%) | $38,153 |
| Total | 796 (100.0%) | $37,212 |
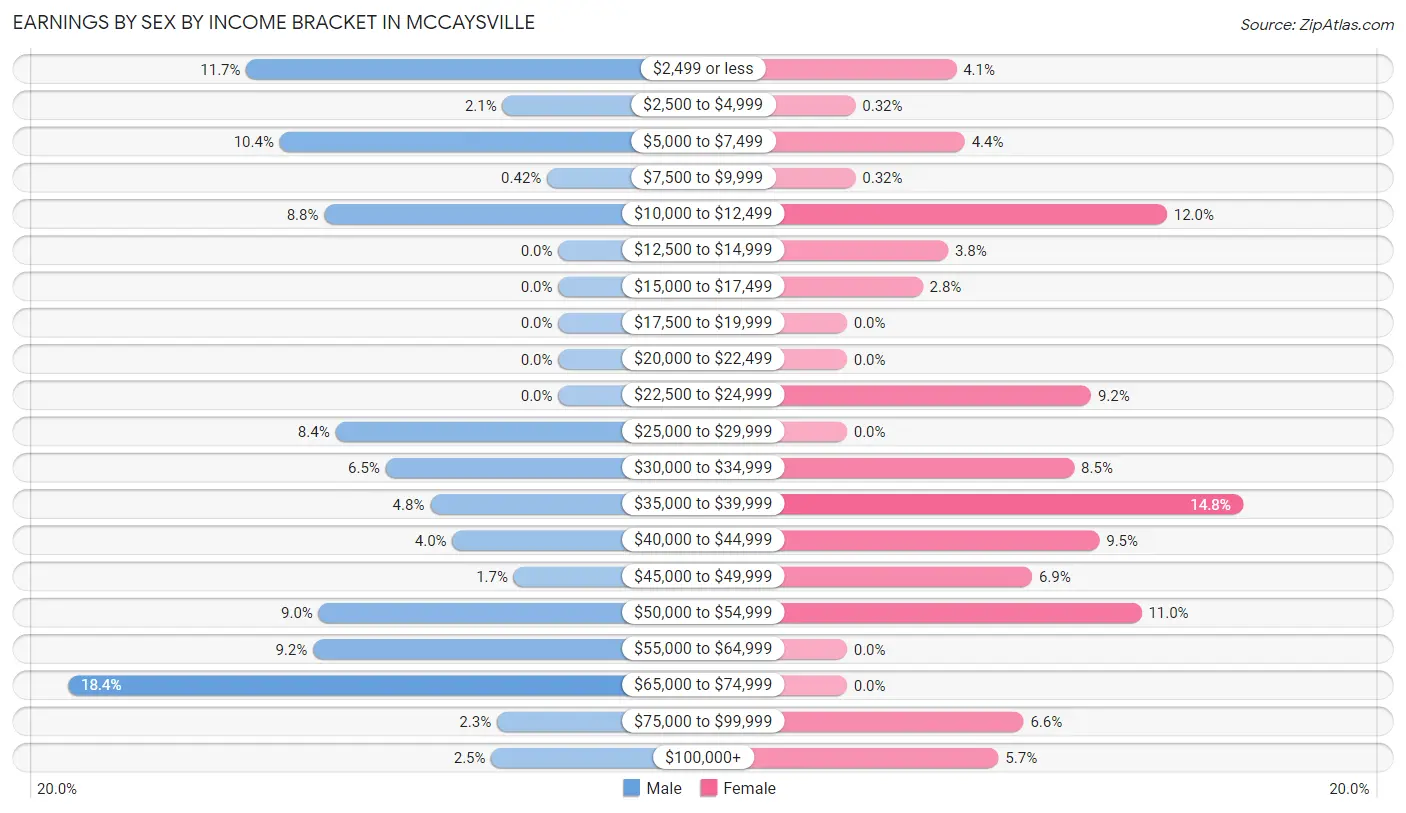
Earnings by Sex by Income Bracket in McCaysville
The most common earnings brackets in McCaysville are $65,000 to $74,999 for men (88 | 18.4%) and $35,000 to $39,999 for women (47 | 14.8%).
| Income | Male | Female |
| $2,499 or less | 56 (11.7%) | 13 (4.1%) |
| $2,500 to $4,999 | 10 (2.1%) | 1 (0.3%) |
| $5,000 to $7,499 | 50 (10.4%) | 14 (4.4%) |
| $7,500 to $9,999 | 2 (0.4%) | 1 (0.3%) |
| $10,000 to $12,499 | 42 (8.8%) | 38 (12.0%) |
| $12,500 to $14,999 | 0 (0.0%) | 12 (3.8%) |
| $15,000 to $17,499 | 0 (0.0%) | 9 (2.8%) |
| $17,500 to $19,999 | 0 (0.0%) | 0 (0.0%) |
| $20,000 to $22,499 | 0 (0.0%) | 0 (0.0%) |
| $22,500 to $24,999 | 0 (0.0%) | 29 (9.1%) |
| $25,000 to $29,999 | 40 (8.4%) | 0 (0.0%) |
| $30,000 to $34,999 | 31 (6.5%) | 27 (8.5%) |
| $35,000 to $39,999 | 23 (4.8%) | 47 (14.8%) |
| $40,000 to $44,999 | 19 (4.0%) | 30 (9.5%) |
| $45,000 to $49,999 | 8 (1.7%) | 22 (6.9%) |
| $50,000 to $54,999 | 43 (9.0%) | 35 (11.0%) |
| $55,000 to $64,999 | 44 (9.2%) | 0 (0.0%) |
| $65,000 to $74,999 | 88 (18.4%) | 0 (0.0%) |
| $75,000 to $99,999 | 11 (2.3%) | 21 (6.6%) |
| $100,000+ | 12 (2.5%) | 18 (5.7%) |
| Total | 479 (100.0%) | 317 (100.0%) |
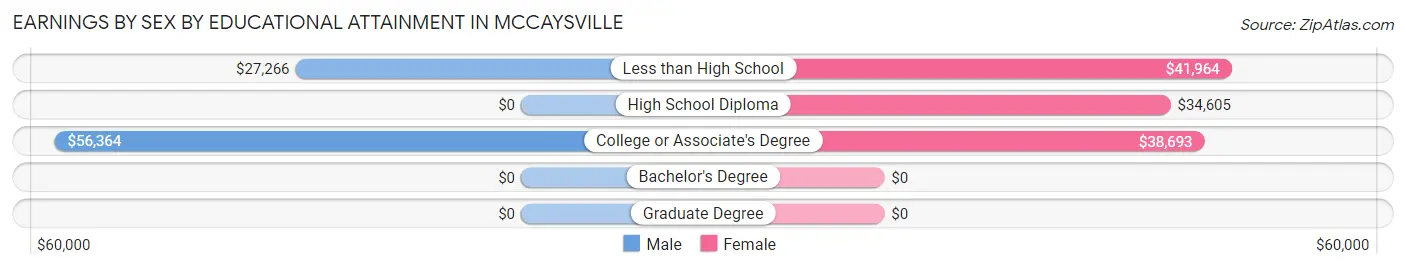
Earnings by Sex by Educational Attainment in McCaysville
Average earnings in McCaysville are $43,854 for men and $39,091 for women, a difference of 10.9%. Men with an educational attainment of college or associate's degree enjoy the highest average annual earnings of $56,364, while those with less than high school education earn the least with $27,266. Women with an educational attainment of less than high school earn the most with the average annual earnings of $41,964, while those with high school diploma education have the smallest earnings of $34,605.
| Educational Attainment | Male Income | Female Income |
| Less than High School | $27,266 | $41,964 |
| High School Diploma | - | - |
| College or Associate's Degree | $56,364 | $38,693 |
| Bachelor's Degree | - | - |
| Graduate Degree | - | - |
| Total | $43,854 | $39,091 |
Family Income in McCaysville
Family Income Brackets in McCaysville
According to the McCaysville family income data, there are 96 families falling into the $25,000 to $34,999 income range, which is the most common income bracket and makes up 22.6% of all families. Conversely, the $150,000 to $199,999 income bracket is the least frequent group with only 3 families (0.7%) belonging to this category.

| Income Bracket | # Families | % Families |
| Less than $10,000 | 18 | 4.2% |
| $10,000 to $14,999 | 25 | 5.9% |
| $15,000 to $24,999 | 24 | 5.7% |
| $25,000 to $34,999 | 96 | 22.6% |
| $35,000 to $49,999 | 40 | 9.4% |
| $50,000 to $74,999 | 57 | 13.4% |
| $75,000 to $99,999 | 66 | 15.6% |
| $100,000 to $149,999 | 89 | 21.0% |
| $150,000 to $199,999 | 3 | 0.7% |
| $200,000+ | 6 | 1.4% |
Family Income by Famaliy Size in McCaysville
4-person families (50 | 11.8%) account for the highest median family income in McCaysville with $86,375 per family, while 3-person families (121 | 28.5%) have the highest median income of $21,917 per family member.

| Income Bracket | # Families | Median Income |
| 2-Person Families | 151 (35.6%) | $32,361 |
| 3-Person Families | 121 (28.5%) | $65,750 |
| 4-Person Families | 50 (11.8%) | $86,375 |
| 5-Person Families | 72 (17.0%) | $85,764 |
| 6-Person Families | 0 (0.0%) | $0 |
| 7+ Person Families | 30 (7.1%) | $0 |
| Total | 424 (100.0%) | $53,906 |
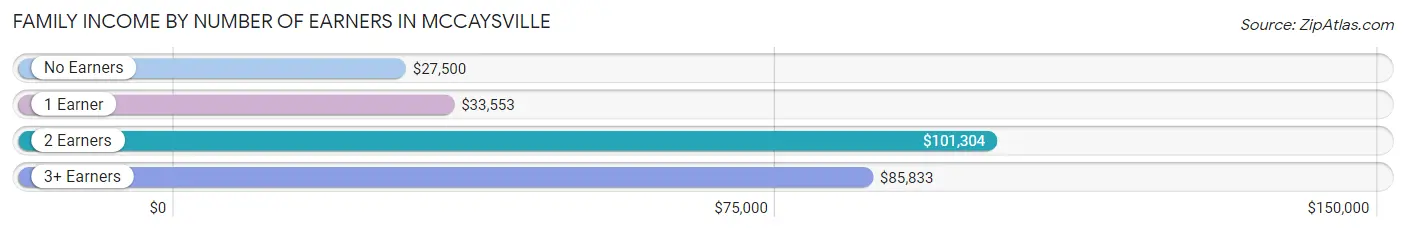
Family Income by Number of Earners in McCaysville
The median family income in McCaysville is $53,906, with families comprising 2 earners (144) having the highest median family income of $101,304, while families with no earners (64) have the lowest median family income of $27,500, accounting for 34.0% and 15.1% of families, respectively.
| Number of Earners | # Families | Median Income |
| No Earners | 64 (15.1%) | $27,500 |
| 1 Earner | 146 (34.4%) | $33,553 |
| 2 Earners | 144 (34.0%) | $101,304 |
| 3+ Earners | 70 (16.5%) | $85,833 |
| Total | 424 (100.0%) | $53,906 |
Household Income in McCaysville
Household Income Brackets in McCaysville
With 165 households falling in the category, the $50,000 to $74,999 income range is the most frequent in McCaysville, accounting for 21.6% of all households. In contrast, only 6 households (0.8%) fall into the $200,000+ income bracket, making it the least populous group.

| Income Bracket | # Households | % Households |
| Less than $10,000 | 58 | 7.6% |
| $10,000 to $14,999 | 83 | 10.9% |
| $15,000 to $24,999 | 81 | 10.6% |
| $25,000 to $34,999 | 95 | 12.4% |
| $35,000 to $49,999 | 97 | 12.7% |
| $50,000 to $74,999 | 165 | 21.6% |
| $75,000 to $99,999 | 74 | 9.7% |
| $100,000 to $149,999 | 98 | 12.8% |
| $150,000 to $199,999 | 7 | 0.9% |
| $200,000+ | 6 | 0.8% |
Household Income by Householder Age in McCaysville
The median household income in McCaysville is $43,553, with the highest median household income of $66,016 found in the 45 to 64 years age bracket for the primary householder. A total of 270 households (35.3%) fall into this category. Meanwhile, the 15 to 24 years age bracket for the primary householder has the lowest median household income of $0, with 5 households (0.6%) in this group.
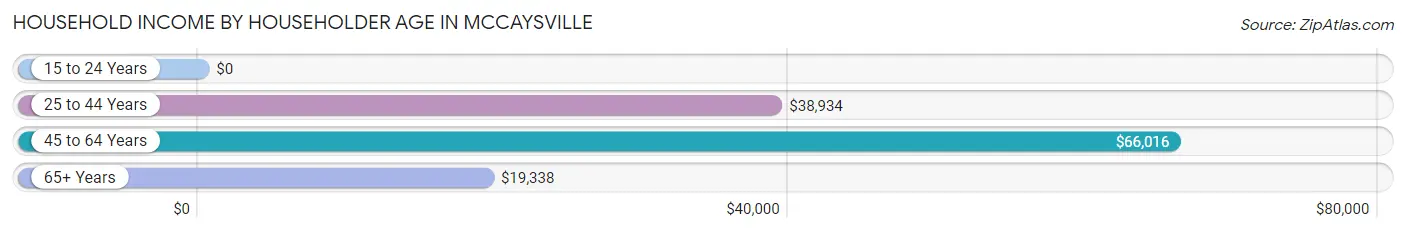
| Income Bracket | # Households | Median Income |
| 15 to 24 Years | 5 (0.6%) | $0 |
| 25 to 44 Years | 311 (40.7%) | $38,934 |
| 45 to 64 Years | 270 (35.3%) | $66,016 |
| 65+ Years | 178 (23.3%) | $19,338 |
| Total | 764 (100.0%) | $43,553 |
Poverty in McCaysville
Income Below Poverty by Sex and Age in McCaysville
With 20.1% poverty level for males and 26.8% for females among the residents of McCaysville, under 5 year old males and 6 to 11 year old females are the most vulnerable to poverty, with 31 males (64.6%) and 47 females (74.6%) in their respective age groups living below the poverty level.
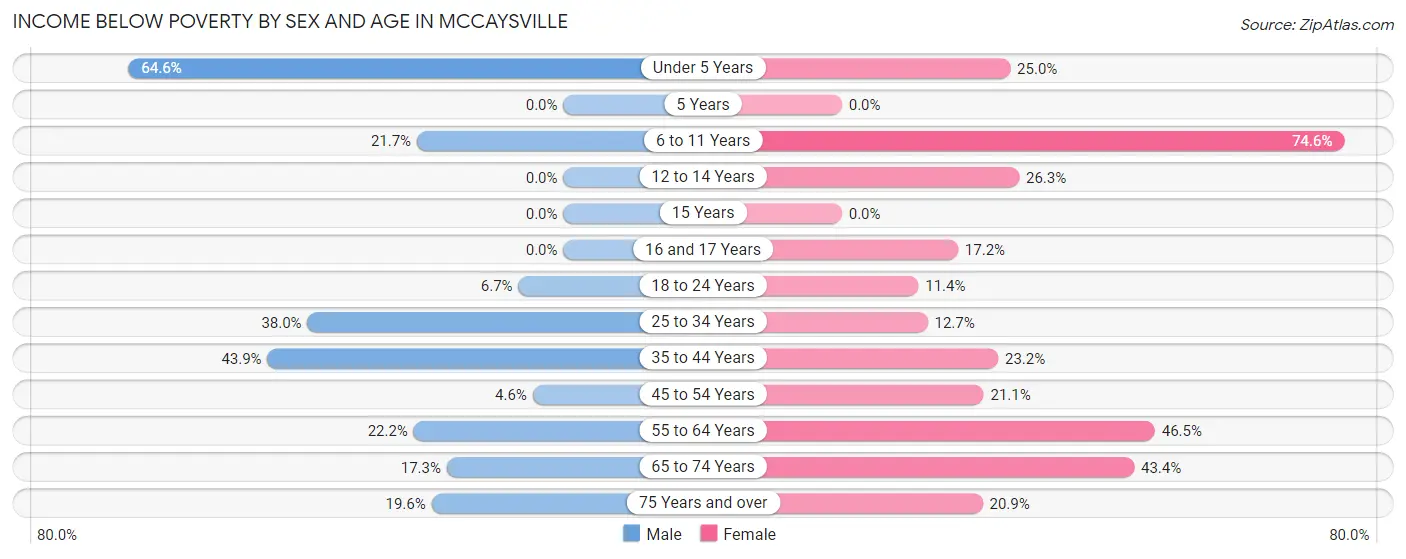
| Age Bracket | Male | Female |
| Under 5 Years | 31 (64.6%) | 11 (25.0%) |
| 5 Years | 0 (0.0%) | 0 (0.0%) |
| 6 to 11 Years | 10 (21.7%) | 47 (74.6%) |
| 12 to 14 Years | 0 (0.0%) | 5 (26.3%) |
| 15 Years | 0 (0.0%) | 0 (0.0%) |
| 16 and 17 Years | 0 (0.0%) | 5 (17.2%) |
| 18 to 24 Years | 7 (6.7%) | 5 (11.4%) |
| 25 to 34 Years | 19 (38.0%) | 21 (12.7%) |
| 35 to 44 Years | 58 (43.9%) | 42 (23.2%) |
| 45 to 54 Years | 9 (4.5%) | 12 (21.0%) |
| 55 to 64 Years | 14 (22.2%) | 33 (46.5%) |
| 65 to 74 Years | 9 (17.3%) | 23 (43.4%) |
| 75 Years and over | 9 (19.6%) | 14 (20.9%) |
| Total | 166 (20.1%) | 218 (26.8%) |
Income Above Poverty by Sex and Age in McCaysville
According to the poverty statistics in McCaysville, males aged 12 to 14 years and females aged 5 years are the age groups that are most secure financially, with 100.0% of males and 100.0% of females in these age groups living above the poverty line.

| Age Bracket | Male | Female |
| Under 5 Years | 17 (35.4%) | 33 (75.0%) |
| 5 Years | 0 (0.0%) | 21 (100.0%) |
| 6 to 11 Years | 36 (78.3%) | 16 (25.4%) |
| 12 to 14 Years | 54 (100.0%) | 14 (73.7%) |
| 15 Years | 11 (100.0%) | 0 (0.0%) |
| 16 and 17 Years | 20 (100.0%) | 24 (82.8%) |
| 18 to 24 Years | 98 (93.3%) | 39 (88.6%) |
| 25 to 34 Years | 31 (62.0%) | 144 (87.3%) |
| 35 to 44 Years | 74 (56.1%) | 139 (76.8%) |
| 45 to 54 Years | 189 (95.5%) | 45 (78.9%) |
| 55 to 64 Years | 49 (77.8%) | 38 (53.5%) |
| 65 to 74 Years | 43 (82.7%) | 30 (56.6%) |
| 75 Years and over | 37 (80.4%) | 53 (79.1%) |
| Total | 659 (79.9%) | 596 (73.2%) |
Income Below Poverty Among Married-Couple Families in McCaysville
The poverty statistics for married-couple families in McCaysville show that 24.9% or 49 of the total 197 families live below the poverty line. Families with 3 or 4 children have the highest poverty rate of 100.0%, comprising of 4 families. On the other hand, families with 1 or 2 children have the lowest poverty rate of 0.0%, which includes 0 families.

| Children | Above Poverty | Below Poverty |
| No Children | 35 (50.0%) | 35 (50.0%) |
| 1 or 2 Children | 113 (100.0%) | 0 (0.0%) |
| 3 or 4 Children | 0 (0.0%) | 4 (100.0%) |
| 5 or more Children | 0 (0.0%) | 10 (100.0%) |
| Total | 148 (75.1%) | 49 (24.9%) |
Income Below Poverty Among Single-Parent Households in McCaysville
According to the poverty data in McCaysville, 31.2% or 25 single-father households and 0.7% or 1 single-mother households are living below the poverty line. Among single-father households, those with 1 or 2 children have the highest poverty rate, with 23 households (54.8%) experiencing poverty. Likewise, among single-mother households, those with no children have the highest poverty rate, with 1 households (1.5%) falling below the poverty line.
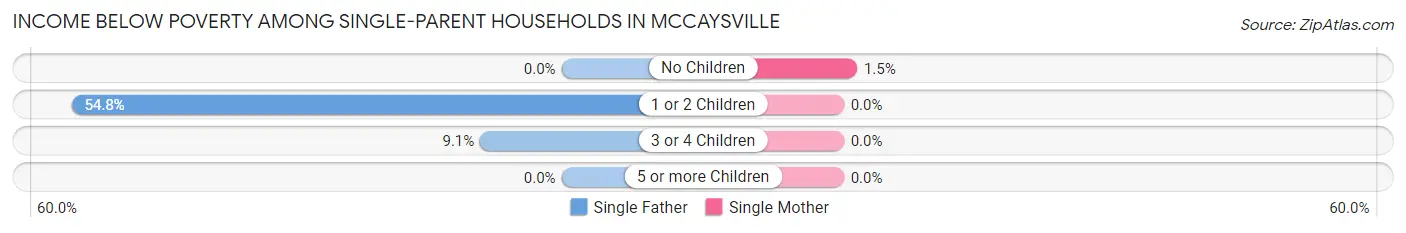
| Children | Single Father | Single Mother |
| No Children | 0 (0.0%) | 1 (1.5%) |
| 1 or 2 Children | 23 (54.8%) | 0 (0.0%) |
| 3 or 4 Children | 2 (9.1%) | 0 (0.0%) |
| 5 or more Children | 0 (0.0%) | 0 (0.0%) |
| Total | 25 (31.2%) | 1 (0.7%) |
Income Below Poverty Among Married-Couple vs Single-Parent Households in McCaysville
The poverty data for McCaysville shows that 49 of the married-couple family households (24.9%) and 26 of the single-parent households (11.5%) are living below the poverty level. Within the married-couple family households, those with 3 or 4 children have the highest poverty rate, with 4 households (100.0%) falling below the poverty line. Among the single-parent households, those with 1 or 2 children have the highest poverty rate, with 23 household (21.3%) living below poverty.
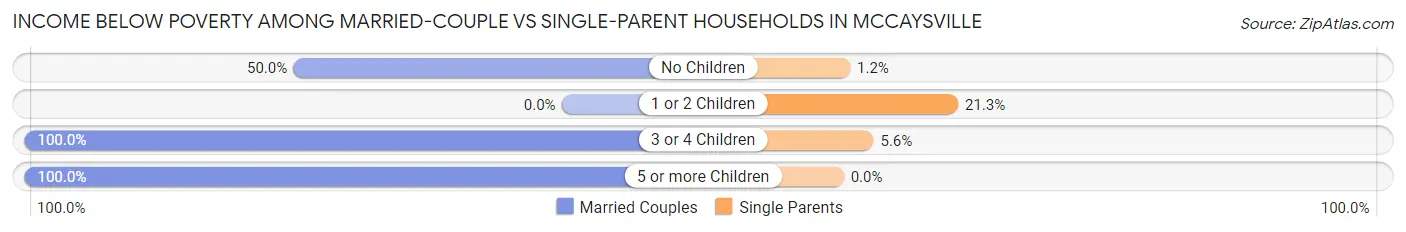
| Children | Married-Couple Families | Single-Parent Households |
| No Children | 35 (50.0%) | 1 (1.2%) |
| 1 or 2 Children | 0 (0.0%) | 23 (21.3%) |
| 3 or 4 Children | 4 (100.0%) | 2 (5.6%) |
| 5 or more Children | 10 (100.0%) | 0 (0.0%) |
| Total | 49 (24.9%) | 26 (11.5%) |
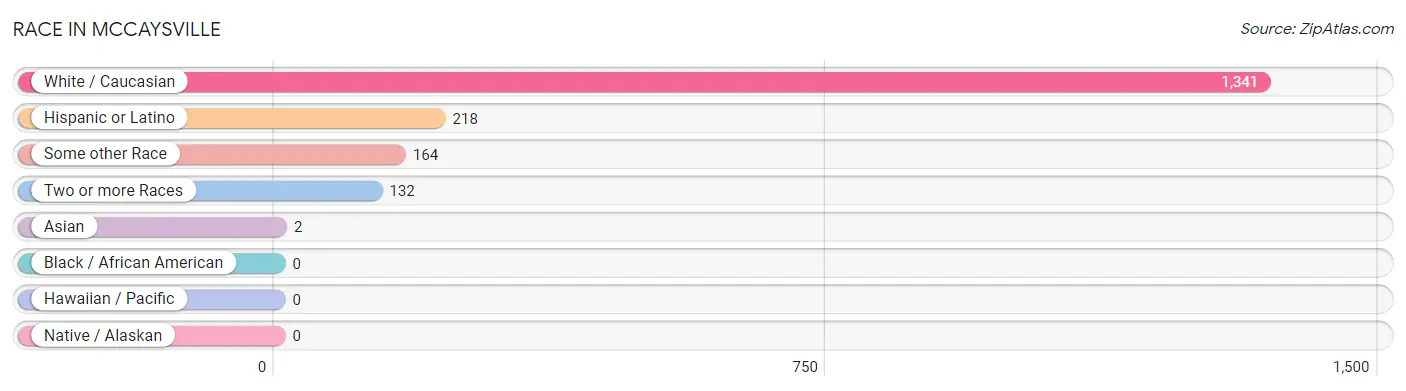
Race in McCaysville
The most populous races in McCaysville are White / Caucasian (1,341 | 81.8%), Hispanic or Latino (218 | 13.3%), and Some other Race (164 | 10.0%).
| Race | # Population | % Population |
| Asian | 2 | 0.1% |
| Black / African American | 0 | 0.0% |
| Hawaiian / Pacific | 0 | 0.0% |
| Hispanic or Latino | 218 | 13.3% |
| Native / Alaskan | 0 | 0.0% |
| White / Caucasian | 1,341 | 81.8% |
| Two or more Races | 132 | 8.1% |
| Some other Race | 164 | 10.0% |
| Total | 1,639 | 100.0% |
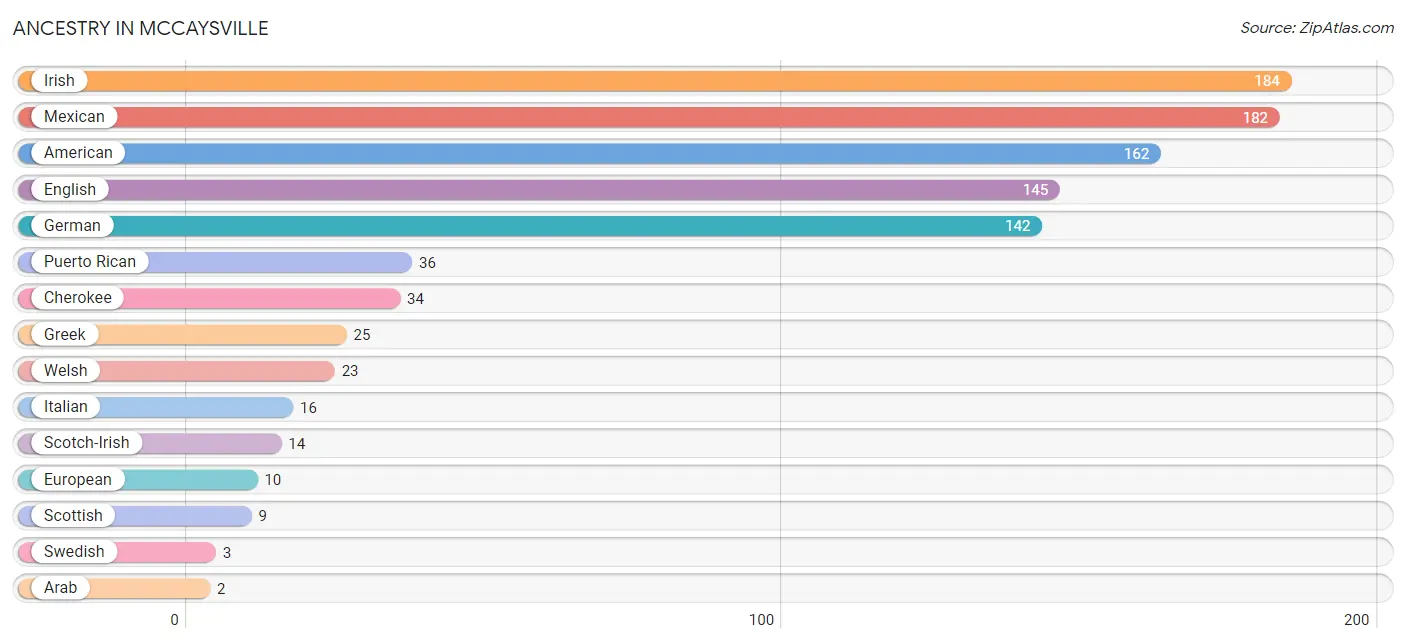
Ancestry in McCaysville
The most populous ancestries reported in McCaysville are Irish (184 | 11.2%), Mexican (182 | 11.1%), American (162 | 9.9%), English (145 | 8.8%), and German (142 | 8.7%), together accounting for 49.7% of all McCaysville residents.
| Ancestry | # Population | % Population |
| American | 162 | 9.9% |
| Arab | 2 | 0.1% |
| Burmese | 2 | 0.1% |
| Cherokee | 34 | 2.1% |
| Creek | 2 | 0.1% |
| English | 145 | 8.8% |
| European | 10 | 0.6% |
| French | 1 | 0.1% |
| German | 142 | 8.7% |
| Greek | 25 | 1.5% |
| Irish | 184 | 11.2% |
| Italian | 16 | 1.0% |
| Lebanese | 2 | 0.1% |
| Mexican | 182 | 11.1% |
| Nigerian | 2 | 0.1% |
| Puerto Rican | 36 | 2.2% |
| Scotch-Irish | 14 | 0.9% |
| Scottish | 9 | 0.5% |
| Subsaharan African | 2 | 0.1% |
| Swedish | 3 | 0.2% |
| Welsh | 23 | 1.4% | View All 21 Rows |
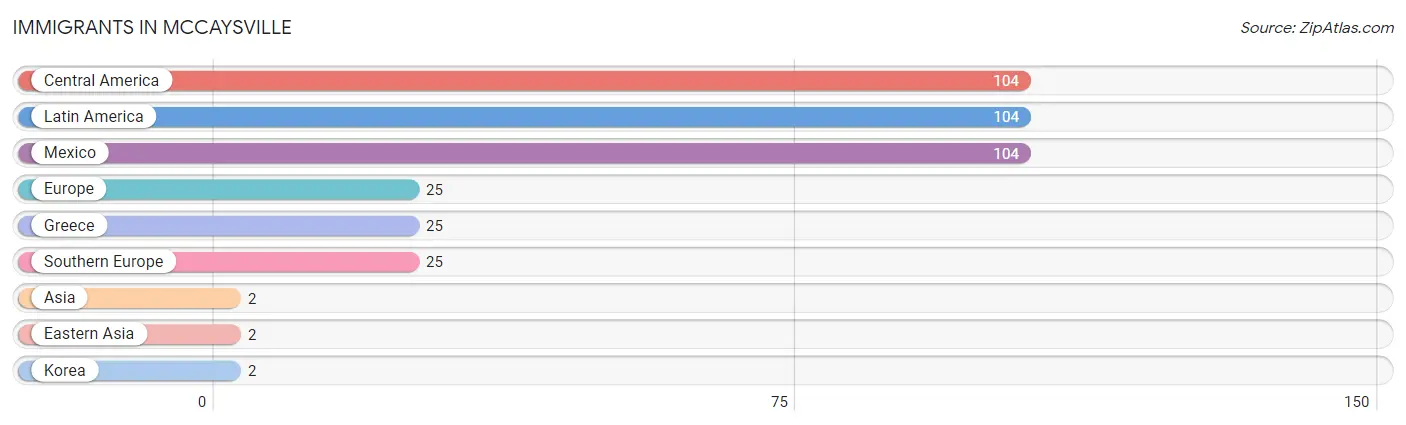
Immigrants in McCaysville
The most numerous immigrant groups reported in McCaysville came from Central America (104 | 6.4%), Latin America (104 | 6.4%), Mexico (104 | 6.4%), Europe (25 | 1.5%), and Greece (25 | 1.5%), together accounting for 22.1% of all McCaysville residents.
| Immigration Origin | # Population | % Population |
| Asia | 2 | 0.1% |
| Central America | 104 | 6.4% |
| Eastern Asia | 2 | 0.1% |
| Europe | 25 | 1.5% |
| Greece | 25 | 1.5% |
| Korea | 2 | 0.1% |
| Latin America | 104 | 6.4% |
| Mexico | 104 | 6.4% |
| Southern Europe | 25 | 1.5% | View All 9 Rows |
Sex and Age in McCaysville
Sex and Age in McCaysville
The most populous age groups in McCaysville are 50 to 54 Years (104 | 12.6%) for men and 40 to 44 Years (111 | 13.6%) for women.

| Age Bracket | Male | Female |
| Under 5 Years | 48 (5.8%) | 44 (5.4%) |
| 5 to 9 Years | 39 (4.7%) | 67 (8.2%) |
| 10 to 14 Years | 61 (7.4%) | 36 (4.4%) |
| 15 to 19 Years | 92 (11.2%) | 38 (4.7%) |
| 20 to 24 Years | 44 (5.3%) | 35 (4.3%) |
| 25 to 29 Years | 34 (4.1%) | 93 (11.4%) |
| 30 to 34 Years | 16 (1.9%) | 72 (8.8%) |
| 35 to 39 Years | 94 (11.4%) | 70 (8.6%) |
| 40 to 44 Years | 38 (4.6%) | 111 (13.6%) |
| 45 to 49 Years | 94 (11.4%) | 24 (2.9%) |
| 50 to 54 Years | 104 (12.6%) | 33 (4.1%) |
| 55 to 59 Years | 30 (3.6%) | 21 (2.6%) |
| 60 to 64 Years | 33 (4.0%) | 50 (6.1%) |
| 65 to 69 Years | 27 (3.3%) | 46 (5.7%) |
| 70 to 74 Years | 25 (3.0%) | 7 (0.9%) |
| 75 to 79 Years | 3 (0.4%) | 28 (3.4%) |
| 80 to 84 Years | 21 (2.5%) | 24 (2.9%) |
| 85 Years and over | 22 (2.7%) | 15 (1.8%) |
| Total | 825 (100.0%) | 814 (100.0%) |
Families and Households in McCaysville
Median Family Size in McCaysville
The median family size in McCaysville is 2.90 persons per family, with married-couple families (197 | 46.5%) accounting for the largest median family size of 3.54 persons per family. On the other hand, single female/mother families (147 | 34.7%) represent the smallest median family size with 2.24 persons per family.

| Family Type | # Families | Family Size |
| Married-Couple | 197 (46.5%) | 3.54 |
| Single Male/Father | 80 (18.9%) | 2.51 |
| Single Female/Mother | 147 (34.7%) | 2.24 |
| Total Families | 424 (100.0%) | 2.90 |
Median Household Size in McCaysville
The median household size in McCaysville is 2.15 persons per household, with married-couple households (197 | 25.8%) accounting for the largest median household size of 3.54 persons per household. non-family households (340 | 44.5%) represent the smallest median household size with 1.08 persons per household.
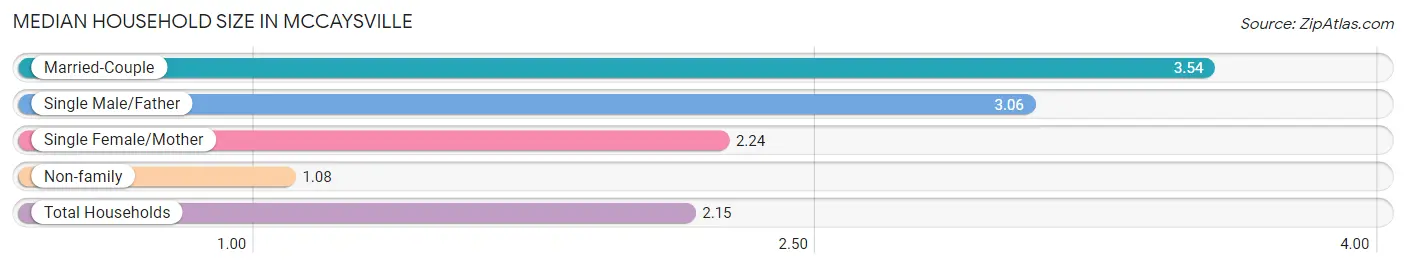
| Household Type | # Households | Household Size |
| Married-Couple | 197 (25.8%) | 3.54 |
| Single Male/Father | 80 (10.5%) | 3.06 |
| Single Female/Mother | 147 (19.2%) | 2.24 |
| Non-family | 340 (44.5%) | 1.08 |
| Total Households | 764 (100.0%) | 2.15 |
Household Size by Marriage Status in McCaysville
Out of a total of 764 households in McCaysville, 424 (55.5%) are family households, while 340 (44.5%) are nonfamily households. The most numerous type of family households are 3-person households, comprising 138, and the most common type of nonfamily households are 1-person households, comprising 326.

| Household Size | Family Households | Nonfamily Households |
| 1-Person Households | - | 326 (42.7%) |
| 2-Person Households | 126 (16.5%) | 10 (1.3%) |
| 3-Person Households | 138 (18.1%) | 4 (0.5%) |
| 4-Person Households | 38 (5.0%) | 0 (0.0%) |
| 5-Person Households | 92 (12.0%) | 0 (0.0%) |
| 6-Person Households | 0 (0.0%) | 0 (0.0%) |
| 7+ Person Households | 30 (3.9%) | 0 (0.0%) |
| Total | 424 (55.5%) | 340 (44.5%) |
Female Fertility in McCaysville
Fertility by Age in McCaysville

| Age Bracket | Women with Births | Births / 1,000 Women |
| 15 to 19 years | 0 (0.0%) | 0.0 |
| 20 to 34 years | 0 (0.0%) | 0.0 |
| 35 to 50 years | 0 (0.0%) | 0.0 |
| Total | 0 (0.0%) | 0.0 |
Fertility by Age by Marriage Status in McCaysville
| Age Bracket | Married | Unmarried |
| 15 to 19 years | 0 (0.0%) | 0 (0.0%) |
| 20 to 34 years | 0 (0.0%) | 0 (0.0%) |
| 35 to 50 years | 0 (0.0%) | 0 (0.0%) |
| Total | 0 (0.0%) | 0 (0.0%) |
Fertility by Education in McCaysville
| Educational Attainment | Women with Births | Births / 1,000 Women |
| Less than High School | 0 (0.0%) | 0.0 |
| High School Diploma | 0 (0.0%) | 0.0 |
| College or Associate's Degree | 0 (0.0%) | 0.0 |
| Bachelor's Degree | 0 (0.0%) | 0.0 |
| Graduate Degree | 0 (0.0%) | 0.0 |
| Total | 0 (0.0%) | 0.0 |
Fertility by Education by Marriage Status in McCaysville
| Educational Attainment | Married | Unmarried |
| Less than High School | 0 (0.0%) | 0 (0.0%) |
| High School Diploma | 0 (0.0%) | 0 (0.0%) |
| College or Associate's Degree | 0 (0.0%) | 0 (0.0%) |
| Bachelor's Degree | 0 (0.0%) | 0 (0.0%) |
| Graduate Degree | 0 (0.0%) | 0 (0.0%) |
| Total | 0 (0.0%) | 0 (0.0%) |
Employment Characteristics in McCaysville
Employment by Class of Employer in McCaysville
Among the 776 employed individuals in McCaysville, private company employees (541 | 69.7%), self-employed (not incorporated) (91 | 11.7%), and federal government employees (54 | 7.0%) make up the most common classes of employment.
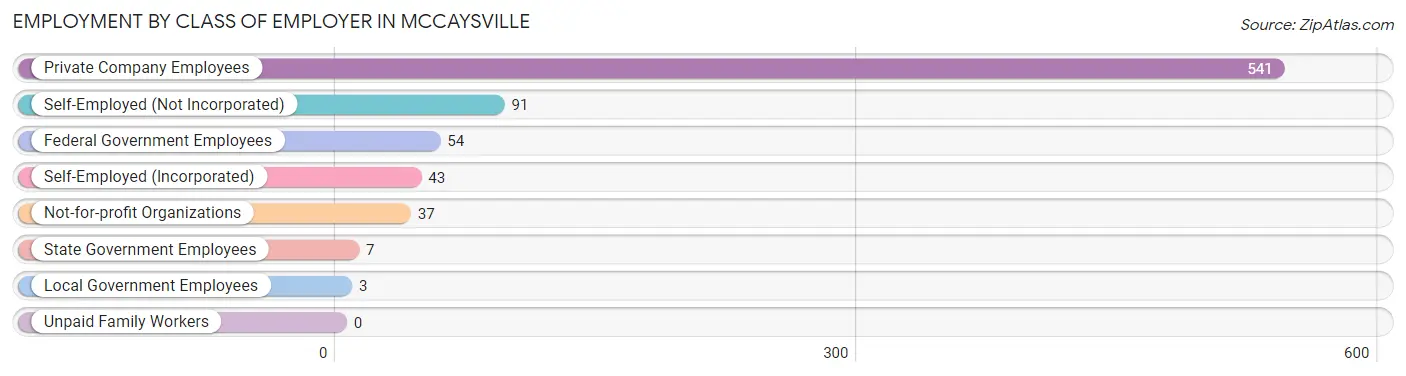
| Employer Class | # Employees | % Employees |
| Private Company Employees | 541 | 69.7% |
| Self-Employed (Incorporated) | 43 | 5.5% |
| Self-Employed (Not Incorporated) | 91 | 11.7% |
| Not-for-profit Organizations | 37 | 4.8% |
| Local Government Employees | 3 | 0.4% |
| State Government Employees | 7 | 0.9% |
| Federal Government Employees | 54 | 7.0% |
| Unpaid Family Workers | 0 | 0.0% |
| Total | 776 | 100.0% |
Employment Status by Age in McCaysville
According to the labor force statistics for McCaysville, out of the total population over 16 years of age (1,333), 59.1% or 788 individuals are in the labor force, with 0.4% or 3 of them unemployed. The age group with the highest labor force participation rate is 20 to 24 years, with 88.6% or 70 individuals in the labor force. Within the labor force, the 75 years and over age range has the highest percentage of unemployed individuals, with 25.0% or 1 of them being unemployed.
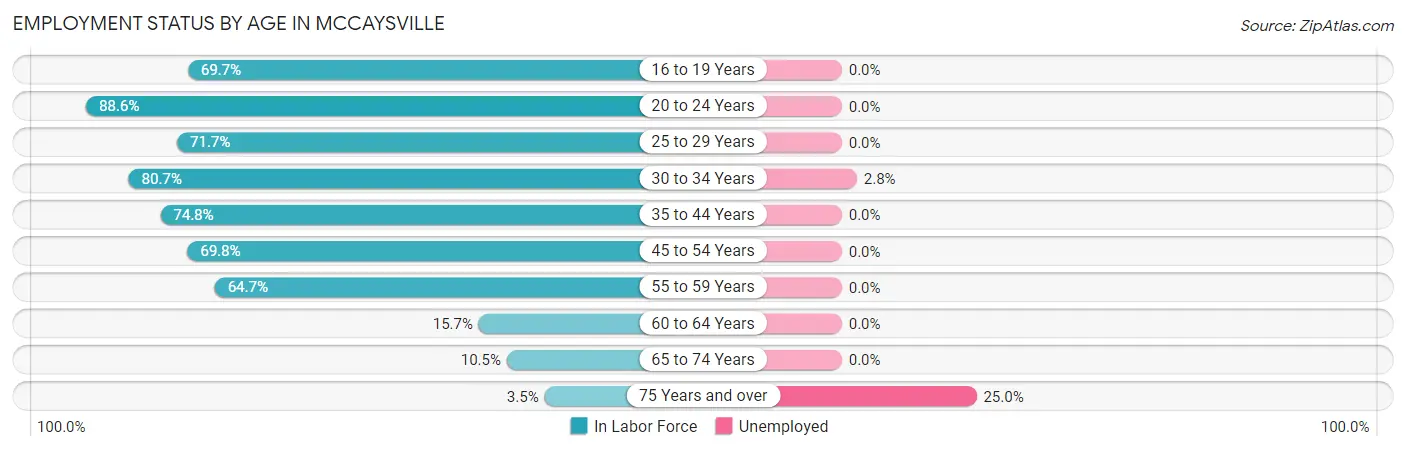
| Age Bracket | In Labor Force | Unemployed |
| 16 to 19 Years | 83 (69.7%) | 0 (0.0%) |
| 20 to 24 Years | 70 (88.6%) | 0 (0.0%) |
| 25 to 29 Years | 91 (71.7%) | 0 (0.0%) |
| 30 to 34 Years | 71 (80.7%) | 2 (2.8%) |
| 35 to 44 Years | 234 (74.8%) | 0 (0.0%) |
| 45 to 54 Years | 178 (69.8%) | 0 (0.0%) |
| 55 to 59 Years | 33 (64.7%) | 0 (0.0%) |
| 60 to 64 Years | 13 (15.7%) | 0 (0.0%) |
| 65 to 74 Years | 11 (10.5%) | 0 (0.0%) |
| 75 Years and over | 4 (3.5%) | 1 (25.0%) |
| Total | 788 (59.1%) | 3 (0.4%) |
Employment Status by Educational Attainment in McCaysville
According to labor force statistics for McCaysville, 67.6% of individuals (620) out of the total population between 25 and 64 years of age (917) are in the labor force, with 0.3% or 2 of them being unemployed. The group with the highest labor force participation rate are those with the educational attainment of college / associate degree, with 85.6% or 351 individuals in the labor force. Within the labor force, individuals with less than high school education have the highest percentage of unemployment, with 4.0% or 2 of them being unemployed.

| Educational Attainment | In Labor Force | Unemployed |
| Less than High School | 50 (31.4%) | 6 (4.0%) |
| High School Diploma | 208 (62.5%) | 0 (0.0%) |
| College / Associate Degree | 351 (85.6%) | 0 (0.0%) |
| Bachelor's Degree or higher | 11 (73.3%) | 0 (0.0%) |
| Total | 620 (67.6%) | 3 (0.3%) |
Employment Occupations by Sex in McCaysville
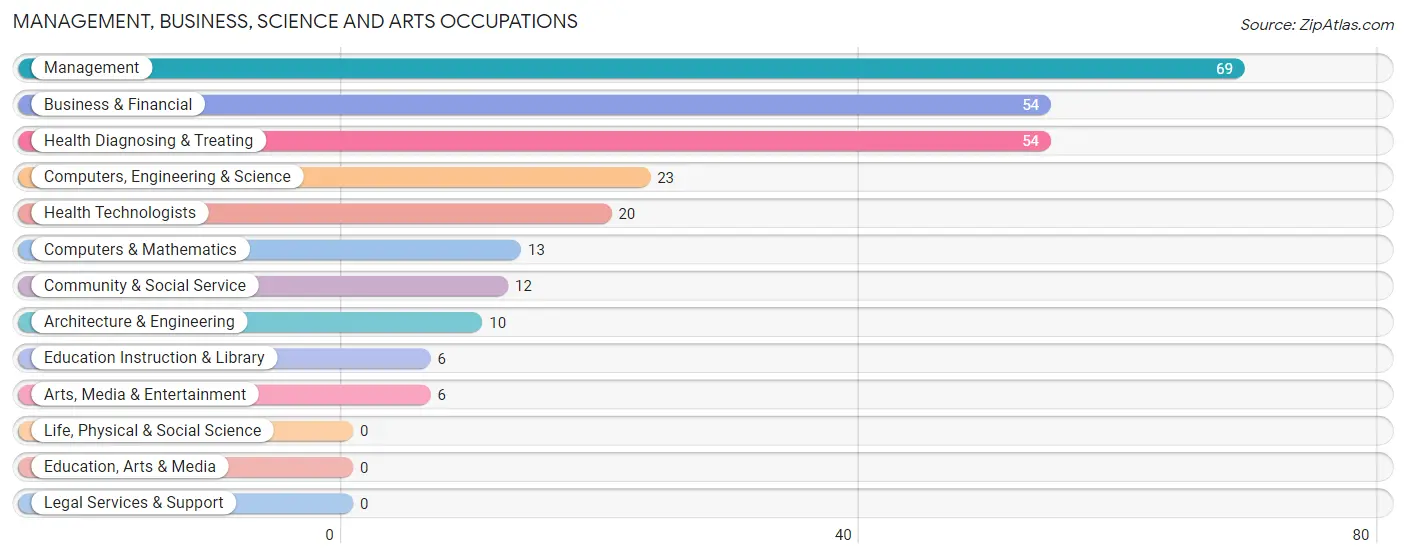
Management, Business, Science and Arts Occupations
The most common Management, Business, Science and Arts occupations in McCaysville are Management (69 | 8.8%), Business & Financial (54 | 6.9%), Health Diagnosing & Treating (54 | 6.9%), Computers, Engineering & Science (23 | 2.9%), and Health Technologists (20 | 2.5%).
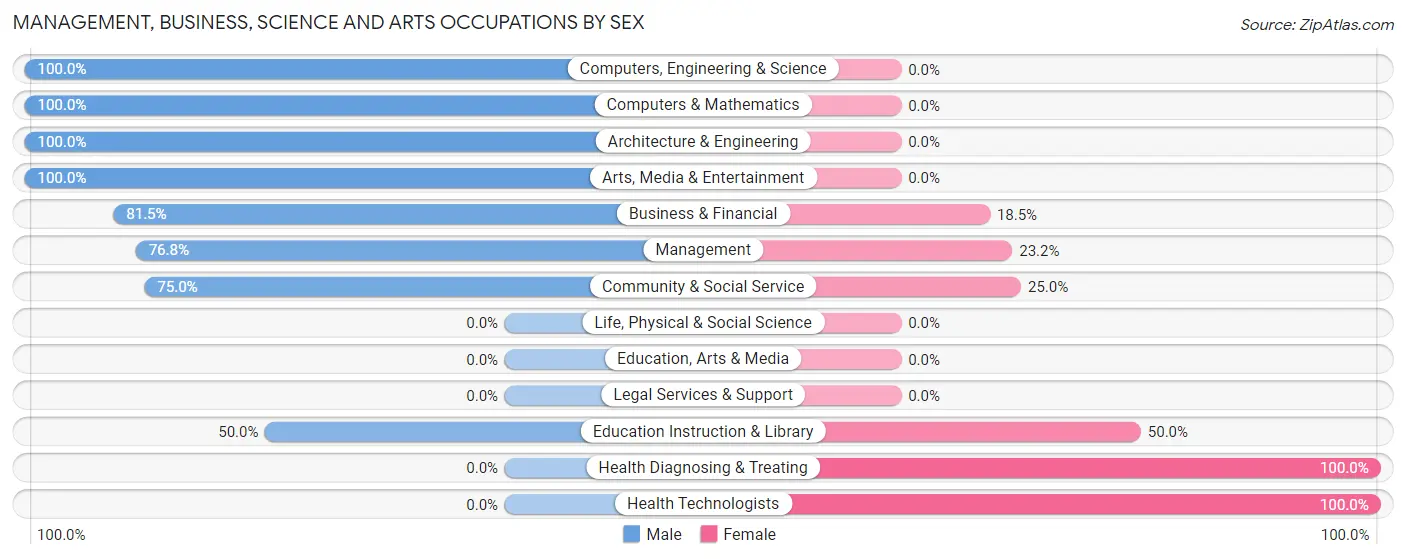
Management, Business, Science and Arts Occupations by Sex
Within the Management, Business, Science and Arts occupations in McCaysville, the most male-oriented occupations are Computers, Engineering & Science (100.0%), Computers & Mathematics (100.0%), and Architecture & Engineering (100.0%), while the most female-oriented occupations are Health Diagnosing & Treating (100.0%), Health Technologists (100.0%), and Education Instruction & Library (50.0%).
| Occupation | Male | Female |
| Management | 53 (76.8%) | 16 (23.2%) |
| Business & Financial | 44 (81.5%) | 10 (18.5%) |
| Computers, Engineering & Science | 23 (100.0%) | 0 (0.0%) |
| Computers & Mathematics | 13 (100.0%) | 0 (0.0%) |
| Architecture & Engineering | 10 (100.0%) | 0 (0.0%) |
| Life, Physical & Social Science | 0 (0.0%) | 0 (0.0%) |
| Community & Social Service | 9 (75.0%) | 3 (25.0%) |
| Education, Arts & Media | 0 (0.0%) | 0 (0.0%) |
| Legal Services & Support | 0 (0.0%) | 0 (0.0%) |
| Education Instruction & Library | 3 (50.0%) | 3 (50.0%) |
| Arts, Media & Entertainment | 6 (100.0%) | 0 (0.0%) |
| Health Diagnosing & Treating | 0 (0.0%) | 54 (100.0%) |
| Health Technologists | 0 (0.0%) | 20 (100.0%) |
| Total (Category) | 129 (60.9%) | 83 (39.2%) |
| Total (Overall) | 470 (59.9%) | 315 (40.1%) |
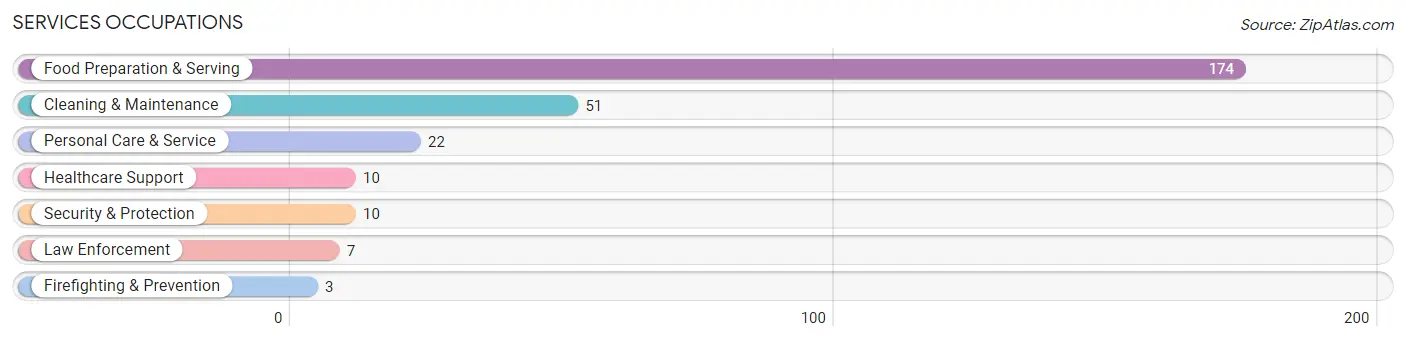
Services Occupations
The most common Services occupations in McCaysville are Food Preparation & Serving (174 | 22.2%), Cleaning & Maintenance (51 | 6.5%), Personal Care & Service (22 | 2.8%), Healthcare Support (10 | 1.3%), and Security & Protection (10 | 1.3%).
Services Occupations by Sex
Within the Services occupations in McCaysville, the most male-oriented occupations are Firefighting & Prevention (100.0%), Cleaning & Maintenance (82.4%), and Food Preparation & Serving (75.3%), while the most female-oriented occupations are Healthcare Support (100.0%), Law Enforcement (100.0%), and Personal Care & Service (100.0%).

| Occupation | Male | Female |
| Healthcare Support | 0 (0.0%) | 10 (100.0%) |
| Security & Protection | 3 (30.0%) | 7 (70.0%) |
| Firefighting & Prevention | 3 (100.0%) | 0 (0.0%) |
| Law Enforcement | 0 (0.0%) | 7 (100.0%) |
| Food Preparation & Serving | 131 (75.3%) | 43 (24.7%) |
| Cleaning & Maintenance | 42 (82.4%) | 9 (17.6%) |
| Personal Care & Service | 0 (0.0%) | 22 (100.0%) |
| Total (Category) | 176 (65.9%) | 91 (34.1%) |
| Total (Overall) | 470 (59.9%) | 315 (40.1%) |
Sales and Office Occupations
The most common Sales and Office occupations in McCaysville are Office & Administration (73 | 9.3%), and Sales & Related (47 | 6.0%).
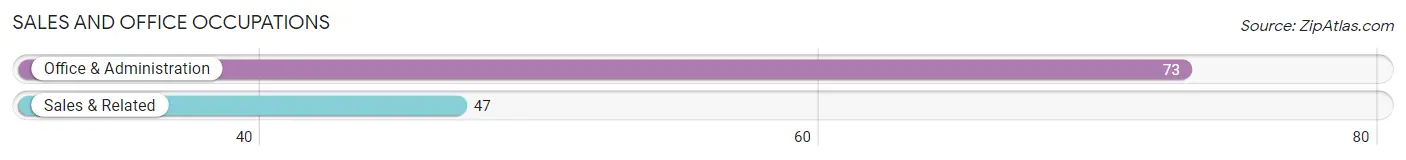
Sales and Office Occupations by Sex

| Occupation | Male | Female |
| Sales & Related | 12 (25.5%) | 35 (74.5%) |
| Office & Administration | 0 (0.0%) | 73 (100.0%) |
| Total (Category) | 12 (10.0%) | 108 (90.0%) |
| Total (Overall) | 470 (59.9%) | 315 (40.1%) |
Natural Resources, Construction and Maintenance Occupations
The most common Natural Resources, Construction and Maintenance occupations in McCaysville are Installation, Maintenance & Repair (56 | 7.1%), and Construction & Extraction (52 | 6.6%).
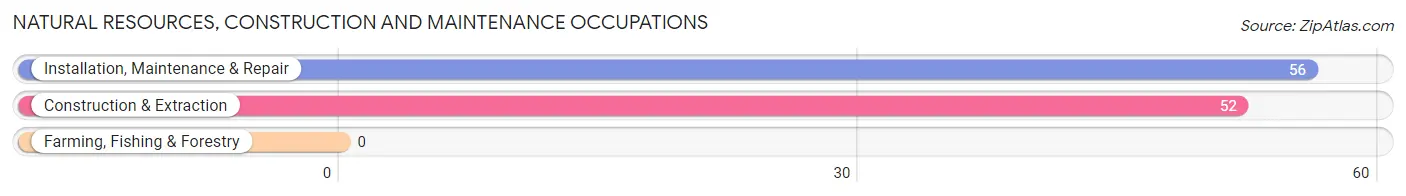
Natural Resources, Construction and Maintenance Occupations by Sex
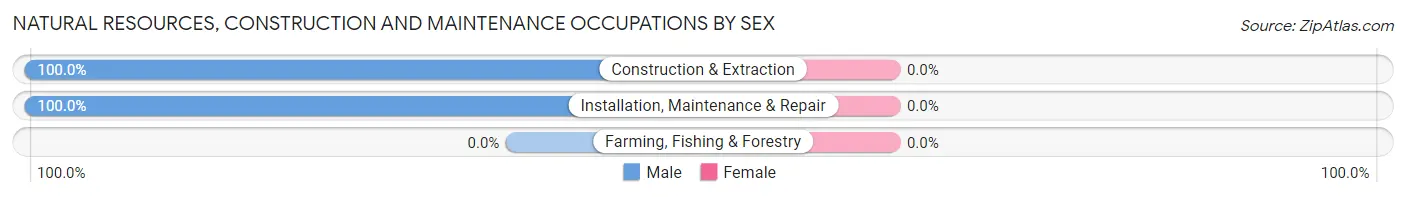
| Occupation | Male | Female |
| Farming, Fishing & Forestry | 0 (0.0%) | 0 (0.0%) |
| Construction & Extraction | 52 (100.0%) | 0 (0.0%) |
| Installation, Maintenance & Repair | 56 (100.0%) | 0 (0.0%) |
| Total (Category) | 108 (100.0%) | 0 (0.0%) |
| Total (Overall) | 470 (59.9%) | 315 (40.1%) |
Production, Transportation and Moving Occupations
The most common Production, Transportation and Moving occupations in McCaysville are Material Moving (46 | 5.9%), and Production (32 | 4.1%).
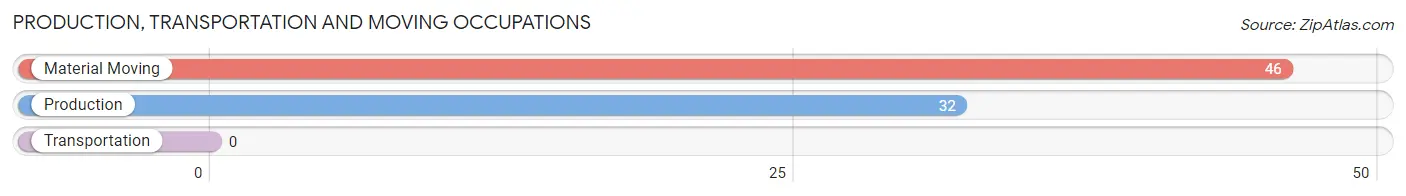
Production, Transportation and Moving Occupations by Sex

| Occupation | Male | Female |
| Production | 0 (0.0%) | 32 (100.0%) |
| Transportation | 0 (0.0%) | 0 (0.0%) |
| Material Moving | 45 (97.8%) | 1 (2.2%) |
| Total (Category) | 45 (57.7%) | 33 (42.3%) |
| Total (Overall) | 470 (59.9%) | 315 (40.1%) |
Employment Industries by Sex in McCaysville
Employment Industries in McCaysville
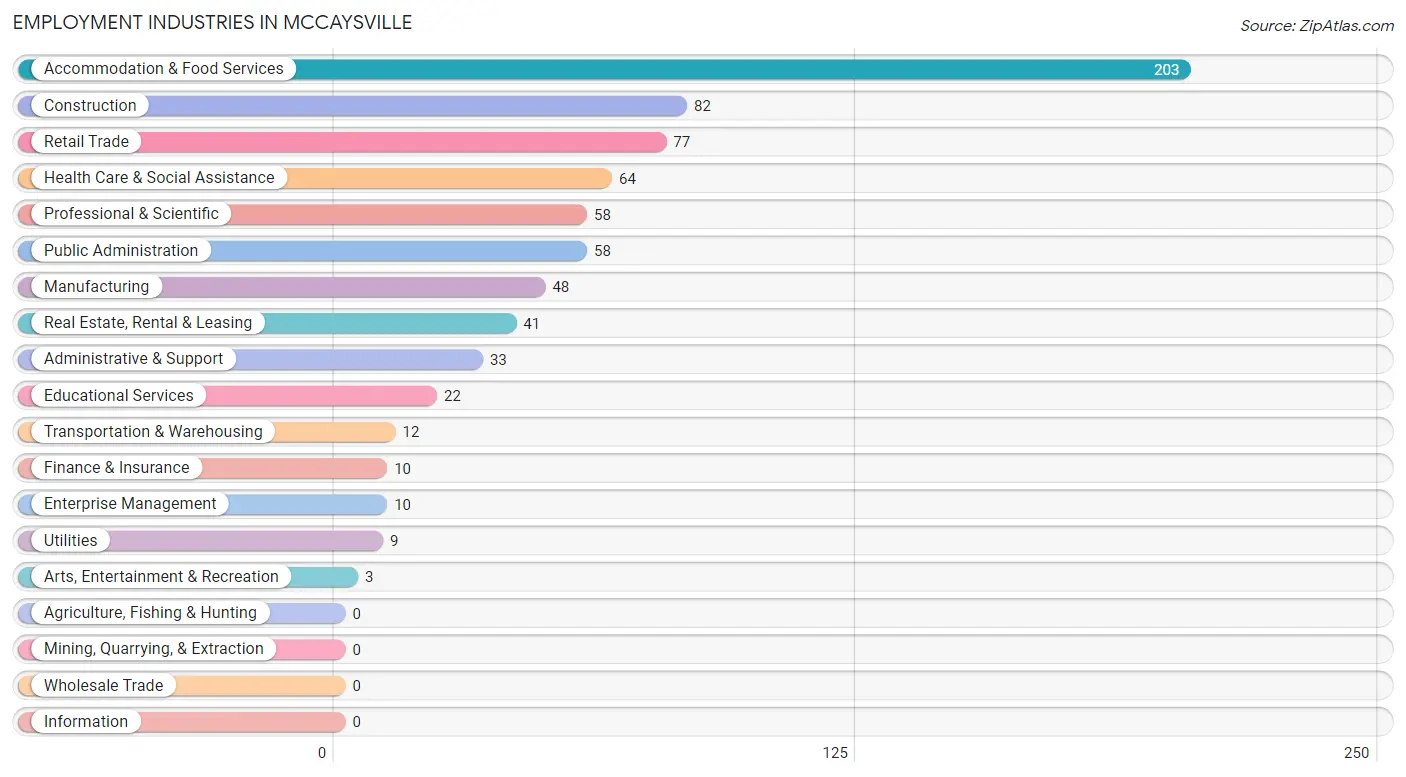
The major employment industries in McCaysville include Accommodation & Food Services (203 | 25.9%), Construction (82 | 10.4%), Retail Trade (77 | 9.8%), Health Care & Social Assistance (64 | 8.2%), and Professional & Scientific (58 | 7.4%).
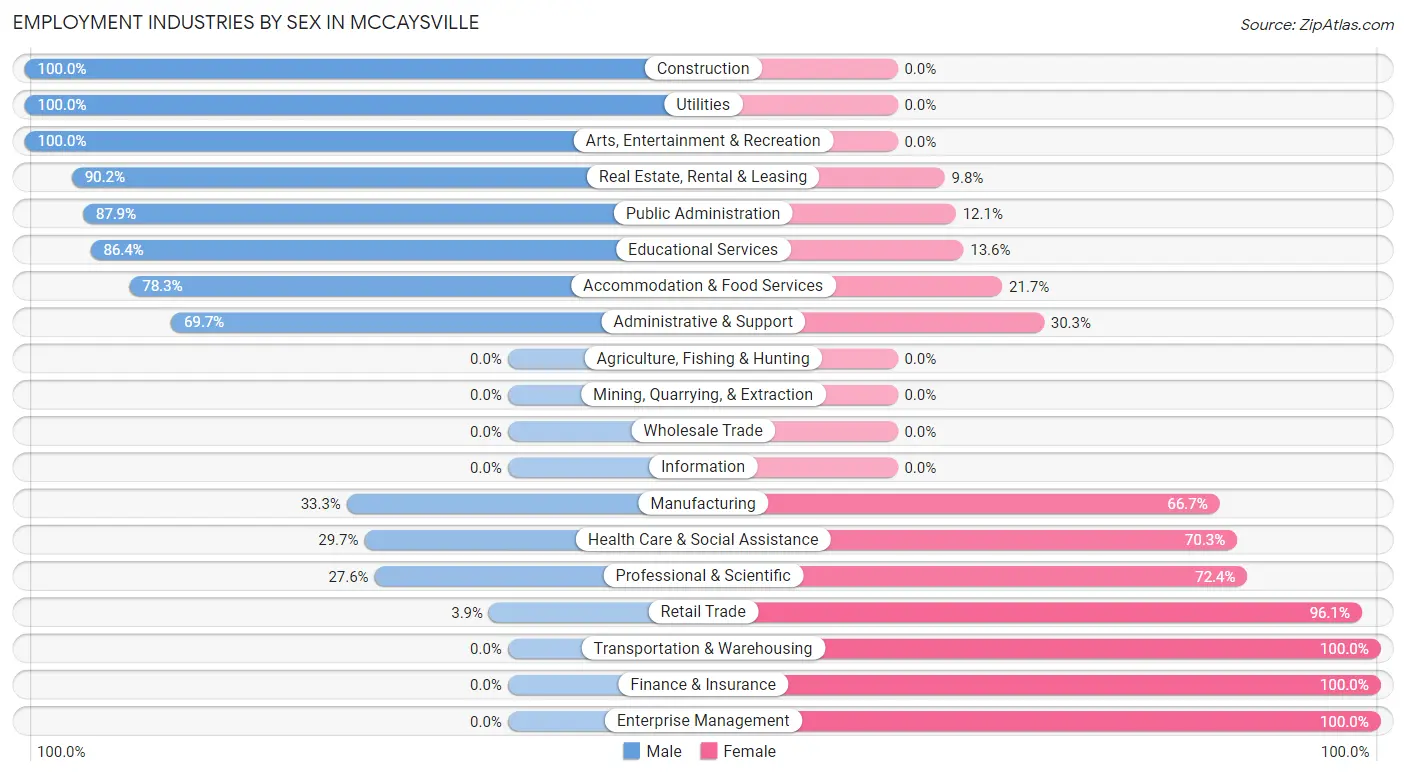
Employment Industries by Sex in McCaysville
The McCaysville industries that see more men than women are Construction (100.0%), Utilities (100.0%), and Arts, Entertainment & Recreation (100.0%), whereas the industries that tend to have a higher number of women are Transportation & Warehousing (100.0%), Finance & Insurance (100.0%), and Enterprise Management (100.0%).
| Industry | Male | Female |
| Agriculture, Fishing & Hunting | 0 (0.0%) | 0 (0.0%) |
| Mining, Quarrying, & Extraction | 0 (0.0%) | 0 (0.0%) |
| Construction | 82 (100.0%) | 0 (0.0%) |
| Manufacturing | 16 (33.3%) | 32 (66.7%) |
| Wholesale Trade | 0 (0.0%) | 0 (0.0%) |
| Retail Trade | 3 (3.9%) | 74 (96.1%) |
| Transportation & Warehousing | 0 (0.0%) | 12 (100.0%) |
| Utilities | 9 (100.0%) | 0 (0.0%) |
| Information | 0 (0.0%) | 0 (0.0%) |
| Finance & Insurance | 0 (0.0%) | 10 (100.0%) |
| Real Estate, Rental & Leasing | 37 (90.2%) | 4 (9.8%) |
| Professional & Scientific | 16 (27.6%) | 42 (72.4%) |
| Enterprise Management | 0 (0.0%) | 10 (100.0%) |
| Administrative & Support | 23 (69.7%) | 10 (30.3%) |
| Educational Services | 19 (86.4%) | 3 (13.6%) |
| Health Care & Social Assistance | 19 (29.7%) | 45 (70.3%) |
| Arts, Entertainment & Recreation | 3 (100.0%) | 0 (0.0%) |
| Accommodation & Food Services | 159 (78.3%) | 44 (21.7%) |
| Public Administration | 51 (87.9%) | 7 (12.1%) |
| Total | 470 (59.9%) | 315 (40.1%) |
Education in McCaysville
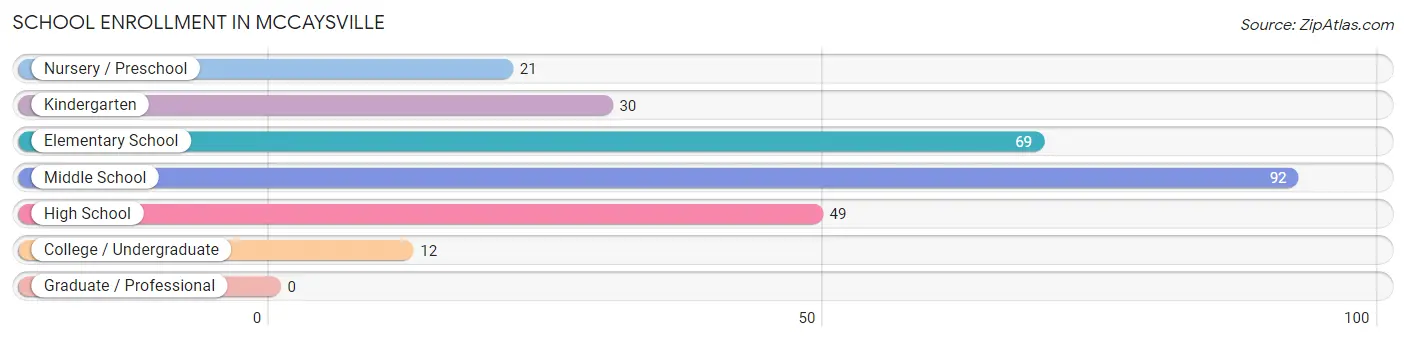
School Enrollment in McCaysville
The most common levels of schooling among the 273 students in McCaysville are middle school (92 | 33.7%), elementary school (69 | 25.3%), and high school (49 | 17.9%).
| School Level | # Students | % Students |
| Nursery / Preschool | 21 | 7.7% |
| Kindergarten | 30 | 11.0% |
| Elementary School | 69 | 25.3% |
| Middle School | 92 | 33.7% |
| High School | 49 | 17.9% |
| College / Undergraduate | 12 | 4.4% |
| Graduate / Professional | 0 | 0.0% |
| Total | 273 | 100.0% |
School Enrollment by Age by Funding Source in McCaysville
Out of a total of 273 students who are enrolled in schools in McCaysville, 25 (9.2%) attend a private institution, while the remaining 248 (90.8%) are enrolled in public schools. The age group of 3 to 4 year olds has the highest likelihood of being enrolled in private schools, with 6 (28.6% in the age bracket) enrolled. Conversely, the age group of 18 to 19 year olds has the lowest likelihood of being enrolled in a private school, with 9 (100.0% in the age bracket) attending a public institution.

| Age Bracket | Public School | Private School |
| 3 to 4 Year Olds | 15 (71.4%) | 6 (28.6%) |
| 5 to 9 Year Old | 90 (97.8%) | 2 (2.2%) |
| 10 to 14 Year Olds | 62 (89.9%) | 7 (10.1%) |
| 15 to 17 Year Olds | 27 (73.0%) | 10 (27.0%) |
| 18 to 19 Year Olds | 9 (100.0%) | 0 (0.0%) |
| 20 to 24 Year Olds | 19 (100.0%) | 0 (0.0%) |
| 25 to 34 Year Olds | 0 (0.0%) | 0 (0.0%) |
| 35 Years and over | 26 (100.0%) | 0 (0.0%) |
| Total | 248 (90.8%) | 25 (9.2%) |
Educational Attainment by Field of Study in McCaysville
Business (14 | 63.6%), education (6 | 27.3%), and multidisciplinary studies (2 | 9.1%) are the most common fields of study among 22 individuals in McCaysville who have obtained a bachelor's degree or higher.

| Field of Study | # Graduates | % Graduates |
| Computers & Mathematics | 0 | 0.0% |
| Bio, Nature & Agricultural | 0 | 0.0% |
| Physical & Health Sciences | 0 | 0.0% |
| Psychology | 0 | 0.0% |
| Social Sciences | 0 | 0.0% |
| Engineering | 0 | 0.0% |
| Multidisciplinary Studies | 2 | 9.1% |
| Science & Technology | 0 | 0.0% |
| Business | 14 | 63.6% |
| Education | 6 | 27.3% |
| Literature & Languages | 0 | 0.0% |
| Liberal Arts & History | 0 | 0.0% |
| Visual & Performing Arts | 0 | 0.0% |
| Communications | 0 | 0.0% |
| Arts & Humanities | 0 | 0.0% |
| Total | 22 | 100.0% |
Transportation & Commute in McCaysville
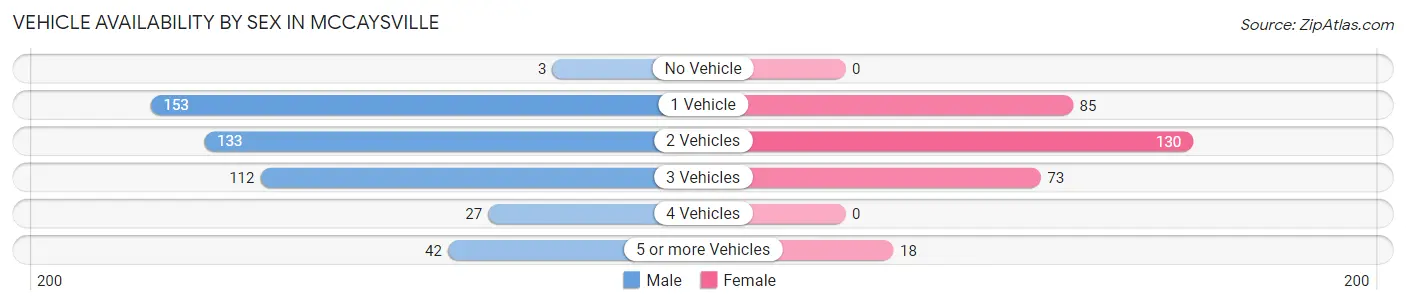
Vehicle Availability by Sex in McCaysville
The most prevalent vehicle ownership categories in McCaysville are males with 1 vehicle (153, accounting for 32.6%) and females with 1 vehicle (85, making up 50.0%).
| Vehicles Available | Male | Female |
| No Vehicle | 3 (0.6%) | 0 (0.0%) |
| 1 Vehicle | 153 (32.6%) | 85 (27.8%) |
| 2 Vehicles | 133 (28.3%) | 130 (42.5%) |
| 3 Vehicles | 112 (23.8%) | 73 (23.9%) |
| 4 Vehicles | 27 (5.7%) | 0 (0.0%) |
| 5 or more Vehicles | 42 (8.9%) | 18 (5.9%) |
| Total | 470 (100.0%) | 306 (100.0%) |
Commute Time in McCaysville
The most frequently occuring commute durations in McCaysville are 15 to 19 minutes (196 commuters, 26.0%), 10 to 14 minutes (150 commuters, 19.9%), and 20 to 24 minutes (139 commuters, 18.4%).
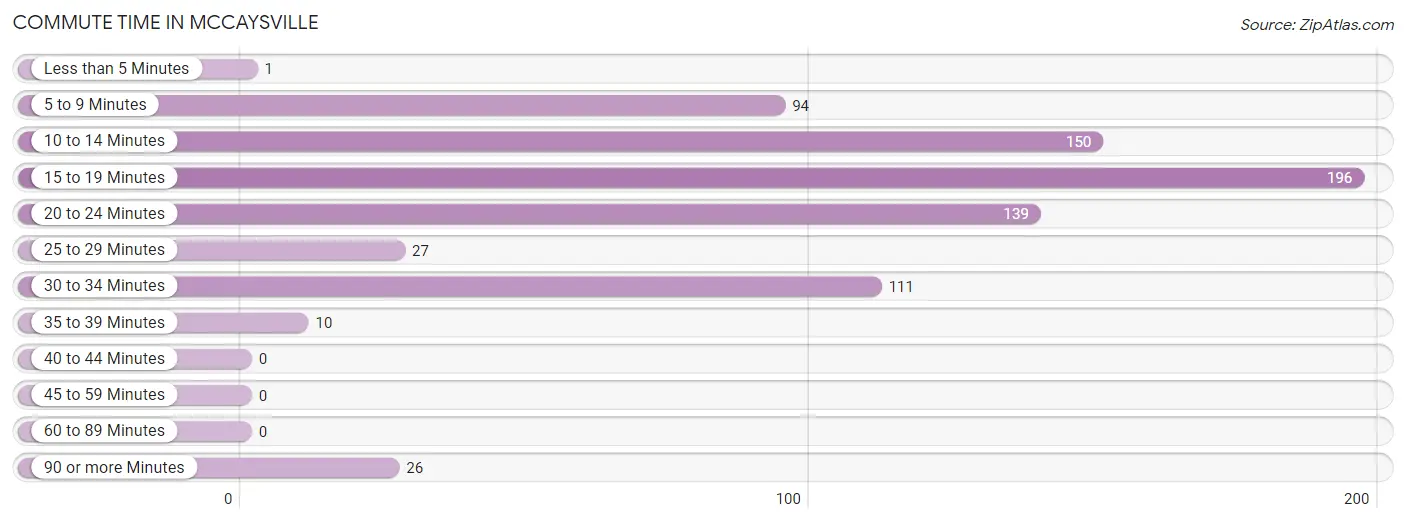
| Commute Time | # Commuters | % Commuters |
| Less than 5 Minutes | 1 | 0.1% |
| 5 to 9 Minutes | 94 | 12.5% |
| 10 to 14 Minutes | 150 | 19.9% |
| 15 to 19 Minutes | 196 | 26.0% |
| 20 to 24 Minutes | 139 | 18.4% |
| 25 to 29 Minutes | 27 | 3.6% |
| 30 to 34 Minutes | 111 | 14.7% |
| 35 to 39 Minutes | 10 | 1.3% |
| 40 to 44 Minutes | 0 | 0.0% |
| 45 to 59 Minutes | 0 | 0.0% |
| 60 to 89 Minutes | 0 | 0.0% |
| 90 or more Minutes | 26 | 3.5% |
Commute Time by Sex in McCaysville
The most common commute times in McCaysville are 30 to 34 minutes (103 commuters, 22.2%) for males and 15 to 19 minutes (126 commuters, 43.4%) for females.

| Commute Time | Male | Female |
| Less than 5 Minutes | 0 (0.0%) | 1 (0.3%) |
| 5 to 9 Minutes | 64 (13.8%) | 30 (10.3%) |
| 10 to 14 Minutes | 88 (19.0%) | 62 (21.4%) |
| 15 to 19 Minutes | 70 (15.1%) | 126 (43.4%) |
| 20 to 24 Minutes | 92 (19.8%) | 47 (16.2%) |
| 25 to 29 Minutes | 26 (5.6%) | 1 (0.3%) |
| 30 to 34 Minutes | 103 (22.2%) | 8 (2.8%) |
| 35 to 39 Minutes | 0 (0.0%) | 10 (3.5%) |
| 40 to 44 Minutes | 0 (0.0%) | 0 (0.0%) |
| 45 to 59 Minutes | 0 (0.0%) | 0 (0.0%) |
| 60 to 89 Minutes | 0 (0.0%) | 0 (0.0%) |
| 90 or more Minutes | 21 (4.5%) | 5 (1.7%) |
Time of Departure to Work by Sex in McCaysville
The most frequent times of departure to work in McCaysville are 9:00 AM to 9:59 AM (102, 22.0%) for males and 8:00 AM to 8:29 AM (93, 32.1%) for females.
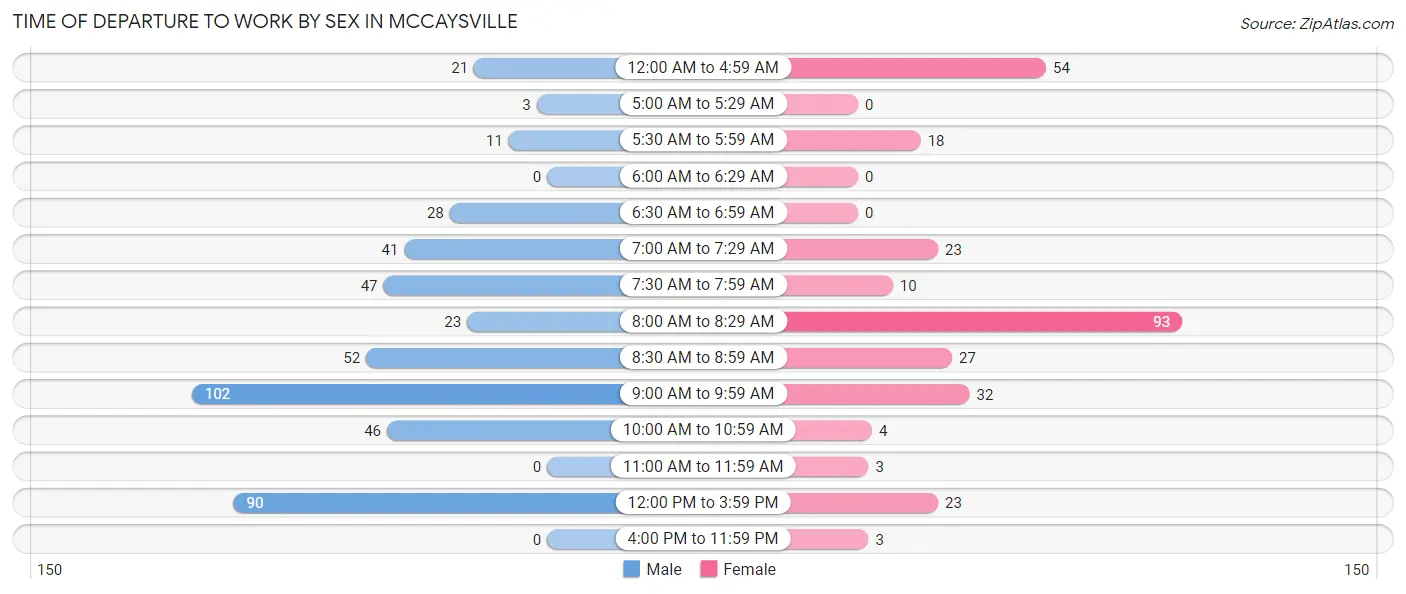
| Time of Departure | Male | Female |
| 12:00 AM to 4:59 AM | 21 (4.5%) | 54 (18.6%) |
| 5:00 AM to 5:29 AM | 3 (0.6%) | 0 (0.0%) |
| 5:30 AM to 5:59 AM | 11 (2.4%) | 18 (6.2%) |
| 6:00 AM to 6:29 AM | 0 (0.0%) | 0 (0.0%) |
| 6:30 AM to 6:59 AM | 28 (6.0%) | 0 (0.0%) |
| 7:00 AM to 7:29 AM | 41 (8.8%) | 23 (7.9%) |
| 7:30 AM to 7:59 AM | 47 (10.1%) | 10 (3.5%) |
| 8:00 AM to 8:29 AM | 23 (5.0%) | 93 (32.1%) |
| 8:30 AM to 8:59 AM | 52 (11.2%) | 27 (9.3%) |
| 9:00 AM to 9:59 AM | 102 (22.0%) | 32 (11.0%) |
| 10:00 AM to 10:59 AM | 46 (9.9%) | 4 (1.4%) |
| 11:00 AM to 11:59 AM | 0 (0.0%) | 3 (1.0%) |
| 12:00 PM to 3:59 PM | 90 (19.4%) | 23 (7.9%) |
| 4:00 PM to 11:59 PM | 0 (0.0%) | 3 (1.0%) |
| Total | 464 (100.0%) | 290 (100.0%) |
Housing Occupancy in McCaysville
Occupancy by Ownership in McCaysville
Of the total 764 dwellings in McCaysville, owner-occupied units account for 462 (60.5%), while renter-occupied units make up 302 (39.5%).
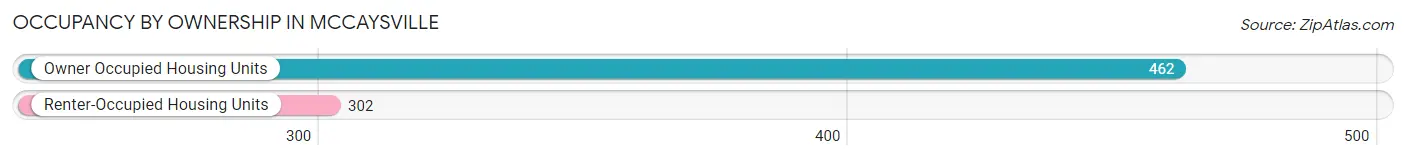
| Occupancy | # Housing Units | % Housing Units |
| Owner Occupied Housing Units | 462 | 60.5% |
| Renter-Occupied Housing Units | 302 | 39.5% |
| Total Occupied Housing Units | 764 | 100.0% |
Occupancy by Household Size in McCaysville

| Household Size | # Housing Units | % Housing Units |
| 1-Person Household | 326 | 42.7% |
| 2-Person Household | 136 | 17.8% |
| 3-Person Household | 142 | 18.6% |
| 4+ Person Household | 160 | 20.9% |
| Total Housing Units | 764 | 100.0% |
Occupancy by Ownership by Household Size in McCaysville
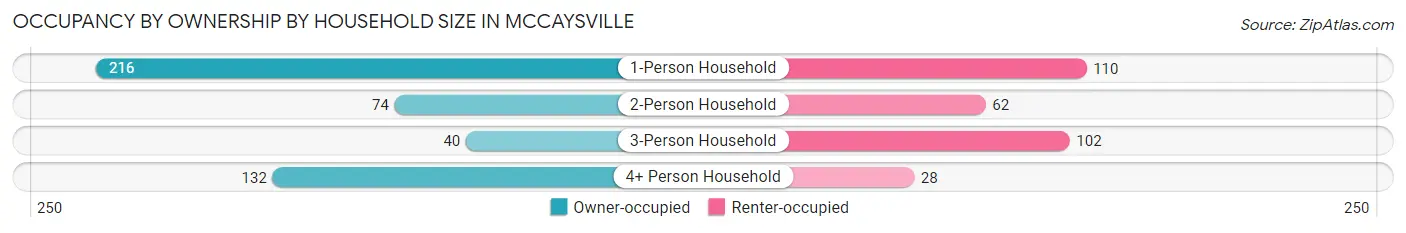
| Household Size | Owner-occupied | Renter-occupied |
| 1-Person Household | 216 (66.3%) | 110 (33.7%) |
| 2-Person Household | 74 (54.4%) | 62 (45.6%) |
| 3-Person Household | 40 (28.2%) | 102 (71.8%) |
| 4+ Person Household | 132 (82.5%) | 28 (17.5%) |
| Total Housing Units | 462 (60.5%) | 302 (39.5%) |
Occupancy by Educational Attainment in McCaysville
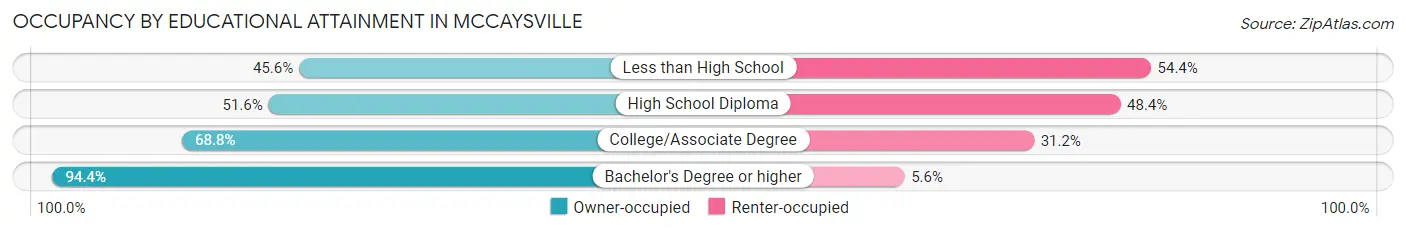
| Household Size | Owner-occupied | Renter-occupied |
| Less than High School | 62 (45.6%) | 74 (54.4%) |
| High School Diploma | 110 (51.6%) | 103 (48.4%) |
| College/Associate Degree | 273 (68.8%) | 124 (31.2%) |
| Bachelor's Degree or higher | 17 (94.4%) | 1 (5.6%) |
Occupancy by Age of Householder in McCaysville

| Age Bracket | # Households | % Households |
| Under 35 Years | 142 | 18.6% |
| 35 to 44 Years | 174 | 22.8% |
| 45 to 54 Years | 213 | 27.9% |
| 55 to 64 Years | 57 | 7.5% |
| 65 to 74 Years | 87 | 11.4% |
| 75 to 84 Years | 54 | 7.1% |
| 85 Years and Over | 37 | 4.8% |
| Total | 764 | 100.0% |
Housing Finances in McCaysville
Median Income by Occupancy in McCaysville
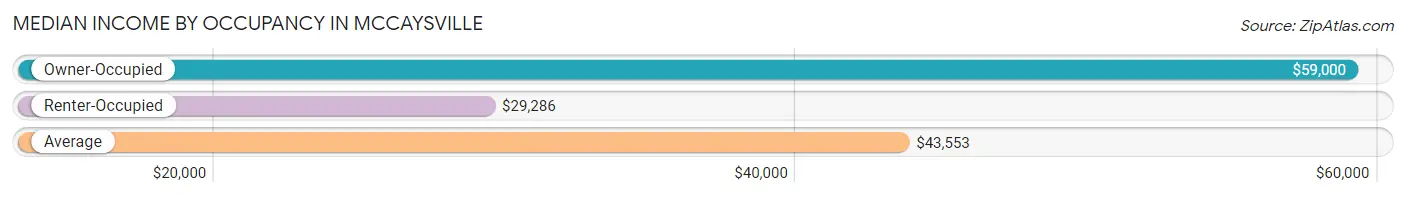
| Occupancy Type | # Households | Median Income |
| Owner-Occupied | 462 (60.5%) | $59,000 |
| Renter-Occupied | 302 (39.5%) | $29,286 |
| Average | 764 (100.0%) | $43,553 |
Occupancy by Householder Income Bracket in McCaysville
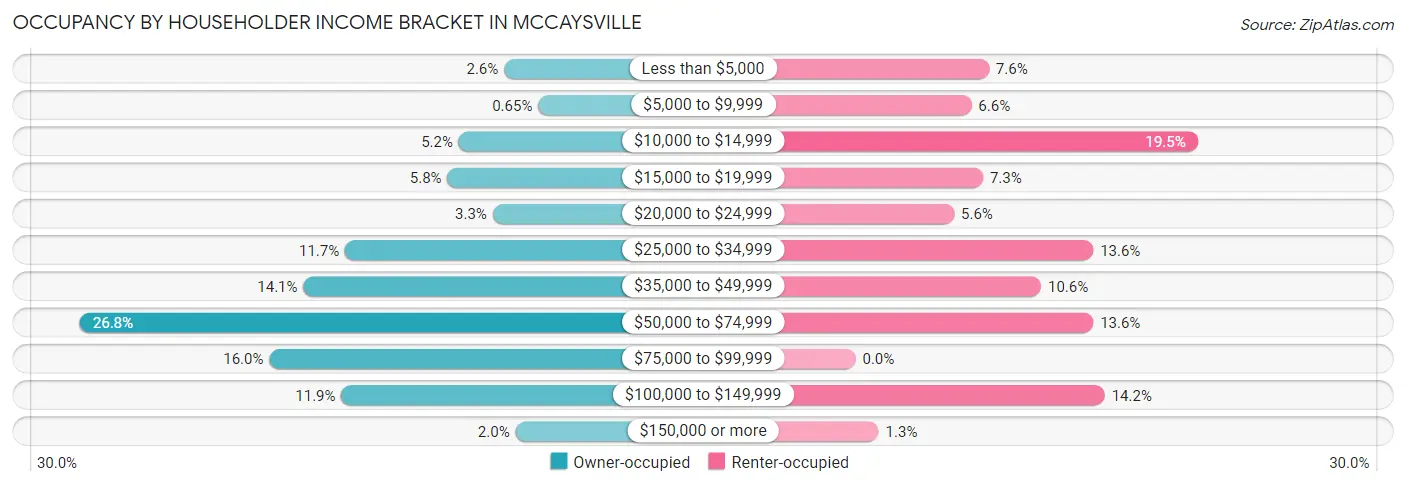
| Income Bracket | Owner-occupied | Renter-occupied |
| Less than $5,000 | 12 (2.6%) | 23 (7.6%) |
| $5,000 to $9,999 | 3 (0.6%) | 20 (6.6%) |
| $10,000 to $14,999 | 24 (5.2%) | 59 (19.5%) |
| $15,000 to $19,999 | 27 (5.8%) | 22 (7.3%) |
| $20,000 to $24,999 | 15 (3.3%) | 17 (5.6%) |
| $25,000 to $34,999 | 54 (11.7%) | 41 (13.6%) |
| $35,000 to $49,999 | 65 (14.1%) | 32 (10.6%) |
| $50,000 to $74,999 | 124 (26.8%) | 41 (13.6%) |
| $75,000 to $99,999 | 74 (16.0%) | 0 (0.0%) |
| $100,000 to $149,999 | 55 (11.9%) | 43 (14.2%) |
| $150,000 or more | 9 (1.9%) | 4 (1.3%) |
| Total | 462 (100.0%) | 302 (100.0%) |
Monthly Housing Cost Tiers in McCaysville
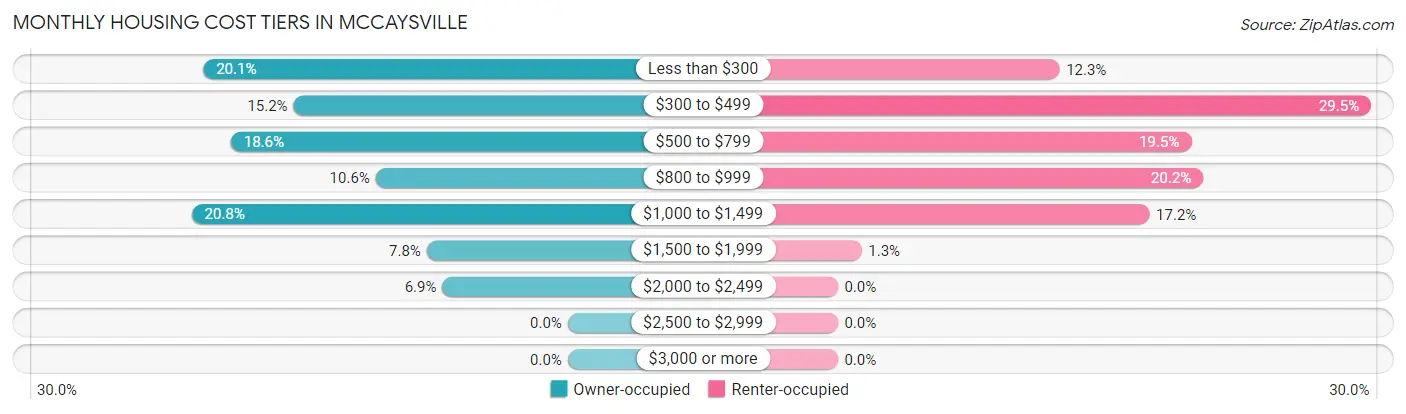
| Monthly Cost | Owner-occupied | Renter-occupied |
| Less than $300 | 93 (20.1%) | 37 (12.2%) |
| $300 to $499 | 70 (15.1%) | 89 (29.5%) |
| $500 to $799 | 86 (18.6%) | 59 (19.5%) |
| $800 to $999 | 49 (10.6%) | 61 (20.2%) |
| $1,000 to $1,499 | 96 (20.8%) | 52 (17.2%) |
| $1,500 to $1,999 | 36 (7.8%) | 4 (1.3%) |
| $2,000 to $2,499 | 32 (6.9%) | 0 (0.0%) |
| $2,500 to $2,999 | 0 (0.0%) | 0 (0.0%) |
| $3,000 or more | 0 (0.0%) | 0 (0.0%) |
| Total | 462 (100.0%) | 302 (100.0%) |
Physical Housing Characteristics in McCaysville
Housing Structures in McCaysville
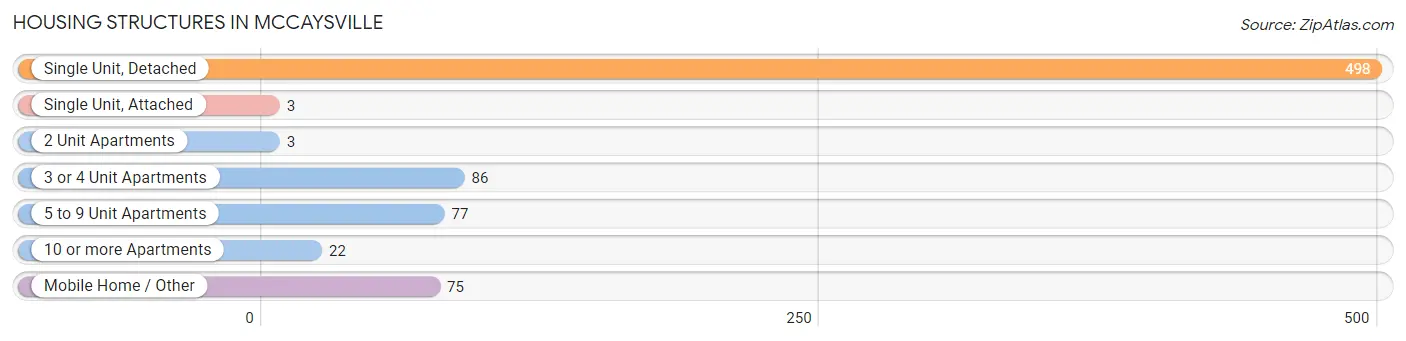
| Structure Type | # Housing Units | % Housing Units |
| Single Unit, Detached | 498 | 65.2% |
| Single Unit, Attached | 3 | 0.4% |
| 2 Unit Apartments | 3 | 0.4% |
| 3 or 4 Unit Apartments | 86 | 11.3% |
| 5 to 9 Unit Apartments | 77 | 10.1% |
| 10 or more Apartments | 22 | 2.9% |
| Mobile Home / Other | 75 | 9.8% |
| Total | 764 | 100.0% |
Housing Structures by Occupancy in McCaysville

| Structure Type | Owner-occupied | Renter-occupied |
| Single Unit, Detached | 416 (83.5%) | 82 (16.5%) |
| Single Unit, Attached | 3 (100.0%) | 0 (0.0%) |
| 2 Unit Apartments | 0 (0.0%) | 3 (100.0%) |
| 3 or 4 Unit Apartments | 8 (9.3%) | 78 (90.7%) |
| 5 to 9 Unit Apartments | 0 (0.0%) | 77 (100.0%) |
| 10 or more Apartments | 0 (0.0%) | 22 (100.0%) |
| Mobile Home / Other | 35 (46.7%) | 40 (53.3%) |
| Total | 462 (60.5%) | 302 (39.5%) |
Housing Structures by Number of Rooms in McCaysville
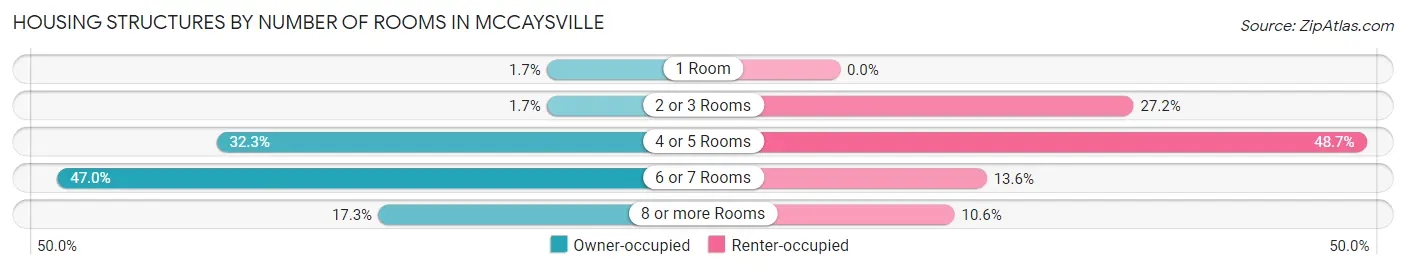
| Number of Rooms | Owner-occupied | Renter-occupied |
| 1 Room | 8 (1.7%) | 0 (0.0%) |
| 2 or 3 Rooms | 8 (1.7%) | 82 (27.2%) |
| 4 or 5 Rooms | 149 (32.3%) | 147 (48.7%) |
| 6 or 7 Rooms | 217 (47.0%) | 41 (13.6%) |
| 8 or more Rooms | 80 (17.3%) | 32 (10.6%) |
| Total | 462 (100.0%) | 302 (100.0%) |
Housing Structure by Heating Type in McCaysville

| Heating Type | Owner-occupied | Renter-occupied |
| Utility Gas | 0 (0.0%) | 4 (1.3%) |
| Bottled, Tank, or LP Gas | 103 (22.3%) | 0 (0.0%) |
| Electricity | 330 (71.4%) | 287 (95.0%) |
| Fuel Oil or Kerosene | 3 (0.6%) | 0 (0.0%) |
| Coal or Coke | 0 (0.0%) | 0 (0.0%) |
| All other Fuels | 26 (5.6%) | 0 (0.0%) |
| No Fuel Used | 0 (0.0%) | 11 (3.6%) |
| Total | 462 (100.0%) | 302 (100.0%) |
Household Vehicle Usage in McCaysville

| Vehicles per Household | Owner-occupied | Renter-occupied |
| No Vehicle | 9 (1.9%) | 35 (11.6%) |
| 1 Vehicle | 171 (37.0%) | 193 (63.9%) |
| 2 Vehicles | 147 (31.8%) | 61 (20.2%) |
| 3 or more Vehicles | 135 (29.2%) | 13 (4.3%) |
| Total | 462 (100.0%) | 302 (100.0%) |
Real Estate & Mortgages in McCaysville
Real Estate and Mortgage Overview in McCaysville
| Characteristic | Without Mortgage | With Mortgage |
| Housing Units | 207 | 255 |
| Median Property Value | - | - |
| Median Household Income | $56,484 | $9 |
| Monthly Housing Costs | $344 | $0 |
| Real Estate Taxes | - | - |
Property Value by Mortgage Status in McCaysville

| Property Value | Without Mortgage | With Mortgage |
| Less than $50,000 | 96 (46.4%) | 17 (6.7%) |
| $50,000 to $99,999 | 22 (10.6%) | 36 (14.1%) |
| $100,000 to $299,999 | 86 (41.5%) | 188 (73.7%) |
| $300,000 to $499,999 | 0 (0.0%) | 14 (5.5%) |
| $500,000 to $749,999 | 3 (1.5%) | 0 (0.0%) |
| $750,000 to $999,999 | 0 (0.0%) | 0 (0.0%) |
| $1,000,000 or more | 0 (0.0%) | 0 (0.0%) |
| Total | 207 (100.0%) | 255 (100.0%) |
Household Income by Mortgage Status in McCaysville
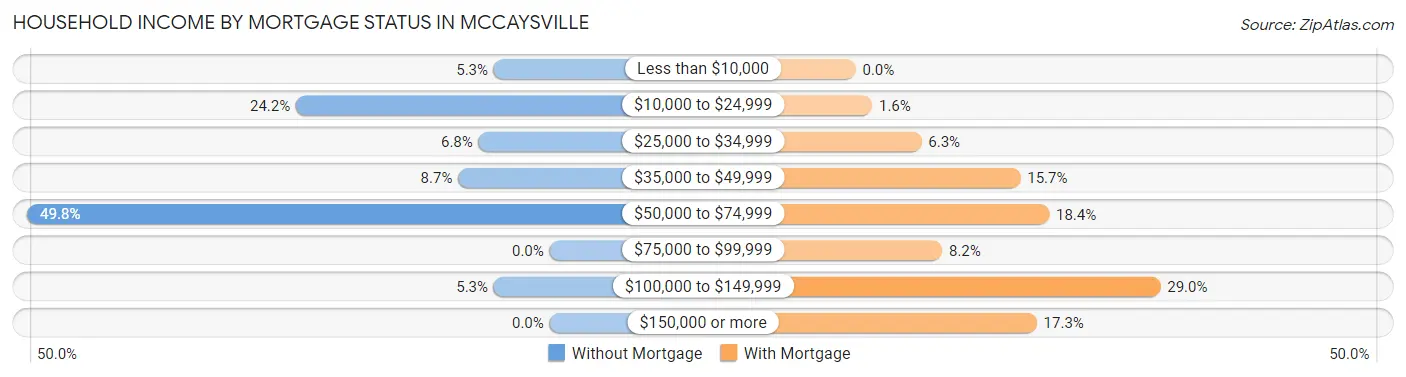
| Household Income | Without Mortgage | With Mortgage |
| Less than $10,000 | 11 (5.3%) | 0 (0.0%) |
| $10,000 to $24,999 | 50 (24.1%) | 4 (1.6%) |
| $25,000 to $34,999 | 14 (6.8%) | 16 (6.3%) |
| $35,000 to $49,999 | 18 (8.7%) | 40 (15.7%) |
| $50,000 to $74,999 | 103 (49.8%) | 47 (18.4%) |
| $75,000 to $99,999 | 0 (0.0%) | 21 (8.2%) |
| $100,000 to $149,999 | 11 (5.3%) | 74 (29.0%) |
| $150,000 or more | 0 (0.0%) | 44 (17.2%) |
| Total | 207 (100.0%) | 255 (100.0%) |
Property Value to Household Income Ratio in McCaysville
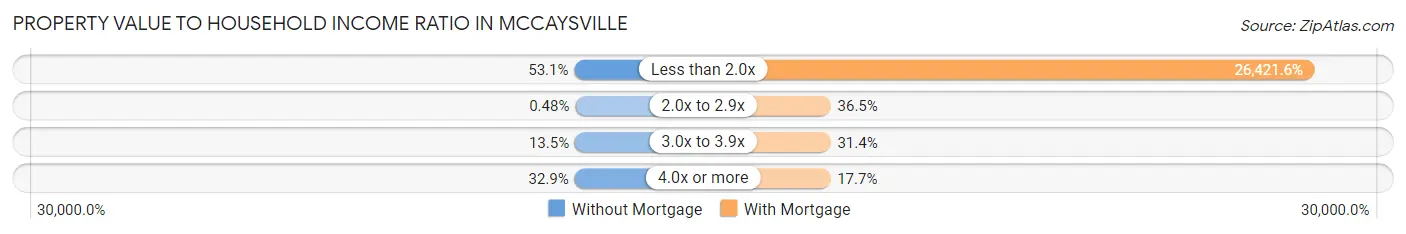
| Value-to-Income Ratio | Without Mortgage | With Mortgage |
| Less than 2.0x | 110 (53.1%) | 67,375 (26,421.6%) |
| 2.0x to 2.9x | 1 (0.5%) | 93 (36.5%) |
| 3.0x to 3.9x | 28 (13.5%) | 80 (31.4%) |
| 4.0x or more | 68 (32.9%) | 45 (17.6%) |
| Total | 207 (100.0%) | 255 (100.0%) |
Real Estate Taxes by Mortgage Status in McCaysville
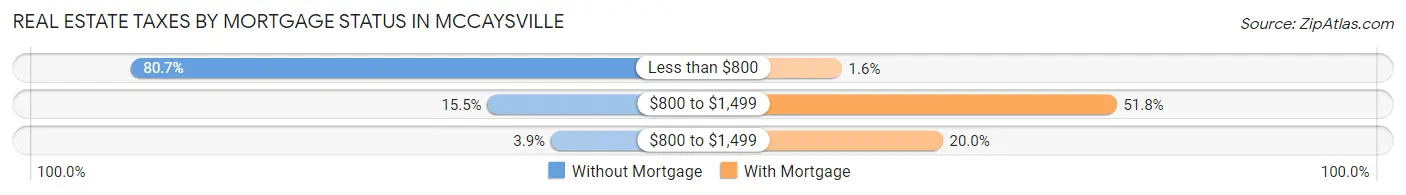
| Property Taxes | Without Mortgage | With Mortgage |
| Less than $800 | 167 (80.7%) | 4 (1.6%) |
| $800 to $1,499 | 32 (15.5%) | 132 (51.8%) |
| $800 to $1,499 | 8 (3.9%) | 51 (20.0%) |
| Total | 207 (100.0%) | 255 (100.0%) |
Health & Disability in McCaysville
Health Insurance Coverage by Age in McCaysville
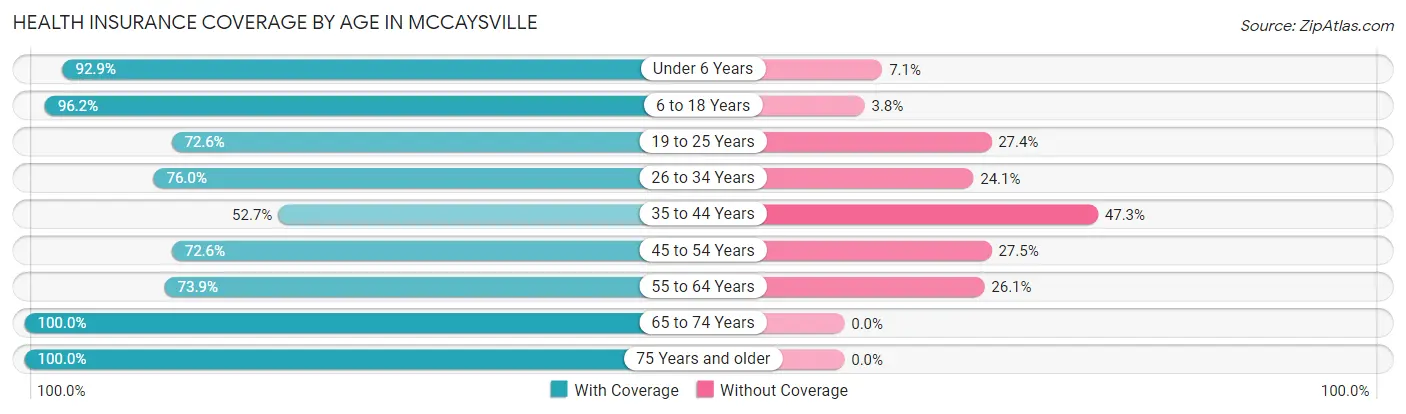
| Age Bracket | With Coverage | Without Coverage |
| Under 6 Years | 105 (92.9%) | 8 (7.1%) |
| 6 to 18 Years | 280 (96.2%) | 11 (3.8%) |
| 19 to 25 Years | 114 (72.6%) | 43 (27.4%) |
| 26 to 34 Years | 120 (75.9%) | 38 (24.0%) |
| 35 to 44 Years | 165 (52.7%) | 148 (47.3%) |
| 45 to 54 Years | 185 (72.6%) | 70 (27.5%) |
| 55 to 64 Years | 99 (73.9%) | 35 (26.1%) |
| 65 to 74 Years | 105 (100.0%) | 0 (0.0%) |
| 75 Years and older | 113 (100.0%) | 0 (0.0%) |
| Total | 1,286 (78.5%) | 353 (21.5%) |
Health Insurance Coverage by Citizenship Status in McCaysville

| Citizenship Status | With Coverage | Without Coverage |
| Native Born | 105 (92.9%) | 8 (7.1%) |
| Foreign Born, Citizen | 280 (96.2%) | 11 (3.8%) |
| Foreign Born, not a Citizen | 114 (72.6%) | 43 (27.4%) |
Health Insurance Coverage by Household Income in McCaysville
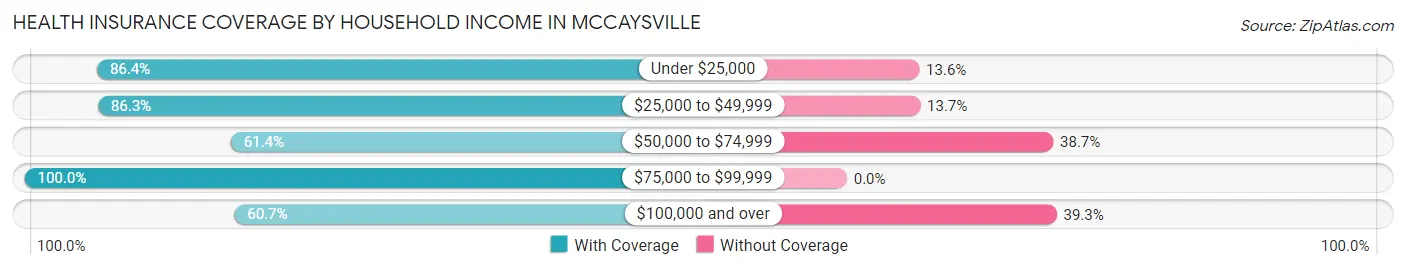
| Household Income | With Coverage | Without Coverage |
| Under $25,000 | 325 (86.4%) | 51 (13.6%) |
| $25,000 to $49,999 | 295 (86.3%) | 47 (13.7%) |
| $50,000 to $74,999 | 227 (61.4%) | 143 (38.7%) |
| $75,000 to $99,999 | 266 (100.0%) | 0 (0.0%) |
| $100,000 and over | 173 (60.7%) | 112 (39.3%) |
Public vs Private Health Insurance Coverage by Age in McCaysville
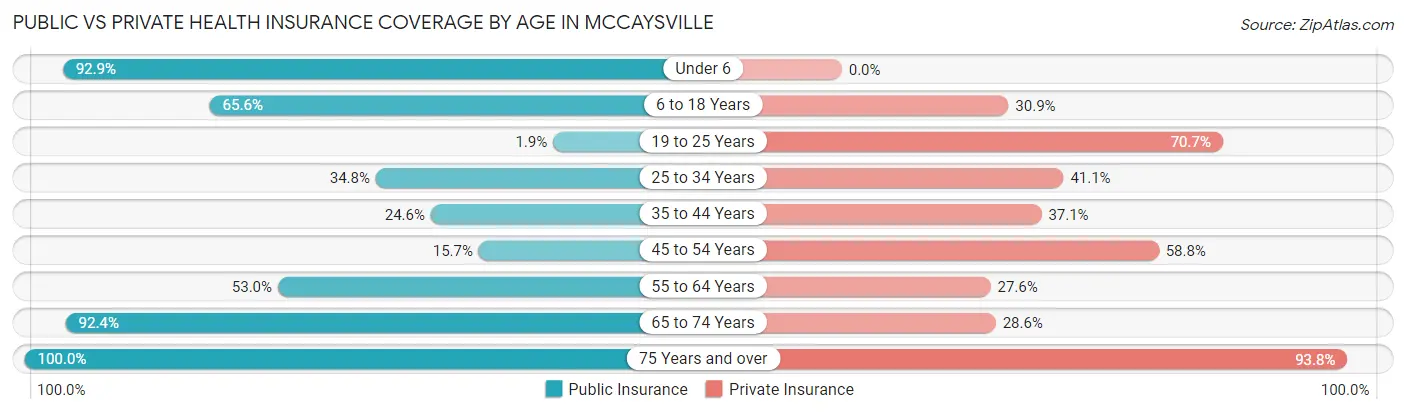
| Age Bracket | Public Insurance | Private Insurance |
| Under 6 | 105 (92.9%) | 0 (0.0%) |
| 6 to 18 Years | 191 (65.6%) | 90 (30.9%) |
| 19 to 25 Years | 3 (1.9%) | 111 (70.7%) |
| 25 to 34 Years | 55 (34.8%) | 65 (41.1%) |
| 35 to 44 Years | 77 (24.6%) | 116 (37.1%) |
| 45 to 54 Years | 40 (15.7%) | 150 (58.8%) |
| 55 to 64 Years | 71 (53.0%) | 37 (27.6%) |
| 65 to 74 Years | 97 (92.4%) | 30 (28.6%) |
| 75 Years and over | 113 (100.0%) | 106 (93.8%) |
| Total | 752 (45.9%) | 705 (43.0%) |
Disability Status by Sex by Age in McCaysville

| Age Bracket | Male | Female |
| Under 5 Years | 15 (31.2%) | 0 (0.0%) |
| 5 to 17 Years | 2 (1.5%) | 15 (11.4%) |
| 18 to 34 Years | 5 (3.2%) | 0 (0.0%) |
| 35 to 64 Years | 83 (21.1%) | 89 (28.8%) |
| 65 to 74 Years | 18 (34.6%) | 28 (52.8%) |
| 75 Years and over | 36 (78.3%) | 46 (68.7%) |
Disability Class by Sex by Age in McCaysville
Disability Class: Hearing Difficulty
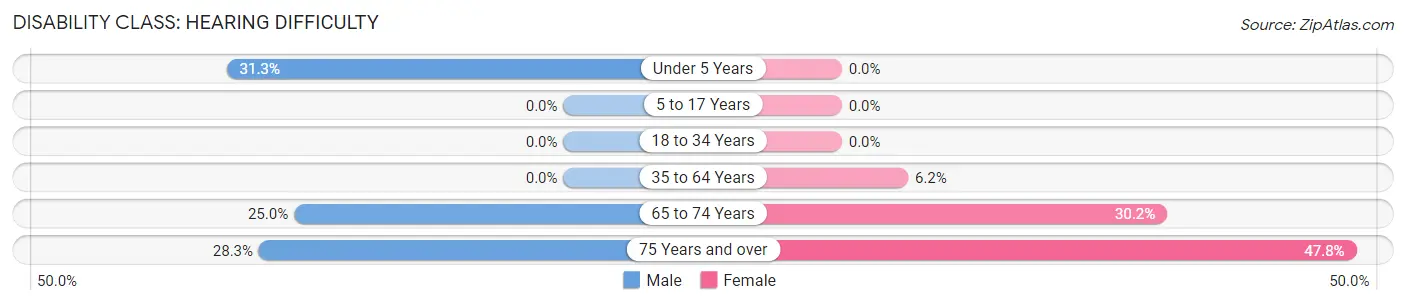
| Age Bracket | Male | Female |
| Under 5 Years | 15 (31.2%) | 0 (0.0%) |
| 5 to 17 Years | 0 (0.0%) | 0 (0.0%) |
| 18 to 34 Years | 0 (0.0%) | 0 (0.0%) |
| 35 to 64 Years | 0 (0.0%) | 19 (6.1%) |
| 65 to 74 Years | 13 (25.0%) | 16 (30.2%) |
| 75 Years and over | 13 (28.3%) | 32 (47.8%) |
Disability Class: Vision Difficulty

| Age Bracket | Male | Female |
| Under 5 Years | 0 (0.0%) | 0 (0.0%) |
| 5 to 17 Years | 0 (0.0%) | 10 (7.6%) |
| 18 to 34 Years | 0 (0.0%) | 0 (0.0%) |
| 35 to 64 Years | 9 (2.3%) | 14 (4.5%) |
| 65 to 74 Years | 0 (0.0%) | 4 (7.5%) |
| 75 Years and over | 3 (6.5%) | 10 (14.9%) |
Disability Class: Cognitive Difficulty
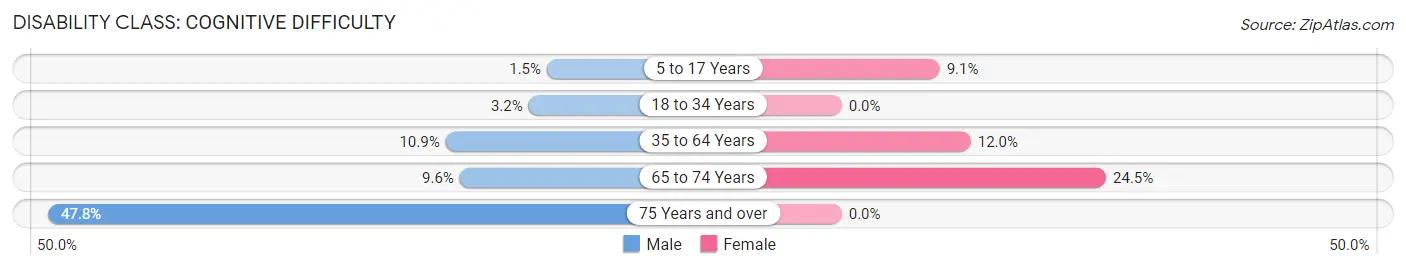
| Age Bracket | Male | Female |
| 5 to 17 Years | 2 (1.5%) | 12 (9.1%) |
| 18 to 34 Years | 5 (3.2%) | 0 (0.0%) |
| 35 to 64 Years | 43 (10.9%) | 37 (12.0%) |
| 65 to 74 Years | 5 (9.6%) | 13 (24.5%) |
| 75 Years and over | 22 (47.8%) | 0 (0.0%) |
Disability Class: Ambulatory Difficulty
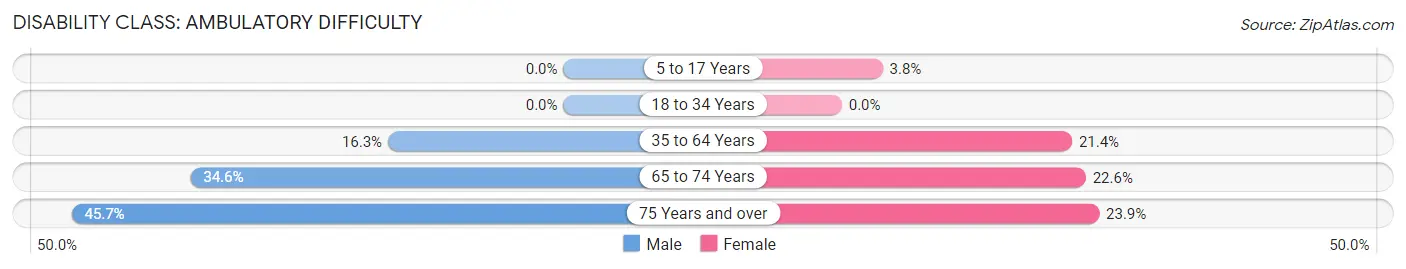
| Age Bracket | Male | Female |
| 5 to 17 Years | 0 (0.0%) | 5 (3.8%) |
| 18 to 34 Years | 0 (0.0%) | 0 (0.0%) |
| 35 to 64 Years | 64 (16.3%) | 66 (21.4%) |
| 65 to 74 Years | 18 (34.6%) | 12 (22.6%) |
| 75 Years and over | 21 (45.7%) | 16 (23.9%) |
Disability Class: Self-Care Difficulty
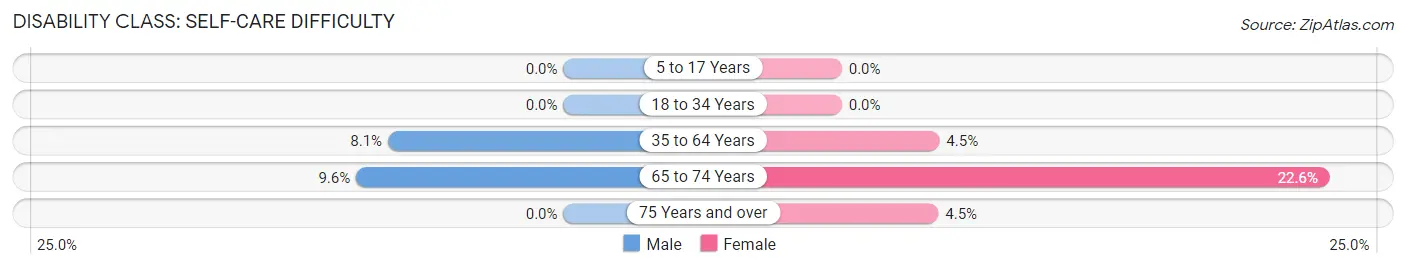
| Age Bracket | Male | Female |
| 5 to 17 Years | 0 (0.0%) | 0 (0.0%) |
| 18 to 34 Years | 0 (0.0%) | 0 (0.0%) |
| 35 to 64 Years | 32 (8.1%) | 14 (4.5%) |
| 65 to 74 Years | 5 (9.6%) | 12 (22.6%) |
| 75 Years and over | 0 (0.0%) | 3 (4.5%) |
Technology Access in McCaysville
Computing Device Access in McCaysville
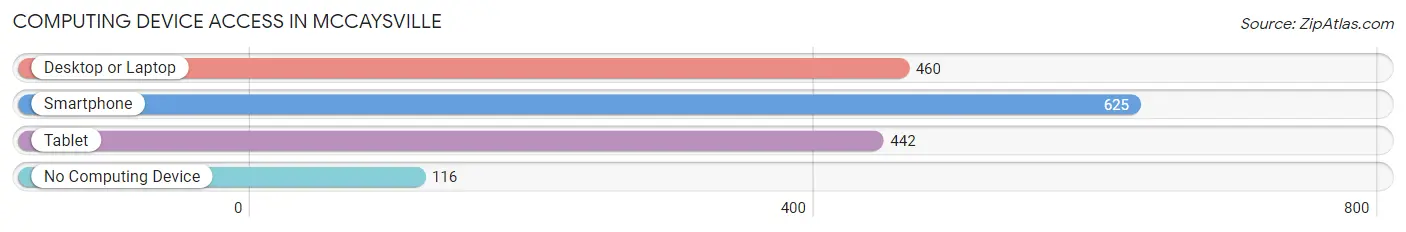
| Device Type | # Households | % Households |
| Desktop or Laptop | 460 | 60.2% |
| Smartphone | 625 | 81.8% |
| Tablet | 442 | 57.9% |
| No Computing Device | 116 | 15.2% |
| Total | 764 | 100.0% |
Internet Access in McCaysville

| Internet Type | # Households | % Households |
| Dial-Up Internet | 0 | 0.0% |
| Broadband Home | 448 | 58.6% |
| Cellular Data Only | 74 | 9.7% |
| Satellite Internet | 160 | 20.9% |
| No Internet | 172 | 22.5% |
| Total | 764 | 100.0% |
McCaysville Summary
Mccaysville is a small town located in the Chattahoochee National Forest in Fannin County, Georgia. It is situated on the Georgia-Tennessee state line, with the Tennessee side of the town being known as Copperhill. The town is located in the Appalachian Mountains and is known for its scenic beauty and outdoor activities.
History
Mccaysville was founded in 1834 by William Mccay, a Scottish immigrant who had settled in the area. The town was originally known as Mccayville, but the name was changed to Mccaysville in 1887. The town was incorporated in 1891 and has remained a small, rural community ever since.
The town was an important stop on the Marietta and North Georgia Railroad, which ran from Marietta to Copperhill, Tennessee. The railroad was an important part of the town’s economy, as it allowed for the transportation of goods and people between the two towns. The railroad was eventually abandoned in the 1950s, but the town still retains its historic charm.
Geography
Mccaysville is located in the Appalachian Mountains in Fannin County, Georgia. The town is situated on the Georgia-Tennessee state line, with the Tennessee side of the town being known as Copperhill. The town is located at the confluence of the Toccoa River and the Ocoee River, and is surrounded by the Chattahoochee National Forest. The town is located at an elevation of 1,400 feet and has a total area of 1.2 square miles.
Economy
Mccaysville’s economy is largely based on tourism and outdoor recreation. The town is a popular destination for fishing, camping, hiking, and other outdoor activities. The town is also home to several antique stores, gift shops, and restaurants. The town is also home to several manufacturing companies, including a furniture factory and a paper mill.
Demographics
As of the 2010 census, Mccaysville had a population of 1,092. The racial makeup of the town was 95.3% White, 0.7% African American, 0.3% Native American, 0.2% Asian, 0.1% Pacific Islander, and 3.4% from other races. The median household income was $30,938, and the median family income was $37,500. The per capita income was $17,845.
Mccaysville is a small, rural town with a rich history and a strong sense of community. The town is known for its scenic beauty and outdoor activities, and is a popular destination for tourists and outdoor enthusiasts. The town’s economy is largely based on tourism and outdoor recreation, and the town is home to several manufacturing companies. The town has a diverse population and a median household income that is slightly below the national average.
Common Questions
What is Per Capita Income in McCaysville?
Per Capita income in McCaysville is $24,692.
What is the Median Family Income in McCaysville?
Median Family Income in McCaysville is $53,906.
What is the Median Household income in McCaysville?
Median Household Income in McCaysville is $43,553.
What is Income or Wage Gap in McCaysville?
Income or Wage Gap in McCaysville is 5.8%.
Women in McCaysville earn 94.2 cents for every dollar earned by a man.
What is Inequality or Gini Index in McCaysville?
Inequality or Gini Index in McCaysville is 0.42.
What is the Total Population of McCaysville?
Total Population of McCaysville is 1,639.
What is the Total Male Population of McCaysville?
Total Male Population of McCaysville is 825.
What is the Total Female Population of McCaysville?
Total Female Population of McCaysville is 814.
What is the Ratio of Males per 100 Females in McCaysville?
There are 101.35 Males per 100 Females in McCaysville.
What is the Ratio of Females per 100 Males in McCaysville?
There are 98.67 Females per 100 Males in McCaysville.
What is the Median Population Age in McCaysville?
Median Population Age in McCaysville is 37.7 Years.
What is the Average Family Size in McCaysville
Average Family Size in McCaysville is 2.9 People.
What is the Average Household Size in McCaysville
Average Household Size in McCaysville is 2.1 People.
How Large is the Labor Force in McCaysville?
There are 788 People in the Labor Forcein in McCaysville.
What is the Percentage of People in the Labor Force in McCaysville?
59.1% of People are in the Labor Force in McCaysville.
What is the Unemployment Rate in McCaysville?
Unemployment Rate in McCaysville is 0.4%.