Zip Codes with the Highest Percentage of Population Employed in Security & Protection in Alabama
RELATED REPORTS & OPTIONS
Security & Protection
Alabama
Compare Zip Codes
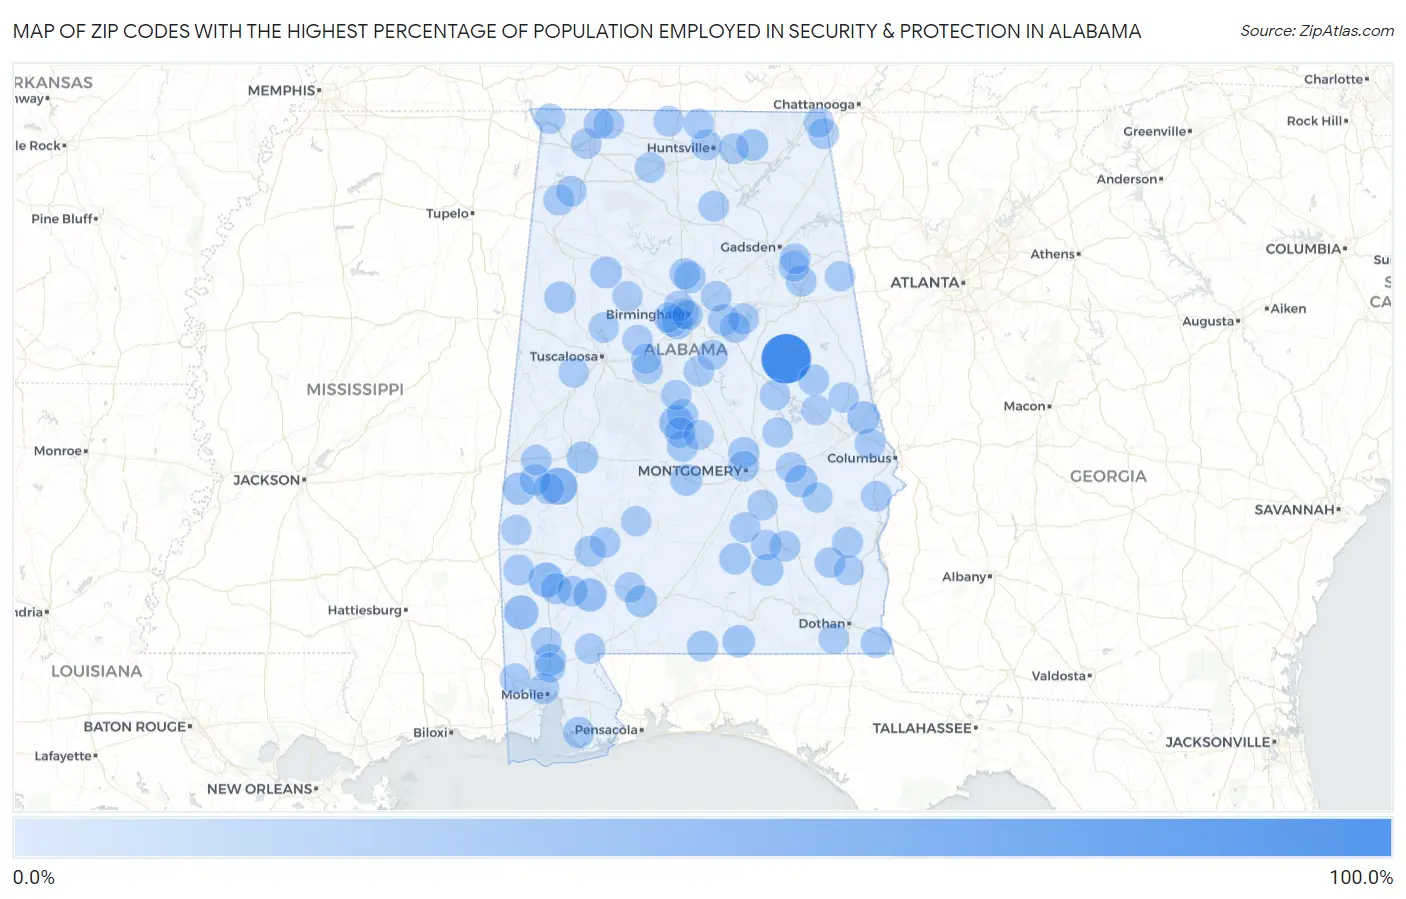
Map of Zip Codes with the Highest Percentage of Population Employed in Security & Protection in Alabama
0.0%
100.0%
Zip Codes with the Highest Percentage of Population Employed in Security & Protection in Alabama
| Zip Code | % Employed | vs State | vs National | |
| 1. | 36267 | 100.0% | 2.3%(+97.7)#1 | 2.1%(+97.9)#4 |
| 2. | 36763 | 37.1% | 2.3%(+34.8)#2 | 2.1%(+34.9)#60 |
| 3. | 36569 | 26.5% | 2.3%(+24.2)#3 | 2.1%(+24.4)#118 |
| 4. | 36529 | 23.5% | 2.3%(+21.2)#4 | 2.1%(+21.3)#143 |
| 5. | 36790 | 21.6% | 2.3%(+19.3)#5 | 2.1%(+19.4)#176 |
| 6. | 36540 | 19.1% | 2.3%(+16.8)#6 | 2.1%(+17.0)#222 |
| 7. | 36852 | 14.7% | 2.3%(+12.5)#7 | 2.1%(+12.6)#375 |
| 8. | 36912 | 14.5% | 2.3%(+12.2)#8 | 2.1%(+12.3)#391 |
| 9. | 36442 | 14.1% | 2.3%(+11.8)#9 | 2.1%(+12.0)#411 |
| 10. | 36039 | 12.8% | 2.3%(+10.5)#10 | 2.1%(+10.6)#490 |
| 11. | 36505 | 12.2% | 2.3%(+9.97)#11 | 2.1%(+10.1)#530 |
| 12. | 36034 | 12.2% | 2.3%(+9.93)#12 | 2.1%(+10.1)#532 |
| 13. | 36742 | 11.3% | 2.3%(+9.01)#13 | 2.1%(+9.13)#619 |
| 14. | 36475 | 11.1% | 2.3%(+8.86)#14 | 2.1%(+8.98)#633 |
| 15. | 35774 | 10.9% | 2.3%(+8.60)#15 | 2.1%(+8.72)#658 |
| 16. | 35549 | 10.7% | 2.3%(+8.45)#16 | 2.1%(+8.57)#675 |
| 17. | 35091 | 10.6% | 2.3%(+8.31)#17 | 2.1%(+8.43)#695 |
| 18. | 36071 | 10.5% | 2.3%(+8.19)#18 | 2.1%(+8.31)#714 |
| 19. | 35545 | 10.4% | 2.3%(+8.15)#19 | 2.1%(+8.27)#722 |
| 20. | 36785 | 10.2% | 2.3%(+7.97)#20 | 2.1%(+8.09)#740 |
| 21. | 35176 | 9.5% | 2.3%(+7.19)#21 | 2.1%(+7.31)#847 |
| 22. | 36555 | 8.3% | 2.3%(+6.05)#22 | 2.1%(+6.17)#1,069 |
| 23. | 36922 | 8.2% | 2.3%(+5.96)#23 | 2.1%(+6.08)#1,090 |
| 24. | 36483 | 8.1% | 2.3%(+5.86)#24 | 2.1%(+5.98)#1,120 |
| 25. | 36548 | 8.1% | 2.3%(+5.83)#25 | 2.1%(+5.95)#1,130 |
| 26. | 36020 | 8.0% | 2.3%(+5.74)#26 | 2.1%(+5.86)#1,167 |
| 27. | 36750 | 7.9% | 2.3%(+5.61)#27 | 2.1%(+5.73)#1,207 |
| 28. | 36749 | 7.6% | 2.3%(+5.38)#28 | 2.1%(+5.50)#1,277 |
| 29. | 36256 | 7.4% | 2.3%(+5.14)#29 | 2.1%(+5.26)#1,360 |
| 30. | 36436 | 7.3% | 2.3%(+4.99)#30 | 2.1%(+5.11)#1,420 |
| 31. | 36343 | 7.2% | 2.3%(+4.90)#31 | 2.1%(+5.03)#1,456 |
| 32. | 35180 | 7.0% | 2.3%(+4.77)#32 | 2.1%(+4.90)#1,513 |
| 33. | 36104 | 7.0% | 2.3%(+4.77)#33 | 2.1%(+4.89)#1,517 |
| 34. | 36758 | 6.9% | 2.3%(+4.66)#34 | 2.1%(+4.78)#1,563 |
| 35. | 35061 | 6.9% | 2.3%(+4.63)#35 | 2.1%(+4.75)#1,577 |
| 36. | 36016 | 6.8% | 2.3%(+4.55)#36 | 2.1%(+4.67)#1,624 |
| 37. | 35087 | 6.7% | 2.3%(+4.47)#37 | 2.1%(+4.59)#1,662 |
| 38. | 36082 | 6.7% | 2.3%(+4.45)#38 | 2.1%(+4.57)#1,676 |
| 39. | 35571 | 6.6% | 2.3%(+4.32)#39 | 2.1%(+4.44)#1,738 |
| 40. | 35896 | 6.6% | 2.3%(+4.30)#40 | 2.1%(+4.42)#1,755 |
| 41. | 36916 | 6.4% | 2.3%(+4.12)#41 | 2.1%(+4.24)#1,833 |
| 42. | 36558 | 6.4% | 2.3%(+4.11)#42 | 2.1%(+4.23)#1,836 |
| 43. | 36610 | 6.4% | 2.3%(+4.10)#43 | 2.1%(+4.22)#1,848 |
| 44. | 36277 | 6.3% | 2.3%(+4.05)#44 | 2.1%(+4.17)#1,890 |
| 45. | 36279 | 6.2% | 2.3%(+3.96)#45 | 2.1%(+4.08)#1,934 |
| 46. | 35221 | 6.2% | 2.3%(+3.93)#46 | 2.1%(+4.05)#1,953 |
| 47. | 36545 | 6.1% | 2.3%(+3.84)#47 | 2.1%(+3.96)#2,006 |
| 48. | 35585 | 6.0% | 2.3%(+3.78)#48 | 2.1%(+3.90)#2,046 |
| 49. | 36035 | 6.0% | 2.3%(+3.77)#49 | 2.1%(+3.90)#2,047 |
| 50. | 35054 | 6.0% | 2.3%(+3.73)#50 | 2.1%(+3.85)#2,083 |
| 51. | 35178 | 5.9% | 2.3%(+3.67)#51 | 2.1%(+3.79)#2,121 |
| 52. | 36871 | 5.9% | 2.3%(+3.65)#52 | 2.1%(+3.77)#2,134 |
| 53. | 35620 | 5.9% | 2.3%(+3.64)#53 | 2.1%(+3.76)#2,141 |
| 54. | 35040 | 5.9% | 2.3%(+3.63)#54 | 2.1%(+3.75)#2,144 |
| 55. | 36874 | 5.9% | 2.3%(+3.61)#55 | 2.1%(+3.73)#2,163 |
| 56. | 35089 | 5.8% | 2.3%(+3.56)#56 | 2.1%(+3.68)#2,188 |
| 57. | 35905 | 5.8% | 2.3%(+3.49)#57 | 2.1%(+3.61)#2,245 |
| 58. | 36041 | 5.7% | 2.3%(+3.44)#58 | 2.1%(+3.56)#2,284 |
| 59. | 35979 | 5.6% | 2.3%(+3.31)#59 | 2.1%(+3.43)#2,391 |
| 60. | 35645 | 5.5% | 2.3%(+3.22)#60 | 2.1%(+3.34)#2,464 |
| 61. | 35173 | 5.4% | 2.3%(+3.17)#61 | 2.1%(+3.29)#2,496 |
| 62. | 36587 | 5.4% | 2.3%(+3.12)#62 | 2.1%(+3.24)#2,551 |
| 63. | 36075 | 5.3% | 2.3%(+3.00)#63 | 2.1%(+3.13)#2,652 |
| 64. | 36017 | 5.3% | 2.3%(+2.99)#64 | 2.1%(+3.11)#2,661 |
| 65. | 35204 | 5.2% | 2.3%(+2.92)#65 | 2.1%(+3.04)#2,721 |
| 66. | 36792 | 5.2% | 2.3%(+2.90)#66 | 2.1%(+3.02)#2,744 |
| 67. | 36925 | 5.2% | 2.3%(+2.89)#67 | 2.1%(+3.01)#2,754 |
| 68. | 36751 | 5.2% | 2.3%(+2.89)#68 | 2.1%(+3.01)#2,756 |
| 69. | 35748 | 5.0% | 2.3%(+2.75)#69 | 2.1%(+2.87)#2,901 |
| 70. | 36069 | 4.9% | 2.3%(+2.67)#70 | 2.1%(+2.79)#2,994 |
| 71. | 35660 | 4.9% | 2.3%(+2.67)#71 | 2.1%(+2.79)#3,003 |
| 72. | 35051 | 4.9% | 2.3%(+2.66)#72 | 2.1%(+2.79)#3,004 |
| 73. | 35214 | 4.8% | 2.3%(+2.49)#73 | 2.1%(+2.61)#3,231 |
| 74. | 36317 | 4.7% | 2.3%(+2.46)#74 | 2.1%(+2.58)#3,256 |
| 75. | 36460 | 4.7% | 2.3%(+2.39)#75 | 2.1%(+2.51)#3,355 |
| 76. | 35634 | 4.7% | 2.3%(+2.39)#76 | 2.1%(+2.51)#3,359 |
| 77. | 35958 | 4.6% | 2.3%(+2.35)#77 | 2.1%(+2.47)#3,407 |
| 78. | 35677 | 4.6% | 2.3%(+2.32)#78 | 2.1%(+2.44)#3,459 |
| 79. | 35184 | 4.6% | 2.3%(+2.30)#79 | 2.1%(+2.42)#3,492 |
| 80. | 36089 | 4.5% | 2.3%(+2.27)#80 | 2.1%(+2.39)#3,547 |
| 81. | 35127 | 4.5% | 2.3%(+2.27)#81 | 2.1%(+2.39)#3,549 |
| 82. | 36908 | 4.5% | 2.3%(+2.19)#82 | 2.1%(+2.31)#3,667 |
| 83. | 36375 | 4.5% | 2.3%(+2.19)#83 | 2.1%(+2.31)#3,682 |
| 84. | 35673 | 4.5% | 2.3%(+2.18)#84 | 2.1%(+2.30)#3,686 |
| 85. | 36560 | 4.4% | 2.3%(+2.13)#85 | 2.1%(+2.25)#3,787 |
| 86. | 35444 | 4.4% | 2.3%(+2.12)#86 | 2.1%(+2.24)#3,793 |
| 87. | 36562 | 4.4% | 2.3%(+2.12)#87 | 2.1%(+2.24)#3,794 |
| 88. | 35579 | 4.3% | 2.3%(+2.07)#88 | 2.1%(+2.20)#3,873 |
| 89. | 36006 | 4.3% | 2.3%(+2.07)#89 | 2.1%(+2.19)#3,884 |
| 90. | 35203 | 4.3% | 2.3%(+2.05)#90 | 2.1%(+2.17)#3,918 |
| 91. | 36850 | 4.3% | 2.3%(+2.03)#91 | 2.1%(+2.15)#3,958 |
| 92. | 35475 | 4.3% | 2.3%(+2.00)#92 | 2.1%(+2.12)#3,990 |
| 93. | 35480 | 4.2% | 2.3%(+1.97)#93 | 2.1%(+2.09)#4,048 |
| 94. | 35773 | 4.2% | 2.3%(+1.97)#94 | 2.1%(+2.09)#4,055 |
| 95. | 36726 | 4.2% | 2.3%(+1.92)#95 | 2.1%(+2.04)#4,137 |
| 96. | 36525 | 4.2% | 2.3%(+1.92)#96 | 2.1%(+2.04)#4,143 |
| 97. | 35188 | 4.2% | 2.3%(+1.92)#97 | 2.1%(+2.04)#4,146 |
| 98. | 36862 | 4.1% | 2.3%(+1.87)#98 | 2.1%(+1.99)#4,234 |
| 99. | 36262 | 4.1% | 2.3%(+1.87)#99 | 2.1%(+1.99)#4,236 |
| 100. | 36024 | 4.1% | 2.3%(+1.86)#100 | 2.1%(+1.98)#4,247 |
Common Questions
What are the Top 10 Zip Codes with the Highest Percentage of Population Employed in Security & Protection in Alabama?
Top 10 Zip Codes with the Highest Percentage of Population Employed in Security & Protection in Alabama are:
What zip code has the Highest Percentage of Population Employed in Security & Protection in Alabama?
36267 has the Highest Percentage of Population Employed in Security & Protection in Alabama with 100.0%.
What is the Percentage of Population Employed in Security & Protection in the State of Alabama?
Percentage of Population Employed in Security & Protection in Alabama is 2.3%.
What is the Percentage of Population Employed in Security & Protection in the United States?
Percentage of Population Employed in Security & Protection in the United States is 2.1%.