Montevallo, AL Map & Demographics
Montevallo Map
Montevallo Overview
$23,734
PER CAPITA INCOME
$83,141
AVG FAMILY INCOME
$56,500
AVG HOUSEHOLD INCOME
71.0%
WAGE / INCOME GAP [ % ]
29.0¢/ $1
WAGE / INCOME GAP [ $ ]
0.42
INEQUALITY / GINI INDEX
7,288
TOTAL POPULATION
3,096
MALE POPULATION
4,192
FEMALE POPULATION
73.85
MALES / 100 FEMALES
135.40
FEMALES / 100 MALES
25.1
MEDIAN AGE
3.1
AVG FAMILY SIZE
2.4
AVG HOUSEHOLD SIZE
3,801
LABOR FORCE [ PEOPLE ]
59.8%
PERCENT IN LABOR FORCE
11.5%
UNEMPLOYMENT RATE
Montevallo Zip Codes
Montevallo Area Codes
Income in Montevallo
Income Overview in Montevallo
Per Capita Income in Montevallo is $23,734, while median incomes of families and households are $83,141 and $56,500 respectively.
| Characteristic | Number | Measure |
| Per Capita Income | 7,288 | $23,734 |
| Median Family Income | 1,312 | $83,141 |
| Mean Family Income | 1,312 | $85,053 |
| Median Household Income | 2,336 | $56,500 |
| Mean Household Income | 2,336 | $68,032 |
| Income Deficit | 1,312 | $0 |
| Wage / Income Gap (%) | 7,288 | 71.04% |
| Wage / Income Gap ($) | 7,288 | 28.96¢ per $1 |
| Gini / Inequality Index | 7,288 | 0.42 |
Earnings by Sex in Montevallo
Average Earnings in Montevallo are $24,333, $39,437 for men and $11,419 for women, a difference of 71.0%.
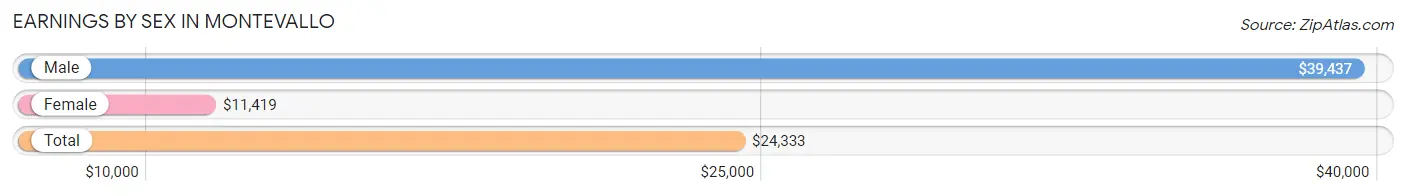
| Sex | Number | Average Earnings |
| Male | 1,779 (42.9%) | $39,437 |
| Female | 2,371 (57.1%) | $11,419 |
| Total | 4,150 (100.0%) | $24,333 |
Earnings by Sex by Income Bracket in Montevallo
The most common earnings brackets in Montevallo are $35,000 to $39,999 for men (202 | 11.4%) and $2,499 or less for women (417 | 17.6%).
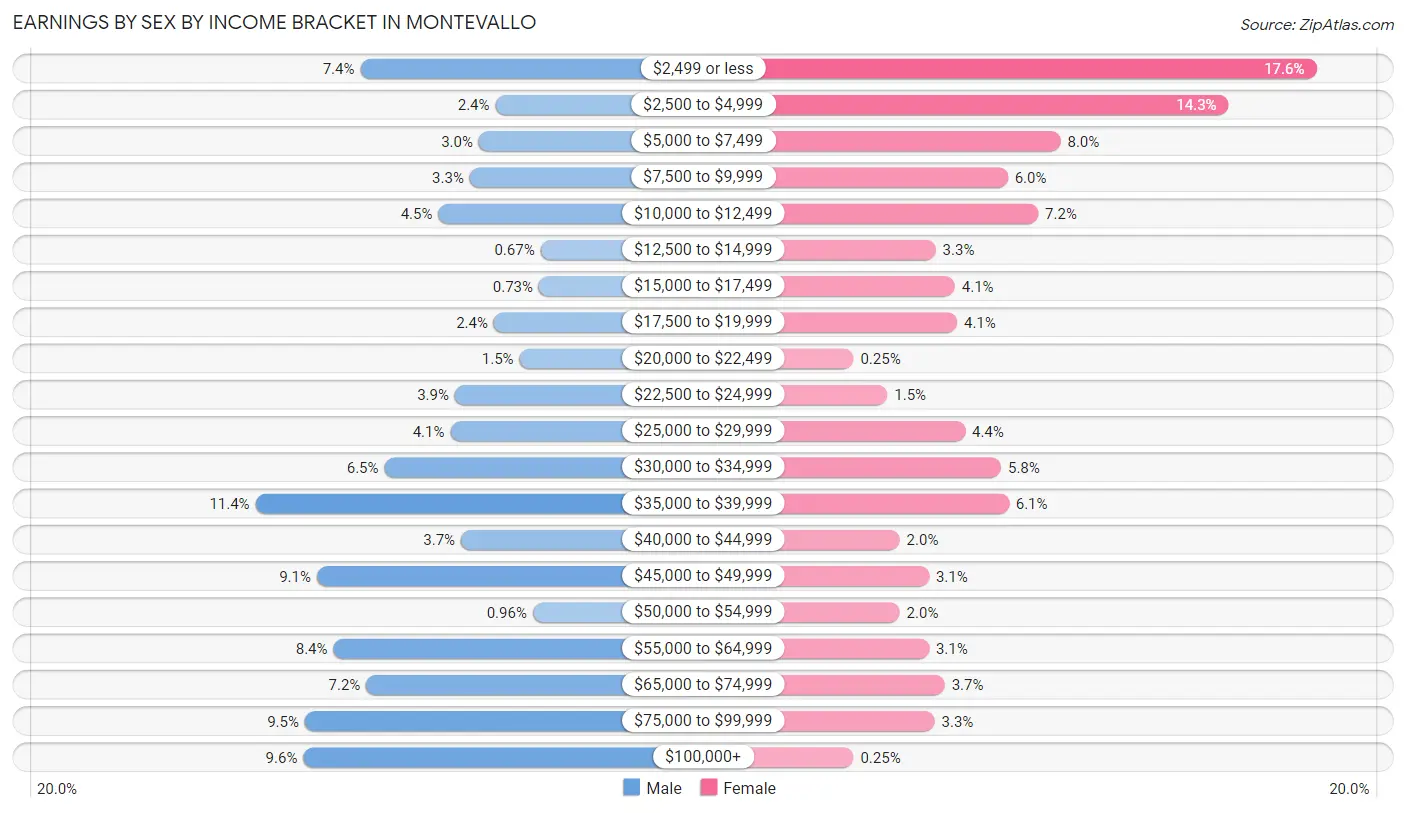
| Income | Male | Female |
| $2,499 or less | 132 (7.4%) | 417 (17.6%) |
| $2,500 to $4,999 | 42 (2.4%) | 339 (14.3%) |
| $5,000 to $7,499 | 53 (3.0%) | 190 (8.0%) |
| $7,500 to $9,999 | 59 (3.3%) | 143 (6.0%) |
| $10,000 to $12,499 | 80 (4.5%) | 170 (7.2%) |
| $12,500 to $14,999 | 12 (0.7%) | 79 (3.3%) |
| $15,000 to $17,499 | 13 (0.7%) | 96 (4.1%) |
| $17,500 to $19,999 | 43 (2.4%) | 98 (4.1%) |
| $20,000 to $22,499 | 26 (1.5%) | 6 (0.3%) |
| $22,500 to $24,999 | 69 (3.9%) | 36 (1.5%) |
| $25,000 to $29,999 | 72 (4.1%) | 105 (4.4%) |
| $30,000 to $34,999 | 116 (6.5%) | 137 (5.8%) |
| $35,000 to $39,999 | 202 (11.4%) | 144 (6.1%) |
| $40,000 to $44,999 | 65 (3.6%) | 47 (2.0%) |
| $45,000 to $49,999 | 161 (9.0%) | 73 (3.1%) |
| $50,000 to $54,999 | 17 (1.0%) | 47 (2.0%) |
| $55,000 to $64,999 | 150 (8.4%) | 73 (3.1%) |
| $65,000 to $74,999 | 128 (7.2%) | 87 (3.7%) |
| $75,000 to $99,999 | 169 (9.5%) | 78 (3.3%) |
| $100,000+ | 170 (9.6%) | 6 (0.3%) |
| Total | 1,779 (100.0%) | 2,371 (100.0%) |
Earnings by Sex by Educational Attainment in Montevallo
Average earnings in Montevallo are $47,368 for men and $36,302 for women, a difference of 23.4%. Men with an educational attainment of graduate degree enjoy the highest average annual earnings of $84,605, while those with college or associate's degree education earn the least with $46,159. Women with an educational attainment of graduate degree earn the most with the average annual earnings of $59,833, while those with high school diploma education have the smallest earnings of $19,250.
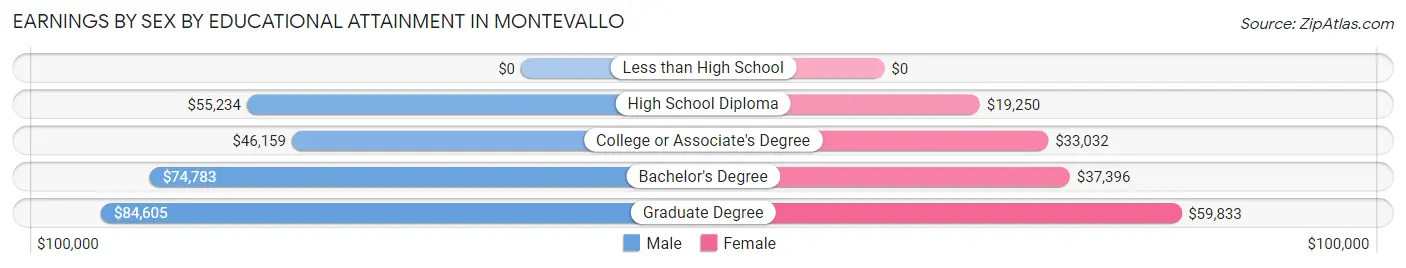
| Educational Attainment | Male Income | Female Income |
| Less than High School | - | - |
| High School Diploma | $55,234 | $19,250 |
| College or Associate's Degree | $46,159 | $33,032 |
| Bachelor's Degree | $74,783 | $37,396 |
| Graduate Degree | $84,605 | $59,833 |
| Total | $47,368 | $36,302 |
Family Income in Montevallo
Family Income Brackets in Montevallo
According to the Montevallo family income data, there are 319 families falling into the $100,000 to $149,999 income range, which is the most common income bracket and makes up 24.3% of all families. Conversely, the less than $10,000 income bracket is the least frequent group with only 9 families (0.7%) belonging to this category.
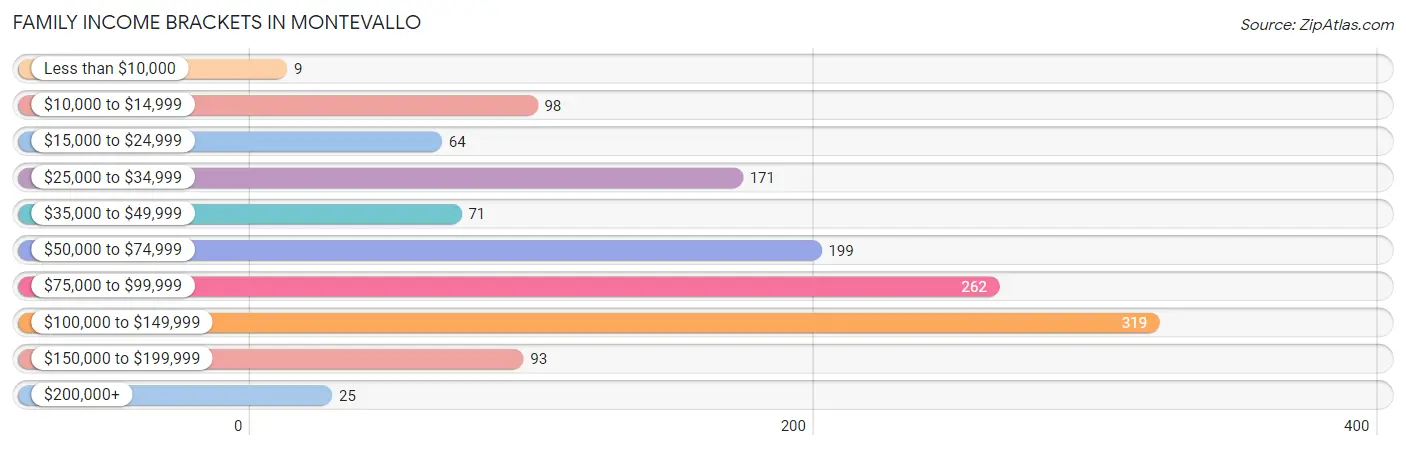
| Income Bracket | # Families | % Families |
| Less than $10,000 | 9 | 0.7% |
| $10,000 to $14,999 | 98 | 7.5% |
| $15,000 to $24,999 | 64 | 4.9% |
| $25,000 to $34,999 | 171 | 13.0% |
| $35,000 to $49,999 | 71 | 5.4% |
| $50,000 to $74,999 | 199 | 15.2% |
| $75,000 to $99,999 | 262 | 20.0% |
| $100,000 to $149,999 | 319 | 24.3% |
| $150,000 to $199,999 | 93 | 7.1% |
| $200,000+ | 25 | 1.9% |
Family Income by Famaliy Size in Montevallo
4-person families (475 | 36.2%) account for the highest median family income in Montevallo with $96,383 per family, while 3-person families (197 | 15.0%) have the highest median income of $30,997 per family member.
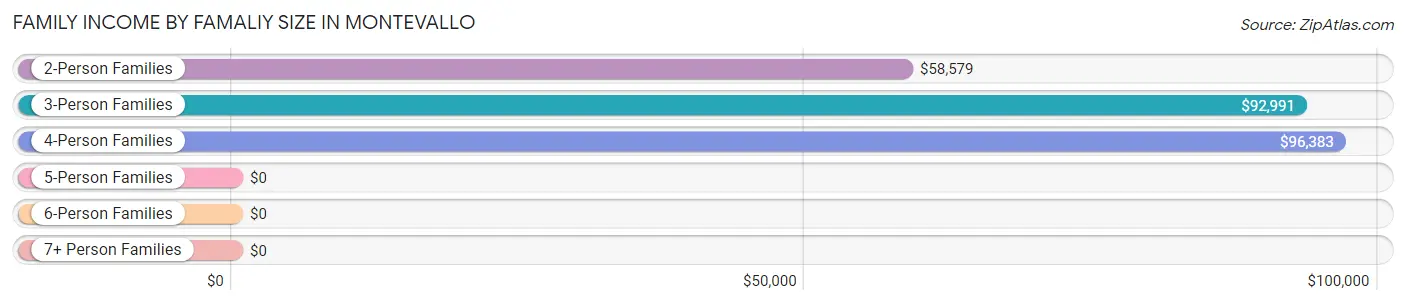
| Income Bracket | # Families | Median Income |
| 2-Person Families | 591 (45.1%) | $58,579 |
| 3-Person Families | 197 (15.0%) | $92,991 |
| 4-Person Families | 475 (36.2%) | $96,383 |
| 5-Person Families | 34 (2.6%) | $0 |
| 6-Person Families | 5 (0.4%) | $0 |
| 7+ Person Families | 10 (0.8%) | $0 |
| Total | 1,312 (100.0%) | $83,141 |
Family Income by Number of Earners in Montevallo
The median family income in Montevallo is $83,141, with families comprising 3+ earners (143) having the highest median family income of $120,547, while families with no earners (255) have the lowest median family income of $26,856, accounting for 10.9% and 19.4% of families, respectively.
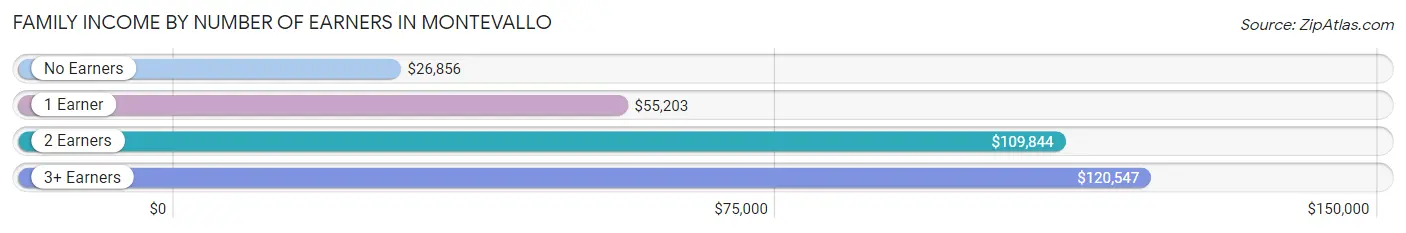
| Number of Earners | # Families | Median Income |
| No Earners | 255 (19.4%) | $26,856 |
| 1 Earner | 451 (34.4%) | $55,203 |
| 2 Earners | 463 (35.3%) | $109,844 |
| 3+ Earners | 143 (10.9%) | $120,547 |
| Total | 1,312 (100.0%) | $83,141 |
Household Income in Montevallo
Household Income Brackets in Montevallo
With 423 households falling in the category, the $25,000 to $34,999 income range is the most frequent in Montevallo, accounting for 18.1% of all households. In contrast, only 26 households (1.1%) fall into the $200,000+ income bracket, making it the least populous group.
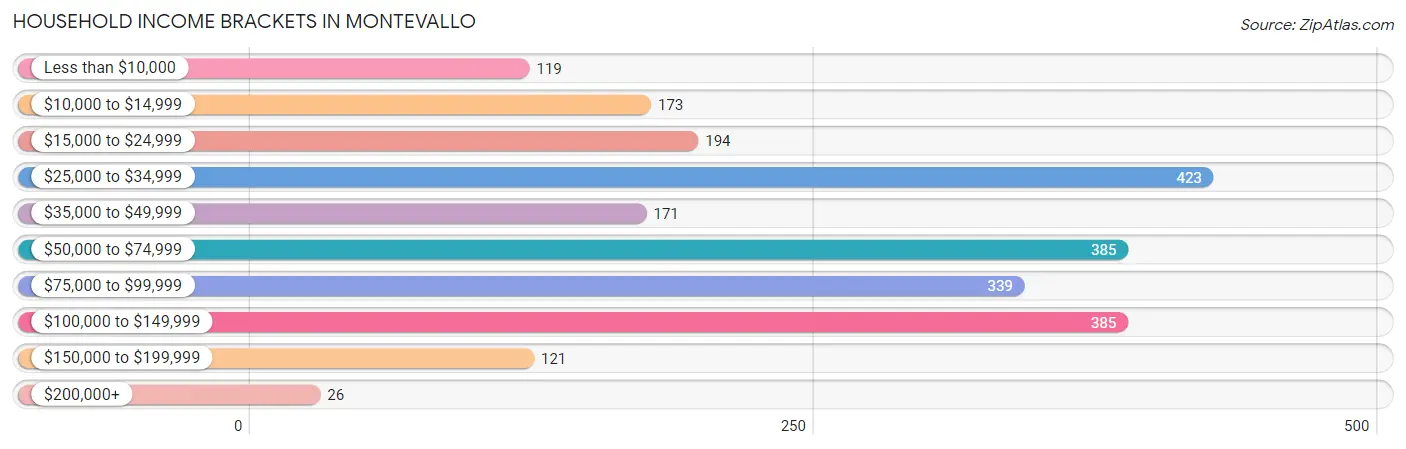
| Income Bracket | # Households | % Households |
| Less than $10,000 | 119 | 5.1% |
| $10,000 to $14,999 | 173 | 7.4% |
| $15,000 to $24,999 | 194 | 8.3% |
| $25,000 to $34,999 | 423 | 18.1% |
| $35,000 to $49,999 | 171 | 7.3% |
| $50,000 to $74,999 | 385 | 16.5% |
| $75,000 to $99,999 | 339 | 14.5% |
| $100,000 to $149,999 | 385 | 16.5% |
| $150,000 to $199,999 | 121 | 5.2% |
| $200,000+ | 26 | 1.1% |
Household Income by Householder Age in Montevallo
The median household income in Montevallo is $56,500, with the highest median household income of $87,434 found in the 45 to 64 years age bracket for the primary householder. A total of 815 households (34.9%) fall into this category. Meanwhile, the 15 to 24 years age bracket for the primary householder has the lowest median household income of $25,231, with 217 households (9.3%) in this group.
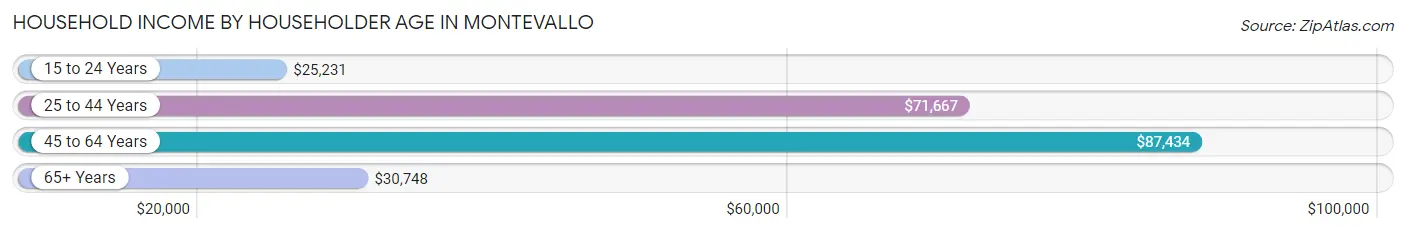
| Income Bracket | # Households | Median Income |
| 15 to 24 Years | 217 (9.3%) | $25,231 |
| 25 to 44 Years | 610 (26.1%) | $71,667 |
| 45 to 64 Years | 815 (34.9%) | $87,434 |
| 65+ Years | 694 (29.7%) | $30,748 |
| Total | 2,336 (100.0%) | $56,500 |
Poverty in Montevallo
Income Below Poverty by Sex and Age in Montevallo
With 11.4% poverty level for males and 17.7% for females among the residents of Montevallo, 15 year old males and 65 to 74 year old females are the most vulnerable to poverty, with 15 males (25.0%) and 101 females (38.9%) in their respective age groups living below the poverty level.
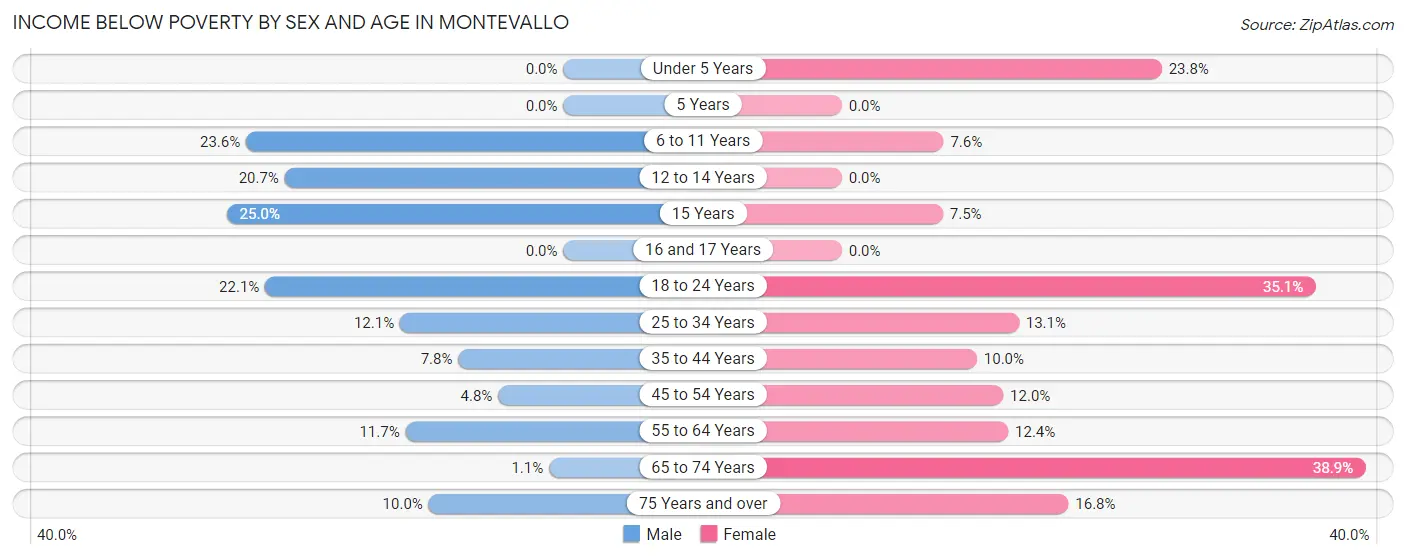
| Age Bracket | Male | Female |
| Under 5 Years | 0 (0.0%) | 38 (23.7%) |
| 5 Years | 0 (0.0%) | 0 (0.0%) |
| 6 to 11 Years | 49 (23.6%) | 8 (7.5%) |
| 12 to 14 Years | 12 (20.7%) | 0 (0.0%) |
| 15 Years | 15 (25.0%) | 9 (7.5%) |
| 16 and 17 Years | 0 (0.0%) | 0 (0.0%) |
| 18 to 24 Years | 89 (22.1%) | 162 (35.1%) |
| 25 to 34 Years | 49 (12.1%) | 41 (13.1%) |
| 35 to 44 Years | 22 (7.8%) | 35 (10.0%) |
| 45 to 54 Years | 21 (4.8%) | 46 (12.0%) |
| 55 to 64 Years | 34 (11.7%) | 31 (12.3%) |
| 65 to 74 Years | 3 (1.1%) | 101 (38.9%) |
| 75 Years and over | 14 (10.0%) | 37 (16.8%) |
| Total | 308 (11.4%) | 508 (17.7%) |
Income Above Poverty by Sex and Age in Montevallo
According to the poverty statistics in Montevallo, males aged under 5 years and females aged 12 to 14 years are the age groups that are most secure financially, with 100.0% of males and 100.0% of females in these age groups living above the poverty line.
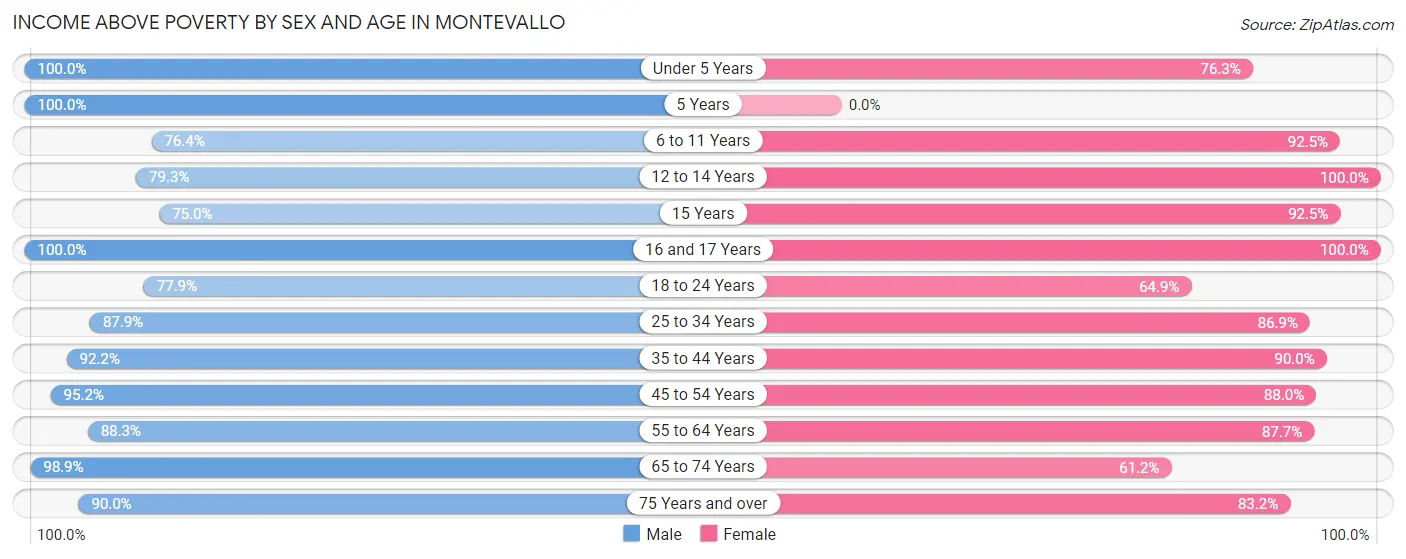
| Age Bracket | Male | Female |
| Under 5 Years | 34 (100.0%) | 122 (76.2%) |
| 5 Years | 72 (100.0%) | 0 (0.0%) |
| 6 to 11 Years | 159 (76.4%) | 98 (92.4%) |
| 12 to 14 Years | 46 (79.3%) | 113 (100.0%) |
| 15 Years | 45 (75.0%) | 111 (92.5%) |
| 16 and 17 Years | 30 (100.0%) | 134 (100.0%) |
| 18 to 24 Years | 313 (77.9%) | 299 (64.9%) |
| 25 to 34 Years | 355 (87.9%) | 271 (86.9%) |
| 35 to 44 Years | 260 (92.2%) | 314 (90.0%) |
| 45 to 54 Years | 413 (95.2%) | 338 (88.0%) |
| 55 to 64 Years | 256 (88.3%) | 220 (87.6%) |
| 65 to 74 Years | 279 (98.9%) | 159 (61.2%) |
| 75 Years and over | 126 (90.0%) | 183 (83.2%) |
| Total | 2,388 (88.6%) | 2,362 (82.3%) |
Income Below Poverty Among Married-Couple Families in Montevallo
The poverty statistics for married-couple families in Montevallo show that 1.1% or 9 of the total 851 families live below the poverty line. Families with no children have the highest poverty rate of 2.2%, comprising of 9 families. On the other hand, families with 1 or 2 children have the lowest poverty rate of 0.0%, which includes 0 families.
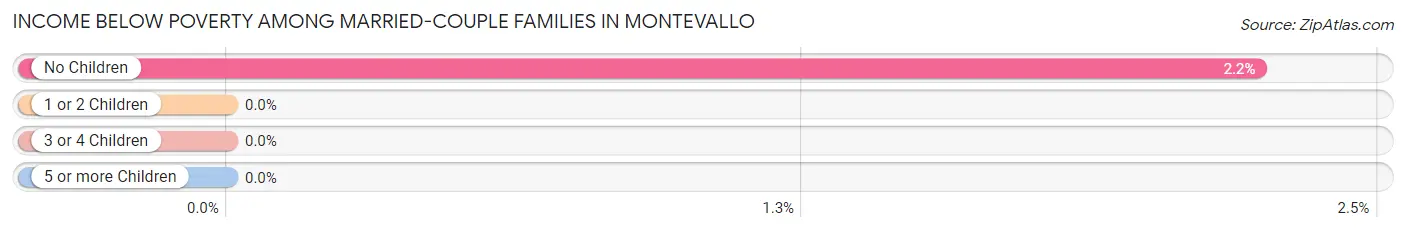
| Children | Above Poverty | Below Poverty |
| No Children | 392 (97.8%) | 9 (2.2%) |
| 1 or 2 Children | 436 (100.0%) | 0 (0.0%) |
| 3 or 4 Children | 14 (100.0%) | 0 (0.0%) |
| 5 or more Children | 0 (0.0%) | 0 (0.0%) |
| Total | 842 (98.9%) | 9 (1.1%) |
Income Below Poverty Among Single-Parent Households in Montevallo
According to the poverty data in Montevallo, 18.8% or 15 single-father households and 38.6% or 147 single-mother households are living below the poverty line. Among single-father households, those with no children have the highest poverty rate, with 15 households (20.8%) experiencing poverty. Likewise, among single-mother households, those with 1 or 2 children have the highest poverty rate, with 128 households (57.1%) falling below the poverty line.
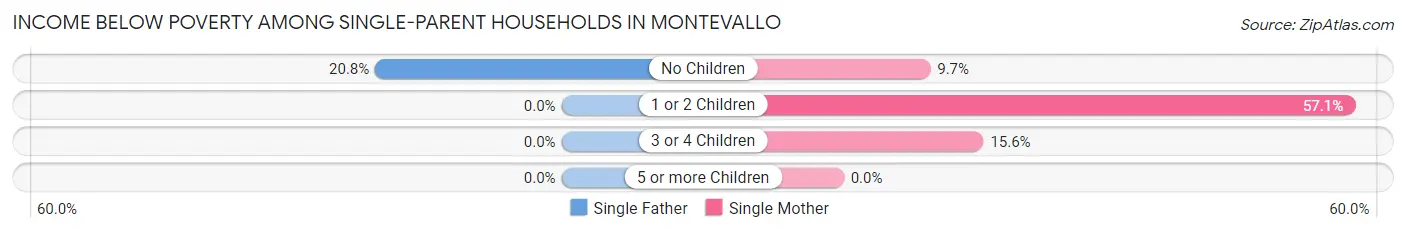
| Children | Single Father | Single Mother |
| No Children | 15 (20.8%) | 9 (9.7%) |
| 1 or 2 Children | 0 (0.0%) | 128 (57.1%) |
| 3 or 4 Children | 0 (0.0%) | 10 (15.6%) |
| 5 or more Children | 0 (0.0%) | 0 (0.0%) |
| Total | 15 (18.8%) | 147 (38.6%) |
Income Below Poverty Among Married-Couple vs Single-Parent Households in Montevallo
The poverty data for Montevallo shows that 9 of the married-couple family households (1.1%) and 162 of the single-parent households (35.1%) are living below the poverty level. Within the married-couple family households, those with no children have the highest poverty rate, with 9 households (2.2%) falling below the poverty line. Among the single-parent households, those with 1 or 2 children have the highest poverty rate, with 128 household (55.2%) living below poverty.
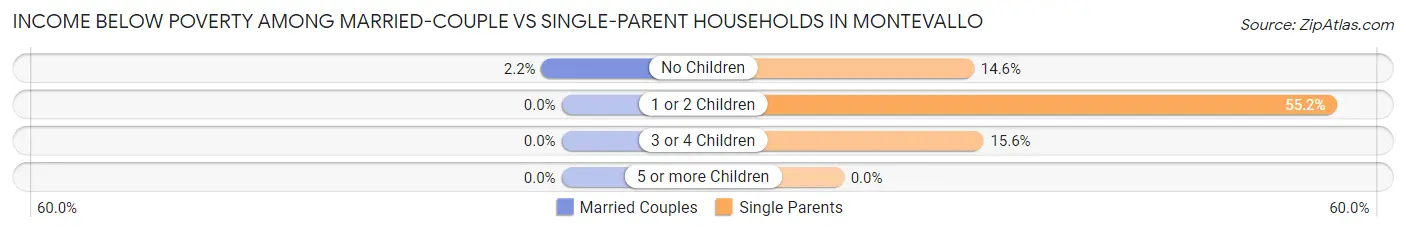
| Children | Married-Couple Families | Single-Parent Households |
| No Children | 9 (2.2%) | 24 (14.5%) |
| 1 or 2 Children | 0 (0.0%) | 128 (55.2%) |
| 3 or 4 Children | 0 (0.0%) | 10 (15.6%) |
| 5 or more Children | 0 (0.0%) | 0 (0.0%) |
| Total | 9 (1.1%) | 162 (35.1%) |
Race in Montevallo
The most populous races in Montevallo are White / Caucasian (5,445 | 74.7%), Black / African American (1,453 | 19.9%), and Hispanic or Latino (353 | 4.8%).
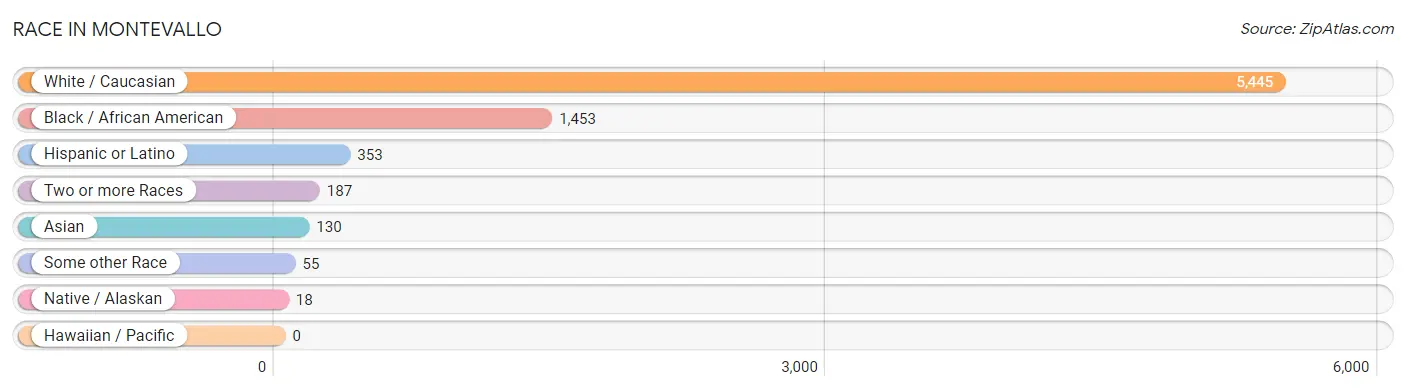
| Race | # Population | % Population |
| Asian | 130 | 1.8% |
| Black / African American | 1,453 | 19.9% |
| Hawaiian / Pacific | 0 | 0.0% |
| Hispanic or Latino | 353 | 4.8% |
| Native / Alaskan | 18 | 0.3% |
| White / Caucasian | 5,445 | 74.7% |
| Two or more Races | 187 | 2.6% |
| Some other Race | 55 | 0.7% |
| Total | 7,288 | 100.0% |
Ancestry in Montevallo
The most populous ancestries reported in Montevallo are American (1,121 | 15.4%), English (964 | 13.2%), German (626 | 8.6%), Irish (485 | 6.7%), and British (241 | 3.3%), together accounting for 47.2% of all Montevallo residents.
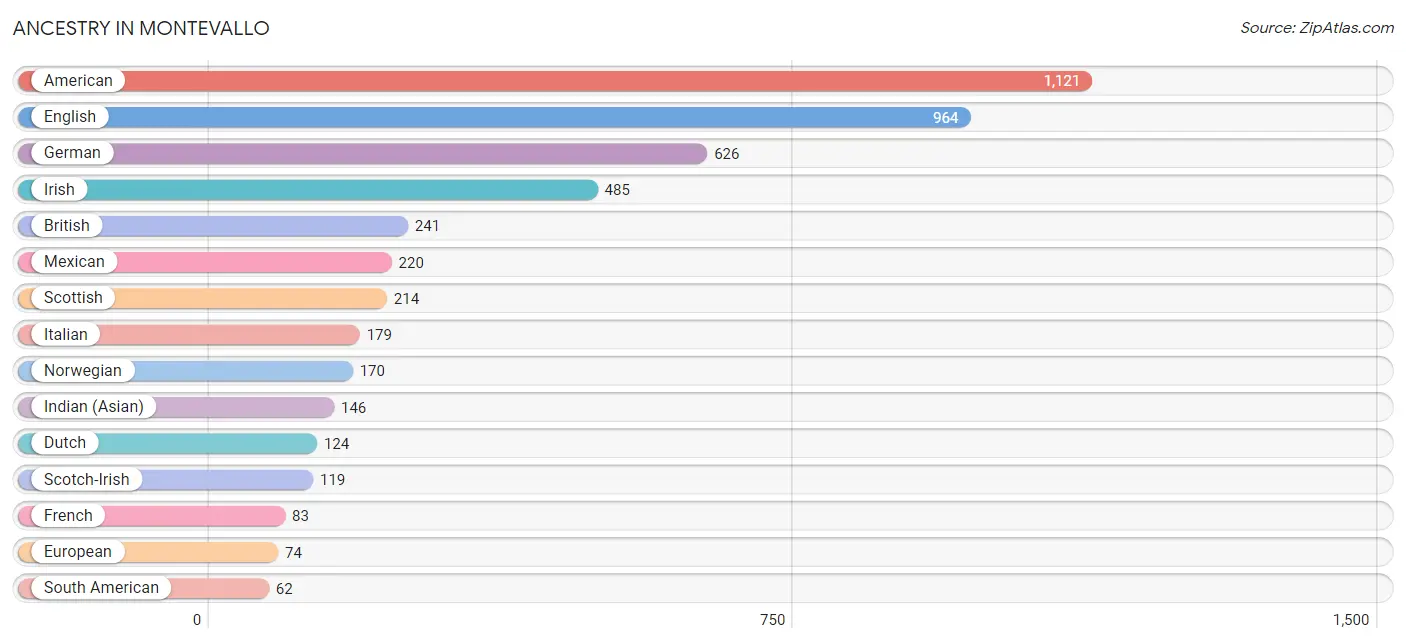
| Ancestry | # Population | % Population |
| Albanian | 35 | 0.5% |
| American | 1,121 | 15.4% |
| Arab | 16 | 0.2% |
| Austrian | 8 | 0.1% |
| Bhutanese | 23 | 0.3% |
| British | 241 | 3.3% |
| Burmese | 20 | 0.3% |
| Cherokee | 17 | 0.2% |
| Colombian | 58 | 0.8% |
| Creek | 1 | 0.0% |
| Czech | 6 | 0.1% |
| Czechoslovakian | 5 | 0.1% |
| Danish | 22 | 0.3% |
| Dominican | 22 | 0.3% |
| Dutch | 124 | 1.7% |
| Eastern European | 8 | 0.1% |
| Ecuadorian | 4 | 0.1% |
| English | 964 | 13.2% |
| European | 74 | 1.0% |
| Filipino | 1 | 0.0% |
| French | 83 | 1.1% |
| German | 626 | 8.6% |
| Greek | 17 | 0.2% |
| Indian (Asian) | 146 | 2.0% |
| Irish | 485 | 6.7% |
| Italian | 179 | 2.5% |
| Lebanese | 16 | 0.2% |
| Mexican | 220 | 3.0% |
| Native Hawaiian | 15 | 0.2% |
| Norwegian | 170 | 2.3% |
| Polish | 35 | 0.5% |
| Portuguese | 30 | 0.4% |
| Puerto Rican | 34 | 0.5% |
| Russian | 32 | 0.4% |
| Scotch-Irish | 119 | 1.6% |
| Scottish | 214 | 2.9% |
| Slovak | 13 | 0.2% |
| South African | 13 | 0.2% |
| South American | 62 | 0.9% |
| Spaniard | 15 | 0.2% |
| Subsaharan African | 23 | 0.3% |
| Swedish | 17 | 0.2% |
| Swiss | 20 | 0.3% |
| Thai | 14 | 0.2% |
| Trinidadian and Tobagonian | 10 | 0.1% |
| Welsh | 28 | 0.4% | View All 46 Rows |
Immigrants in Montevallo
The most numerous immigrant groups reported in Montevallo came from Latin America (230 | 3.2%), Central America (182 | 2.5%), Mexico (182 | 2.5%), Asia (120 | 1.7%), and Eastern Asia (116 | 1.6%), together accounting for 11.4% of all Montevallo residents.
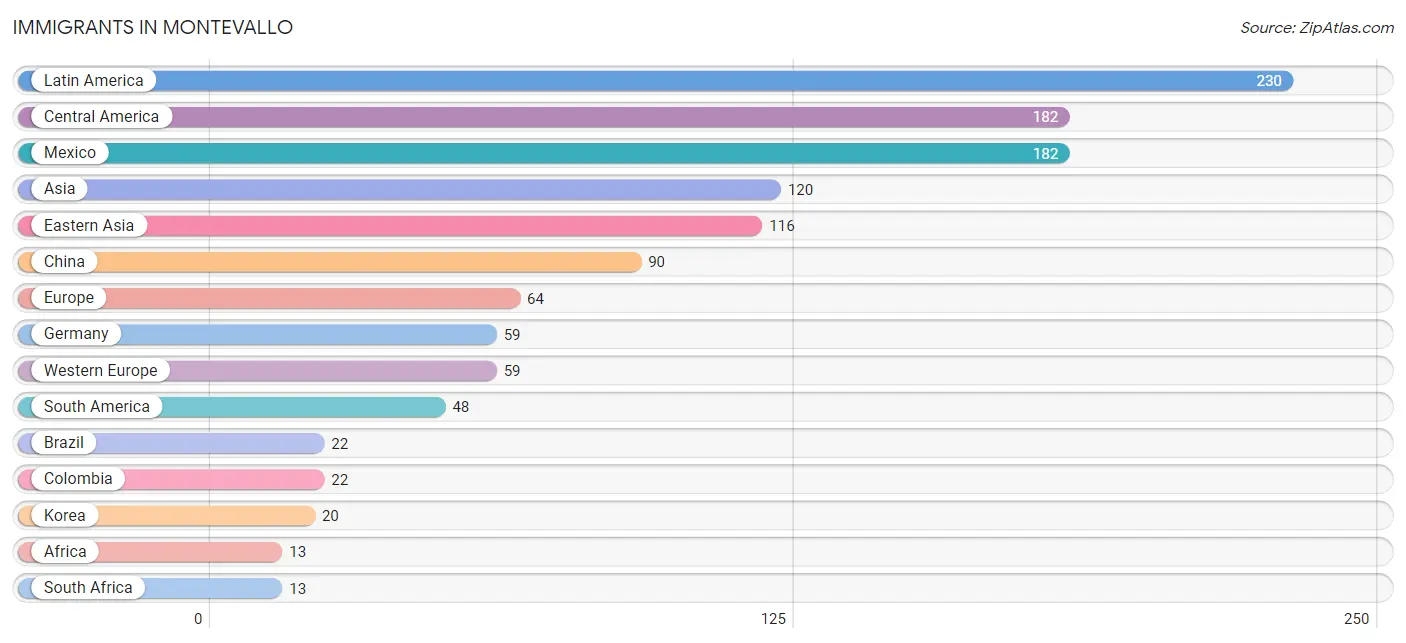
| Immigration Origin | # Population | % Population |
| Africa | 13 | 0.2% |
| Asia | 120 | 1.7% |
| Brazil | 22 | 0.3% |
| Central America | 182 | 2.5% |
| China | 90 | 1.2% |
| Colombia | 22 | 0.3% |
| Eastern Asia | 116 | 1.6% |
| Ecuador | 4 | 0.1% |
| Europe | 64 | 0.9% |
| Germany | 59 | 0.8% |
| India | 4 | 0.1% |
| Italy | 5 | 0.1% |
| Japan | 6 | 0.1% |
| Korea | 20 | 0.3% |
| Latin America | 230 | 3.2% |
| Mexico | 182 | 2.5% |
| South Africa | 13 | 0.2% |
| South America | 48 | 0.7% |
| South Central Asia | 4 | 0.1% |
| Southern Europe | 5 | 0.1% |
| Taiwan | 1 | 0.0% |
| Western Europe | 59 | 0.8% | View All 22 Rows |
Sex and Age in Montevallo
Sex and Age in Montevallo
The most populous age groups in Montevallo are 20 to 24 Years (596 | 19.3%) for men and 15 to 19 Years (1,020 | 24.3%) for women.
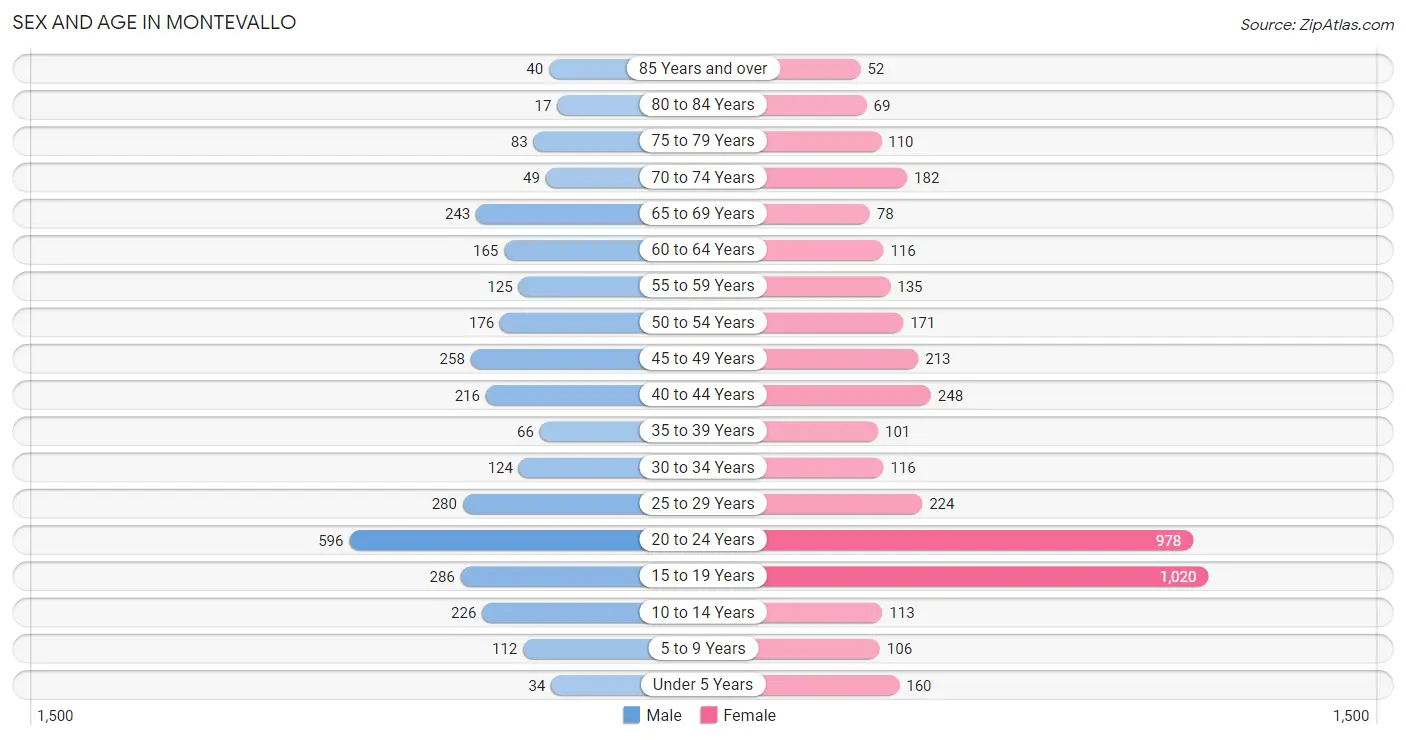
| Age Bracket | Male | Female |
| Under 5 Years | 34 (1.1%) | 160 (3.8%) |
| 5 to 9 Years | 112 (3.6%) | 106 (2.5%) |
| 10 to 14 Years | 226 (7.3%) | 113 (2.7%) |
| 15 to 19 Years | 286 (9.2%) | 1,020 (24.3%) |
| 20 to 24 Years | 596 (19.3%) | 978 (23.3%) |
| 25 to 29 Years | 280 (9.0%) | 224 (5.3%) |
| 30 to 34 Years | 124 (4.0%) | 116 (2.8%) |
| 35 to 39 Years | 66 (2.1%) | 101 (2.4%) |
| 40 to 44 Years | 216 (7.0%) | 248 (5.9%) |
| 45 to 49 Years | 258 (8.3%) | 213 (5.1%) |
| 50 to 54 Years | 176 (5.7%) | 171 (4.1%) |
| 55 to 59 Years | 125 (4.0%) | 135 (3.2%) |
| 60 to 64 Years | 165 (5.3%) | 116 (2.8%) |
| 65 to 69 Years | 243 (7.9%) | 78 (1.9%) |
| 70 to 74 Years | 49 (1.6%) | 182 (4.3%) |
| 75 to 79 Years | 83 (2.7%) | 110 (2.6%) |
| 80 to 84 Years | 17 (0.5%) | 69 (1.7%) |
| 85 Years and over | 40 (1.3%) | 52 (1.2%) |
| Total | 3,096 (100.0%) | 4,192 (100.0%) |
Families and Households in Montevallo
Median Family Size in Montevallo
The median family size in Montevallo is 3.09 persons per family, with married-couple families (851 | 64.9%) accounting for the largest median family size of 3.22 persons per family. On the other hand, single male/father families (80 | 6.1%) represent the smallest median family size with 2.56 persons per family.
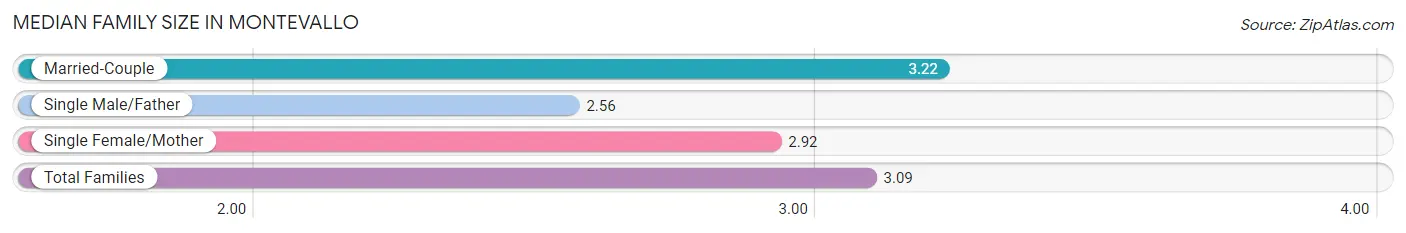
| Family Type | # Families | Family Size |
| Married-Couple | 851 (64.9%) | 3.22 |
| Single Male/Father | 80 (6.1%) | 2.56 |
| Single Female/Mother | 381 (29.0%) | 2.92 |
| Total Families | 1,312 (100.0%) | 3.09 |
Median Household Size in Montevallo
The median household size in Montevallo is 2.38 persons per household, with married-couple households (851 | 36.4%) accounting for the largest median household size of 3.24 persons per household. non-family households (1,024 | 43.8%) represent the smallest median household size with 1.32 persons per household.
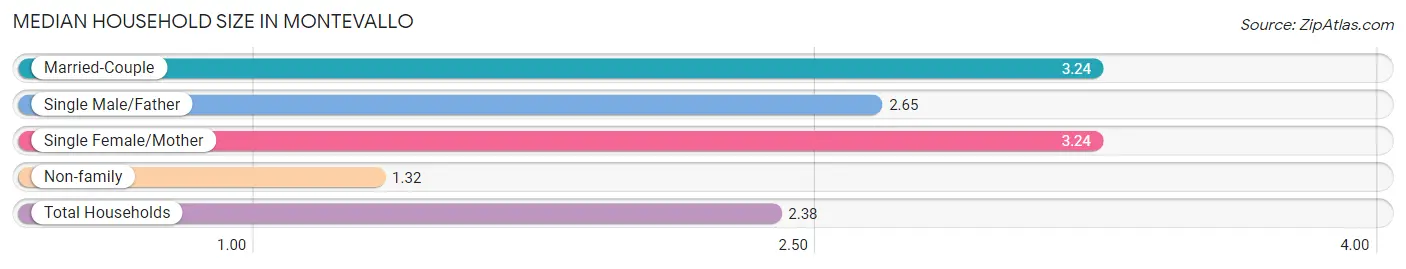
| Household Type | # Households | Household Size |
| Married-Couple | 851 (36.4%) | 3.24 |
| Single Male/Father | 80 (3.4%) | 2.65 |
| Single Female/Mother | 381 (16.3%) | 3.24 |
| Non-family | 1,024 (43.8%) | 1.32 |
| Total Households | 2,336 (100.0%) | 2.38 |
Household Size by Marriage Status in Montevallo
Out of a total of 2,336 households in Montevallo, 1,312 (56.2%) are family households, while 1,024 (43.8%) are nonfamily households. The most numerous type of family households are 2-person households, comprising 549, and the most common type of nonfamily households are 1-person households, comprising 840.
| Household Size | Family Households | Nonfamily Households |
| 1-Person Households | - | 840 (36.0%) |
| 2-Person Households | 549 (23.5%) | 115 (4.9%) |
| 3-Person Households | 235 (10.1%) | 69 (2.9%) |
| 4-Person Households | 425 (18.2%) | 0 (0.0%) |
| 5-Person Households | 88 (3.8%) | 0 (0.0%) |
| 6-Person Households | 5 (0.2%) | 0 (0.0%) |
| 7+ Person Households | 10 (0.4%) | 0 (0.0%) |
| Total | 1,312 (56.2%) | 1,024 (43.8%) |
Female Fertility in Montevallo
Fertility by Age in Montevallo
Average fertility rate in Montevallo is 17.0 births per 1,000 women. Women in the age bracket of 20 to 34 years have the highest fertility rate with 38.0 births per 1,000 women. Women in the age bracket of 20 to 34 years acount for 100.0% of all women with births.
| Age Bracket | Women with Births | Births / 1,000 Women |
| 15 to 19 years | 0 (0.0%) | 0.0 |
| 20 to 34 years | 50 (100.0%) | 38.0 |
| 35 to 50 years | 0 (0.0%) | 0.0 |
| Total | 50 (100.0%) | 17.0 |
Fertility by Age by Marriage Status in Montevallo
78.0% of women with births (50) in Montevallo are married. The highest percentage of unmarried women with births falls into 20 to 34 years age bracket with 22.0% of them unmarried at the time of birth, while the lowest percentage of unmarried women with births belong to 20 to 34 years age bracket with 22.0% of them unmarried.
| Age Bracket | Married | Unmarried |
| 15 to 19 years | 0 (0.0%) | 0 (0.0%) |
| 20 to 34 years | 39 (78.0%) | 11 (22.0%) |
| 35 to 50 years | 0 (0.0%) | 0 (0.0%) |
| Total | 39 (78.0%) | 11 (22.0%) |
Fertility by Education in Montevallo
| Educational Attainment | Women with Births | Births / 1,000 Women |
| Less than High School | 0 (0.0%) | 0.0 |
| High School Diploma | 11 (22.0%) | 22.0 |
| College or Associate's Degree | 5 (10.0%) | 3.0 |
| Bachelor's Degree | 34 (68.0%) | 85.0 |
| Graduate Degree | 0 (0.0%) | 0.0 |
| Total | 50 (100.0%) | 17.0 |
Fertility by Education by Marriage Status in Montevallo
22.0% of women with births in Montevallo are unmarried. Women with the educational attainment of college or associate's degree are most likely to be married with 100.0% of them married at childbirth, while women with the educational attainment of high school diploma are least likely to be married with 100.0% of them unmarried at childbirth.
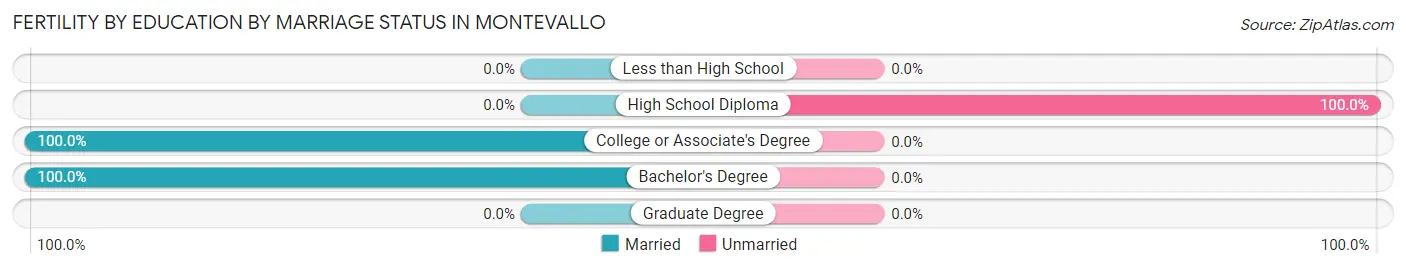
| Educational Attainment | Married | Unmarried |
| Less than High School | 0 (0.0%) | 0 (0.0%) |
| High School Diploma | 0 (0.0%) | 11 (100.0%) |
| College or Associate's Degree | 5 (100.0%) | 0 (0.0%) |
| Bachelor's Degree | 34 (100.0%) | 0 (0.0%) |
| Graduate Degree | 0 (0.0%) | 0 (0.0%) |
| Total | 39 (78.0%) | 11 (22.0%) |
Employment Characteristics in Montevallo
Employment by Class of Employer in Montevallo
Among the 3,304 employed individuals in Montevallo, private company employees (2,275 | 68.9%), state government employees (298 | 9.0%), and local government employees (283 | 8.6%) make up the most common classes of employment.
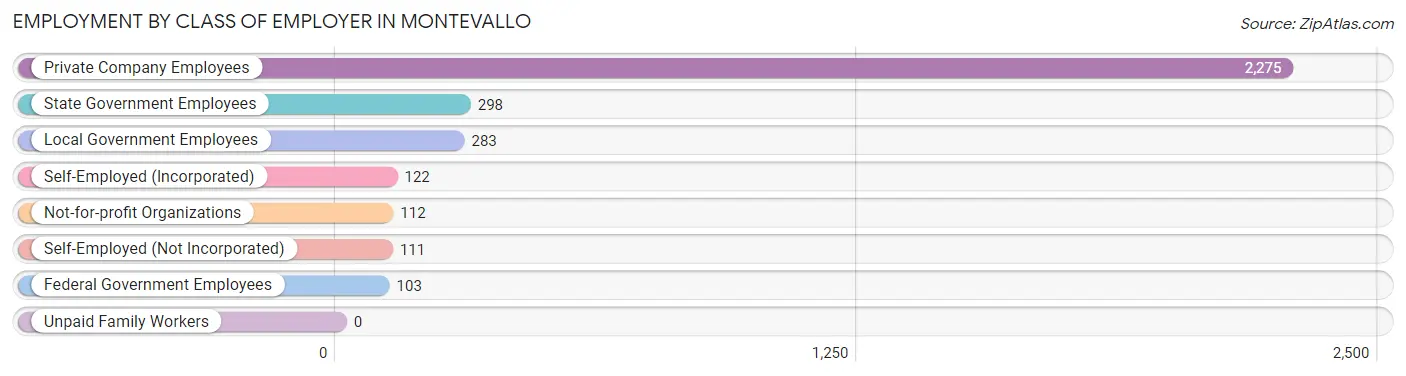
| Employer Class | # Employees | % Employees |
| Private Company Employees | 2,275 | 68.9% |
| Self-Employed (Incorporated) | 122 | 3.7% |
| Self-Employed (Not Incorporated) | 111 | 3.4% |
| Not-for-profit Organizations | 112 | 3.4% |
| Local Government Employees | 283 | 8.6% |
| State Government Employees | 298 | 9.0% |
| Federal Government Employees | 103 | 3.1% |
| Unpaid Family Workers | 0 | 0.0% |
| Total | 3,304 | 100.0% |
Employment Status by Age in Montevallo
According to the labor force statistics for Montevallo, out of the total population over 16 years of age (6,357), 59.8% or 3,801 individuals are in the labor force, with 11.5% or 437 of them unemployed. The age group with the highest labor force participation rate is 25 to 29 years, with 95.2% or 480 individuals in the labor force. Within the labor force, the 16 to 19 years age range has the highest percentage of unemployed individuals, with 35.5% or 201 of them being unemployed.
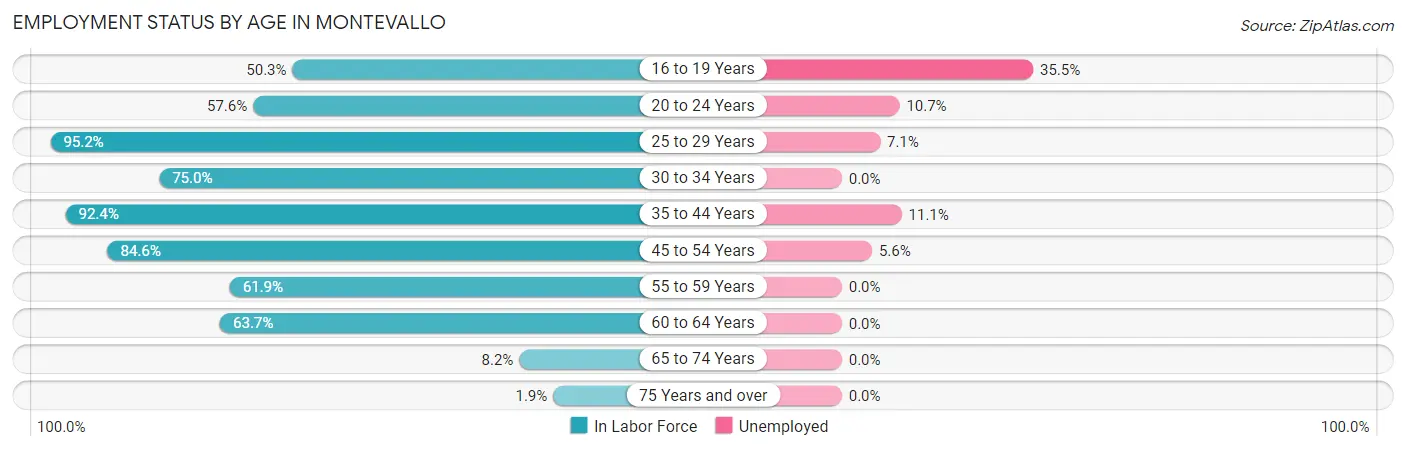
| Age Bracket | In Labor Force | Unemployed |
| 16 to 19 Years | 566 (50.3%) | 201 (35.5%) |
| 20 to 24 Years | 907 (57.6%) | 97 (10.7%) |
| 25 to 29 Years | 480 (95.2%) | 34 (7.1%) |
| 30 to 34 Years | 180 (75.0%) | 0 (0.0%) |
| 35 to 44 Years | 583 (92.4%) | 65 (11.1%) |
| 45 to 54 Years | 692 (84.6%) | 39 (5.6%) |
| 55 to 59 Years | 161 (61.9%) | 0 (0.0%) |
| 60 to 64 Years | 179 (63.7%) | 0 (0.0%) |
| 65 to 74 Years | 45 (8.2%) | 0 (0.0%) |
| 75 Years and over | 7 (1.9%) | 0 (0.0%) |
| Total | 3,801 (59.8%) | 437 (11.5%) |
Employment Status by Educational Attainment in Montevallo
According to labor force statistics for Montevallo, 83.2% of individuals (2,275) out of the total population between 25 and 64 years of age (2,734) are in the labor force, with 6.0% or 136 of them being unemployed. The group with the highest labor force participation rate are those with the educational attainment of bachelor's degree or higher, with 93.7% or 994 individuals in the labor force. Within the labor force, individuals with college / associate degree education have the highest percentage of unemployment, with 7.8% or 58 of them being unemployed.
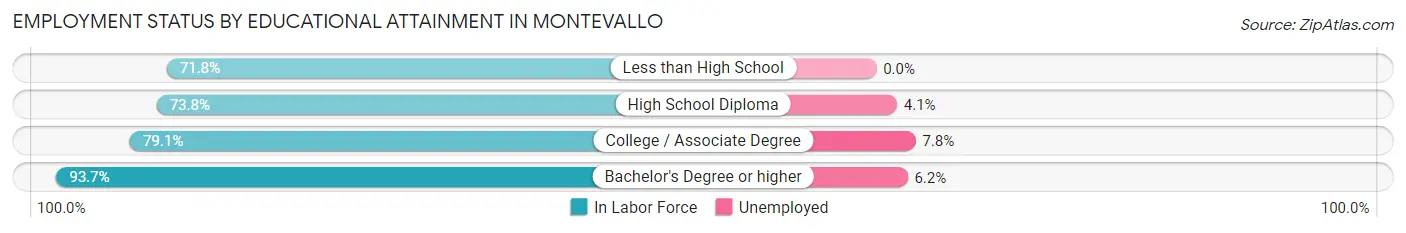
| Educational Attainment | In Labor Force | Unemployed |
| Less than High School | 127 (71.8%) | 0 (0.0%) |
| High School Diploma | 415 (73.8%) | 23 (4.1%) |
| College / Associate Degree | 739 (79.1%) | 73 (7.8%) |
| Bachelor's Degree or higher | 994 (93.7%) | 66 (6.2%) |
| Total | 2,275 (83.2%) | 164 (6.0%) |
Employment Occupations by Sex in Montevallo
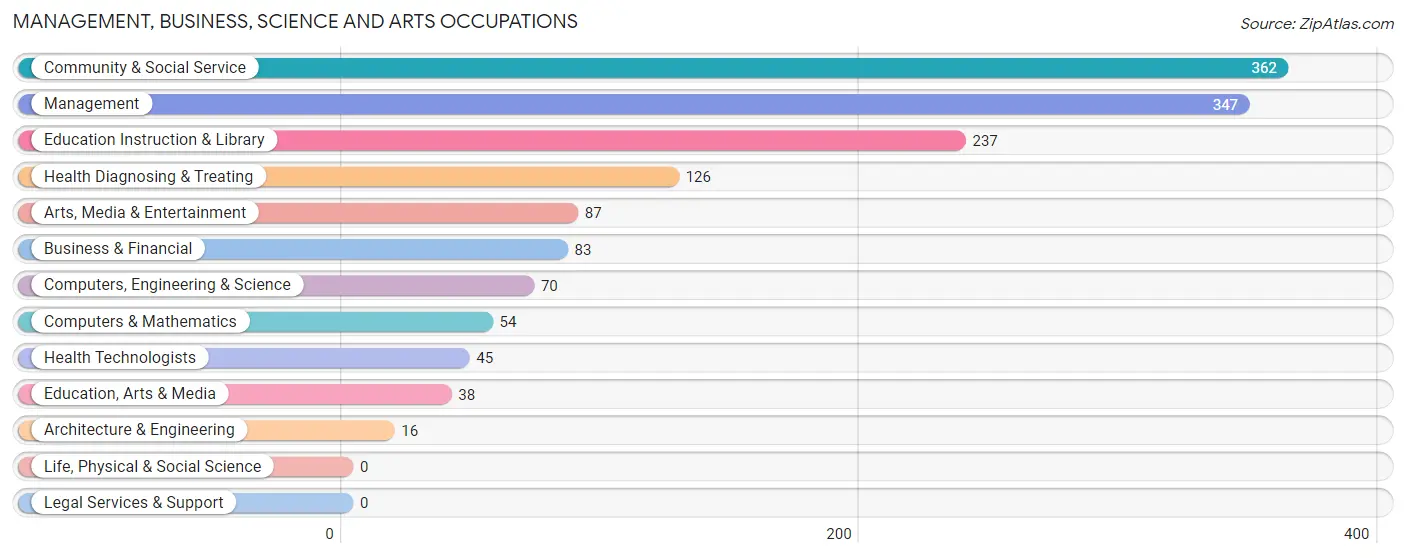
Management, Business, Science and Arts Occupations
The most common Management, Business, Science and Arts occupations in Montevallo are Community & Social Service (362 | 10.8%), Management (347 | 10.4%), Education Instruction & Library (237 | 7.1%), Health Diagnosing & Treating (126 | 3.8%), and Arts, Media & Entertainment (87 | 2.6%).
Management, Business, Science and Arts Occupations by Sex
Within the Management, Business, Science and Arts occupations in Montevallo, the most male-oriented occupations are Computers, Engineering & Science (100.0%), Computers & Mathematics (100.0%), and Architecture & Engineering (100.0%), while the most female-oriented occupations are Health Diagnosing & Treating (100.0%), Health Technologists (100.0%), and Arts, Media & Entertainment (82.8%).
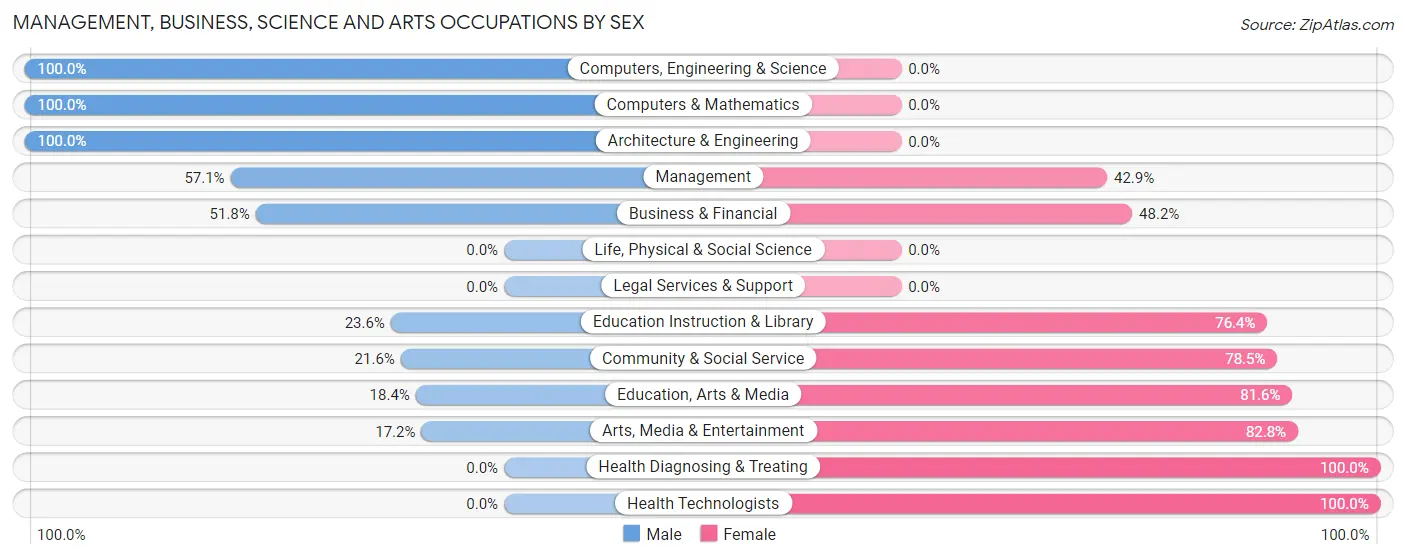
| Occupation | Male | Female |
| Management | 198 (57.1%) | 149 (42.9%) |
| Business & Financial | 43 (51.8%) | 40 (48.2%) |
| Computers, Engineering & Science | 70 (100.0%) | 0 (0.0%) |
| Computers & Mathematics | 54 (100.0%) | 0 (0.0%) |
| Architecture & Engineering | 16 (100.0%) | 0 (0.0%) |
| Life, Physical & Social Science | 0 (0.0%) | 0 (0.0%) |
| Community & Social Service | 78 (21.5%) | 284 (78.4%) |
| Education, Arts & Media | 7 (18.4%) | 31 (81.6%) |
| Legal Services & Support | 0 (0.0%) | 0 (0.0%) |
| Education Instruction & Library | 56 (23.6%) | 181 (76.4%) |
| Arts, Media & Entertainment | 15 (17.2%) | 72 (82.8%) |
| Health Diagnosing & Treating | 0 (0.0%) | 126 (100.0%) |
| Health Technologists | 0 (0.0%) | 45 (100.0%) |
| Total (Category) | 389 (39.4%) | 599 (60.6%) |
| Total (Overall) | 1,569 (46.9%) | 1,775 (53.1%) |
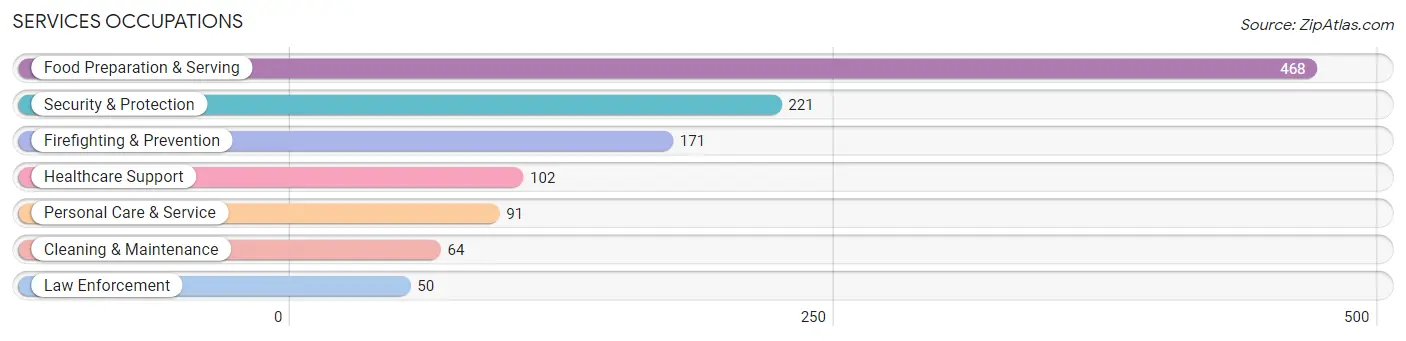
Services Occupations
The most common Services occupations in Montevallo are Food Preparation & Serving (468 | 14.0%), Security & Protection (221 | 6.6%), Firefighting & Prevention (171 | 5.1%), Healthcare Support (102 | 3.0%), and Personal Care & Service (91 | 2.7%).
Services Occupations by Sex
Within the Services occupations in Montevallo, the most male-oriented occupations are Firefighting & Prevention (100.0%), Cleaning & Maintenance (93.8%), and Security & Protection (88.2%), while the most female-oriented occupations are Healthcare Support (100.0%), Personal Care & Service (85.7%), and Food Preparation & Serving (65.8%).
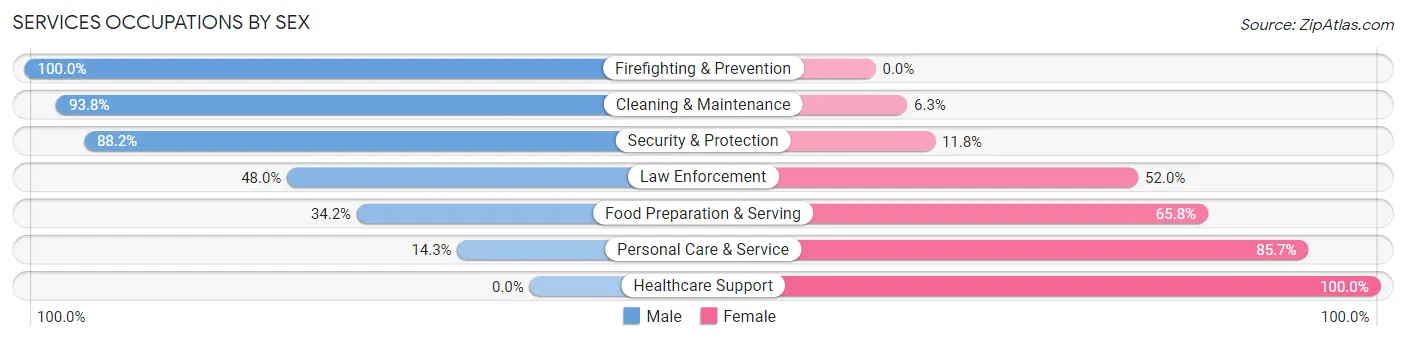
| Occupation | Male | Female |
| Healthcare Support | 0 (0.0%) | 102 (100.0%) |
| Security & Protection | 195 (88.2%) | 26 (11.8%) |
| Firefighting & Prevention | 171 (100.0%) | 0 (0.0%) |
| Law Enforcement | 24 (48.0%) | 26 (52.0%) |
| Food Preparation & Serving | 160 (34.2%) | 308 (65.8%) |
| Cleaning & Maintenance | 60 (93.8%) | 4 (6.2%) |
| Personal Care & Service | 13 (14.3%) | 78 (85.7%) |
| Total (Category) | 428 (45.2%) | 518 (54.8%) |
| Total (Overall) | 1,569 (46.9%) | 1,775 (53.1%) |
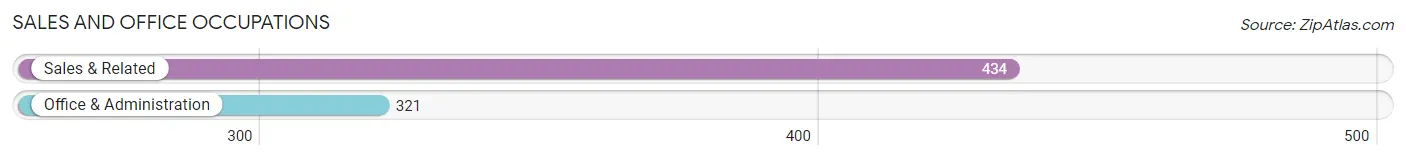
Sales and Office Occupations
The most common Sales and Office occupations in Montevallo are Sales & Related (434 | 13.0%), and Office & Administration (321 | 9.6%).
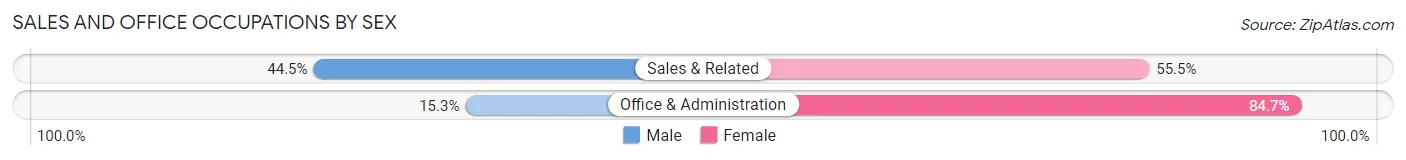
Sales and Office Occupations by Sex
| Occupation | Male | Female |
| Sales & Related | 193 (44.5%) | 241 (55.5%) |
| Office & Administration | 49 (15.3%) | 272 (84.7%) |
| Total (Category) | 242 (32.1%) | 513 (67.9%) |
| Total (Overall) | 1,569 (46.9%) | 1,775 (53.1%) |
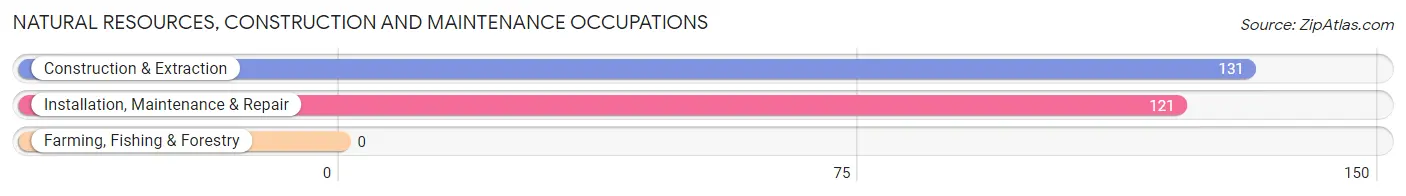
Natural Resources, Construction and Maintenance Occupations
The most common Natural Resources, Construction and Maintenance occupations in Montevallo are Construction & Extraction (131 | 3.9%), and Installation, Maintenance & Repair (121 | 3.6%).
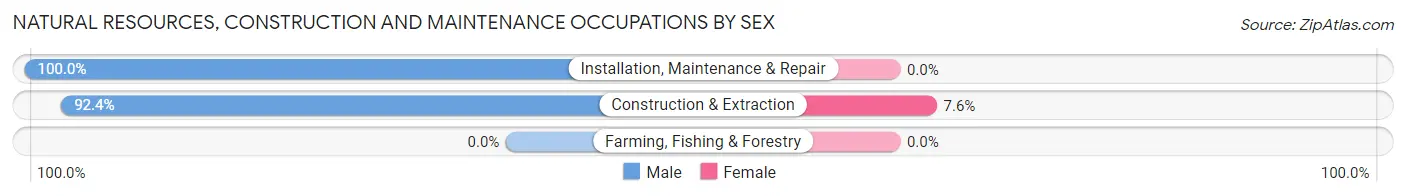
Natural Resources, Construction and Maintenance Occupations by Sex
| Occupation | Male | Female |
| Farming, Fishing & Forestry | 0 (0.0%) | 0 (0.0%) |
| Construction & Extraction | 121 (92.4%) | 10 (7.6%) |
| Installation, Maintenance & Repair | 121 (100.0%) | 0 (0.0%) |
| Total (Category) | 242 (96.0%) | 10 (4.0%) |
| Total (Overall) | 1,569 (46.9%) | 1,775 (53.1%) |
Production, Transportation and Moving Occupations
The most common Production, Transportation and Moving occupations in Montevallo are Production (154 | 4.6%), Material Moving (134 | 4.0%), and Transportation (115 | 3.4%).
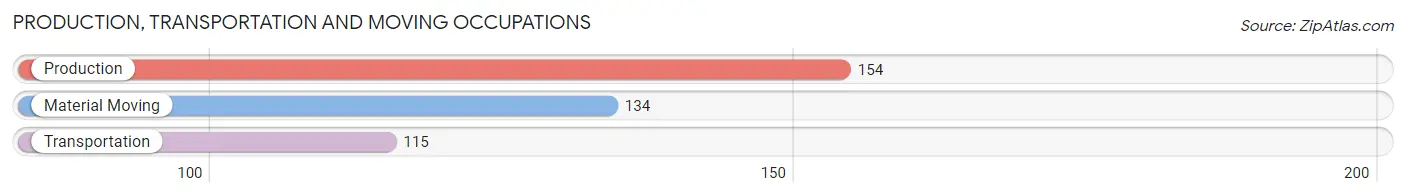
Production, Transportation and Moving Occupations by Sex
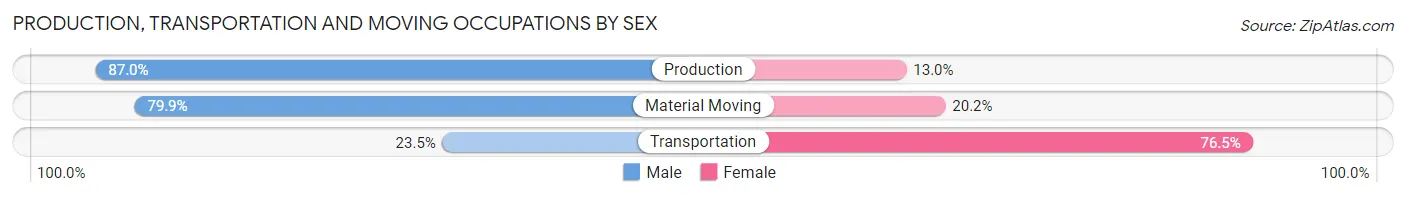
| Occupation | Male | Female |
| Production | 134 (87.0%) | 20 (13.0%) |
| Transportation | 27 (23.5%) | 88 (76.5%) |
| Material Moving | 107 (79.8%) | 27 (20.2%) |
| Total (Category) | 268 (66.5%) | 135 (33.5%) |
| Total (Overall) | 1,569 (46.9%) | 1,775 (53.1%) |
Employment Industries by Sex in Montevallo
Employment Industries in Montevallo
The major employment industries in Montevallo include Retail Trade (536 | 16.0%), Accommodation & Food Services (486 | 14.5%), Educational Services (451 | 13.5%), Health Care & Social Assistance (256 | 7.7%), and Construction (255 | 7.6%).
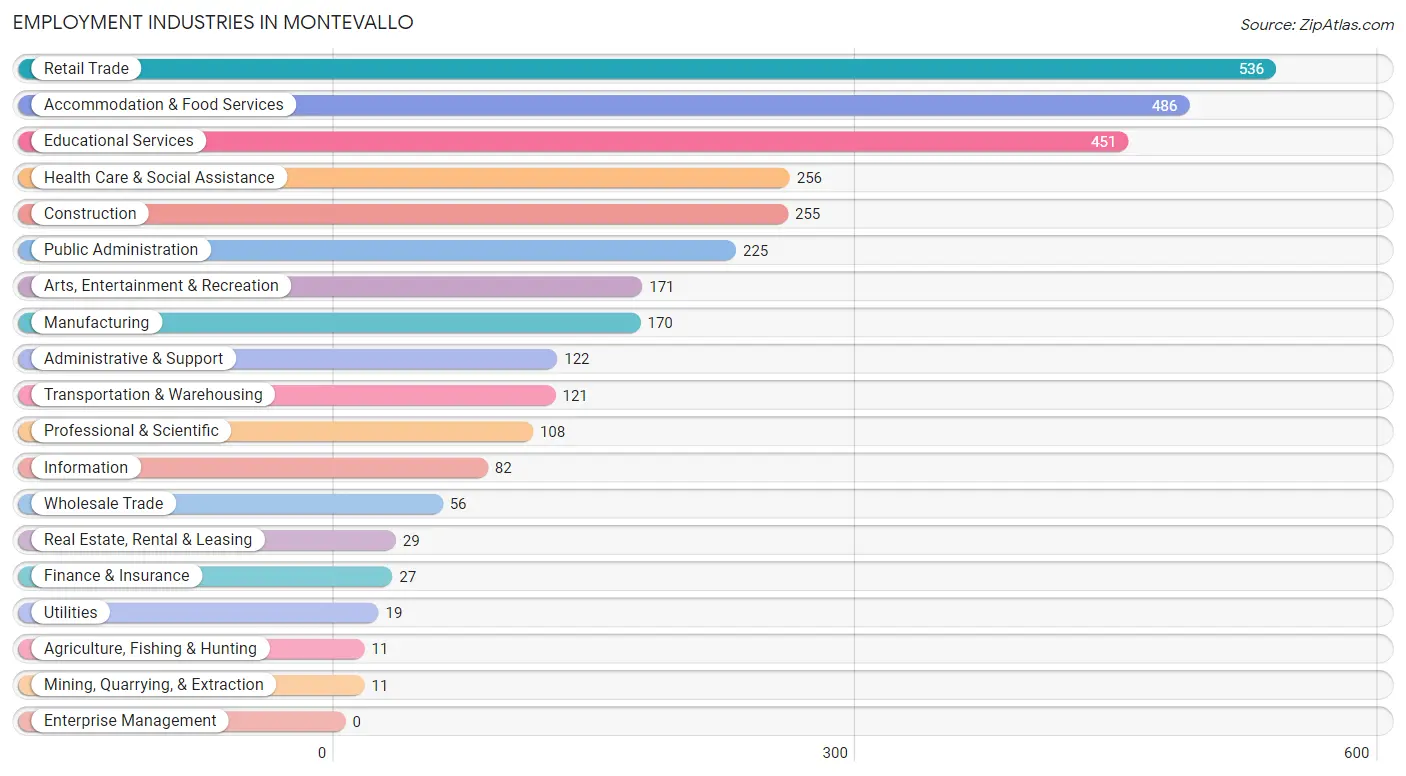
Employment Industries by Sex in Montevallo
The Montevallo industries that see more men than women are Mining, Quarrying, & Extraction (100.0%), Utilities (100.0%), and Construction (96.1%), whereas the industries that tend to have a higher number of women are Agriculture, Fishing & Hunting (100.0%), Health Care & Social Assistance (89.4%), and Arts, Entertainment & Recreation (77.8%).
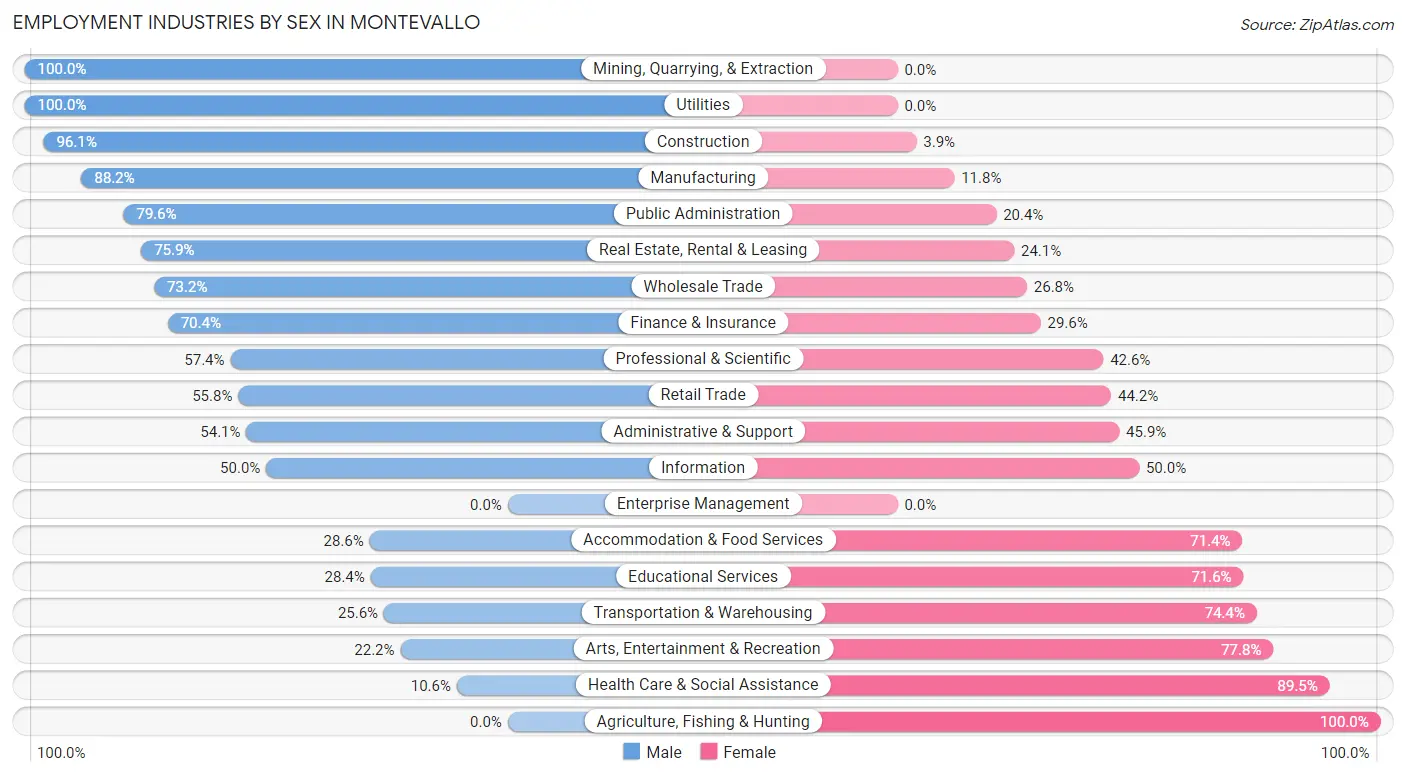
| Industry | Male | Female |
| Agriculture, Fishing & Hunting | 0 (0.0%) | 11 (100.0%) |
| Mining, Quarrying, & Extraction | 11 (100.0%) | 0 (0.0%) |
| Construction | 245 (96.1%) | 10 (3.9%) |
| Manufacturing | 150 (88.2%) | 20 (11.8%) |
| Wholesale Trade | 41 (73.2%) | 15 (26.8%) |
| Retail Trade | 299 (55.8%) | 237 (44.2%) |
| Transportation & Warehousing | 31 (25.6%) | 90 (74.4%) |
| Utilities | 19 (100.0%) | 0 (0.0%) |
| Information | 41 (50.0%) | 41 (50.0%) |
| Finance & Insurance | 19 (70.4%) | 8 (29.6%) |
| Real Estate, Rental & Leasing | 22 (75.9%) | 7 (24.1%) |
| Professional & Scientific | 62 (57.4%) | 46 (42.6%) |
| Enterprise Management | 0 (0.0%) | 0 (0.0%) |
| Administrative & Support | 66 (54.1%) | 56 (45.9%) |
| Educational Services | 128 (28.4%) | 323 (71.6%) |
| Health Care & Social Assistance | 27 (10.5%) | 229 (89.4%) |
| Arts, Entertainment & Recreation | 38 (22.2%) | 133 (77.8%) |
| Accommodation & Food Services | 139 (28.6%) | 347 (71.4%) |
| Public Administration | 179 (79.6%) | 46 (20.4%) |
| Total | 1,569 (46.9%) | 1,775 (53.1%) |
Education in Montevallo
School Enrollment in Montevallo
The most common levels of schooling among the 3,210 students in Montevallo are college / undergraduate (2,033 | 63.3%), high school (472 | 14.7%), and middle school (297 | 9.2%).
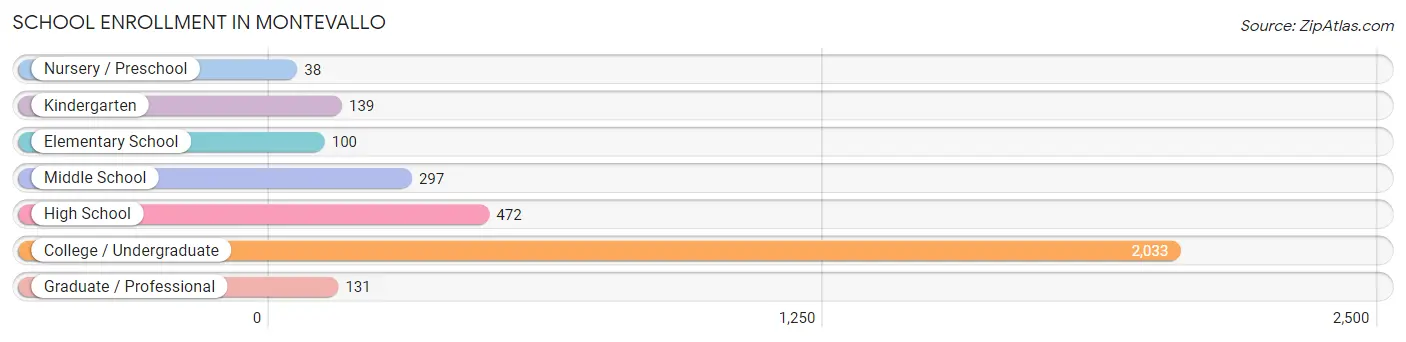
| School Level | # Students | % Students |
| Nursery / Preschool | 38 | 1.2% |
| Kindergarten | 139 | 4.3% |
| Elementary School | 100 | 3.1% |
| Middle School | 297 | 9.2% |
| High School | 472 | 14.7% |
| College / Undergraduate | 2,033 | 63.3% |
| Graduate / Professional | 131 | 4.1% |
| Total | 3,210 | 100.0% |
School Enrollment by Age by Funding Source in Montevallo
Out of a total of 3,210 students who are enrolled in schools in Montevallo, 337 (10.5%) attend a private institution, while the remaining 2,873 (89.5%) are enrolled in public schools. The age group of 3 to 4 year olds has the highest likelihood of being enrolled in private schools, with 38 (100.0% in the age bracket) enrolled. Conversely, the age group of 25 to 34 year olds has the lowest likelihood of being enrolled in a private school, with 120 (100.0% in the age bracket) attending a public institution.
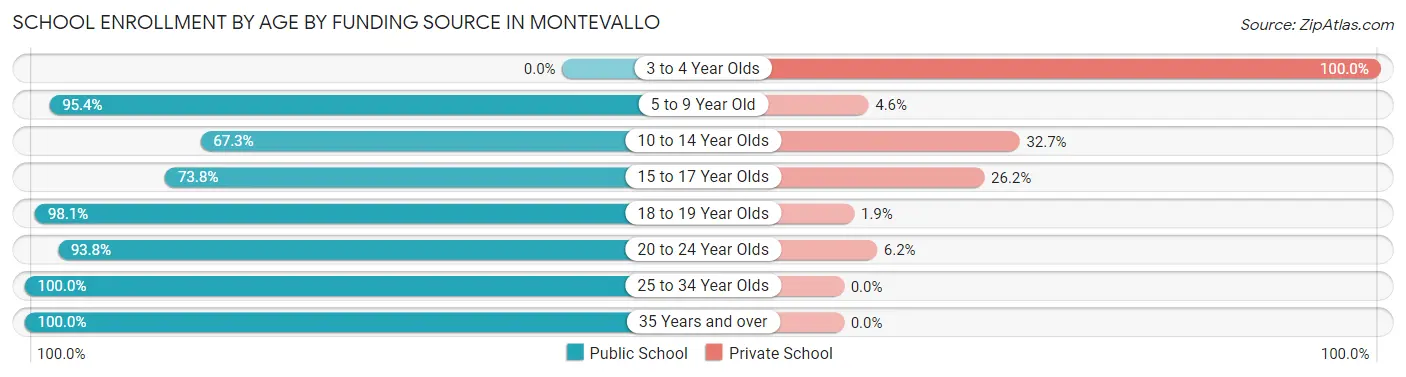
| Age Bracket | Public School | Private School |
| 3 to 4 Year Olds | 0 (0.0%) | 38 (100.0%) |
| 5 to 9 Year Old | 208 (95.4%) | 10 (4.6%) |
| 10 to 14 Year Olds | 228 (67.3%) | 111 (32.7%) |
| 15 to 17 Year Olds | 254 (73.8%) | 90 (26.2%) |
| 18 to 19 Year Olds | 916 (98.1%) | 18 (1.9%) |
| 20 to 24 Year Olds | 1,062 (93.8%) | 70 (6.2%) |
| 25 to 34 Year Olds | 120 (100.0%) | 0 (0.0%) |
| 35 Years and over | 85 (100.0%) | 0 (0.0%) |
| Total | 2,873 (89.5%) | 337 (10.5%) |
Educational Attainment by Field of Study in Montevallo
Business (379 | 30.7%), education (235 | 19.1%), visual & performing arts (93 | 7.5%), literature & languages (81 | 6.6%), and engineering (61 | 5.0%) are the most common fields of study among 1,233 individuals in Montevallo who have obtained a bachelor's degree or higher.
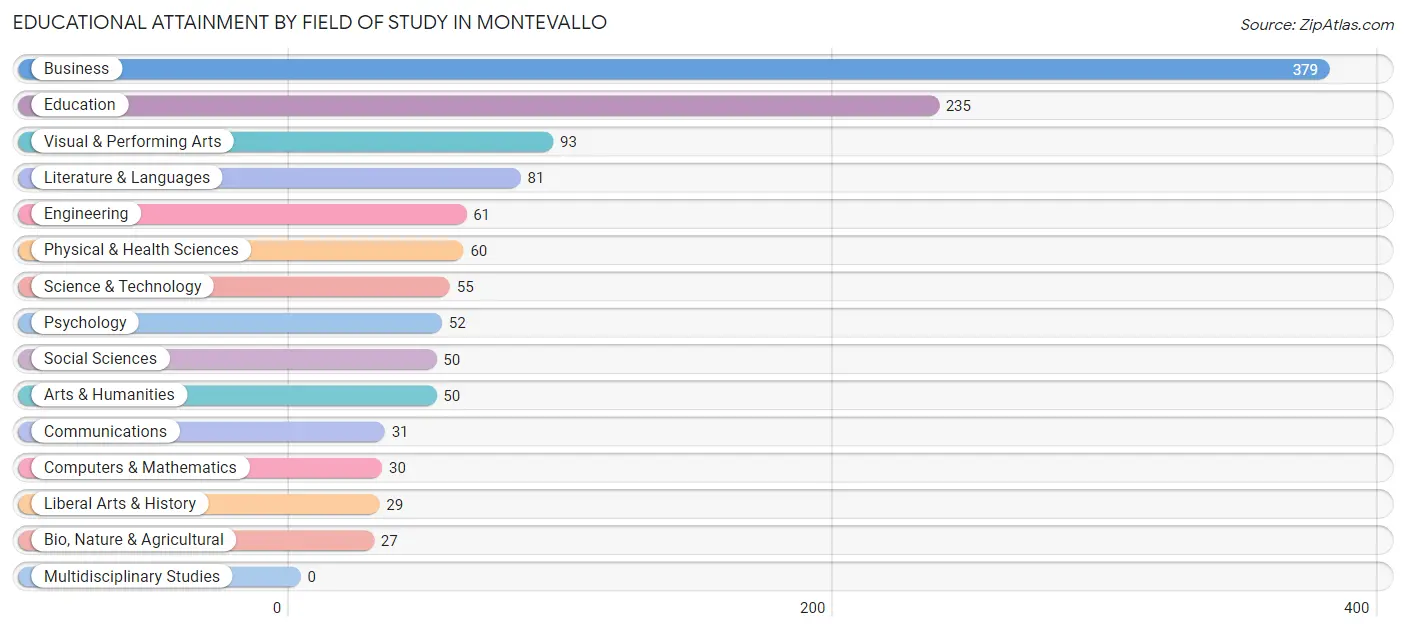
| Field of Study | # Graduates | % Graduates |
| Computers & Mathematics | 30 | 2.4% |
| Bio, Nature & Agricultural | 27 | 2.2% |
| Physical & Health Sciences | 60 | 4.9% |
| Psychology | 52 | 4.2% |
| Social Sciences | 50 | 4.1% |
| Engineering | 61 | 5.0% |
| Multidisciplinary Studies | 0 | 0.0% |
| Science & Technology | 55 | 4.5% |
| Business | 379 | 30.7% |
| Education | 235 | 19.1% |
| Literature & Languages | 81 | 6.6% |
| Liberal Arts & History | 29 | 2.4% |
| Visual & Performing Arts | 93 | 7.5% |
| Communications | 31 | 2.5% |
| Arts & Humanities | 50 | 4.1% |
| Total | 1,233 | 100.0% |
Transportation & Commute in Montevallo
Vehicle Availability by Sex in Montevallo
The most prevalent vehicle ownership categories in Montevallo are males with 2 vehicles (617, accounting for 41.2%) and females with 2 vehicles (428, making up 48.6%).
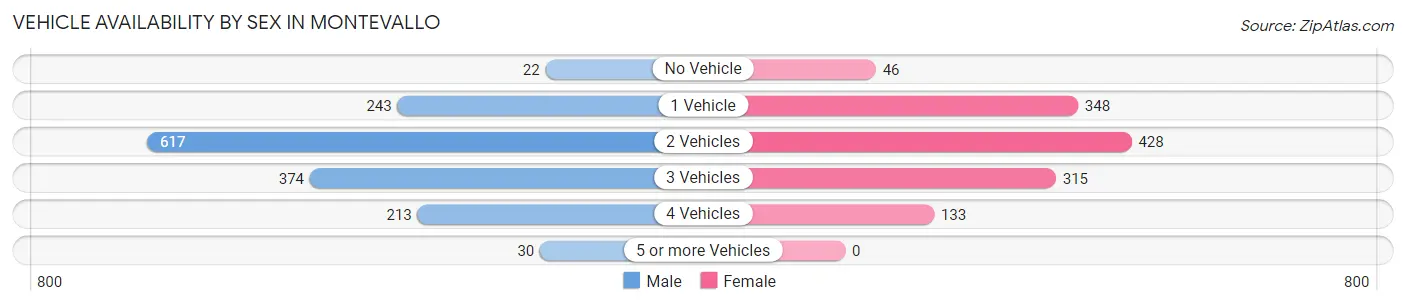
| Vehicles Available | Male | Female |
| No Vehicle | 22 (1.5%) | 46 (3.6%) |
| 1 Vehicle | 243 (16.2%) | 348 (27.4%) |
| 2 Vehicles | 617 (41.2%) | 428 (33.7%) |
| 3 Vehicles | 374 (24.9%) | 315 (24.8%) |
| 4 Vehicles | 213 (14.2%) | 133 (10.5%) |
| 5 or more Vehicles | 30 (2.0%) | 0 (0.0%) |
| Total | 1,499 (100.0%) | 1,270 (100.0%) |
Commute Time in Montevallo
The most frequently occuring commute durations in Montevallo are 20 to 24 minutes (427 commuters, 14.1%), 60 to 89 minutes (409 commuters, 13.5%), and 30 to 34 minutes (380 commuters, 12.6%).
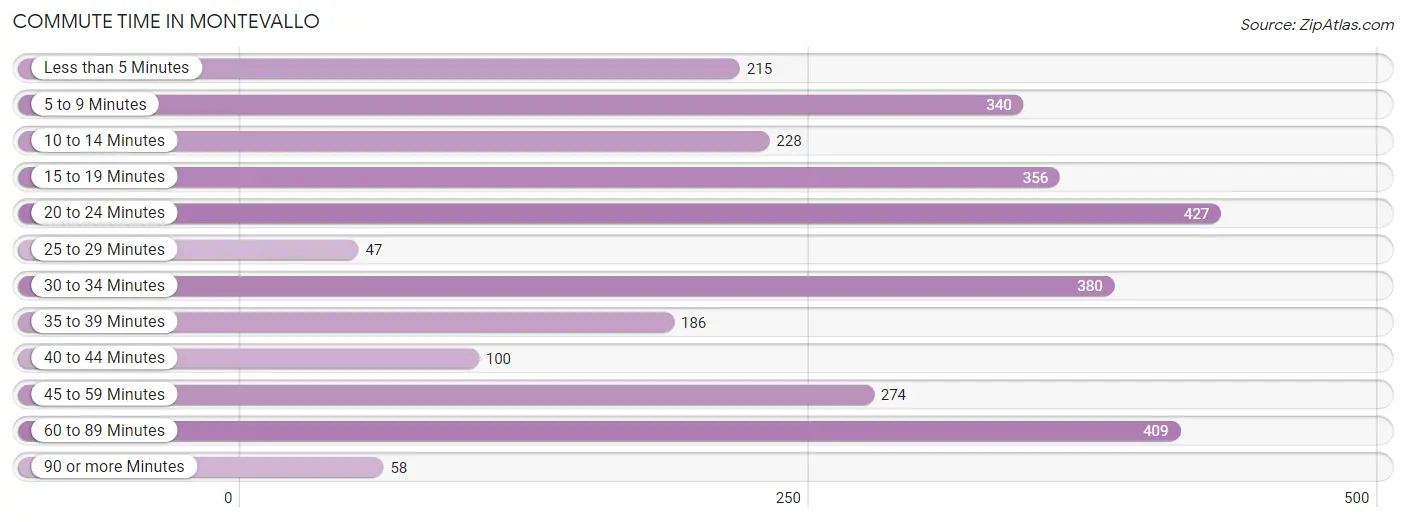
| Commute Time | # Commuters | % Commuters |
| Less than 5 Minutes | 215 | 7.1% |
| 5 to 9 Minutes | 340 | 11.3% |
| 10 to 14 Minutes | 228 | 7.5% |
| 15 to 19 Minutes | 356 | 11.8% |
| 20 to 24 Minutes | 427 | 14.1% |
| 25 to 29 Minutes | 47 | 1.6% |
| 30 to 34 Minutes | 380 | 12.6% |
| 35 to 39 Minutes | 186 | 6.2% |
| 40 to 44 Minutes | 100 | 3.3% |
| 45 to 59 Minutes | 274 | 9.1% |
| 60 to 89 Minutes | 409 | 13.5% |
| 90 or more Minutes | 58 | 1.9% |
Commute Time by Sex in Montevallo
The most common commute times in Montevallo are 20 to 24 minutes (287 commuters, 19.3%) for males and 5 to 9 minutes (245 commuters, 16.0%) for females.
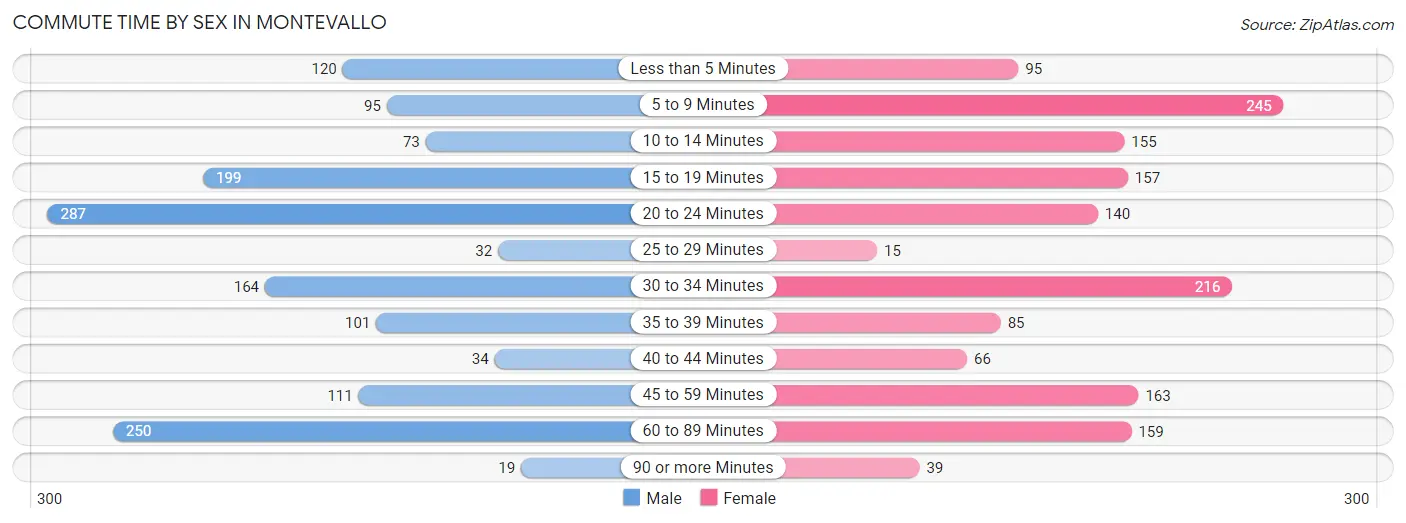
| Commute Time | Male | Female |
| Less than 5 Minutes | 120 (8.1%) | 95 (6.2%) |
| 5 to 9 Minutes | 95 (6.4%) | 245 (16.0%) |
| 10 to 14 Minutes | 73 (4.9%) | 155 (10.1%) |
| 15 to 19 Minutes | 199 (13.4%) | 157 (10.2%) |
| 20 to 24 Minutes | 287 (19.3%) | 140 (9.1%) |
| 25 to 29 Minutes | 32 (2.1%) | 15 (1.0%) |
| 30 to 34 Minutes | 164 (11.0%) | 216 (14.1%) |
| 35 to 39 Minutes | 101 (6.8%) | 85 (5.5%) |
| 40 to 44 Minutes | 34 (2.3%) | 66 (4.3%) |
| 45 to 59 Minutes | 111 (7.5%) | 163 (10.6%) |
| 60 to 89 Minutes | 250 (16.8%) | 159 (10.4%) |
| 90 or more Minutes | 19 (1.3%) | 39 (2.5%) |
Time of Departure to Work by Sex in Montevallo
The most frequent times of departure to work in Montevallo are 12:00 AM to 4:59 AM (275, 18.5%) for males and 12:00 PM to 3:59 PM (407, 26.5%) for females.
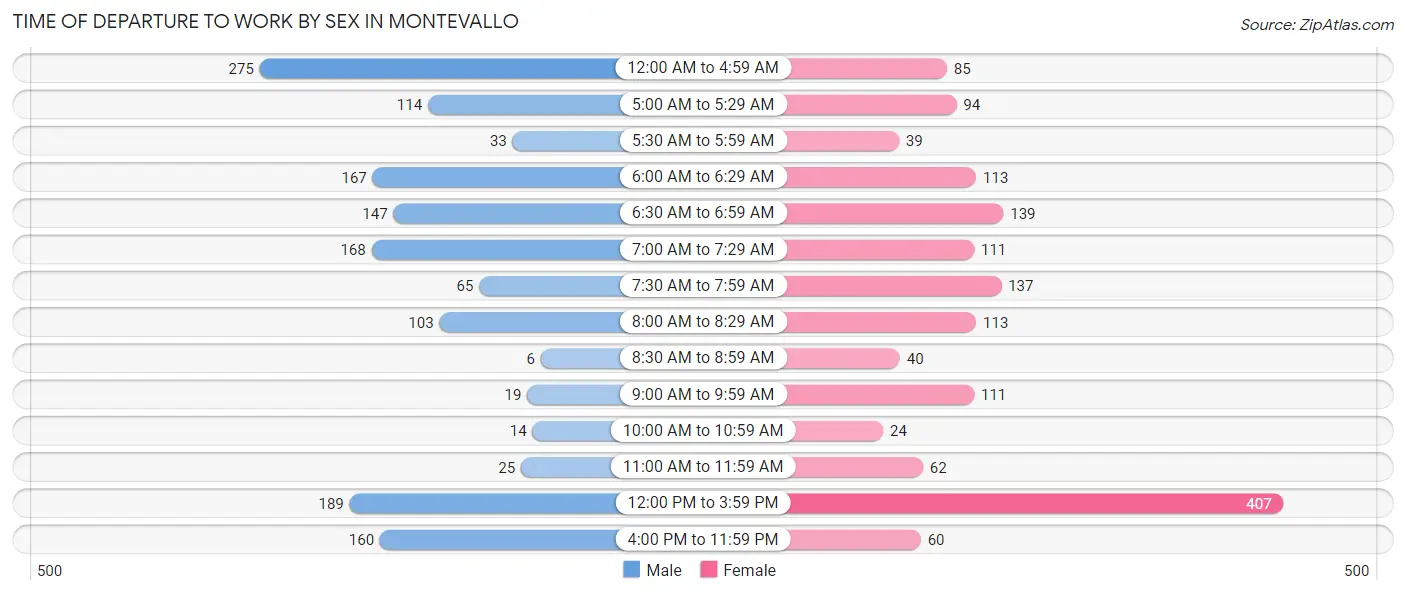
| Time of Departure | Male | Female |
| 12:00 AM to 4:59 AM | 275 (18.5%) | 85 (5.5%) |
| 5:00 AM to 5:29 AM | 114 (7.7%) | 94 (6.1%) |
| 5:30 AM to 5:59 AM | 33 (2.2%) | 39 (2.5%) |
| 6:00 AM to 6:29 AM | 167 (11.3%) | 113 (7.4%) |
| 6:30 AM to 6:59 AM | 147 (9.9%) | 139 (9.1%) |
| 7:00 AM to 7:29 AM | 168 (11.3%) | 111 (7.2%) |
| 7:30 AM to 7:59 AM | 65 (4.4%) | 137 (8.9%) |
| 8:00 AM to 8:29 AM | 103 (6.9%) | 113 (7.4%) |
| 8:30 AM to 8:59 AM | 6 (0.4%) | 40 (2.6%) |
| 9:00 AM to 9:59 AM | 19 (1.3%) | 111 (7.2%) |
| 10:00 AM to 10:59 AM | 14 (0.9%) | 24 (1.6%) |
| 11:00 AM to 11:59 AM | 25 (1.7%) | 62 (4.0%) |
| 12:00 PM to 3:59 PM | 189 (12.7%) | 407 (26.5%) |
| 4:00 PM to 11:59 PM | 160 (10.8%) | 60 (3.9%) |
| Total | 1,485 (100.0%) | 1,535 (100.0%) |
Housing Occupancy in Montevallo
Occupancy by Ownership in Montevallo
Of the total 2,336 dwellings in Montevallo, owner-occupied units account for 1,532 (65.6%), while renter-occupied units make up 804 (34.4%).
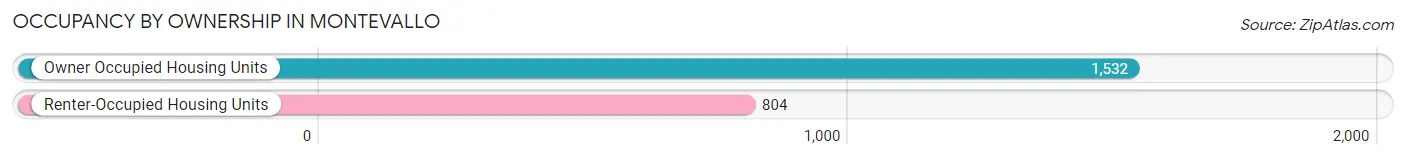
| Occupancy | # Housing Units | % Housing Units |
| Owner Occupied Housing Units | 1,532 | 65.6% |
| Renter-Occupied Housing Units | 804 | 34.4% |
| Total Occupied Housing Units | 2,336 | 100.0% |
Occupancy by Household Size in Montevallo
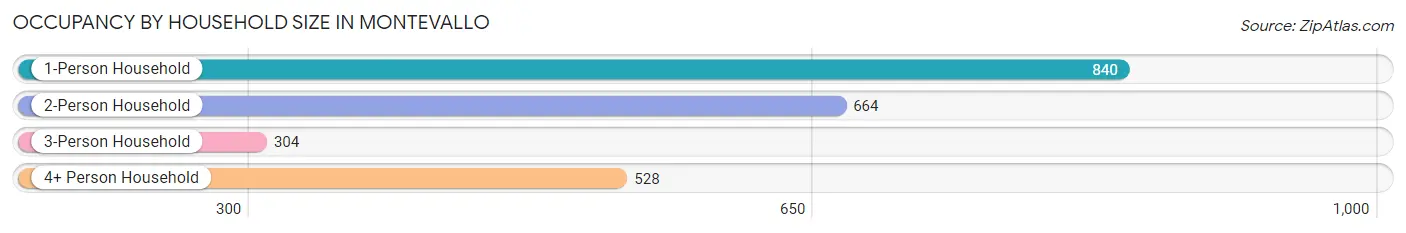
| Household Size | # Housing Units | % Housing Units |
| 1-Person Household | 840 | 36.0% |
| 2-Person Household | 664 | 28.4% |
| 3-Person Household | 304 | 13.0% |
| 4+ Person Household | 528 | 22.6% |
| Total Housing Units | 2,336 | 100.0% |
Occupancy by Ownership by Household Size in Montevallo
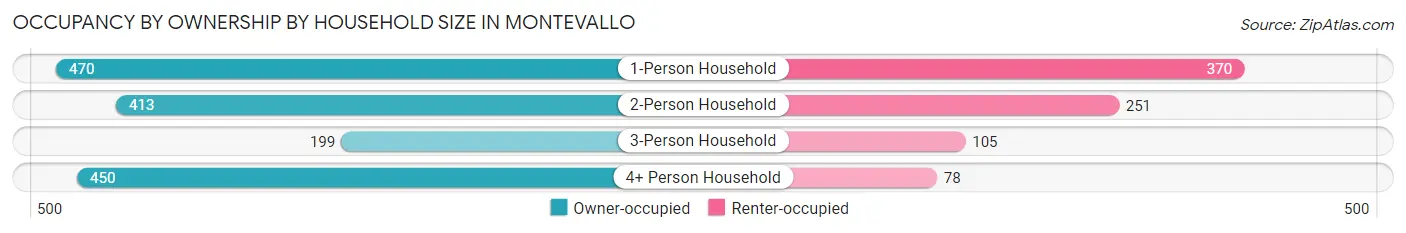
| Household Size | Owner-occupied | Renter-occupied |
| 1-Person Household | 470 (55.9%) | 370 (44.1%) |
| 2-Person Household | 413 (62.2%) | 251 (37.8%) |
| 3-Person Household | 199 (65.5%) | 105 (34.5%) |
| 4+ Person Household | 450 (85.2%) | 78 (14.8%) |
| Total Housing Units | 1,532 (65.6%) | 804 (34.4%) |
Occupancy by Educational Attainment in Montevallo
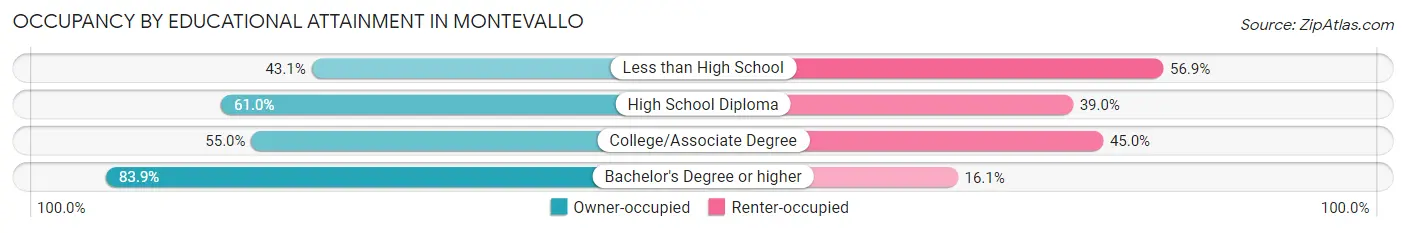
| Household Size | Owner-occupied | Renter-occupied |
| Less than High School | 69 (43.1%) | 91 (56.9%) |
| High School Diploma | 318 (61.0%) | 203 (39.0%) |
| College/Associate Degree | 464 (55.0%) | 379 (45.0%) |
| Bachelor's Degree or higher | 681 (83.9%) | 131 (16.1%) |
Occupancy by Age of Householder in Montevallo
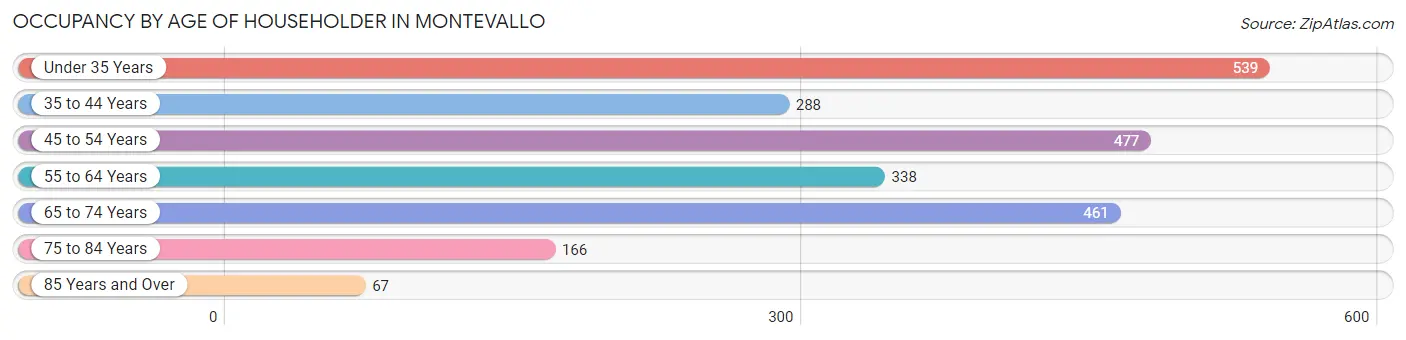
| Age Bracket | # Households | % Households |
| Under 35 Years | 539 | 23.1% |
| 35 to 44 Years | 288 | 12.3% |
| 45 to 54 Years | 477 | 20.4% |
| 55 to 64 Years | 338 | 14.5% |
| 65 to 74 Years | 461 | 19.7% |
| 75 to 84 Years | 166 | 7.1% |
| 85 Years and Over | 67 | 2.9% |
| Total | 2,336 | 100.0% |
Housing Finances in Montevallo
Median Income by Occupancy in Montevallo
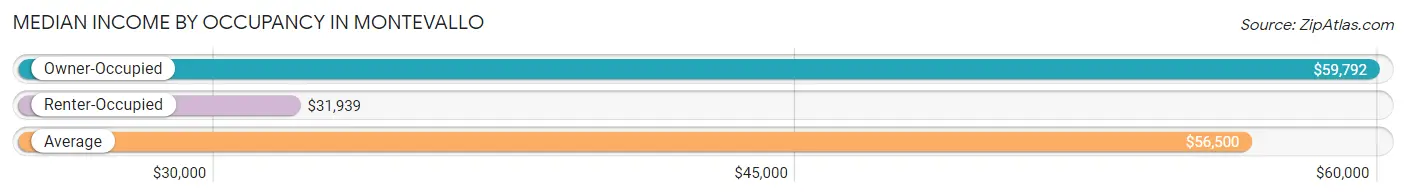
| Occupancy Type | # Households | Median Income |
| Owner-Occupied | 1,532 (65.6%) | $59,792 |
| Renter-Occupied | 804 (34.4%) | $31,939 |
| Average | 2,336 (100.0%) | $56,500 |
Occupancy by Householder Income Bracket in Montevallo
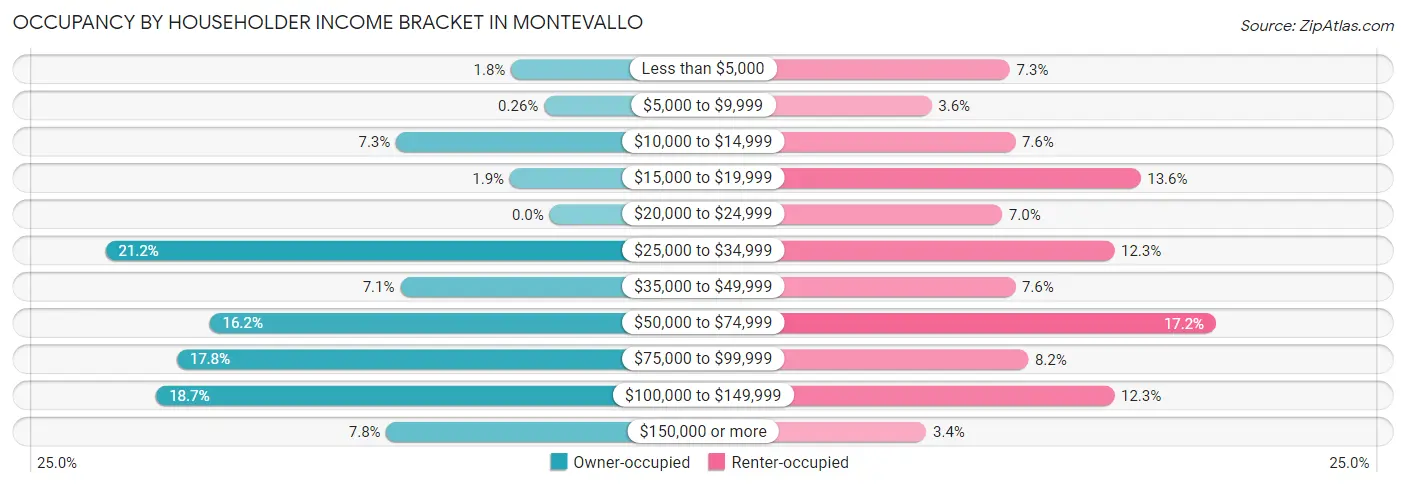
| Income Bracket | Owner-occupied | Renter-occupied |
| Less than $5,000 | 28 (1.8%) | 59 (7.3%) |
| $5,000 to $9,999 | 4 (0.3%) | 29 (3.6%) |
| $10,000 to $14,999 | 112 (7.3%) | 61 (7.6%) |
| $15,000 to $19,999 | 29 (1.9%) | 109 (13.6%) |
| $20,000 to $24,999 | 0 (0.0%) | 56 (7.0%) |
| $25,000 to $34,999 | 324 (21.1%) | 99 (12.3%) |
| $35,000 to $49,999 | 109 (7.1%) | 61 (7.6%) |
| $50,000 to $74,999 | 248 (16.2%) | 138 (17.2%) |
| $75,000 to $99,999 | 272 (17.7%) | 66 (8.2%) |
| $100,000 to $149,999 | 287 (18.7%) | 99 (12.3%) |
| $150,000 or more | 119 (7.8%) | 27 (3.4%) |
| Total | 1,532 (100.0%) | 804 (100.0%) |
Monthly Housing Cost Tiers in Montevallo
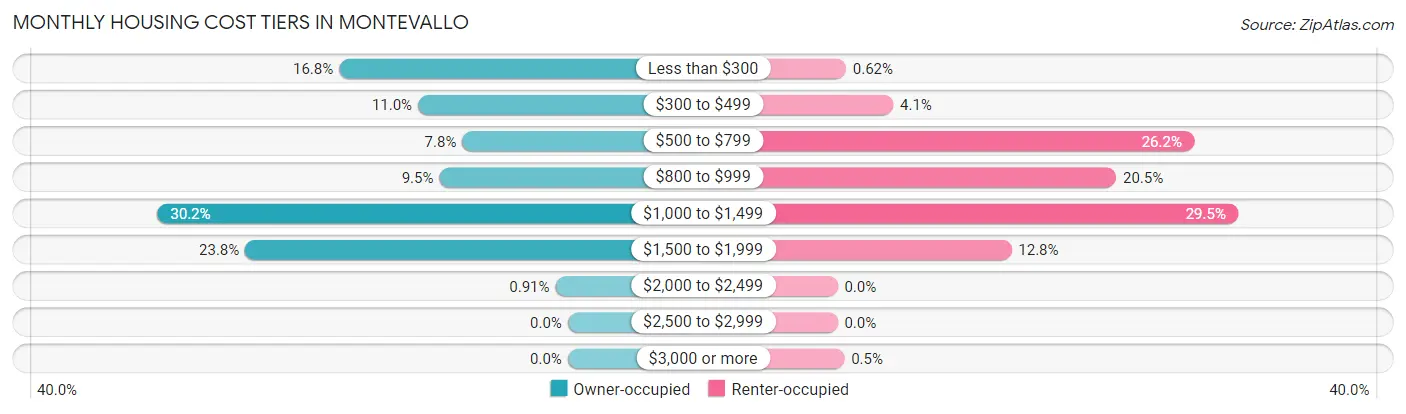
| Monthly Cost | Owner-occupied | Renter-occupied |
| Less than $300 | 258 (16.8%) | 5 (0.6%) |
| $300 to $499 | 169 (11.0%) | 33 (4.1%) |
| $500 to $799 | 119 (7.8%) | 211 (26.2%) |
| $800 to $999 | 145 (9.5%) | 165 (20.5%) |
| $1,000 to $1,499 | 463 (30.2%) | 237 (29.5%) |
| $1,500 to $1,999 | 364 (23.8%) | 103 (12.8%) |
| $2,000 to $2,499 | 14 (0.9%) | 0 (0.0%) |
| $2,500 to $2,999 | 0 (0.0%) | 0 (0.0%) |
| $3,000 or more | 0 (0.0%) | 4 (0.5%) |
| Total | 1,532 (100.0%) | 804 (100.0%) |
Physical Housing Characteristics in Montevallo
Housing Structures in Montevallo
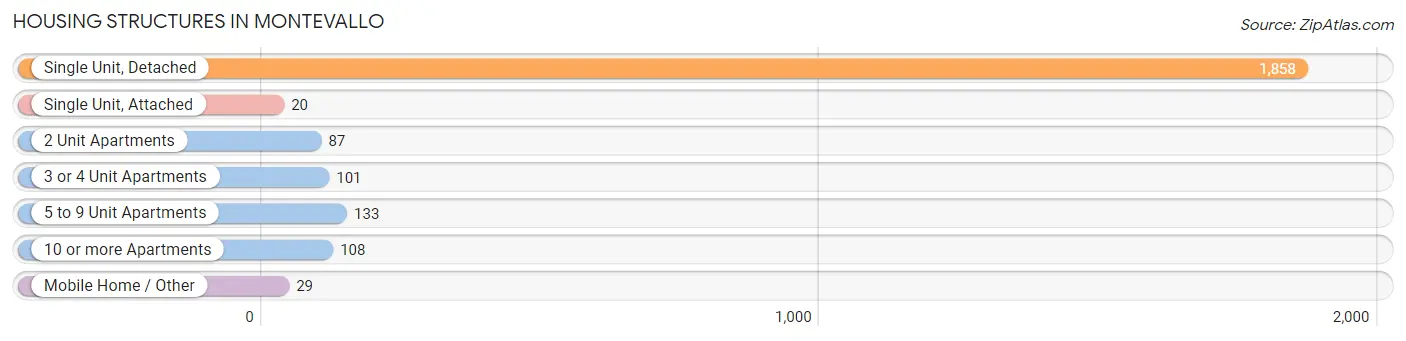
| Structure Type | # Housing Units | % Housing Units |
| Single Unit, Detached | 1,858 | 79.5% |
| Single Unit, Attached | 20 | 0.9% |
| 2 Unit Apartments | 87 | 3.7% |
| 3 or 4 Unit Apartments | 101 | 4.3% |
| 5 to 9 Unit Apartments | 133 | 5.7% |
| 10 or more Apartments | 108 | 4.6% |
| Mobile Home / Other | 29 | 1.2% |
| Total | 2,336 | 100.0% |
Housing Structures by Occupancy in Montevallo
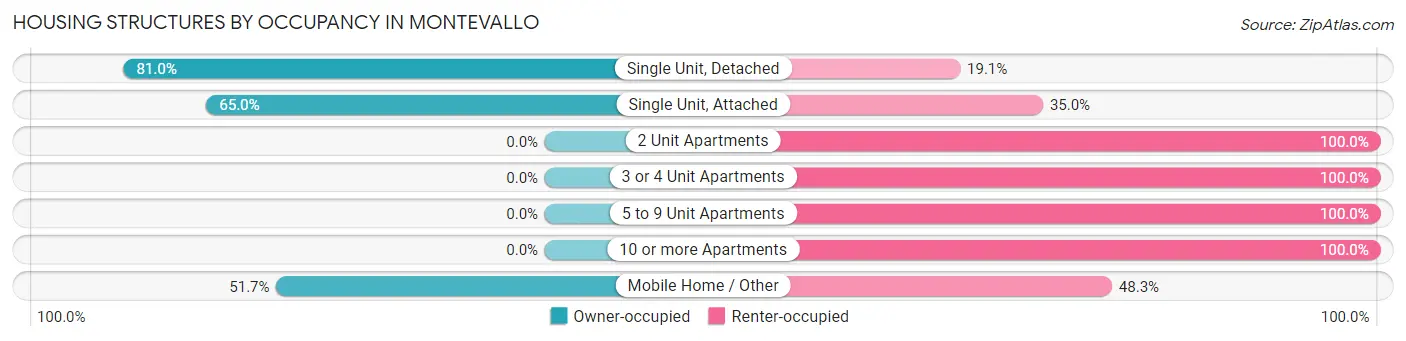
| Structure Type | Owner-occupied | Renter-occupied |
| Single Unit, Detached | 1,504 (80.9%) | 354 (19.1%) |
| Single Unit, Attached | 13 (65.0%) | 7 (35.0%) |
| 2 Unit Apartments | 0 (0.0%) | 87 (100.0%) |
| 3 or 4 Unit Apartments | 0 (0.0%) | 101 (100.0%) |
| 5 to 9 Unit Apartments | 0 (0.0%) | 133 (100.0%) |
| 10 or more Apartments | 0 (0.0%) | 108 (100.0%) |
| Mobile Home / Other | 15 (51.7%) | 14 (48.3%) |
| Total | 1,532 (65.6%) | 804 (34.4%) |
Housing Structures by Number of Rooms in Montevallo
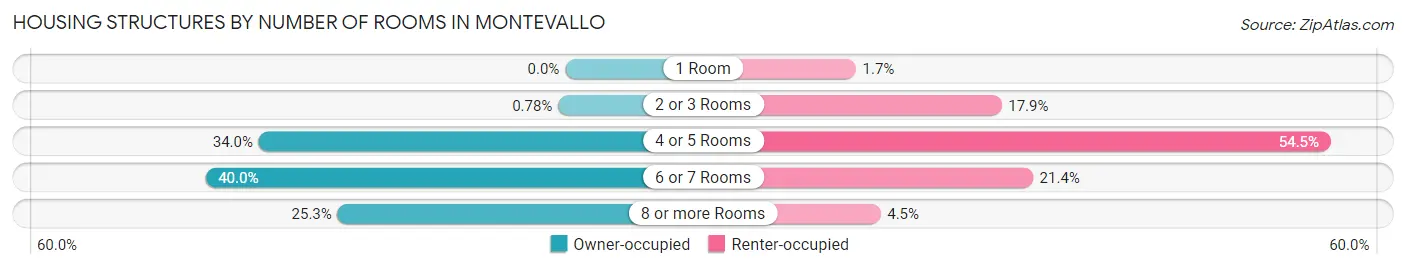
| Number of Rooms | Owner-occupied | Renter-occupied |
| 1 Room | 0 (0.0%) | 14 (1.7%) |
| 2 or 3 Rooms | 12 (0.8%) | 144 (17.9%) |
| 4 or 5 Rooms | 521 (34.0%) | 438 (54.5%) |
| 6 or 7 Rooms | 612 (40.0%) | 172 (21.4%) |
| 8 or more Rooms | 387 (25.3%) | 36 (4.5%) |
| Total | 1,532 (100.0%) | 804 (100.0%) |
Housing Structure by Heating Type in Montevallo
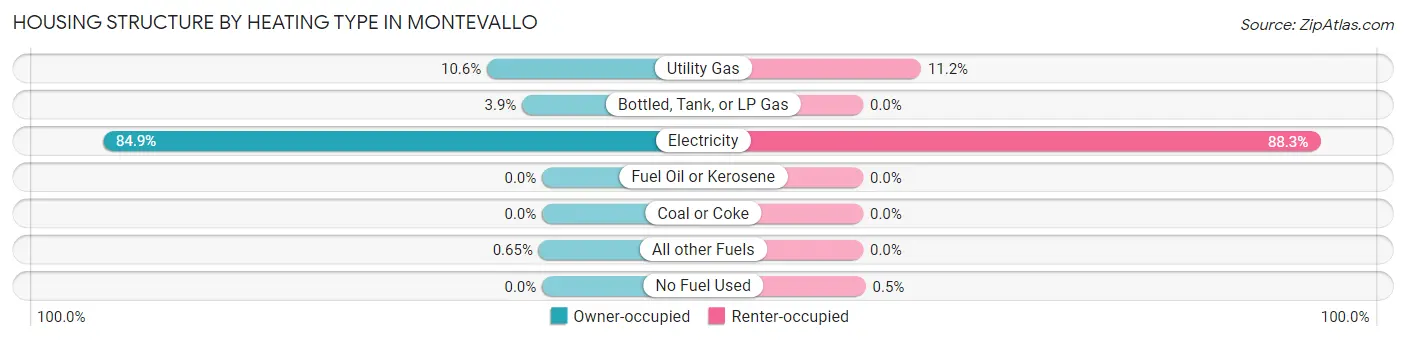
| Heating Type | Owner-occupied | Renter-occupied |
| Utility Gas | 163 (10.6%) | 90 (11.2%) |
| Bottled, Tank, or LP Gas | 59 (3.8%) | 0 (0.0%) |
| Electricity | 1,300 (84.9%) | 710 (88.3%) |
| Fuel Oil or Kerosene | 0 (0.0%) | 0 (0.0%) |
| Coal or Coke | 0 (0.0%) | 0 (0.0%) |
| All other Fuels | 10 (0.6%) | 0 (0.0%) |
| No Fuel Used | 0 (0.0%) | 4 (0.5%) |
| Total | 1,532 (100.0%) | 804 (100.0%) |
Household Vehicle Usage in Montevallo
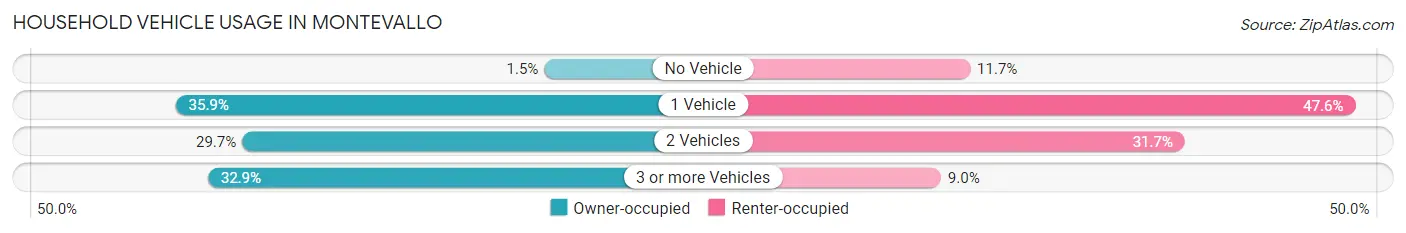
| Vehicles per Household | Owner-occupied | Renter-occupied |
| No Vehicle | 23 (1.5%) | 94 (11.7%) |
| 1 Vehicle | 550 (35.9%) | 383 (47.6%) |
| 2 Vehicles | 455 (29.7%) | 255 (31.7%) |
| 3 or more Vehicles | 504 (32.9%) | 72 (9.0%) |
| Total | 1,532 (100.0%) | 804 (100.0%) |
Real Estate & Mortgages in Montevallo
Real Estate and Mortgage Overview in Montevallo
| Characteristic | Without Mortgage | With Mortgage |
| Housing Units | 552 | 980 |
| Median Property Value | $163,800 | $207,300 |
| Median Household Income | $32,157 | $84 |
| Monthly Housing Costs | $325 | $0 |
| Real Estate Taxes | $720 | $131 |
Property Value by Mortgage Status in Montevallo
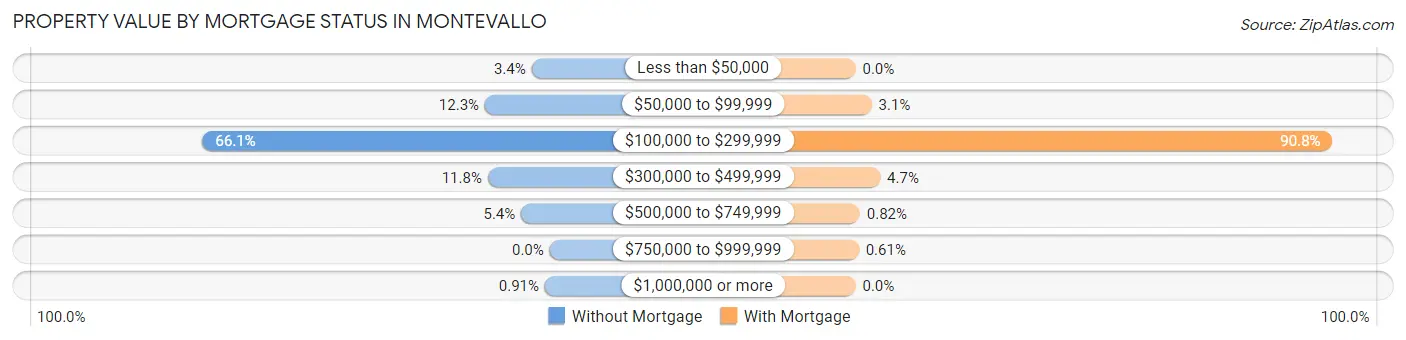
| Property Value | Without Mortgage | With Mortgage |
| Less than $50,000 | 19 (3.4%) | 0 (0.0%) |
| $50,000 to $99,999 | 68 (12.3%) | 30 (3.1%) |
| $100,000 to $299,999 | 365 (66.1%) | 890 (90.8%) |
| $300,000 to $499,999 | 65 (11.8%) | 46 (4.7%) |
| $500,000 to $749,999 | 30 (5.4%) | 8 (0.8%) |
| $750,000 to $999,999 | 0 (0.0%) | 6 (0.6%) |
| $1,000,000 or more | 5 (0.9%) | 0 (0.0%) |
| Total | 552 (100.0%) | 980 (100.0%) |
Household Income by Mortgage Status in Montevallo
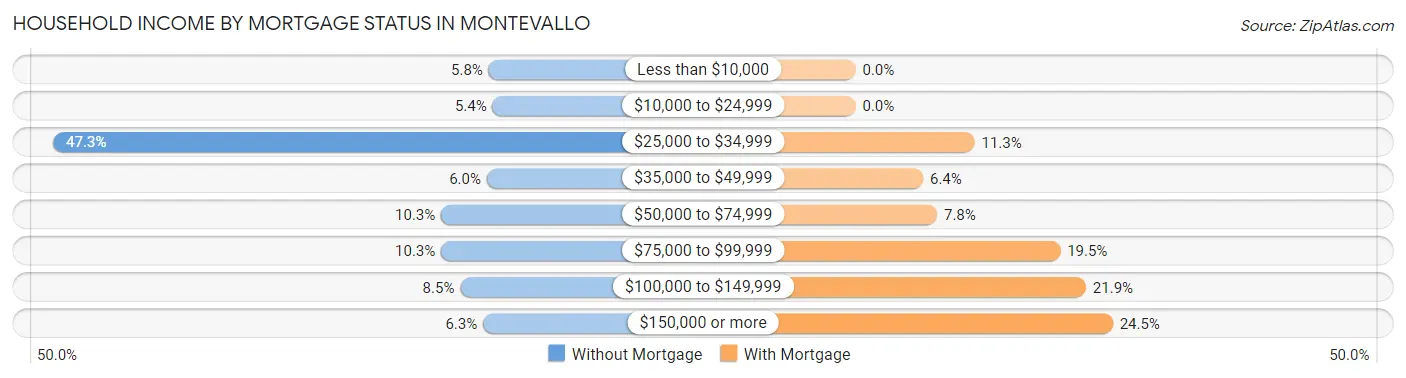
| Household Income | Without Mortgage | With Mortgage |
| Less than $10,000 | 32 (5.8%) | 0 (0.0%) |
| $10,000 to $24,999 | 30 (5.4%) | 0 (0.0%) |
| $25,000 to $34,999 | 261 (47.3%) | 111 (11.3%) |
| $35,000 to $49,999 | 33 (6.0%) | 63 (6.4%) |
| $50,000 to $74,999 | 57 (10.3%) | 76 (7.8%) |
| $75,000 to $99,999 | 57 (10.3%) | 191 (19.5%) |
| $100,000 to $149,999 | 47 (8.5%) | 215 (21.9%) |
| $150,000 or more | 35 (6.3%) | 240 (24.5%) |
| Total | 552 (100.0%) | 980 (100.0%) |
Property Value to Household Income Ratio in Montevallo
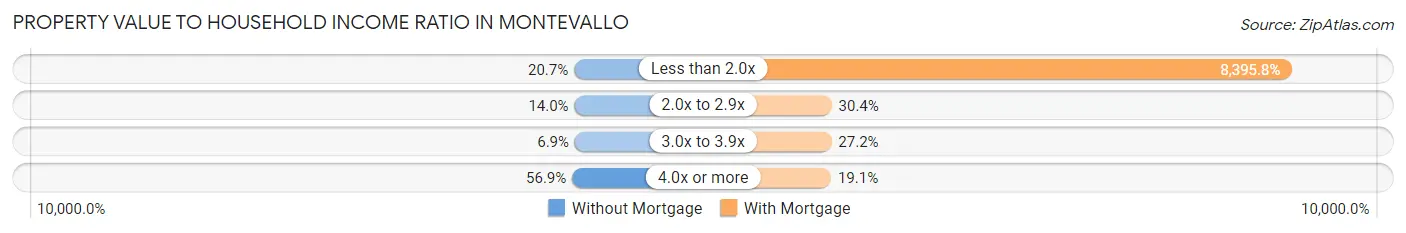
| Value-to-Income Ratio | Without Mortgage | With Mortgage |
| Less than 2.0x | 114 (20.6%) | 82,279 (8,395.8%) |
| 2.0x to 2.9x | 77 (14.0%) | 298 (30.4%) |
| 3.0x to 3.9x | 38 (6.9%) | 267 (27.2%) |
| 4.0x or more | 314 (56.9%) | 187 (19.1%) |
| Total | 552 (100.0%) | 980 (100.0%) |
Real Estate Taxes by Mortgage Status in Montevallo
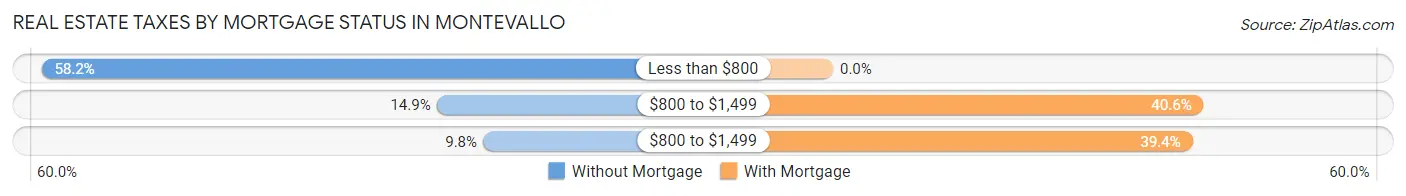
| Property Taxes | Without Mortgage | With Mortgage |
| Less than $800 | 321 (58.2%) | 0 (0.0%) |
| $800 to $1,499 | 82 (14.9%) | 398 (40.6%) |
| $800 to $1,499 | 54 (9.8%) | 386 (39.4%) |
| Total | 552 (100.0%) | 980 (100.0%) |
Health & Disability in Montevallo
Health Insurance Coverage by Age in Montevallo
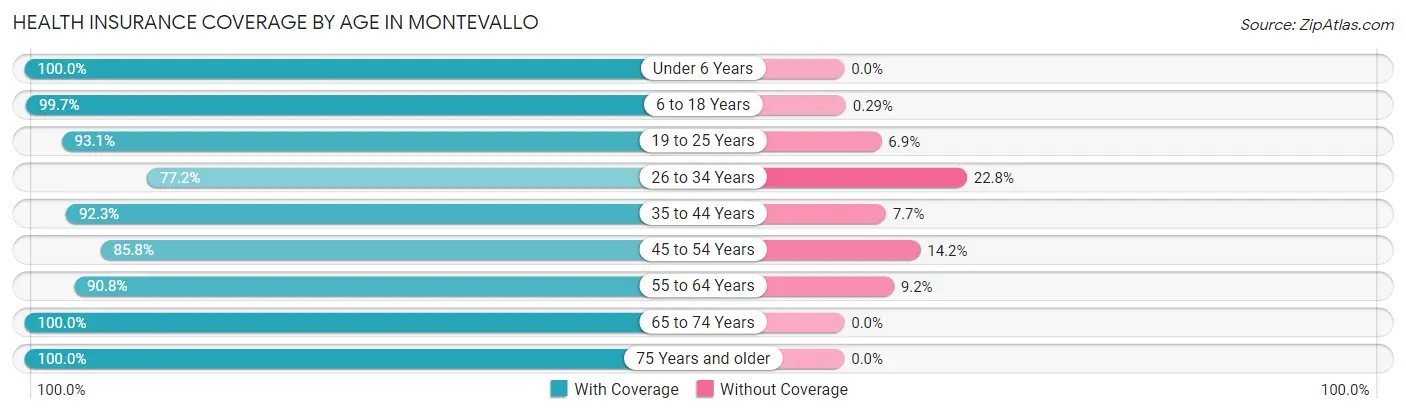
| Age Bracket | With Coverage | Without Coverage |
| Under 6 Years | 266 (100.0%) | 0 (0.0%) |
| 6 to 18 Years | 1,361 (99.7%) | 4 (0.3%) |
| 19 to 25 Years | 1,951 (93.1%) | 145 (6.9%) |
| 26 to 34 Years | 500 (77.2%) | 148 (22.8%) |
| 35 to 44 Years | 562 (92.3%) | 47 (7.7%) |
| 45 to 54 Years | 702 (85.8%) | 116 (14.2%) |
| 55 to 64 Years | 491 (90.8%) | 50 (9.2%) |
| 65 to 74 Years | 542 (100.0%) | 0 (0.0%) |
| 75 Years and older | 360 (100.0%) | 0 (0.0%) |
| Total | 6,735 (93.0%) | 510 (7.0%) |
Health Insurance Coverage by Citizenship Status in Montevallo
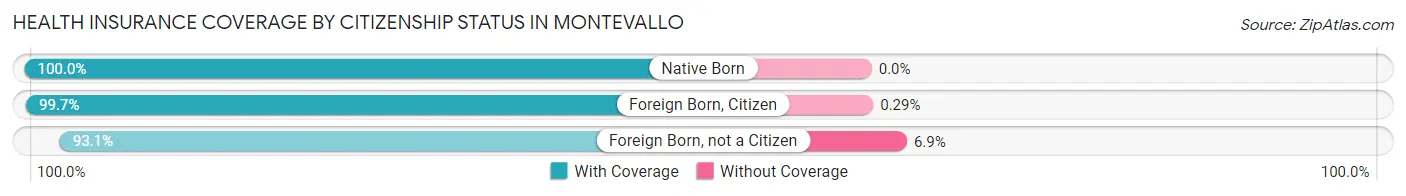
| Citizenship Status | With Coverage | Without Coverage |
| Native Born | 266 (100.0%) | 0 (0.0%) |
| Foreign Born, Citizen | 1,361 (99.7%) | 4 (0.3%) |
| Foreign Born, not a Citizen | 1,951 (93.1%) | 145 (6.9%) |
Health Insurance Coverage by Household Income in Montevallo
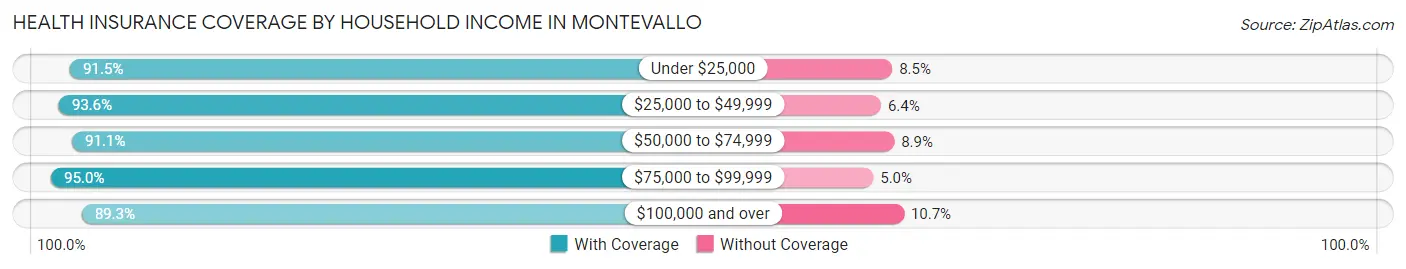
| Household Income | With Coverage | Without Coverage |
| Under $25,000 | 677 (91.5%) | 63 (8.5%) |
| $25,000 to $49,999 | 963 (93.6%) | 66 (6.4%) |
| $50,000 to $74,999 | 892 (91.1%) | 87 (8.9%) |
| $75,000 to $99,999 | 1,130 (95.0%) | 59 (5.0%) |
| $100,000 and over | 1,426 (89.3%) | 171 (10.7%) |
Public vs Private Health Insurance Coverage by Age in Montevallo
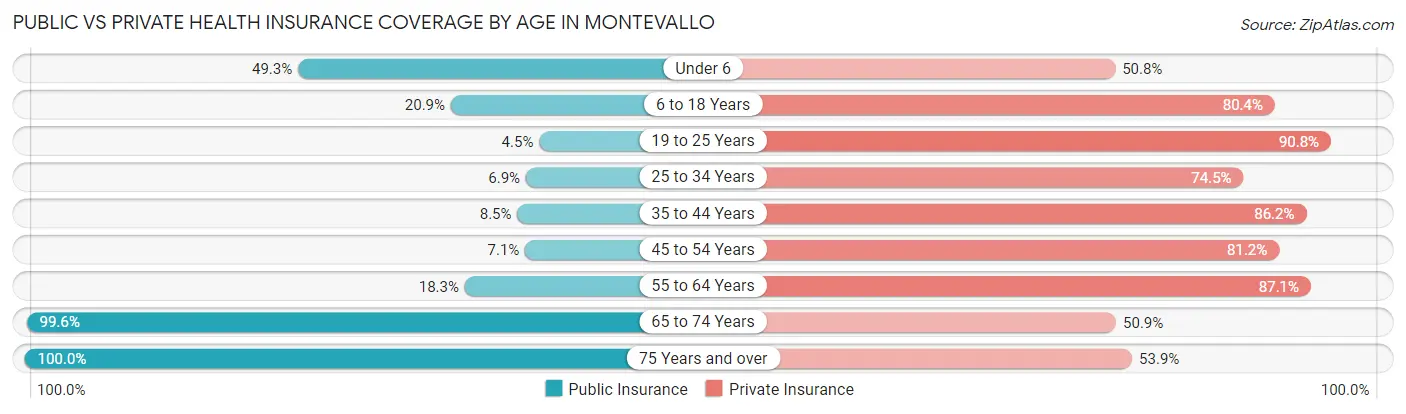
| Age Bracket | Public Insurance | Private Insurance |
| Under 6 | 131 (49.2%) | 135 (50.7%) |
| 6 to 18 Years | 285 (20.9%) | 1,097 (80.4%) |
| 19 to 25 Years | 94 (4.5%) | 1,903 (90.8%) |
| 25 to 34 Years | 45 (6.9%) | 483 (74.5%) |
| 35 to 44 Years | 52 (8.5%) | 525 (86.2%) |
| 45 to 54 Years | 58 (7.1%) | 664 (81.2%) |
| 55 to 64 Years | 99 (18.3%) | 471 (87.1%) |
| 65 to 74 Years | 540 (99.6%) | 276 (50.9%) |
| 75 Years and over | 360 (100.0%) | 194 (53.9%) |
| Total | 1,664 (23.0%) | 5,748 (79.3%) |
Disability Status by Sex by Age in Montevallo
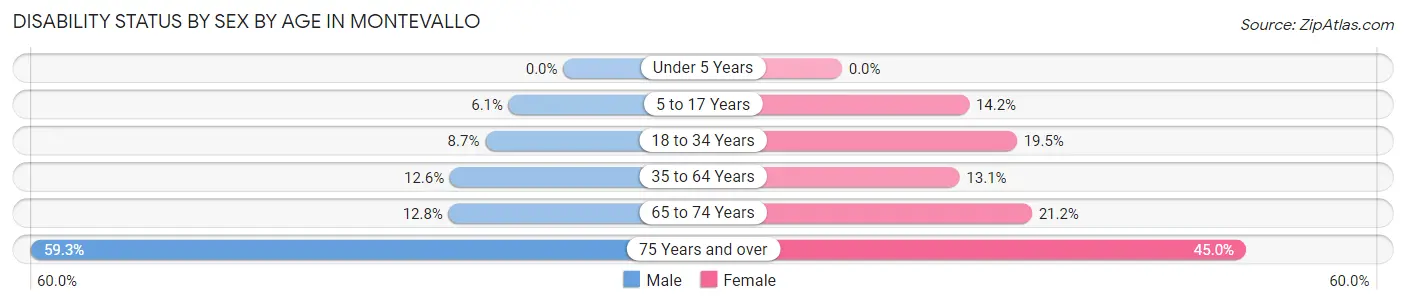
| Age Bracket | Male | Female |
| Under 5 Years | 0 (0.0%) | 0 (0.0%) |
| 5 to 17 Years | 26 (6.1%) | 67 (14.2%) |
| 18 to 34 Years | 104 (8.7%) | 406 (19.5%) |
| 35 to 64 Years | 127 (12.6%) | 126 (13.1%) |
| 65 to 74 Years | 36 (12.8%) | 55 (21.1%) |
| 75 Years and over | 83 (59.3%) | 99 (45.0%) |
Disability Class by Sex by Age in Montevallo
Disability Class: Hearing Difficulty
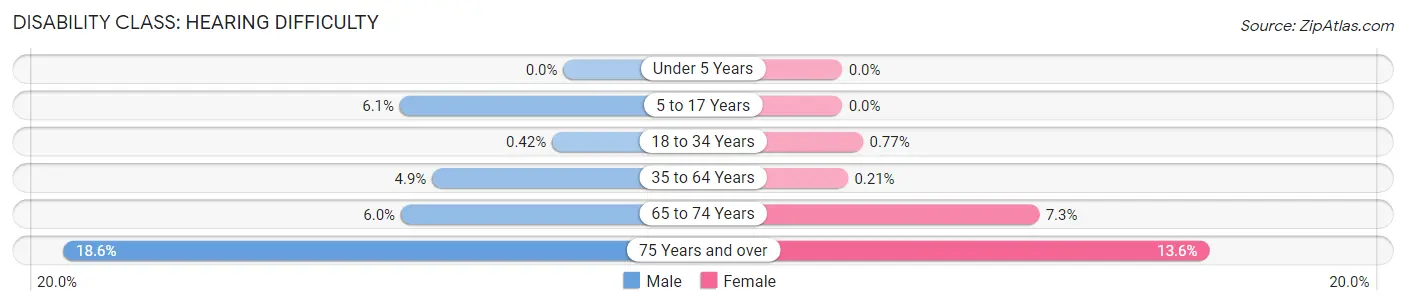
| Age Bracket | Male | Female |
| Under 5 Years | 0 (0.0%) | 0 (0.0%) |
| 5 to 17 Years | 26 (6.1%) | 0 (0.0%) |
| 18 to 34 Years | 5 (0.4%) | 16 (0.8%) |
| 35 to 64 Years | 49 (4.9%) | 2 (0.2%) |
| 65 to 74 Years | 17 (6.0%) | 19 (7.3%) |
| 75 Years and over | 26 (18.6%) | 30 (13.6%) |
Disability Class: Vision Difficulty
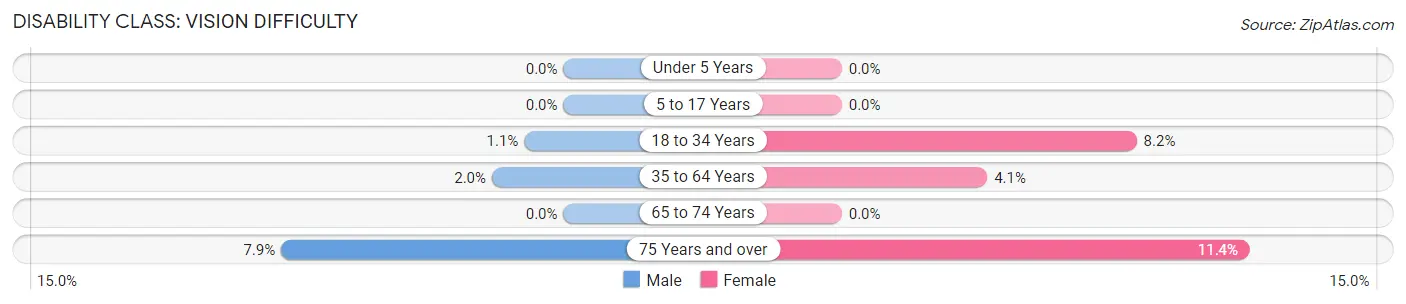
| Age Bracket | Male | Female |
| Under 5 Years | 0 (0.0%) | 0 (0.0%) |
| 5 to 17 Years | 0 (0.0%) | 0 (0.0%) |
| 18 to 34 Years | 13 (1.1%) | 171 (8.2%) |
| 35 to 64 Years | 20 (2.0%) | 39 (4.1%) |
| 65 to 74 Years | 0 (0.0%) | 0 (0.0%) |
| 75 Years and over | 11 (7.9%) | 25 (11.4%) |
Disability Class: Cognitive Difficulty
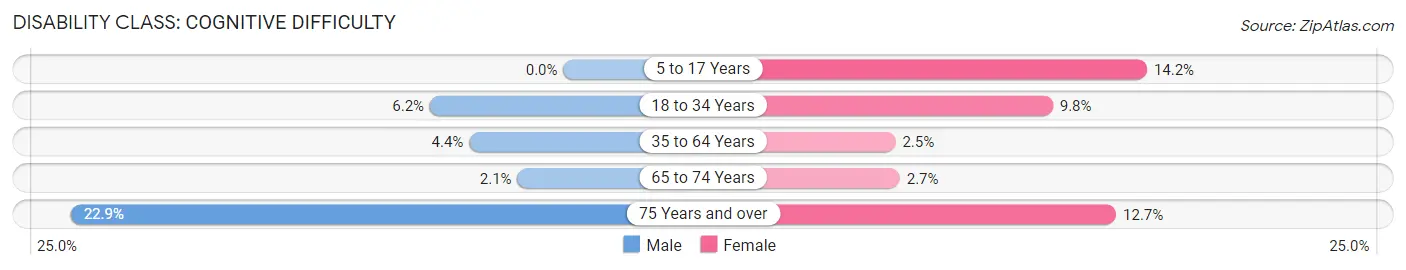
| Age Bracket | Male | Female |
| 5 to 17 Years | 0 (0.0%) | 67 (14.2%) |
| 18 to 34 Years | 74 (6.2%) | 204 (9.8%) |
| 35 to 64 Years | 44 (4.4%) | 24 (2.5%) |
| 65 to 74 Years | 6 (2.1%) | 7 (2.7%) |
| 75 Years and over | 32 (22.9%) | 28 (12.7%) |
Disability Class: Ambulatory Difficulty
| Age Bracket | Male | Female |
| 5 to 17 Years | 0 (0.0%) | 0 (0.0%) |
| 18 to 34 Years | 45 (3.8%) | 46 (2.2%) |
| 35 to 64 Years | 74 (7.4%) | 106 (11.0%) |
| 65 to 74 Years | 19 (6.7%) | 37 (14.2%) |
| 75 Years and over | 50 (35.7%) | 79 (35.9%) |
Disability Class: Self-Care Difficulty
| Age Bracket | Male | Female |
| 5 to 17 Years | 0 (0.0%) | 0 (0.0%) |
| 18 to 34 Years | 38 (3.2%) | 0 (0.0%) |
| 35 to 64 Years | 14 (1.4%) | 13 (1.3%) |
| 65 to 74 Years | 0 (0.0%) | 4 (1.5%) |
| 75 Years and over | 19 (13.6%) | 31 (14.1%) |
Technology Access in Montevallo
Computing Device Access in Montevallo
| Device Type | # Households | % Households |
| Desktop or Laptop | 1,880 | 80.5% |
| Smartphone | 2,055 | 88.0% |
| Tablet | 1,559 | 66.7% |
| No Computing Device | 120 | 5.1% |
| Total | 2,336 | 100.0% |
Internet Access in Montevallo
| Internet Type | # Households | % Households |
| Dial-Up Internet | 0 | 0.0% |
| Broadband Home | 1,683 | 72.1% |
| Cellular Data Only | 290 | 12.4% |
| Satellite Internet | 116 | 5.0% |
| No Internet | 287 | 12.3% |
| Total | 2,336 | 100.0% |
Montevallo Summary
Montevallo, Alabama is a small city located in the heart of the state, about 30 miles south of Birmingham. It is the county seat of Shelby County and is home to the University of Montevallo. The city has a population of 6,264 as of the 2010 census.
History
Montevallo was founded in 1823 and was originally known as “Mountain Valley”. The city was named after the Spanish word for “mountain valley”. The city was incorporated in 1848 and was the first city in Shelby County. The city was a major center for the Confederate Army during the Civil War. After the war, the city was home to a number of industries, including a cotton mill, a grist mill, and a sawmill.
In 1896, the Alabama Girls’ Industrial School (now the University of Montevallo) was founded in the city. The school was the first state-supported college for women in the United States. The school was later renamed the Alabama College for Women and then the University of Montevallo.
Geography
Montevallo is located in central Alabama, about 30 miles south of Birmingham. The city is situated in the foothills of the Appalachian Mountains and is surrounded by rolling hills and forests. The city is located at the intersection of US Highway 31 and Alabama Highway 119.
The city has a total area of 8.2 square miles, of which 8.1 square miles is land and 0.1 square miles is water. The city is located in the humid subtropical climate zone and has hot, humid summers and mild winters.
Economy
Montevallo’s economy is largely driven by the University of Montevallo, which is the city’s largest employer. Other major employers in the city include the Shelby County Board of Education, the Shelby County government, and the Montevallo Medical Center.
The city is also home to a number of small businesses, including restaurants, retail stores, and professional services. The city is also home to a number of manufacturing companies, including a furniture manufacturer and a metal fabrication company.
Demographics
As of the 2010 census, Montevallo had a population of 6,264. The racial makeup of the city was 79.2% White, 16.2% African American, 0.4% Native American, 1.2% Asian, 0.1% Pacific Islander, 1.2% from other races, and 1.9% from two or more races. Hispanic or Latino of any race were 3.2% of the population.
The median income for a household in the city was $37,917, and the median income for a family was $48,958. The per capita income for the city was $19,945. About 15.2% of families and 20.2% of the population were below the poverty line, including 28.2% of those under age 18 and 8.2% of those age 65 or over.
Common Questions
What is Per Capita Income in Montevallo?
Per Capita income in Montevallo is $23,734.
What is the Median Family Income in Montevallo?
Median Family Income in Montevallo is $83,141.
What is the Median Household income in Montevallo?
Median Household Income in Montevallo is $56,500.
What is Income or Wage Gap in Montevallo?
Income or Wage Gap in Montevallo is 71.0%.
Women in Montevallo earn 29.0 cents for every dollar earned by a man.
What is Inequality or Gini Index in Montevallo?
Inequality or Gini Index in Montevallo is 0.42.
What is the Total Population of Montevallo?
Total Population of Montevallo is 7,288.
What is the Total Male Population of Montevallo?
Total Male Population of Montevallo is 3,096.
What is the Total Female Population of Montevallo?
Total Female Population of Montevallo is 4,192.
What is the Ratio of Males per 100 Females in Montevallo?
There are 73.85 Males per 100 Females in Montevallo.
What is the Ratio of Females per 100 Males in Montevallo?
There are 135.40 Females per 100 Males in Montevallo.
What is the Median Population Age in Montevallo?
Median Population Age in Montevallo is 25.1 Years.
What is the Average Family Size in Montevallo
Average Family Size in Montevallo is 3.1 People.
What is the Average Household Size in Montevallo
Average Household Size in Montevallo is 2.4 People.
How Large is the Labor Force in Montevallo?
There are 3,801 People in the Labor Forcein in Montevallo.
What is the Percentage of People in the Labor Force in Montevallo?
59.8% of People are in the Labor Force in Montevallo.
What is the Unemployment Rate in Montevallo?
Unemployment Rate in Montevallo is 11.5%.