Hackneyville, AL Map & Demographics
Hackneyville Map
Hackneyville Overview
$16,903
PER CAPITA INCOME
$68,452
AVG FAMILY INCOME
24.1%
WAGE / INCOME GAP [ % ]
75.9¢/ $1
WAGE / INCOME GAP [ $ ]
0.47
INEQUALITY / GINI INDEX
594
TOTAL POPULATION
296
MALE POPULATION
298
FEMALE POPULATION
99.33
MALES / 100 FEMALES
100.68
FEMALES / 100 MALES
29.4
MEDIAN AGE
3.7
AVG FAMILY SIZE
3.3
AVG HOUSEHOLD SIZE
177
LABOR FORCE [ PEOPLE ]
52.1%
PERCENT IN LABOR FORCE
13.0%
UNEMPLOYMENT RATE
Income in Hackneyville
Income Overview in Hackneyville
| Characteristic | Number | Measure |
| Per Capita Income | 594 | $16,903 |
| Median Family Income | 154 | $68,452 |
| Mean Family Income | 154 | $62,387 |
| Median Household Income | 182 | $0 |
| Mean Household Income | 182 | $56,159 |
| Income Deficit | 154 | $0 |
| Wage / Income Gap (%) | 594 | 24.07% |
| Wage / Income Gap ($) | 594 | 75.93¢ per $1 |
| Gini / Inequality Index | 594 | 0.47 |
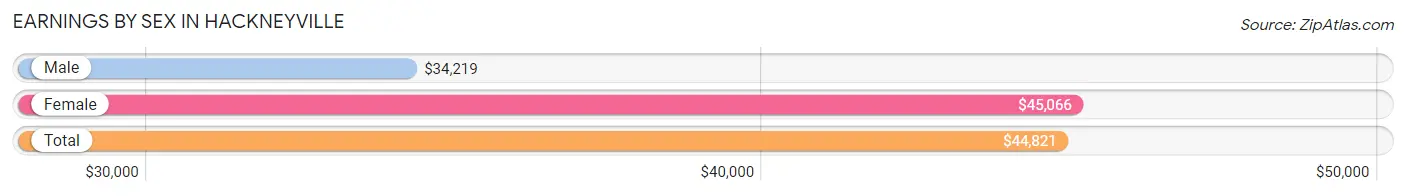
Earnings by Sex in Hackneyville
Average Earnings in Hackneyville are $44,821, $34,219 for men and $45,066 for women, a difference of 24.1%.
| Sex | Number | Average Earnings |
| Male | 53 (34.4%) | $34,219 |
| Female | 101 (65.6%) | $45,066 |
| Total | 154 (100.0%) | $44,821 |
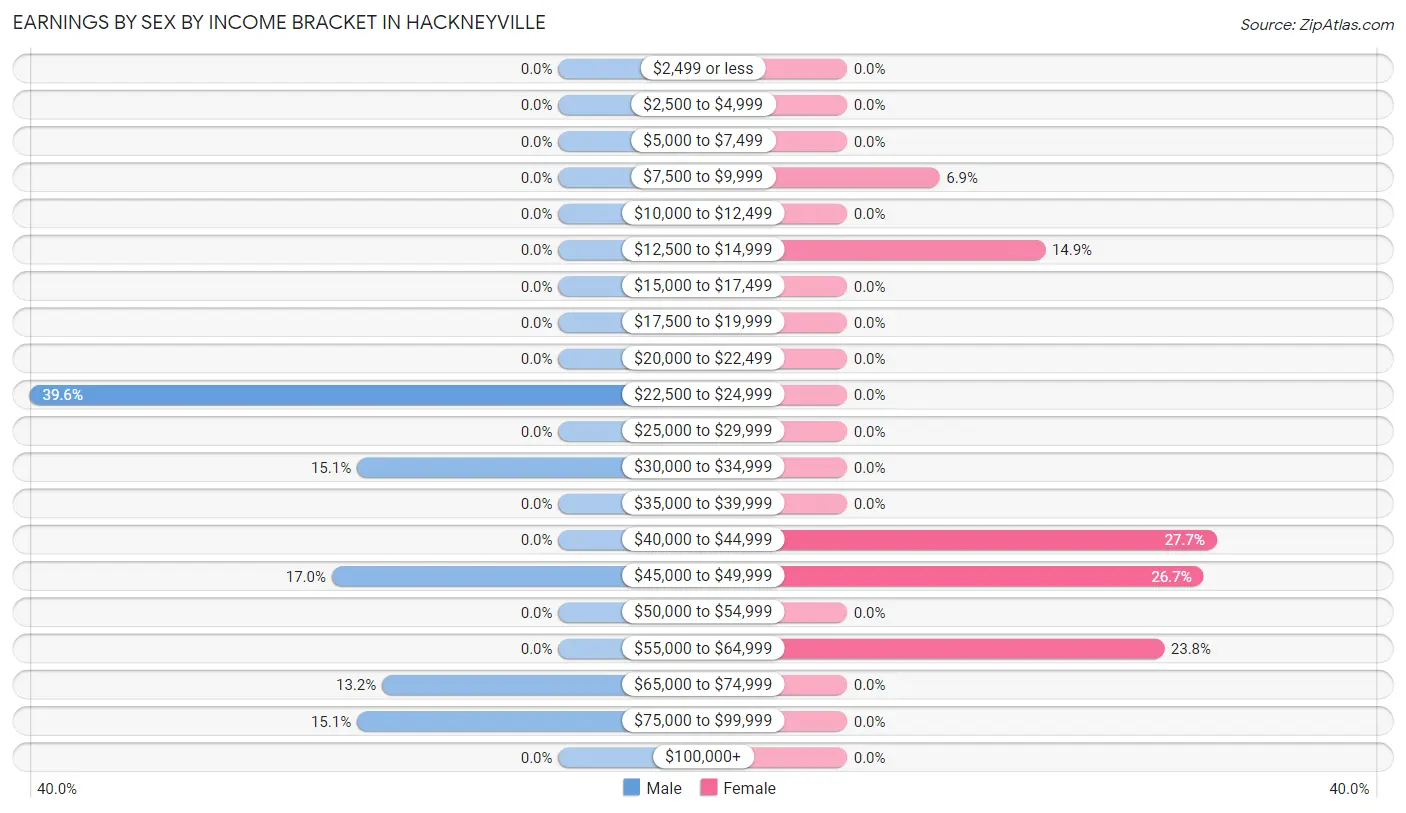
Earnings by Sex by Income Bracket in Hackneyville
The most common earnings brackets in Hackneyville are $22,500 to $24,999 for men (21 | 39.6%) and $40,000 to $44,999 for women (28 | 27.7%).
| Income | Male | Female |
| $2,499 or less | 0 (0.0%) | 0 (0.0%) |
| $2,500 to $4,999 | 0 (0.0%) | 0 (0.0%) |
| $5,000 to $7,499 | 0 (0.0%) | 0 (0.0%) |
| $7,500 to $9,999 | 0 (0.0%) | 7 (6.9%) |
| $10,000 to $12,499 | 0 (0.0%) | 0 (0.0%) |
| $12,500 to $14,999 | 0 (0.0%) | 15 (14.8%) |
| $15,000 to $17,499 | 0 (0.0%) | 0 (0.0%) |
| $17,500 to $19,999 | 0 (0.0%) | 0 (0.0%) |
| $20,000 to $22,499 | 0 (0.0%) | 0 (0.0%) |
| $22,500 to $24,999 | 21 (39.6%) | 0 (0.0%) |
| $25,000 to $29,999 | 0 (0.0%) | 0 (0.0%) |
| $30,000 to $34,999 | 8 (15.1%) | 0 (0.0%) |
| $35,000 to $39,999 | 0 (0.0%) | 0 (0.0%) |
| $40,000 to $44,999 | 0 (0.0%) | 28 (27.7%) |
| $45,000 to $49,999 | 9 (17.0%) | 27 (26.7%) |
| $50,000 to $54,999 | 0 (0.0%) | 0 (0.0%) |
| $55,000 to $64,999 | 0 (0.0%) | 24 (23.8%) |
| $65,000 to $74,999 | 7 (13.2%) | 0 (0.0%) |
| $75,000 to $99,999 | 8 (15.1%) | 0 (0.0%) |
| $100,000+ | 0 (0.0%) | 0 (0.0%) |
| Total | 53 (100.0%) | 101 (100.0%) |
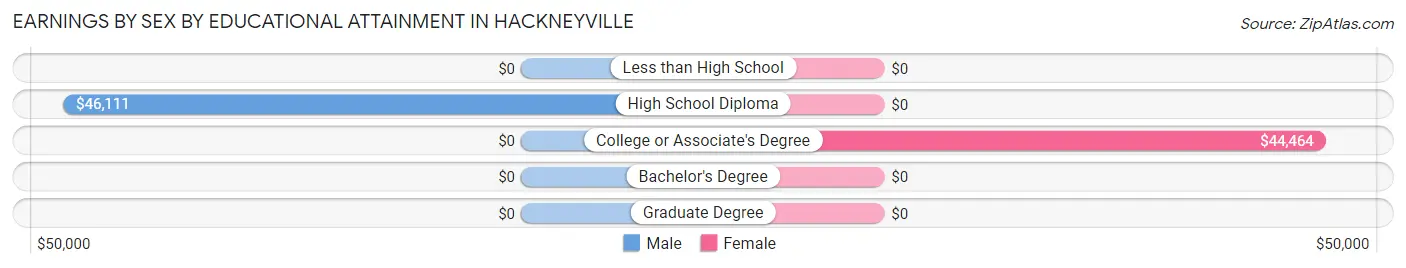
Earnings by Sex by Educational Attainment in Hackneyville
Average earnings in Hackneyville are $34,219 for men and $45,066 for women, a difference of 24.1%. Men with an educational attainment of high school diploma enjoy the highest average annual earnings of $46,111, while those with high school diploma education earn the least with $46,111. Women with an educational attainment of college or associate's degree earn the most with the average annual earnings of $44,464, while those with college or associate's degree education have the smallest earnings of $44,464.
| Educational Attainment | Male Income | Female Income |
| Less than High School | - | - |
| High School Diploma | $46,111 | $0 |
| College or Associate's Degree | - | - |
| Bachelor's Degree | - | - |
| Graduate Degree | - | - |
| Total | $34,219 | $45,066 |
Family Income in Hackneyville
Family Income Brackets in Hackneyville
According to the Hackneyville family income data, there are 38 families falling into the $75,000 to $99,999 income range, which is the most common income bracket and makes up 24.7% of all families.
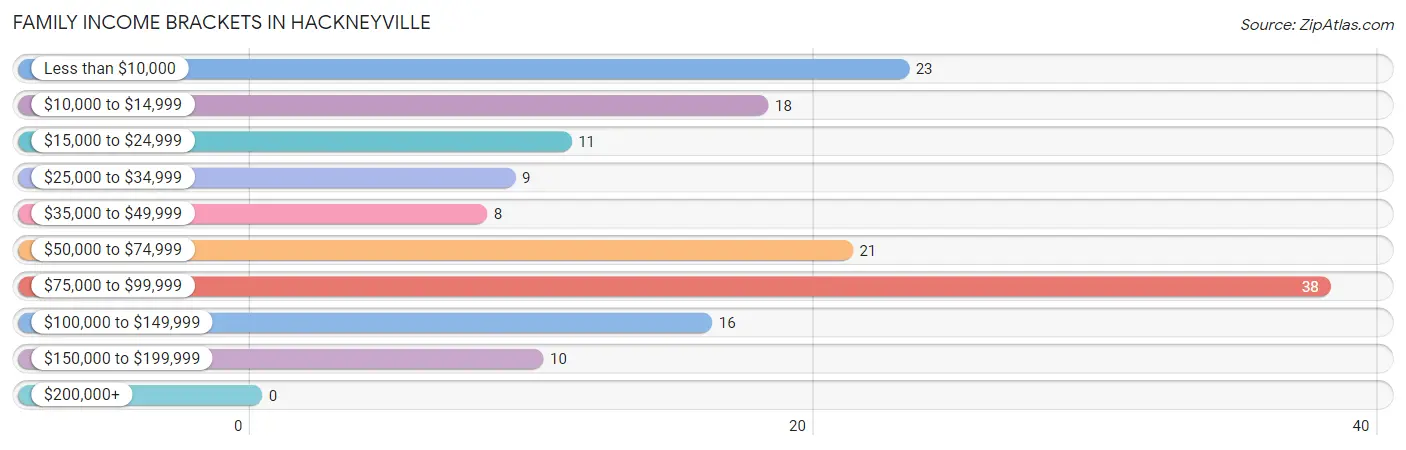
| Income Bracket | # Families | % Families |
| Less than $10,000 | 23 | 14.9% |
| $10,000 to $14,999 | 18 | 11.7% |
| $15,000 to $24,999 | 11 | 7.1% |
| $25,000 to $34,999 | 9 | 5.8% |
| $35,000 to $49,999 | 8 | 5.2% |
| $50,000 to $74,999 | 21 | 13.6% |
| $75,000 to $99,999 | 38 | 24.7% |
| $100,000 to $149,999 | 16 | 10.4% |
| $150,000 to $199,999 | 10 | 6.5% |
| $200,000+ | 0 | 0.0% |
Family Income by Famaliy Size in Hackneyville
| Income Bracket | # Families | Median Income |
| 2-Person Families | 53 (34.4%) | $0 |
| 3-Person Families | 33 (21.4%) | $0 |
| 4-Person Families | 8 (5.2%) | $0 |
| 5-Person Families | 39 (25.3%) | $0 |
| 6-Person Families | 0 (0.0%) | $0 |
| 7+ Person Families | 21 (13.6%) | $0 |
| Total | 154 (100.0%) | $68,452 |
Family Income by Number of Earners in Hackneyville
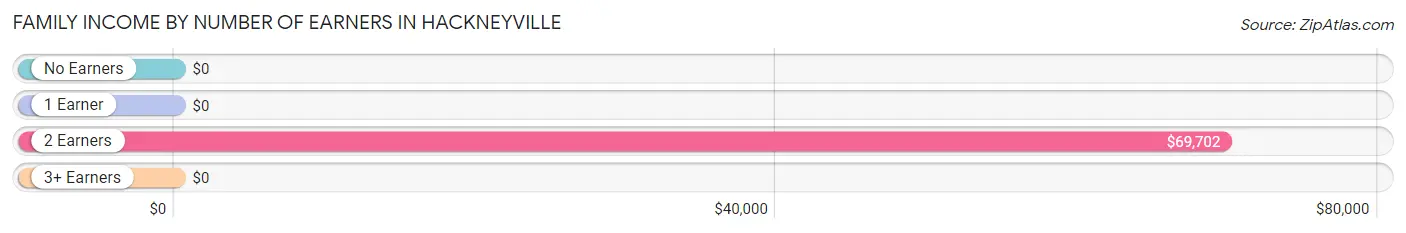
| Number of Earners | # Families | Median Income |
| No Earners | 59 (38.3%) | $0 |
| 1 Earner | 48 (31.2%) | $0 |
| 2 Earners | 37 (24.0%) | $69,702 |
| 3+ Earners | 10 (6.5%) | $0 |
| Total | 154 (100.0%) | $68,452 |
Household Income in Hackneyville
Household Income Brackets in Hackneyville
With 38 households falling in the category, the $75,000 to $99,999 income range is the most frequent in Hackneyville, accounting for 20.9% of all households.
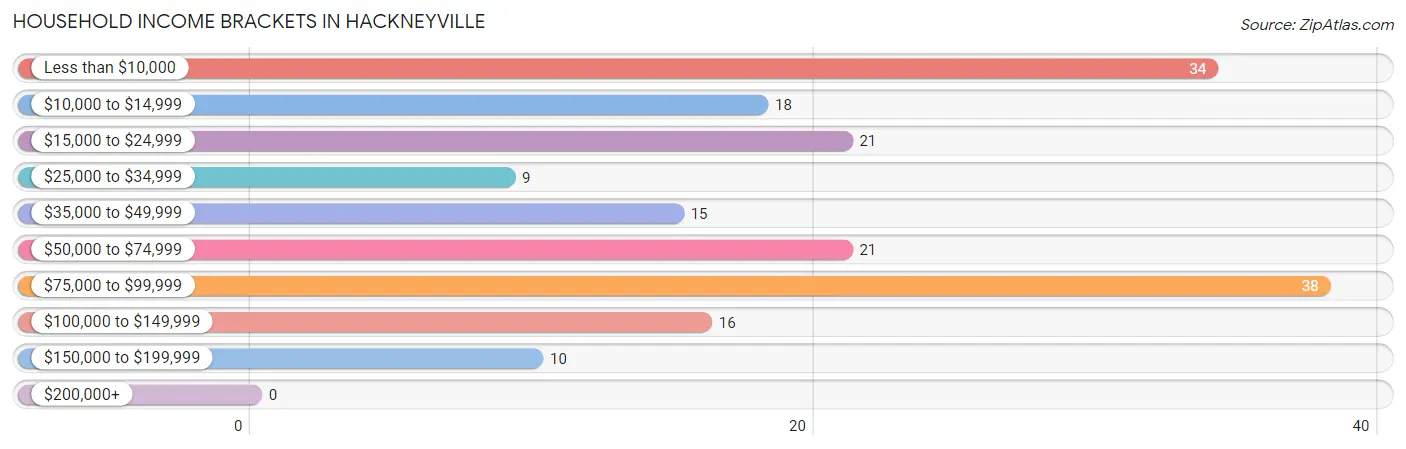
| Income Bracket | # Households | % Households |
| Less than $10,000 | 34 | 18.7% |
| $10,000 to $14,999 | 18 | 9.9% |
| $15,000 to $24,999 | 21 | 11.5% |
| $25,000 to $34,999 | 9 | 4.9% |
| $35,000 to $49,999 | 15 | 8.2% |
| $50,000 to $74,999 | 21 | 11.5% |
| $75,000 to $99,999 | 38 | 20.9% |
| $100,000 to $149,999 | 16 | 8.8% |
| $150,000 to $199,999 | 10 | 5.5% |
| $200,000+ | 0 | 0.0% |
Household Income by Householder Age in Hackneyville
The median household income in Hackneyville is $0, with the highest median household income of $42,969 found in the 65+ years age bracket for the primary householder. A total of 43 households (23.6%) fall into this category.
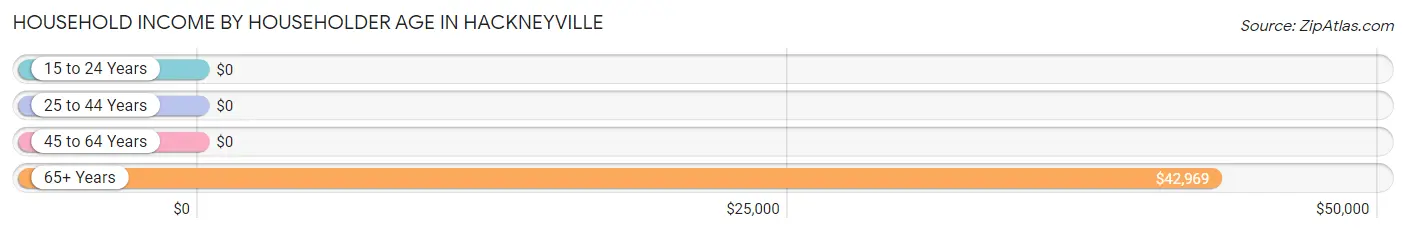
| Income Bracket | # Households | Median Income |
| 15 to 24 Years | 0 (0.0%) | $0 |
| 25 to 44 Years | 91 (50.0%) | $0 |
| 45 to 64 Years | 48 (26.4%) | $0 |
| 65+ Years | 43 (23.6%) | $42,969 |
| Total | 182 (100.0%) | $0 |
Poverty in Hackneyville
Income Below Poverty by Sex and Age in Hackneyville
With 9.1% poverty level for males and 36.2% for females among the residents of Hackneyville, under 5 year old males and 6 to 11 year old females are the most vulnerable to poverty, with 9 males (45.0%) and 53 females (82.8%) in their respective age groups living below the poverty level.
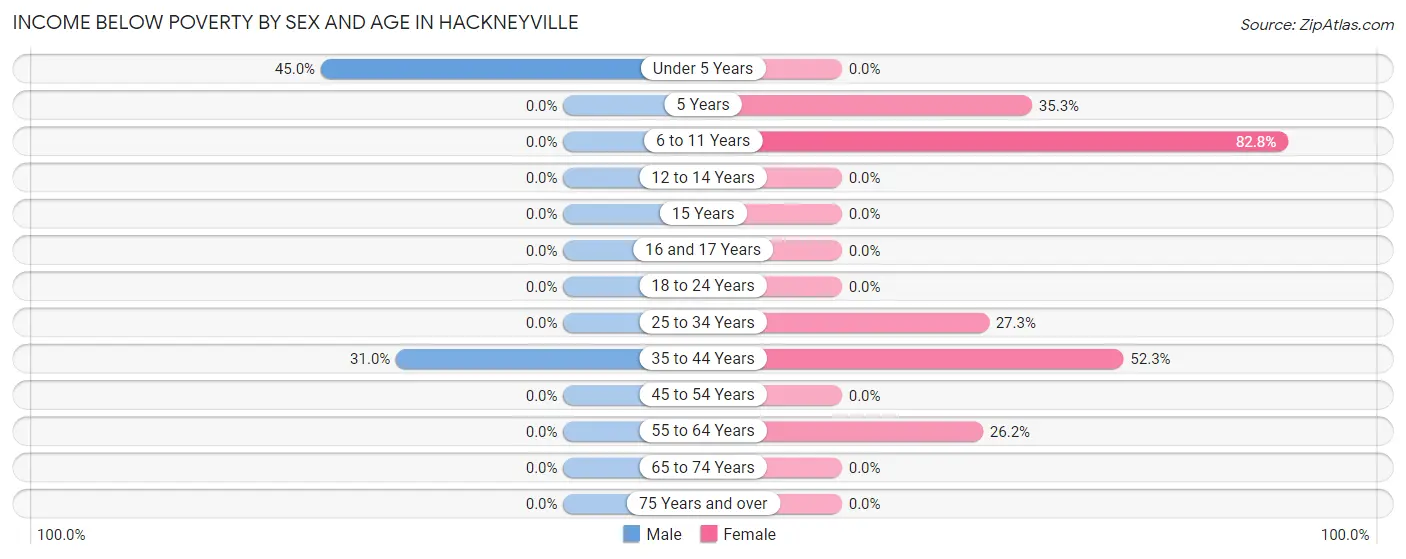
| Age Bracket | Male | Female |
| Under 5 Years | 9 (45.0%) | 0 (0.0%) |
| 5 Years | 0 (0.0%) | 6 (35.3%) |
| 6 to 11 Years | 0 (0.0%) | 53 (82.8%) |
| 12 to 14 Years | 0 (0.0%) | 0 (0.0%) |
| 15 Years | 0 (0.0%) | 0 (0.0%) |
| 16 and 17 Years | 0 (0.0%) | 0 (0.0%) |
| 18 to 24 Years | 0 (0.0%) | 0 (0.0%) |
| 25 to 34 Years | 0 (0.0%) | 15 (27.3%) |
| 35 to 44 Years | 18 (31.0%) | 23 (52.3%) |
| 45 to 54 Years | 0 (0.0%) | 0 (0.0%) |
| 55 to 64 Years | 0 (0.0%) | 11 (26.2%) |
| 65 to 74 Years | 0 (0.0%) | 0 (0.0%) |
| 75 Years and over | 0 (0.0%) | 0 (0.0%) |
| Total | 27 (9.1%) | 108 (36.2%) |
Income Above Poverty by Sex and Age in Hackneyville
According to the poverty statistics in Hackneyville, males aged 5 years and females aged under 5 years are the age groups that are most secure financially, with 100.0% of males and 100.0% of females in these age groups living above the poverty line.
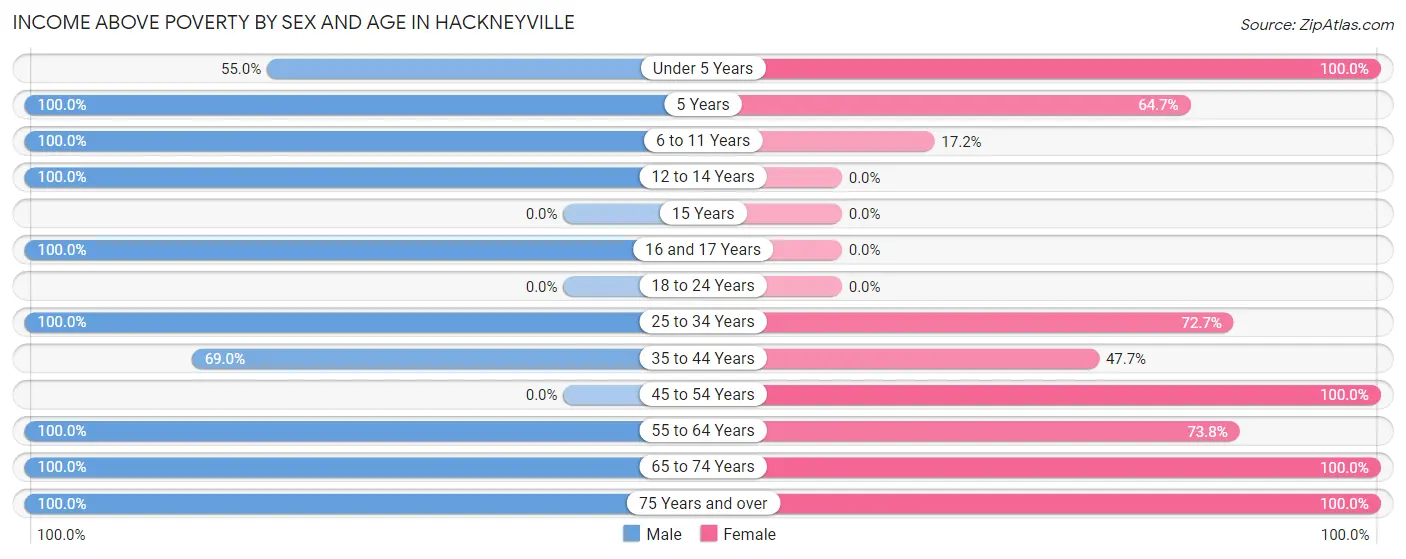
| Age Bracket | Male | Female |
| Under 5 Years | 11 (55.0%) | 36 (100.0%) |
| 5 Years | 28 (100.0%) | 11 (64.7%) |
| 6 to 11 Years | 31 (100.0%) | 11 (17.2%) |
| 12 to 14 Years | 58 (100.0%) | 0 (0.0%) |
| 15 Years | 0 (0.0%) | 0 (0.0%) |
| 16 and 17 Years | 23 (100.0%) | 0 (0.0%) |
| 18 to 24 Years | 0 (0.0%) | 0 (0.0%) |
| 25 to 34 Years | 8 (100.0%) | 40 (72.7%) |
| 35 to 44 Years | 40 (69.0%) | 21 (47.7%) |
| 45 to 54 Years | 0 (0.0%) | 8 (100.0%) |
| 55 to 64 Years | 34 (100.0%) | 31 (73.8%) |
| 65 to 74 Years | 9 (100.0%) | 24 (100.0%) |
| 75 Years and over | 27 (100.0%) | 8 (100.0%) |
| Total | 269 (90.9%) | 190 (63.8%) |
Income Below Poverty Among Married-Couple Families in Hackneyville
The poverty statistics for married-couple families in Hackneyville show that 13.7% or 18 of the total 131 families live below the poverty line. Families with 3 or 4 children have the highest poverty rate of 46.2%, comprising of 18 families. On the other hand, families with no children have the lowest poverty rate of 0.0%, which includes 0 families.
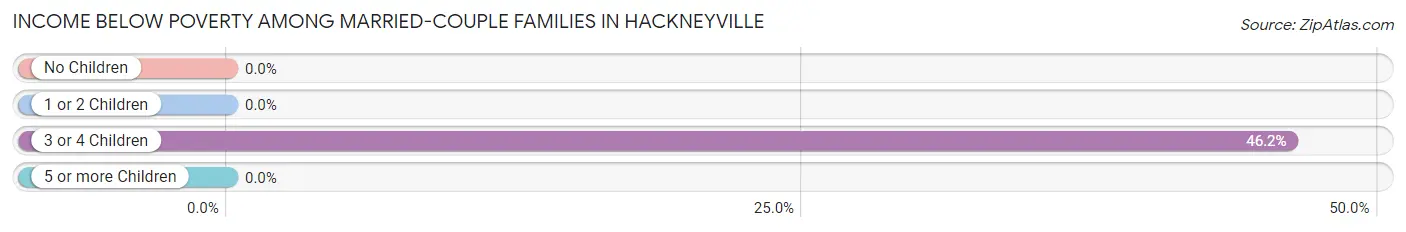
| Children | Above Poverty | Below Poverty |
| No Children | 63 (100.0%) | 0 (0.0%) |
| 1 or 2 Children | 8 (100.0%) | 0 (0.0%) |
| 3 or 4 Children | 21 (53.8%) | 18 (46.2%) |
| 5 or more Children | 21 (100.0%) | 0 (0.0%) |
| Total | 113 (86.3%) | 18 (13.7%) |
Income Below Poverty Among Single-Parent Households in Hackneyville
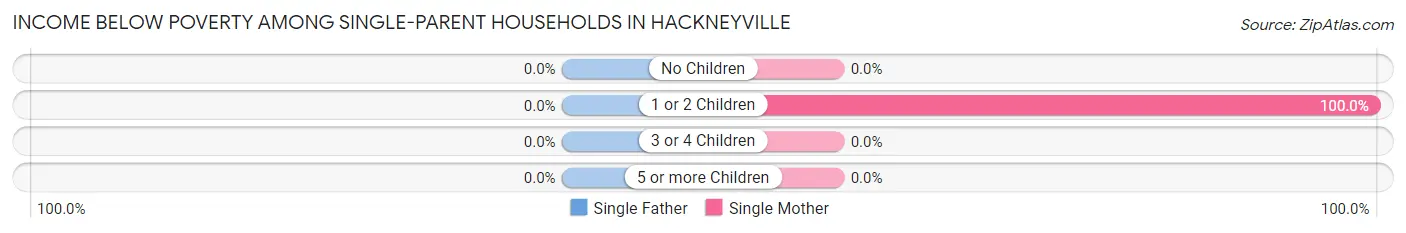
| Children | Single Father | Single Mother |
| No Children | 0 (0.0%) | 0 (0.0%) |
| 1 or 2 Children | 0 (0.0%) | 23 (100.0%) |
| 3 or 4 Children | 0 (0.0%) | 0 (0.0%) |
| 5 or more Children | 0 (0.0%) | 0 (0.0%) |
| Total | 0 (0.0%) | 23 (100.0%) |
Income Below Poverty Among Married-Couple vs Single-Parent Households in Hackneyville
The poverty data for Hackneyville shows that 18 of the married-couple family households (13.7%) and 23 of the single-parent households (100.0%) are living below the poverty level. Within the married-couple family households, those with 3 or 4 children have the highest poverty rate, with 18 households (46.2%) falling below the poverty line. Among the single-parent households, those with 1 or 2 children have the highest poverty rate, with 23 household (100.0%) living below poverty.
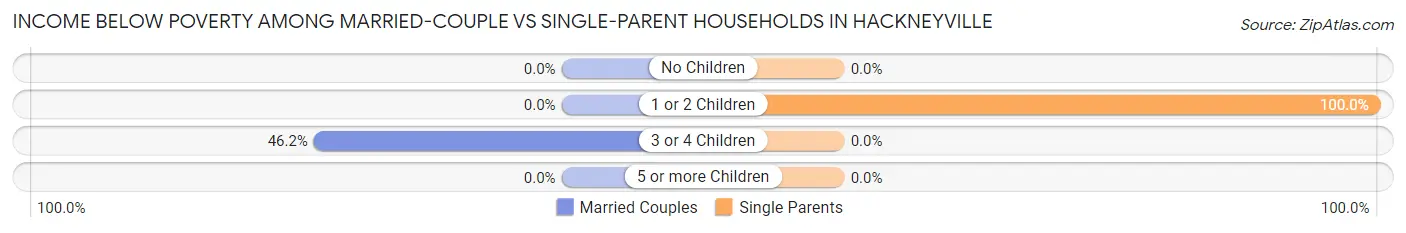
| Children | Married-Couple Families | Single-Parent Households |
| No Children | 0 (0.0%) | 0 (0.0%) |
| 1 or 2 Children | 0 (0.0%) | 23 (100.0%) |
| 3 or 4 Children | 18 (46.2%) | 0 (0.0%) |
| 5 or more Children | 0 (0.0%) | 0 (0.0%) |
| Total | 18 (13.7%) | 23 (100.0%) |
Race in Hackneyville
The most populous races in Hackneyville are , and White / Caucasian (594 | 100.0%).
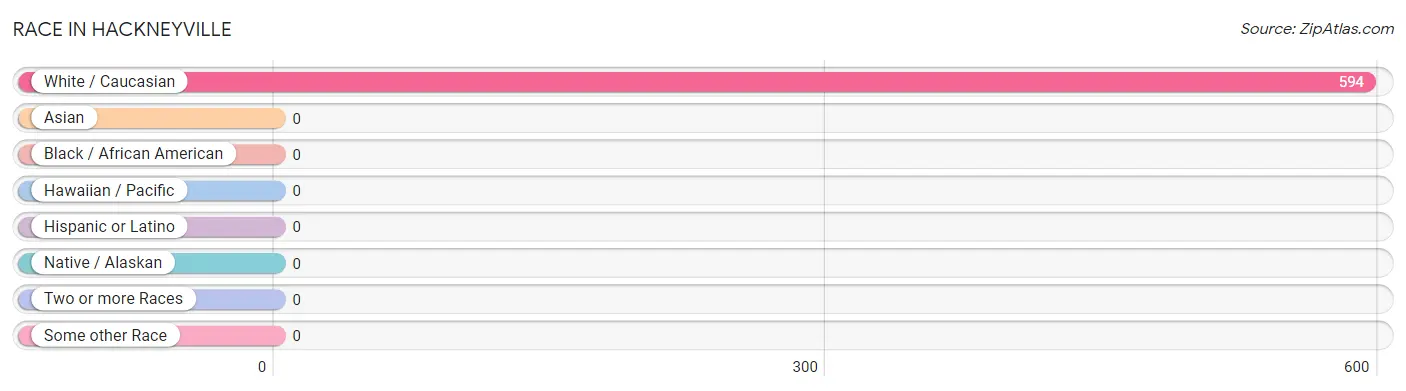
| Race | # Population | % Population |
| Asian | 0 | 0.0% |
| Black / African American | 0 | 0.0% |
| Hawaiian / Pacific | 0 | 0.0% |
| Hispanic or Latino | 0 | 0.0% |
| Native / Alaskan | 0 | 0.0% |
| White / Caucasian | 594 | 100.0% |
| Two or more Races | 0 | 0.0% |
| Some other Race | 0 | 0.0% |
| Total | 594 | 100.0% |
Ancestry in Hackneyville
The most populous ancestries reported in Hackneyville are American (121 | 20.4%), English (118 | 19.9%), Irish (64 | 10.8%), French Canadian (9 | 1.5%), and Polish (8 | 1.3%), together accounting for 53.9% of all Hackneyville residents.
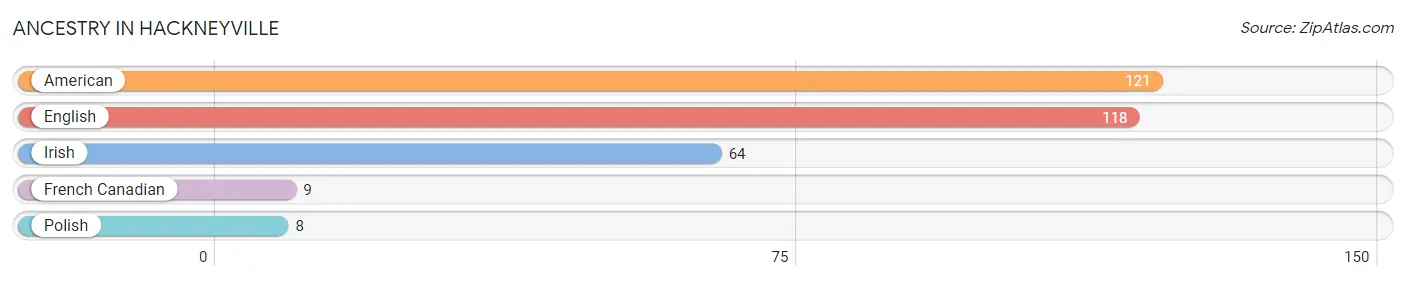
| Ancestry | # Population | % Population |
| American | 121 | 20.4% |
| English | 118 | 19.9% |
| French Canadian | 9 | 1.5% |
| Irish | 64 | 10.8% |
| Polish | 8 | 1.3% | View All 5 Rows |
Immigrants in Hackneyville

| Immigration Origin | # Population | % Population | View All 0 Rows |
Sex and Age in Hackneyville
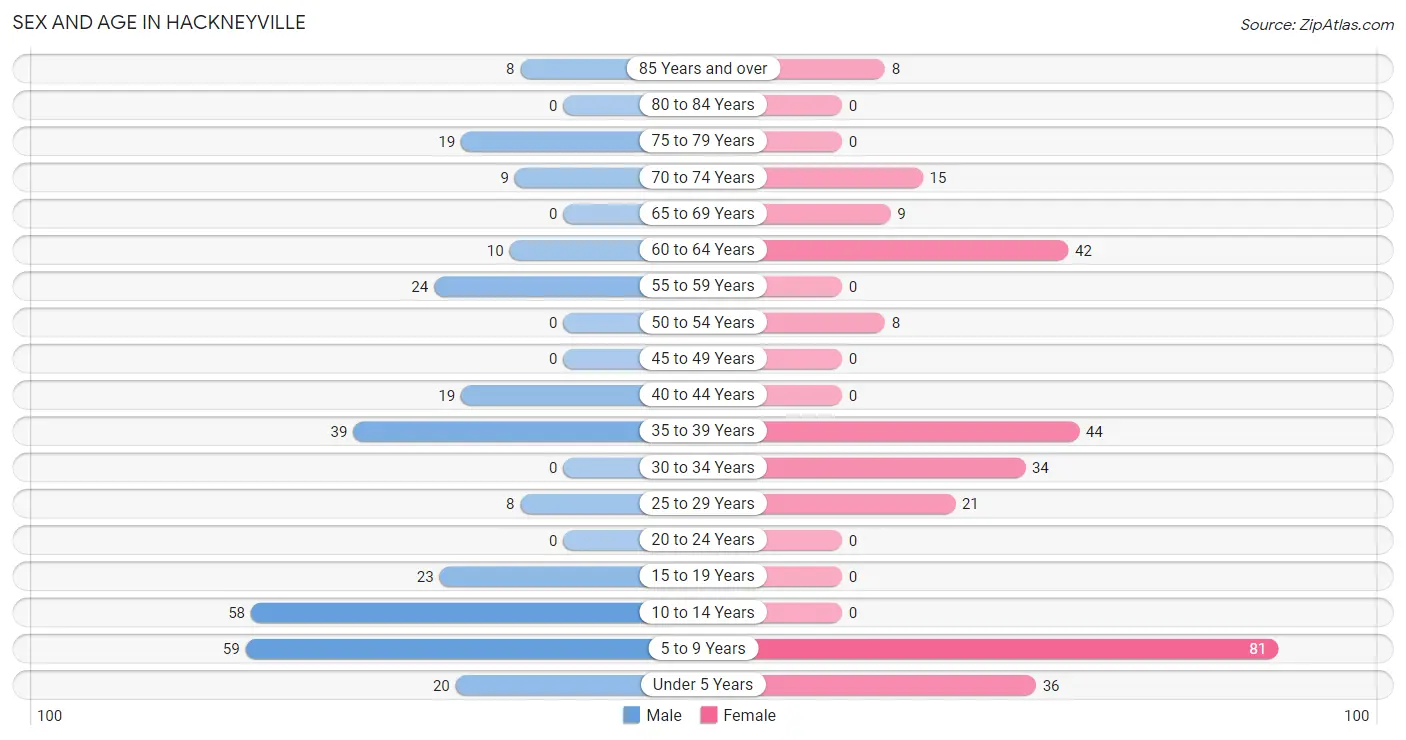
Sex and Age in Hackneyville
The most populous age groups in Hackneyville are 5 to 9 Years (59 | 19.9%) for men and 5 to 9 Years (81 | 27.2%) for women.
| Age Bracket | Male | Female |
| Under 5 Years | 20 (6.8%) | 36 (12.1%) |
| 5 to 9 Years | 59 (19.9%) | 81 (27.2%) |
| 10 to 14 Years | 58 (19.6%) | 0 (0.0%) |
| 15 to 19 Years | 23 (7.8%) | 0 (0.0%) |
| 20 to 24 Years | 0 (0.0%) | 0 (0.0%) |
| 25 to 29 Years | 8 (2.7%) | 21 (7.0%) |
| 30 to 34 Years | 0 (0.0%) | 34 (11.4%) |
| 35 to 39 Years | 39 (13.2%) | 44 (14.8%) |
| 40 to 44 Years | 19 (6.4%) | 0 (0.0%) |
| 45 to 49 Years | 0 (0.0%) | 0 (0.0%) |
| 50 to 54 Years | 0 (0.0%) | 8 (2.7%) |
| 55 to 59 Years | 24 (8.1%) | 0 (0.0%) |
| 60 to 64 Years | 10 (3.4%) | 42 (14.1%) |
| 65 to 69 Years | 0 (0.0%) | 9 (3.0%) |
| 70 to 74 Years | 9 (3.0%) | 15 (5.0%) |
| 75 to 79 Years | 19 (6.4%) | 0 (0.0%) |
| 80 to 84 Years | 0 (0.0%) | 0 (0.0%) |
| 85 Years and over | 8 (2.7%) | 8 (2.7%) |
| Total | 296 (100.0%) | 298 (100.0%) |
Families and Households in Hackneyville
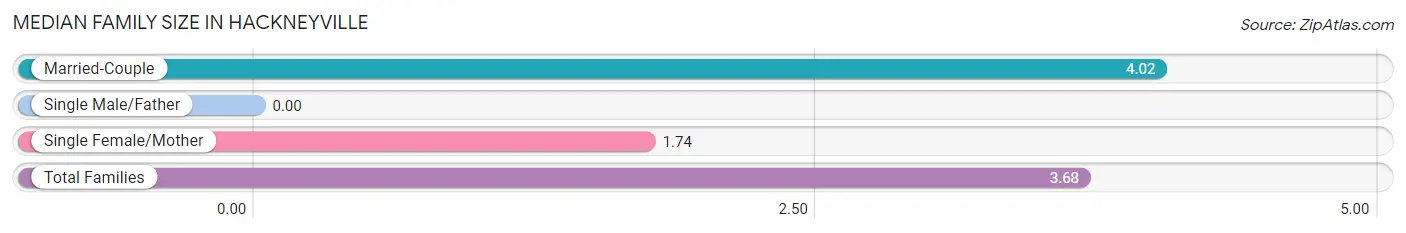
Median Family Size in Hackneyville
| Family Type | # Families | Family Size |
| Married-Couple | 131 (85.1%) | 4.02 |
| Single Male/Father | 0 (0.0%) | - |
| Single Female/Mother | 23 (14.9%) | 1.74 |
| Total Families | 154 (100.0%) | 3.68 |
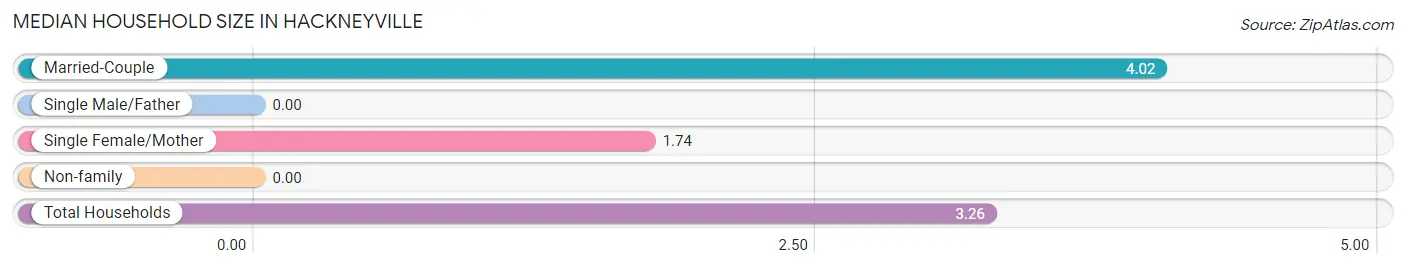
Median Household Size in Hackneyville
| Household Type | # Households | Household Size |
| Married-Couple | 131 (72.0%) | 4.02 |
| Single Male/Father | 0 (0.0%) | - |
| Single Female/Mother | 23 (12.6%) | 1.74 |
| Non-family | 28 (15.4%) | - |
| Total Households | 182 (100.0%) | 3.26 |
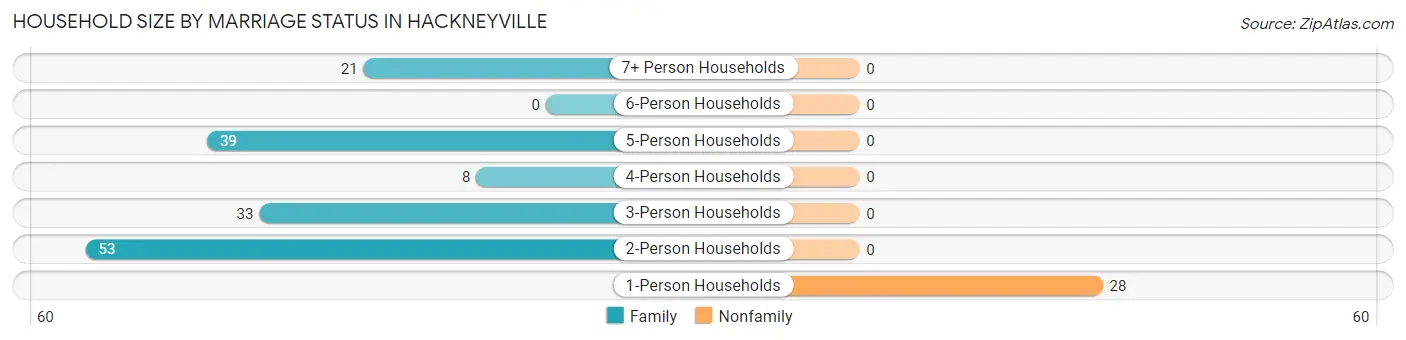
Household Size by Marriage Status in Hackneyville
Out of a total of 182 households in Hackneyville, 154 (84.6%) are family households, while 28 (15.4%) are nonfamily households. The most numerous type of family households are 2-person households, comprising 53, and the most common type of nonfamily households are 1-person households, comprising 28.
| Household Size | Family Households | Nonfamily Households |
| 1-Person Households | - | 28 (15.4%) |
| 2-Person Households | 53 (29.1%) | 0 (0.0%) |
| 3-Person Households | 33 (18.1%) | 0 (0.0%) |
| 4-Person Households | 8 (4.4%) | 0 (0.0%) |
| 5-Person Households | 39 (21.4%) | 0 (0.0%) |
| 6-Person Households | 0 (0.0%) | 0 (0.0%) |
| 7+ Person Households | 21 (11.5%) | 0 (0.0%) |
| Total | 154 (84.6%) | 28 (15.4%) |
Female Fertility in Hackneyville
Fertility by Age in Hackneyville
| Age Bracket | Women with Births | Births / 1,000 Women |
| 15 to 19 years | 0 (0.0%) | 0.0 |
| 20 to 34 years | 0 (0.0%) | 0.0 |
| 35 to 50 years | 0 (0.0%) | 0.0 |
| Total | 0 (0.0%) | 0.0 |
Fertility by Age by Marriage Status in Hackneyville
| Age Bracket | Married | Unmarried |
| 15 to 19 years | 0 (0.0%) | 0 (0.0%) |
| 20 to 34 years | 0 (0.0%) | 0 (0.0%) |
| 35 to 50 years | 0 (0.0%) | 0 (0.0%) |
| Total | 0 (0.0%) | 0 (0.0%) |
Fertility by Education in Hackneyville
| Educational Attainment | Women with Births | Births / 1,000 Women |
| Less than High School | 0 (0.0%) | 0.0 |
| High School Diploma | 0 (0.0%) | 0.0 |
| College or Associate's Degree | 0 (0.0%) | 0.0 |
| Bachelor's Degree | 0 (0.0%) | 0.0 |
| Graduate Degree | 0 (0.0%) | 0.0 |
| Total | 0 (0.0%) | 0.0 |
Fertility by Education by Marriage Status in Hackneyville
| Educational Attainment | Married | Unmarried |
| Less than High School | 0 (0.0%) | 0 (0.0%) |
| High School Diploma | 0 (0.0%) | 0 (0.0%) |
| College or Associate's Degree | 0 (0.0%) | 0 (0.0%) |
| Bachelor's Degree | 0 (0.0%) | 0 (0.0%) |
| Graduate Degree | 0 (0.0%) | 0 (0.0%) |
| Total | 0 (0.0%) | 0 (0.0%) |
Employment Characteristics in Hackneyville
Employment by Class of Employer in Hackneyville
Among the 154 employed individuals in Hackneyville, private company employees (73 | 47.4%), state government employees (33 | 21.4%), and local government employees (29 | 18.8%) make up the most common classes of employment.
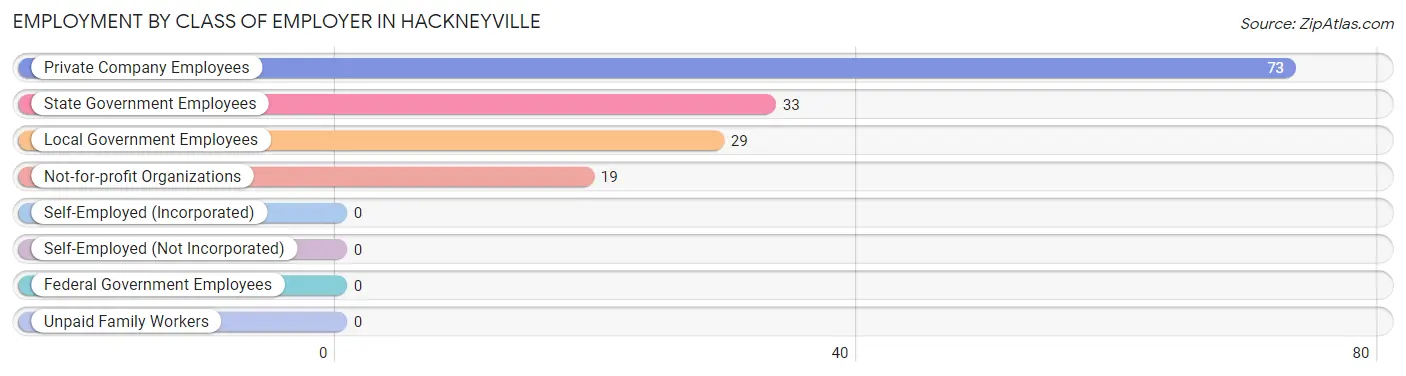
| Employer Class | # Employees | % Employees |
| Private Company Employees | 73 | 47.4% |
| Self-Employed (Incorporated) | 0 | 0.0% |
| Self-Employed (Not Incorporated) | 0 | 0.0% |
| Not-for-profit Organizations | 19 | 12.3% |
| Local Government Employees | 29 | 18.8% |
| State Government Employees | 33 | 21.4% |
| Federal Government Employees | 0 | 0.0% |
| Unpaid Family Workers | 0 | 0.0% |
| Total | 154 | 100.0% |
Employment Status by Age in Hackneyville
According to the labor force statistics for Hackneyville, out of the total population over 16 years of age (340), 52.1% or 177 individuals are in the labor force, with 13.0% or 23 of them unemployed. The age group with the highest labor force participation rate is 25 to 29 years, with 100.0% or 29 individuals in the labor force. Within the labor force, the 35 to 44 years age range has the highest percentage of unemployed individuals, with 35.4% or 23 of them being unemployed.
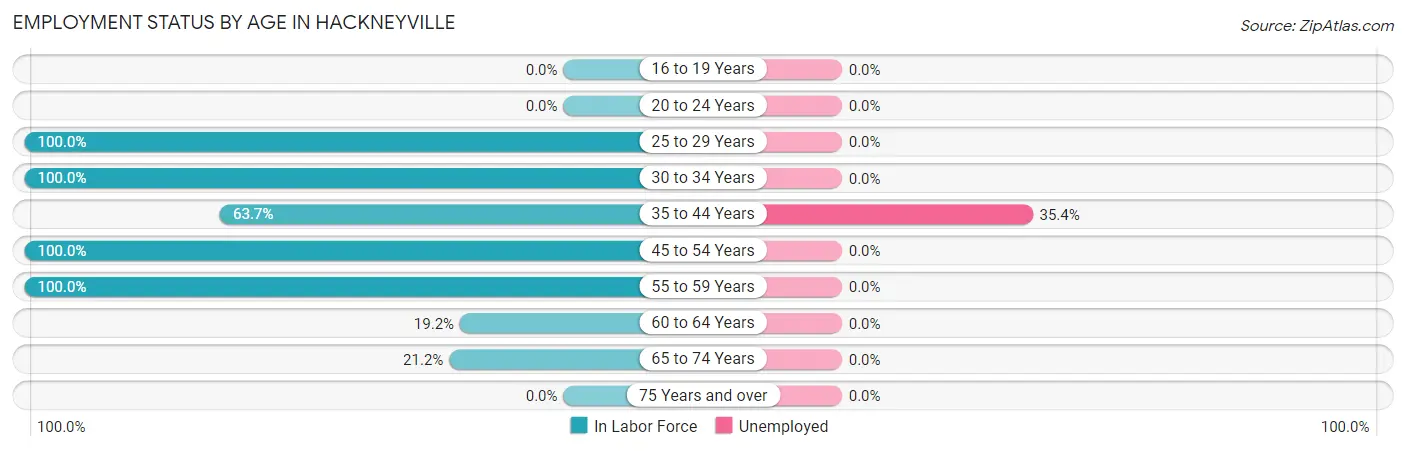
| Age Bracket | In Labor Force | Unemployed |
| 16 to 19 Years | 0 (0.0%) | 0 (0.0%) |
| 20 to 24 Years | 0 (0.0%) | 0 (0.0%) |
| 25 to 29 Years | 29 (100.0%) | 0 (0.0%) |
| 30 to 34 Years | 34 (100.0%) | 0 (0.0%) |
| 35 to 44 Years | 65 (63.7%) | 23 (35.4%) |
| 45 to 54 Years | 8 (100.0%) | 0 (0.0%) |
| 55 to 59 Years | 24 (100.0%) | 0 (0.0%) |
| 60 to 64 Years | 10 (19.2%) | 0 (0.0%) |
| 65 to 74 Years | 7 (21.2%) | 0 (0.0%) |
| 75 Years and over | 0 (0.0%) | 0 (0.0%) |
| Total | 177 (52.1%) | 23 (13.0%) |
Employment Status by Educational Attainment in Hackneyville
According to labor force statistics for Hackneyville, 68.3% of individuals (170) out of the total population between 25 and 64 years of age (249) are in the labor force, with 13.5% or 23 of them being unemployed. The group with the highest labor force participation rate are those with the educational attainment of bachelor's degree or higher, with 100.0% or 24 individuals in the labor force. Within the labor force, individuals with high school diploma education have the highest percentage of unemployment, with 42.6% or 23 of them being unemployed.
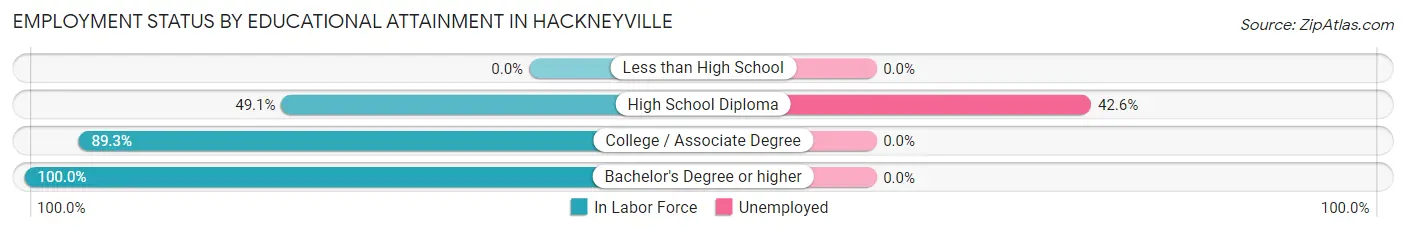
| Educational Attainment | In Labor Force | Unemployed |
| Less than High School | 0 (0.0%) | 0 (0.0%) |
| High School Diploma | 54 (49.1%) | 47 (42.6%) |
| College / Associate Degree | 92 (89.3%) | 0 (0.0%) |
| Bachelor's Degree or higher | 24 (100.0%) | 0 (0.0%) |
| Total | 170 (68.3%) | 34 (13.5%) |
Employment Occupations by Sex in Hackneyville
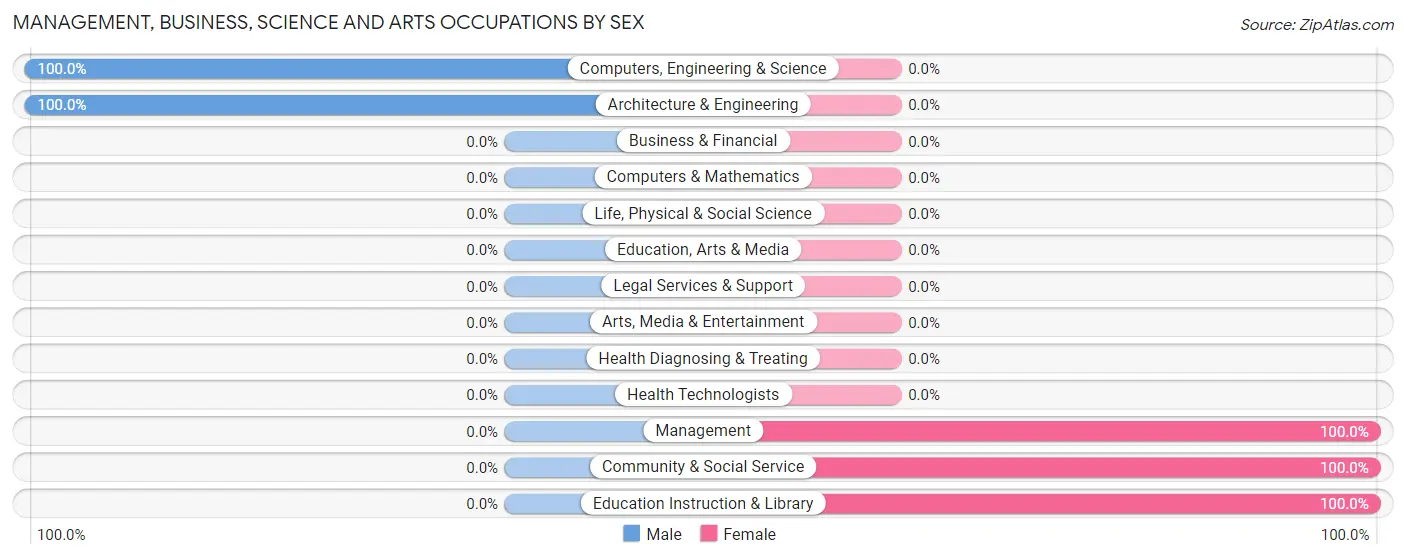
Management, Business, Science and Arts Occupations
The most common Management, Business, Science and Arts occupations in Hackneyville are Management (34 | 22.1%), Community & Social Service (14 | 9.1%), Education Instruction & Library (14 | 9.1%), Computers, Engineering & Science (9 | 5.8%), and Architecture & Engineering (9 | 5.8%).
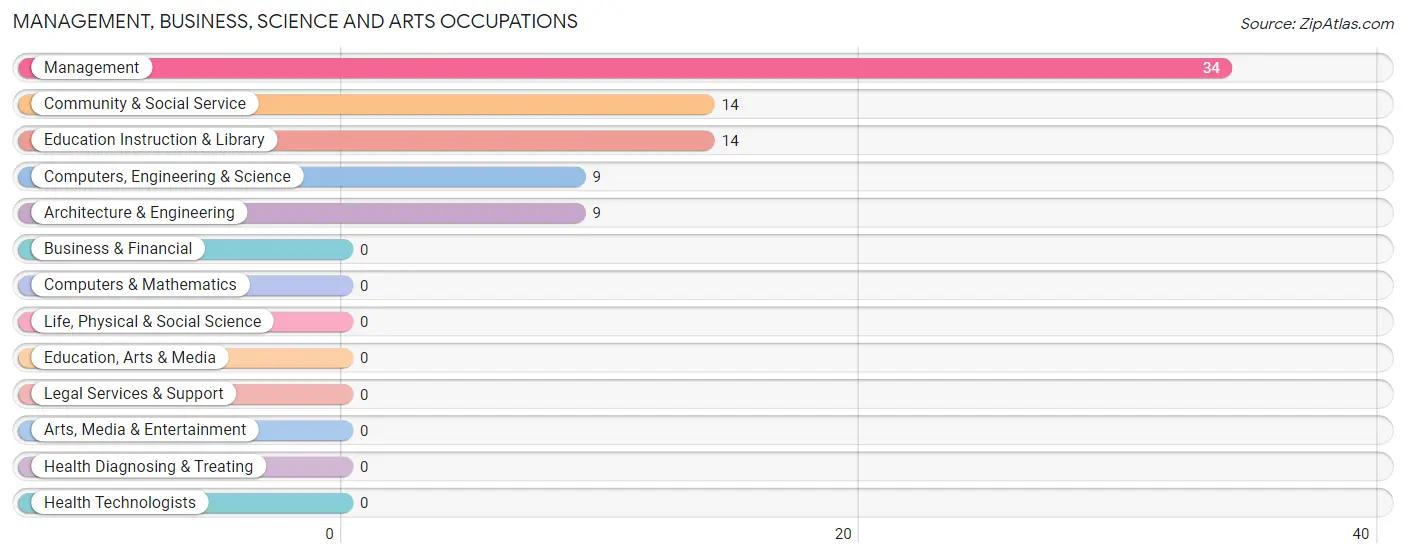
Management, Business, Science and Arts Occupations by Sex
Within the Management, Business, Science and Arts occupations in Hackneyville, the most male-oriented occupations are Computers, Engineering & Science (100.0%), and Architecture & Engineering (100.0%), while the most female-oriented occupations are Management (100.0%), Community & Social Service (100.0%), and Education Instruction & Library (100.0%).
| Occupation | Male | Female |
| Management | 0 (0.0%) | 34 (100.0%) |
| Business & Financial | 0 (0.0%) | 0 (0.0%) |
| Computers, Engineering & Science | 9 (100.0%) | 0 (0.0%) |
| Computers & Mathematics | 0 (0.0%) | 0 (0.0%) |
| Architecture & Engineering | 9 (100.0%) | 0 (0.0%) |
| Life, Physical & Social Science | 0 (0.0%) | 0 (0.0%) |
| Community & Social Service | 0 (0.0%) | 14 (100.0%) |
| Education, Arts & Media | 0 (0.0%) | 0 (0.0%) |
| Legal Services & Support | 0 (0.0%) | 0 (0.0%) |
| Education Instruction & Library | 0 (0.0%) | 14 (100.0%) |
| Arts, Media & Entertainment | 0 (0.0%) | 0 (0.0%) |
| Health Diagnosing & Treating | 0 (0.0%) | 0 (0.0%) |
| Health Technologists | 0 (0.0%) | 0 (0.0%) |
| Total (Category) | 9 (15.8%) | 48 (84.2%) |
| Total (Overall) | 53 (34.4%) | 101 (65.6%) |
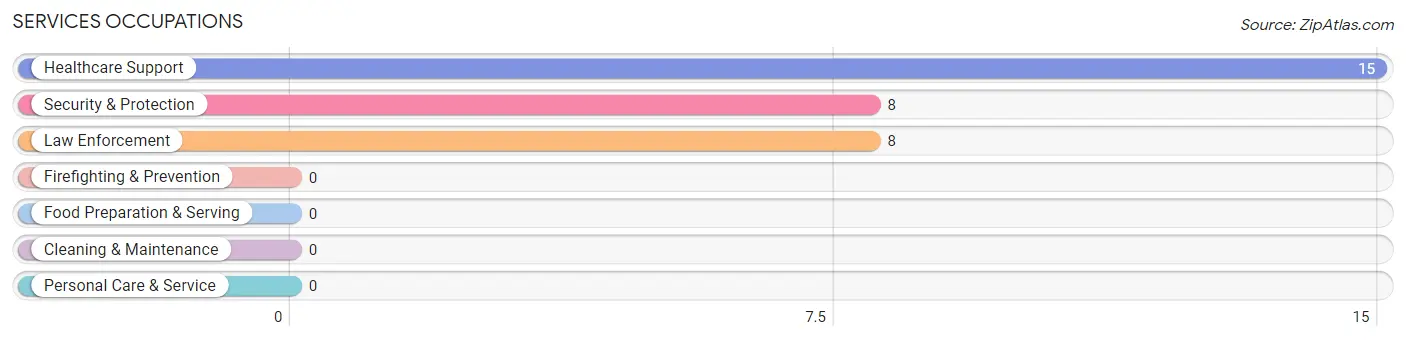
Services Occupations
The most common Services occupations in Hackneyville are Healthcare Support (15 | 9.7%), Security & Protection (8 | 5.2%), and Law Enforcement (8 | 5.2%).
Services Occupations by Sex
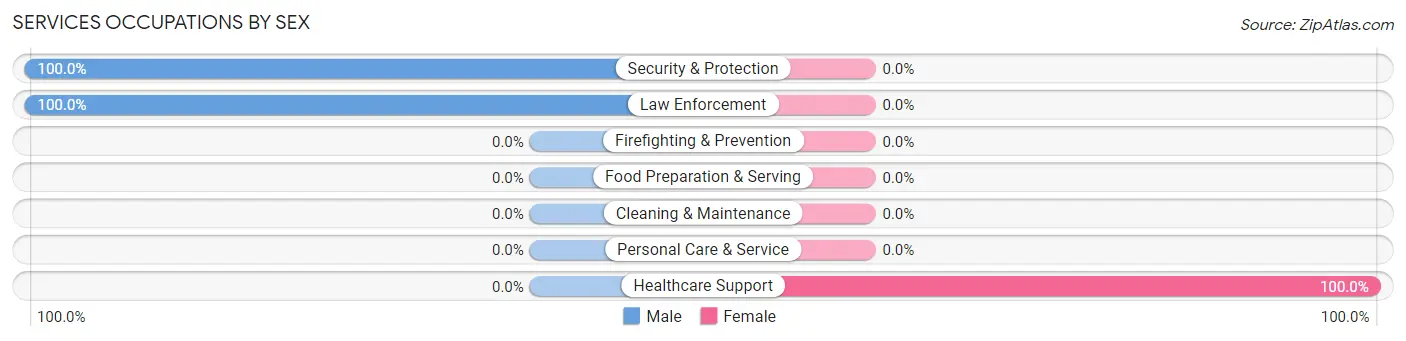
| Occupation | Male | Female |
| Healthcare Support | 0 (0.0%) | 15 (100.0%) |
| Security & Protection | 8 (100.0%) | 0 (0.0%) |
| Firefighting & Prevention | 0 (0.0%) | 0 (0.0%) |
| Law Enforcement | 8 (100.0%) | 0 (0.0%) |
| Food Preparation & Serving | 0 (0.0%) | 0 (0.0%) |
| Cleaning & Maintenance | 0 (0.0%) | 0 (0.0%) |
| Personal Care & Service | 0 (0.0%) | 0 (0.0%) |
| Total (Category) | 8 (34.8%) | 15 (65.2%) |
| Total (Overall) | 53 (34.4%) | 101 (65.6%) |
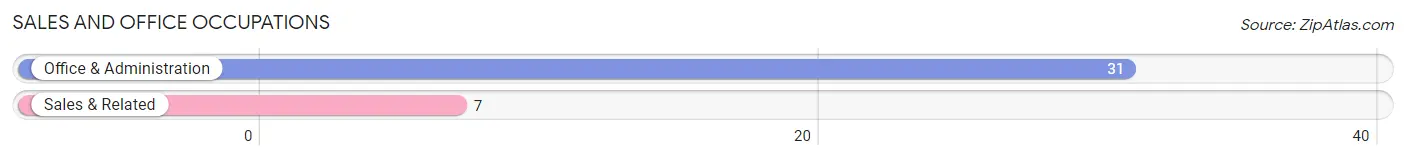
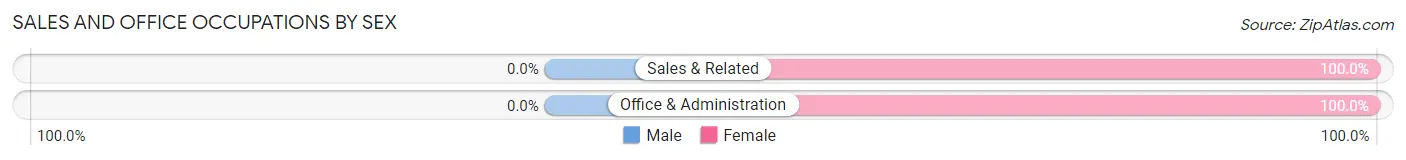
Sales and Office Occupations
The most common Sales and Office occupations in Hackneyville are Office & Administration (31 | 20.1%), and Sales & Related (7 | 4.5%).
Sales and Office Occupations by Sex
| Occupation | Male | Female |
| Sales & Related | 0 (0.0%) | 7 (100.0%) |
| Office & Administration | 0 (0.0%) | 31 (100.0%) |
| Total (Category) | 0 (0.0%) | 38 (100.0%) |
| Total (Overall) | 53 (34.4%) | 101 (65.6%) |
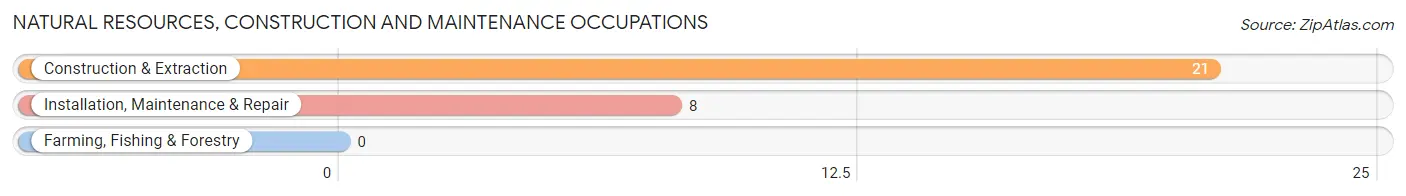
Natural Resources, Construction and Maintenance Occupations
The most common Natural Resources, Construction and Maintenance occupations in Hackneyville are Construction & Extraction (21 | 13.6%), and Installation, Maintenance & Repair (8 | 5.2%).
Natural Resources, Construction and Maintenance Occupations by Sex
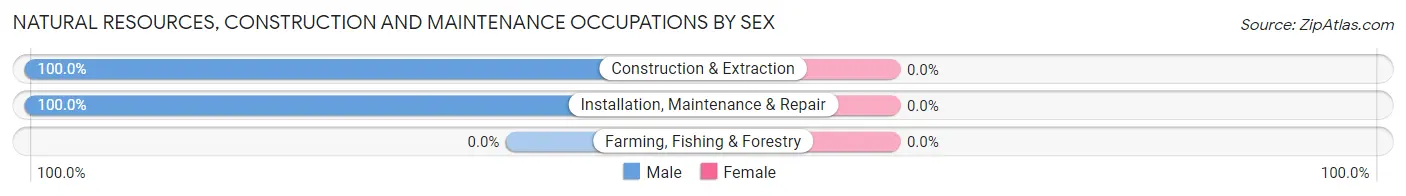
| Occupation | Male | Female |
| Farming, Fishing & Forestry | 0 (0.0%) | 0 (0.0%) |
| Construction & Extraction | 21 (100.0%) | 0 (0.0%) |
| Installation, Maintenance & Repair | 8 (100.0%) | 0 (0.0%) |
| Total (Category) | 29 (100.0%) | 0 (0.0%) |
| Total (Overall) | 53 (34.4%) | 101 (65.6%) |
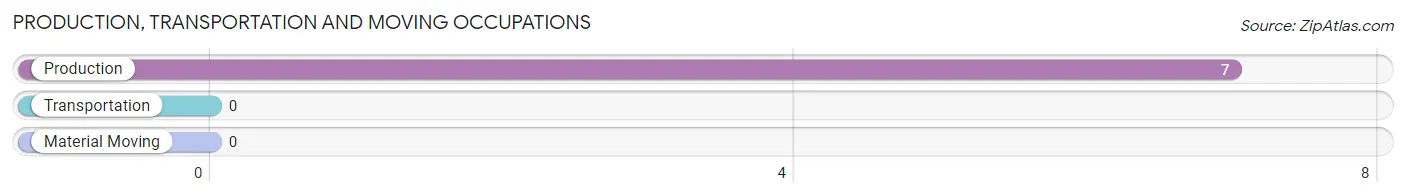
Production, Transportation and Moving Occupations
The most common Production, Transportation and Moving occupations in Hackneyville are , and Production (7 | 4.5%).
Production, Transportation and Moving Occupations by Sex
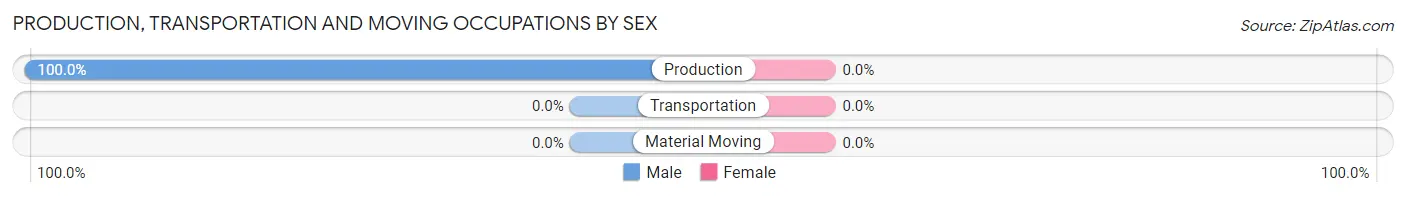
| Occupation | Male | Female |
| Production | 7 (100.0%) | 0 (0.0%) |
| Transportation | 0 (0.0%) | 0 (0.0%) |
| Material Moving | 0 (0.0%) | 0 (0.0%) |
| Total (Category) | 7 (100.0%) | 0 (0.0%) |
| Total (Overall) | 53 (34.4%) | 101 (65.6%) |
Employment Industries by Sex in Hackneyville
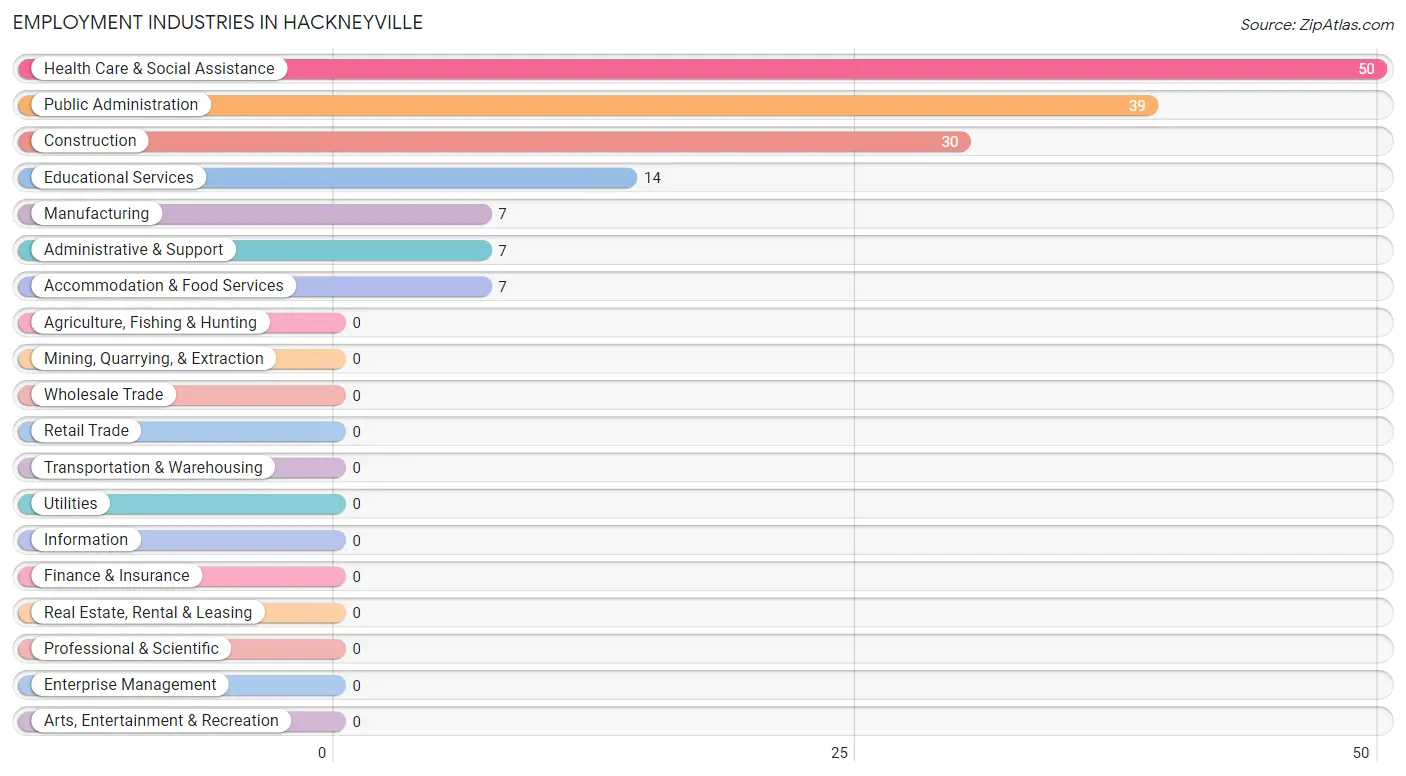
Employment Industries in Hackneyville
The major employment industries in Hackneyville include Health Care & Social Assistance (50 | 32.5%), Public Administration (39 | 25.3%), Construction (30 | 19.5%), Educational Services (14 | 9.1%), and Manufacturing (7 | 4.5%).
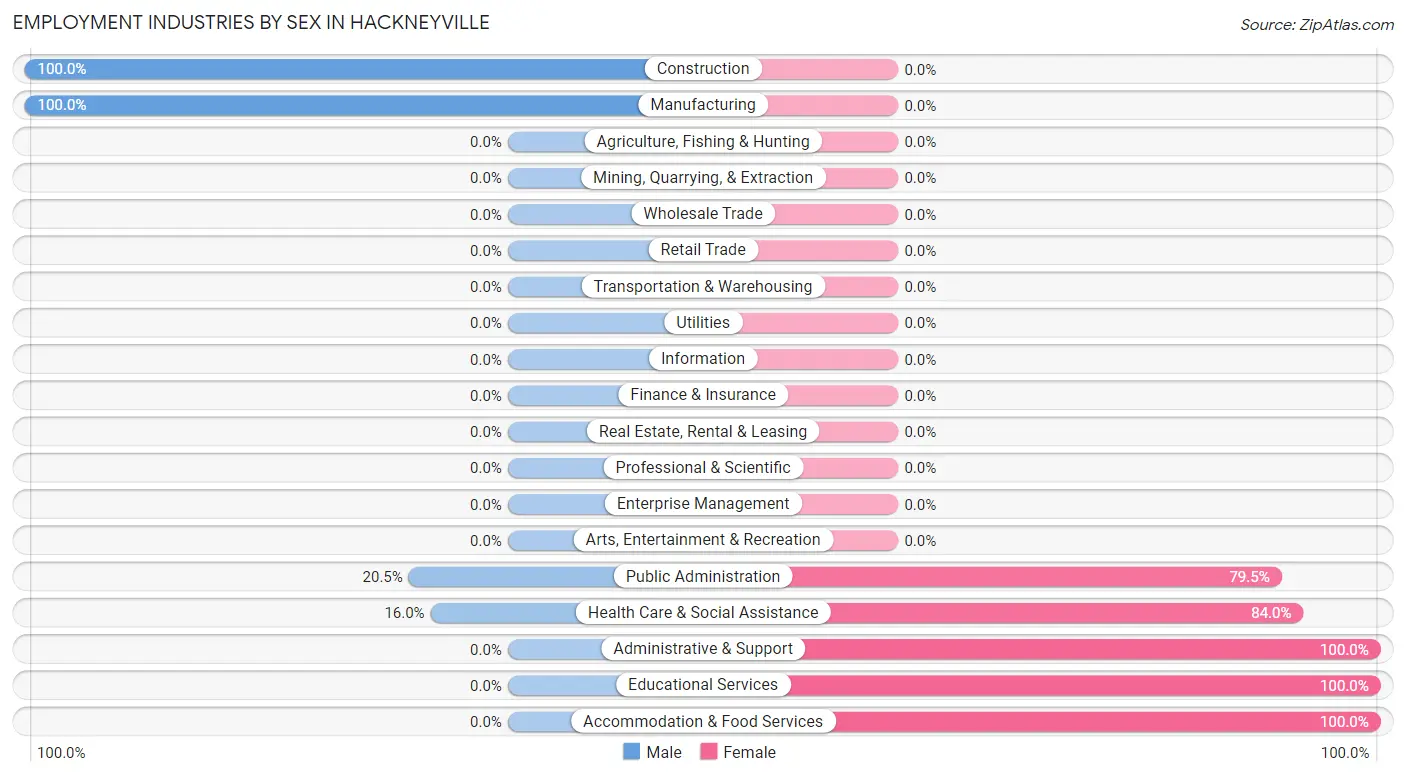
Employment Industries by Sex in Hackneyville
The Hackneyville industries that see more men than women are Construction (100.0%), Manufacturing (100.0%), and Public Administration (20.5%), whereas the industries that tend to have a higher number of women are Administrative & Support (100.0%), Educational Services (100.0%), and Accommodation & Food Services (100.0%).
| Industry | Male | Female |
| Agriculture, Fishing & Hunting | 0 (0.0%) | 0 (0.0%) |
| Mining, Quarrying, & Extraction | 0 (0.0%) | 0 (0.0%) |
| Construction | 30 (100.0%) | 0 (0.0%) |
| Manufacturing | 7 (100.0%) | 0 (0.0%) |
| Wholesale Trade | 0 (0.0%) | 0 (0.0%) |
| Retail Trade | 0 (0.0%) | 0 (0.0%) |
| Transportation & Warehousing | 0 (0.0%) | 0 (0.0%) |
| Utilities | 0 (0.0%) | 0 (0.0%) |
| Information | 0 (0.0%) | 0 (0.0%) |
| Finance & Insurance | 0 (0.0%) | 0 (0.0%) |
| Real Estate, Rental & Leasing | 0 (0.0%) | 0 (0.0%) |
| Professional & Scientific | 0 (0.0%) | 0 (0.0%) |
| Enterprise Management | 0 (0.0%) | 0 (0.0%) |
| Administrative & Support | 0 (0.0%) | 7 (100.0%) |
| Educational Services | 0 (0.0%) | 14 (100.0%) |
| Health Care & Social Assistance | 8 (16.0%) | 42 (84.0%) |
| Arts, Entertainment & Recreation | 0 (0.0%) | 0 (0.0%) |
| Accommodation & Food Services | 0 (0.0%) | 7 (100.0%) |
| Public Administration | 8 (20.5%) | 31 (79.5%) |
| Total | 53 (34.4%) | 101 (65.6%) |
Education in Hackneyville
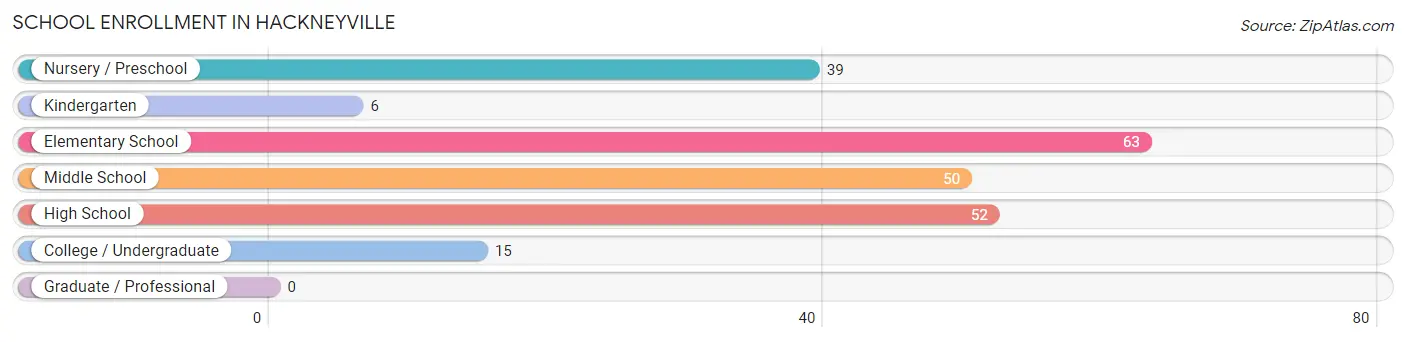
School Enrollment in Hackneyville
The most common levels of schooling among the 225 students in Hackneyville are elementary school (63 | 28.0%), high school (52 | 23.1%), and middle school (50 | 22.2%).
| School Level | # Students | % Students |
| Nursery / Preschool | 39 | 17.3% |
| Kindergarten | 6 | 2.7% |
| Elementary School | 63 | 28.0% |
| Middle School | 50 | 22.2% |
| High School | 52 | 23.1% |
| College / Undergraduate | 15 | 6.7% |
| Graduate / Professional | 0 | 0.0% |
| Total | 225 | 100.0% |
School Enrollment by Age by Funding Source in Hackneyville
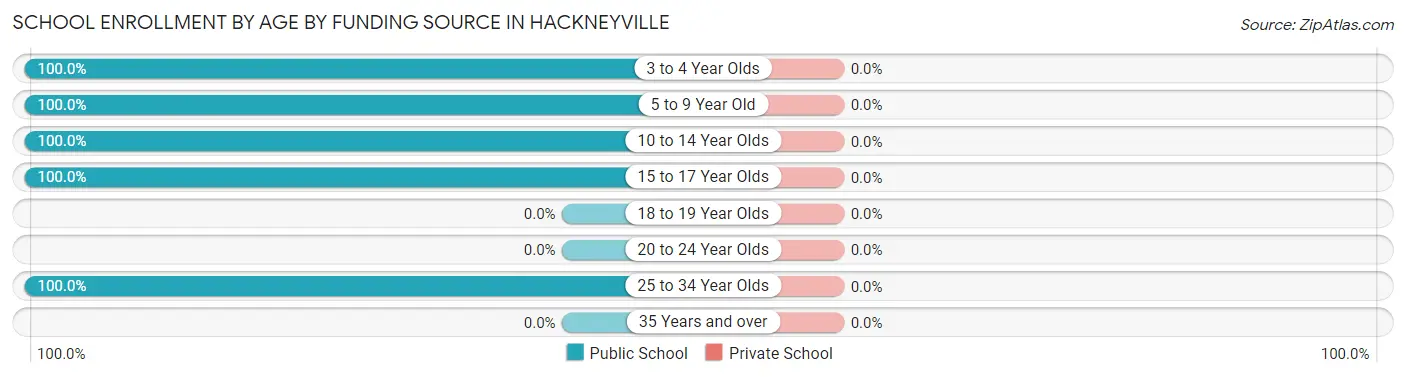
| Age Bracket | Public School | Private School |
| 3 to 4 Year Olds | 11 (100.0%) | 0 (0.0%) |
| 5 to 9 Year Old | 118 (100.0%) | 0 (0.0%) |
| 10 to 14 Year Olds | 58 (100.0%) | 0 (0.0%) |
| 15 to 17 Year Olds | 23 (100.0%) | 0 (0.0%) |
| 18 to 19 Year Olds | 0 (0.0%) | 0 (0.0%) |
| 20 to 24 Year Olds | 0 (0.0%) | 0 (0.0%) |
| 25 to 34 Year Olds | 15 (100.0%) | 0 (0.0%) |
| 35 Years and over | 0 (0.0%) | 0 (0.0%) |
| Total | 225 (100.0%) | 0 (0.0%) |
Educational Attainment by Field of Study in Hackneyville
Science & technology (14 | 43.8%), engineering (10 | 31.2%), and education (8 | 25.0%) are the most common fields of study among 32 individuals in Hackneyville who have obtained a bachelor's degree or higher.
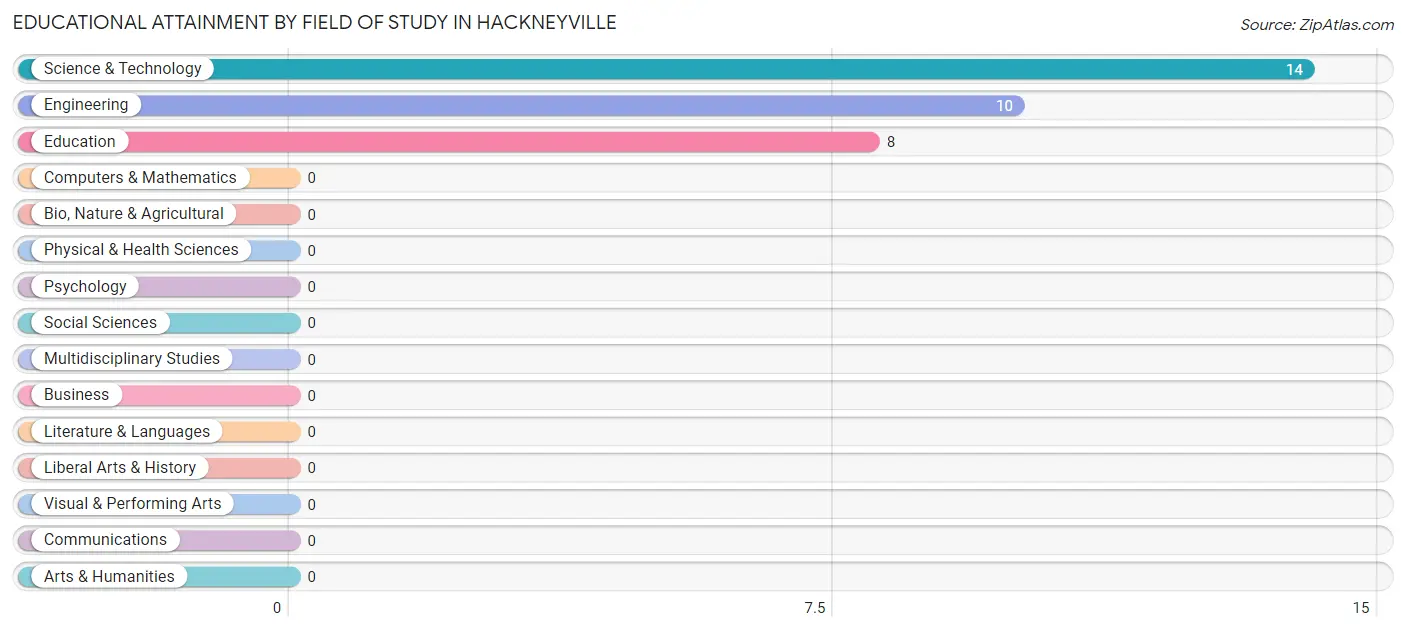
| Field of Study | # Graduates | % Graduates |
| Computers & Mathematics | 0 | 0.0% |
| Bio, Nature & Agricultural | 0 | 0.0% |
| Physical & Health Sciences | 0 | 0.0% |
| Psychology | 0 | 0.0% |
| Social Sciences | 0 | 0.0% |
| Engineering | 10 | 31.2% |
| Multidisciplinary Studies | 0 | 0.0% |
| Science & Technology | 14 | 43.8% |
| Business | 0 | 0.0% |
| Education | 8 | 25.0% |
| Literature & Languages | 0 | 0.0% |
| Liberal Arts & History | 0 | 0.0% |
| Visual & Performing Arts | 0 | 0.0% |
| Communications | 0 | 0.0% |
| Arts & Humanities | 0 | 0.0% |
| Total | 32 | 100.0% |
Transportation & Commute in Hackneyville
Vehicle Availability by Sex in Hackneyville
The most prevalent vehicle ownership categories in Hackneyville are males with 2 vehicles (44, accounting for 83.0%) and females with 2 vehicles (49, making up 43.6%).
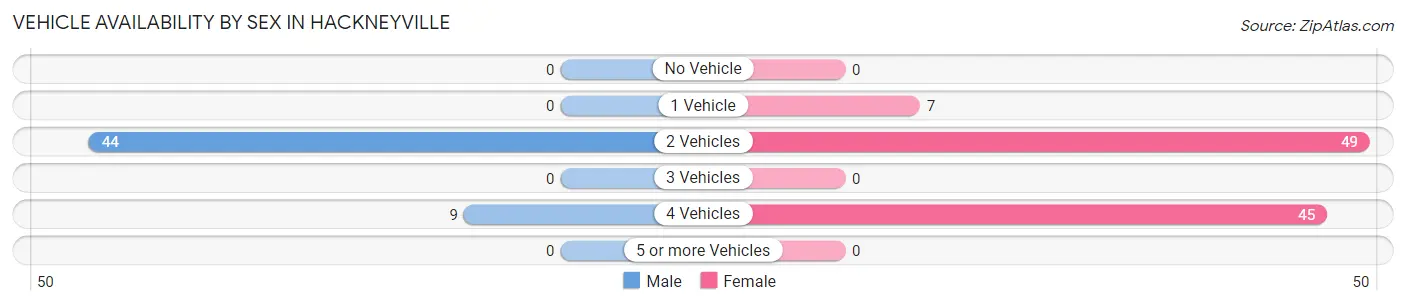
| Vehicles Available | Male | Female |
| No Vehicle | 0 (0.0%) | 0 (0.0%) |
| 1 Vehicle | 0 (0.0%) | 7 (6.9%) |
| 2 Vehicles | 44 (83.0%) | 49 (48.5%) |
| 3 Vehicles | 0 (0.0%) | 0 (0.0%) |
| 4 Vehicles | 9 (17.0%) | 45 (44.6%) |
| 5 or more Vehicles | 0 (0.0%) | 0 (0.0%) |
| Total | 53 (100.0%) | 101 (100.0%) |
Commute Time in Hackneyville
The most frequently occuring commute durations in Hackneyville are 15 to 19 minutes (45 commuters, 33.3%), 60 to 89 minutes (35 commuters, 25.9%), and 20 to 24 minutes (23 commuters, 17.0%).
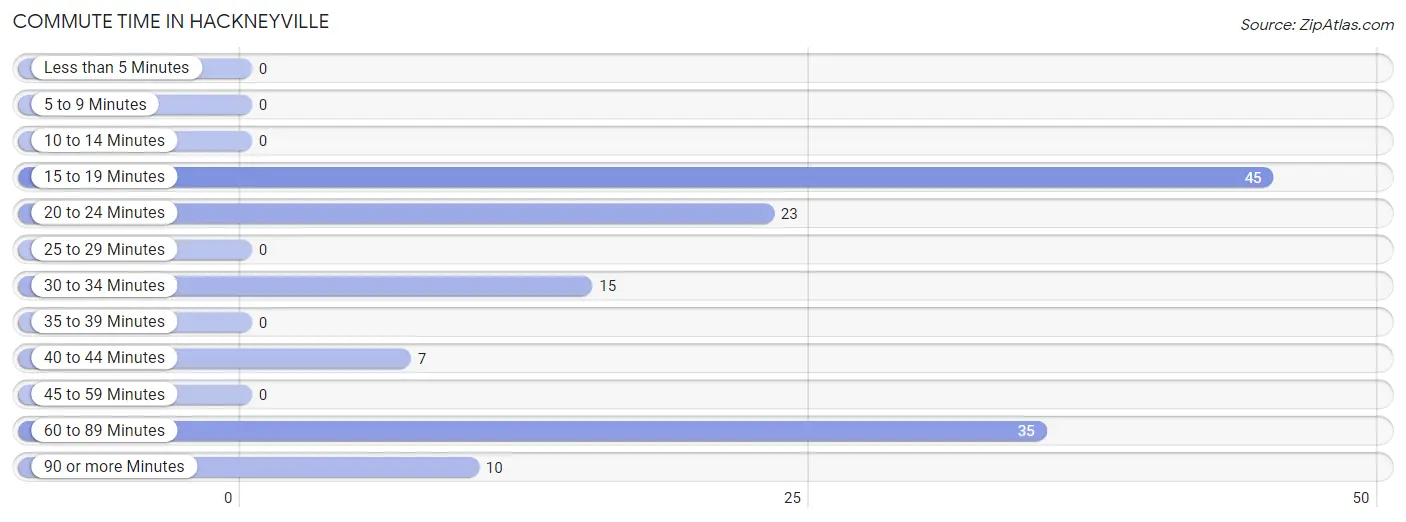
| Commute Time | # Commuters | % Commuters |
| Less than 5 Minutes | 0 | 0.0% |
| 5 to 9 Minutes | 0 | 0.0% |
| 10 to 14 Minutes | 0 | 0.0% |
| 15 to 19 Minutes | 45 | 33.3% |
| 20 to 24 Minutes | 23 | 17.0% |
| 25 to 29 Minutes | 0 | 0.0% |
| 30 to 34 Minutes | 15 | 11.1% |
| 35 to 39 Minutes | 0 | 0.0% |
| 40 to 44 Minutes | 7 | 5.2% |
| 45 to 59 Minutes | 0 | 0.0% |
| 60 to 89 Minutes | 35 | 25.9% |
| 90 or more Minutes | 10 | 7.4% |
Commute Time by Sex in Hackneyville
The most common commute times in Hackneyville are 20 to 24 minutes (23 commuters, 43.4%) for males and 15 to 19 minutes (36 commuters, 43.9%) for females.
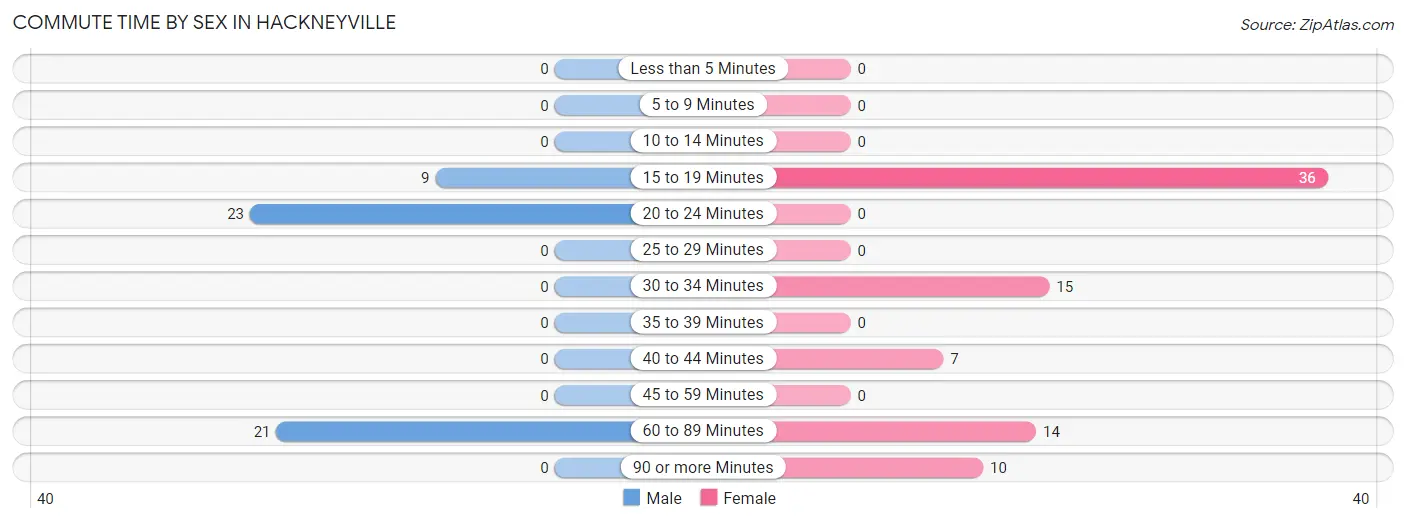
| Commute Time | Male | Female |
| Less than 5 Minutes | 0 (0.0%) | 0 (0.0%) |
| 5 to 9 Minutes | 0 (0.0%) | 0 (0.0%) |
| 10 to 14 Minutes | 0 (0.0%) | 0 (0.0%) |
| 15 to 19 Minutes | 9 (17.0%) | 36 (43.9%) |
| 20 to 24 Minutes | 23 (43.4%) | 0 (0.0%) |
| 25 to 29 Minutes | 0 (0.0%) | 0 (0.0%) |
| 30 to 34 Minutes | 0 (0.0%) | 15 (18.3%) |
| 35 to 39 Minutes | 0 (0.0%) | 0 (0.0%) |
| 40 to 44 Minutes | 0 (0.0%) | 7 (8.5%) |
| 45 to 59 Minutes | 0 (0.0%) | 0 (0.0%) |
| 60 to 89 Minutes | 21 (39.6%) | 14 (17.1%) |
| 90 or more Minutes | 0 (0.0%) | 10 (12.2%) |
Time of Departure to Work by Sex in Hackneyville
The most frequent times of departure to work in Hackneyville are 6:00 AM to 6:29 AM (30, 56.6%) for males and 7:30 AM to 7:59 AM (29, 35.4%) for females.
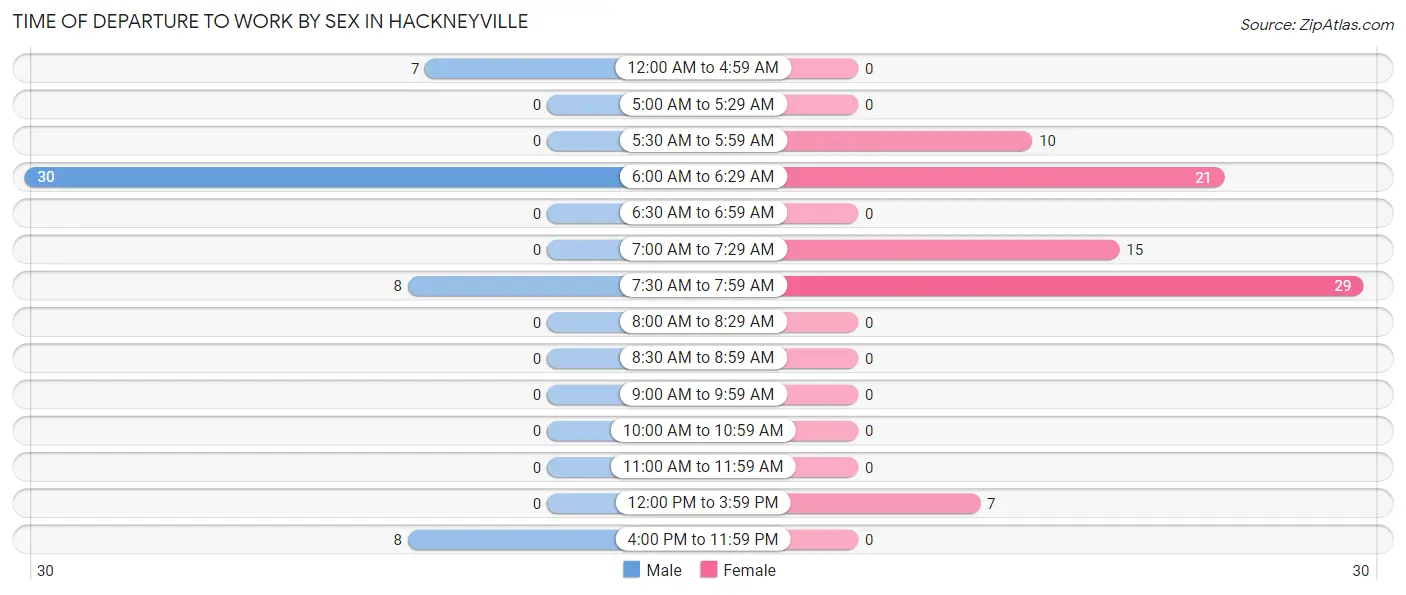
| Time of Departure | Male | Female |
| 12:00 AM to 4:59 AM | 7 (13.2%) | 0 (0.0%) |
| 5:00 AM to 5:29 AM | 0 (0.0%) | 0 (0.0%) |
| 5:30 AM to 5:59 AM | 0 (0.0%) | 10 (12.2%) |
| 6:00 AM to 6:29 AM | 30 (56.6%) | 21 (25.6%) |
| 6:30 AM to 6:59 AM | 0 (0.0%) | 0 (0.0%) |
| 7:00 AM to 7:29 AM | 0 (0.0%) | 15 (18.3%) |
| 7:30 AM to 7:59 AM | 8 (15.1%) | 29 (35.4%) |
| 8:00 AM to 8:29 AM | 0 (0.0%) | 0 (0.0%) |
| 8:30 AM to 8:59 AM | 0 (0.0%) | 0 (0.0%) |
| 9:00 AM to 9:59 AM | 0 (0.0%) | 0 (0.0%) |
| 10:00 AM to 10:59 AM | 0 (0.0%) | 0 (0.0%) |
| 11:00 AM to 11:59 AM | 0 (0.0%) | 0 (0.0%) |
| 12:00 PM to 3:59 PM | 0 (0.0%) | 7 (8.5%) |
| 4:00 PM to 11:59 PM | 8 (15.1%) | 0 (0.0%) |
| Total | 53 (100.0%) | 82 (100.0%) |
Housing Occupancy in Hackneyville
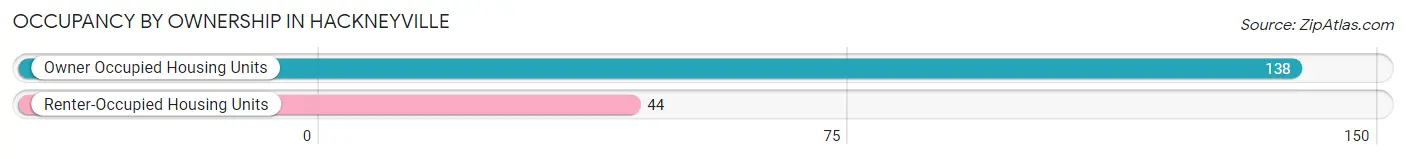
Occupancy by Ownership in Hackneyville
Of the total 182 dwellings in Hackneyville, owner-occupied units account for 138 (75.8%), while renter-occupied units make up 44 (24.2%).
| Occupancy | # Housing Units | % Housing Units |
| Owner Occupied Housing Units | 138 | 75.8% |
| Renter-Occupied Housing Units | 44 | 24.2% |
| Total Occupied Housing Units | 182 | 100.0% |
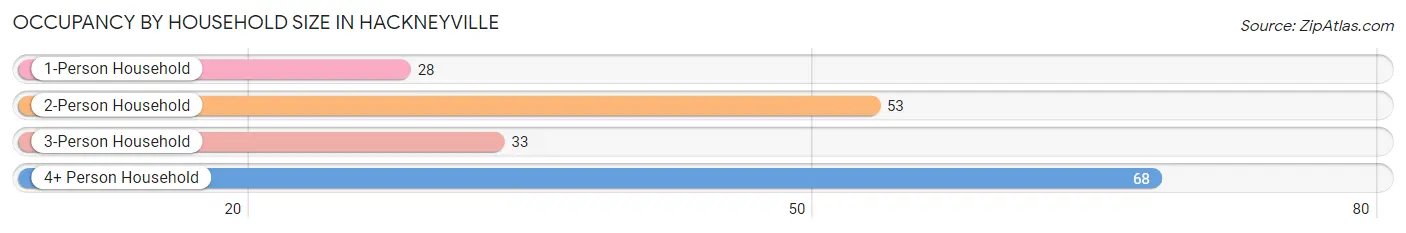
Occupancy by Household Size in Hackneyville
| Household Size | # Housing Units | % Housing Units |
| 1-Person Household | 28 | 15.4% |
| 2-Person Household | 53 | 29.1% |
| 3-Person Household | 33 | 18.1% |
| 4+ Person Household | 68 | 37.4% |
| Total Housing Units | 182 | 100.0% |
Occupancy by Ownership by Household Size in Hackneyville
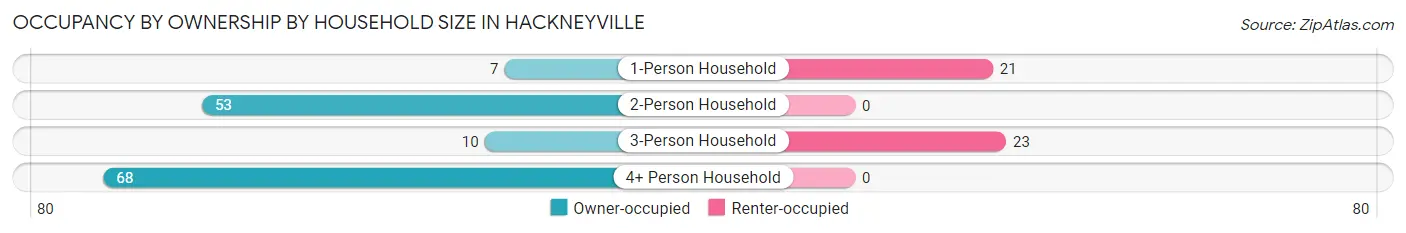
| Household Size | Owner-occupied | Renter-occupied |
| 1-Person Household | 7 (25.0%) | 21 (75.0%) |
| 2-Person Household | 53 (100.0%) | 0 (0.0%) |
| 3-Person Household | 10 (30.3%) | 23 (69.7%) |
| 4+ Person Household | 68 (100.0%) | 0 (0.0%) |
| Total Housing Units | 138 (75.8%) | 44 (24.2%) |
Occupancy by Educational Attainment in Hackneyville
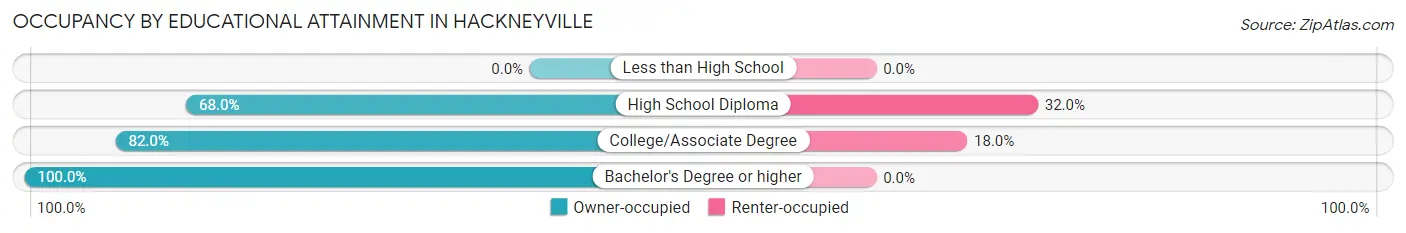
| Household Size | Owner-occupied | Renter-occupied |
| Less than High School | 0 (0.0%) | 0 (0.0%) |
| High School Diploma | 70 (68.0%) | 33 (32.0%) |
| College/Associate Degree | 50 (82.0%) | 11 (18.0%) |
| Bachelor's Degree or higher | 18 (100.0%) | 0 (0.0%) |
Occupancy by Age of Householder in Hackneyville
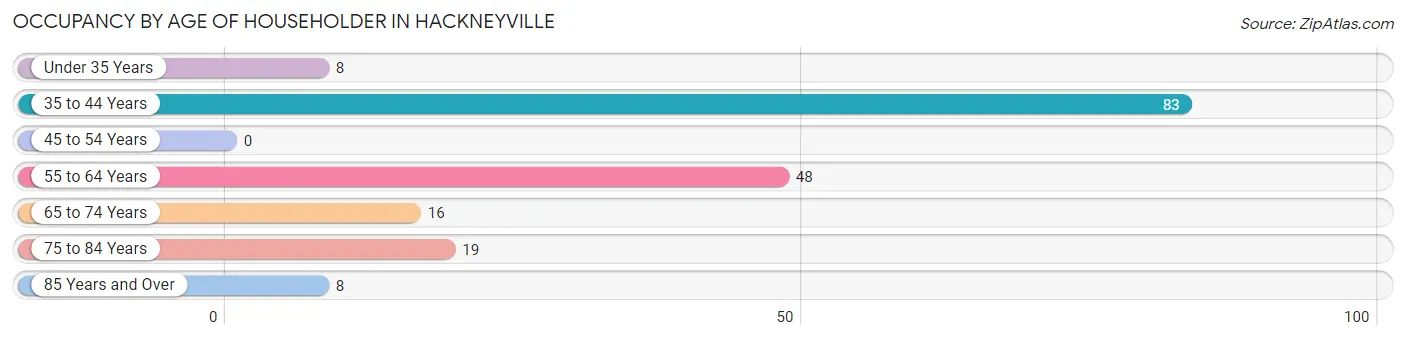
| Age Bracket | # Households | % Households |
| Under 35 Years | 8 | 4.4% |
| 35 to 44 Years | 83 | 45.6% |
| 45 to 54 Years | 0 | 0.0% |
| 55 to 64 Years | 48 | 26.4% |
| 65 to 74 Years | 16 | 8.8% |
| 75 to 84 Years | 19 | 10.4% |
| 85 Years and Over | 8 | 4.4% |
| Total | 182 | 100.0% |
Housing Finances in Hackneyville
Median Income by Occupancy in Hackneyville
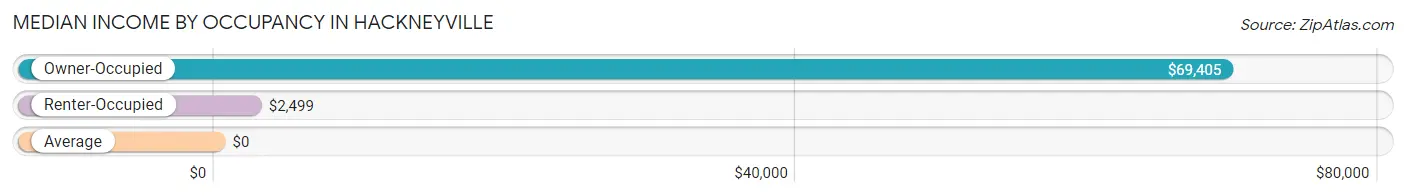
| Occupancy Type | # Households | Median Income |
| Owner-Occupied | 138 (75.8%) | $69,405 |
| Renter-Occupied | 44 (24.2%) | $2,499 |
| Average | 182 (100.0%) | $0 |
Occupancy by Householder Income Bracket in Hackneyville
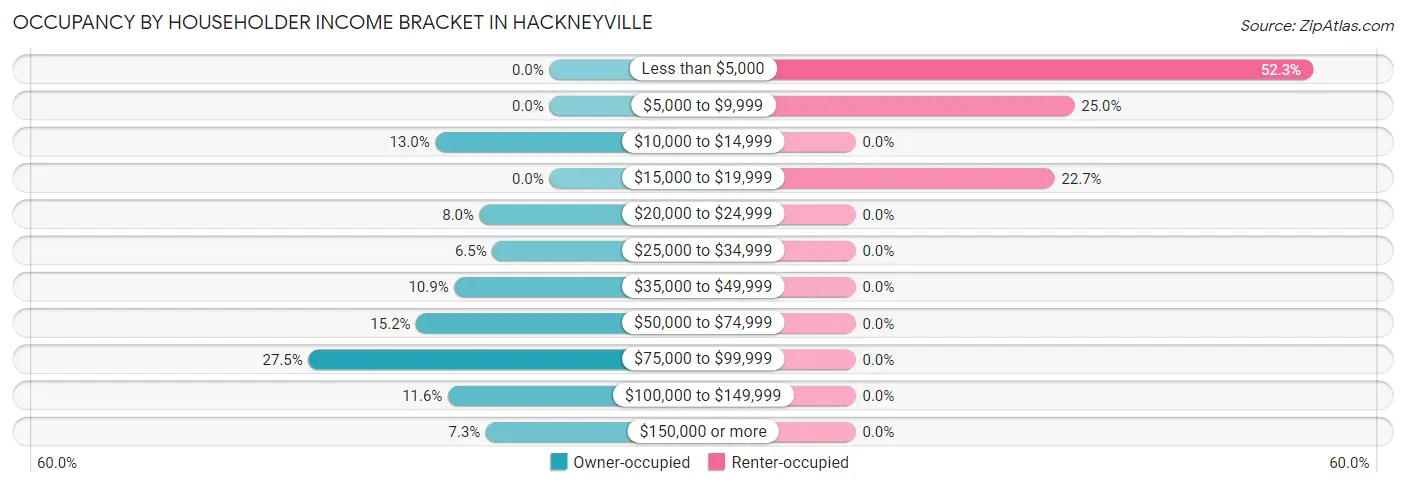
| Income Bracket | Owner-occupied | Renter-occupied |
| Less than $5,000 | 0 (0.0%) | 23 (52.3%) |
| $5,000 to $9,999 | 0 (0.0%) | 11 (25.0%) |
| $10,000 to $14,999 | 18 (13.0%) | 0 (0.0%) |
| $15,000 to $19,999 | 0 (0.0%) | 10 (22.7%) |
| $20,000 to $24,999 | 11 (8.0%) | 0 (0.0%) |
| $25,000 to $34,999 | 9 (6.5%) | 0 (0.0%) |
| $35,000 to $49,999 | 15 (10.9%) | 0 (0.0%) |
| $50,000 to $74,999 | 21 (15.2%) | 0 (0.0%) |
| $75,000 to $99,999 | 38 (27.5%) | 0 (0.0%) |
| $100,000 to $149,999 | 16 (11.6%) | 0 (0.0%) |
| $150,000 or more | 10 (7.2%) | 0 (0.0%) |
| Total | 138 (100.0%) | 44 (100.0%) |
Monthly Housing Cost Tiers in Hackneyville
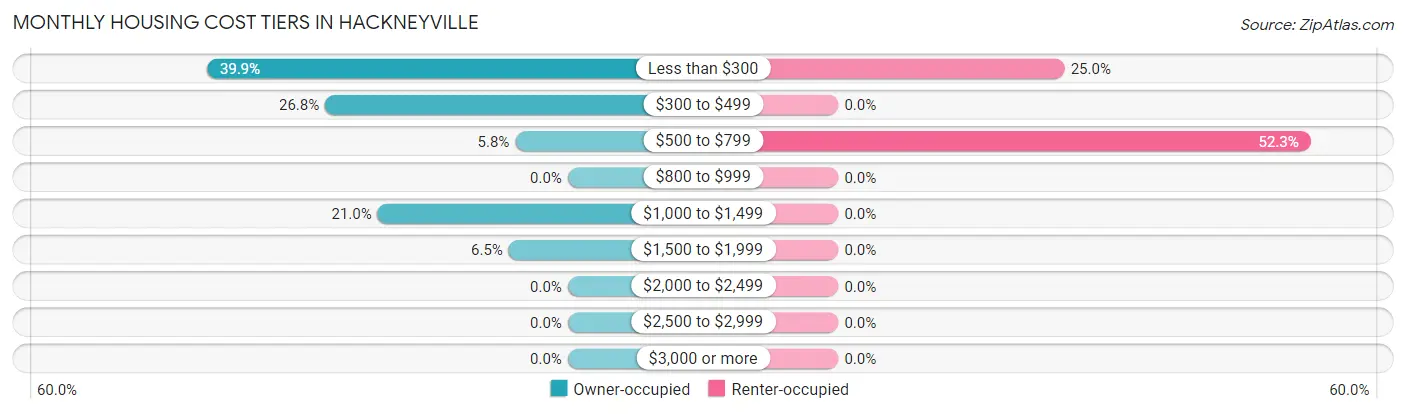
| Monthly Cost | Owner-occupied | Renter-occupied |
| Less than $300 | 55 (39.9%) | 11 (25.0%) |
| $300 to $499 | 37 (26.8%) | 0 (0.0%) |
| $500 to $799 | 8 (5.8%) | 23 (52.3%) |
| $800 to $999 | 0 (0.0%) | 0 (0.0%) |
| $1,000 to $1,499 | 29 (21.0%) | 0 (0.0%) |
| $1,500 to $1,999 | 9 (6.5%) | 0 (0.0%) |
| $2,000 to $2,499 | 0 (0.0%) | 0 (0.0%) |
| $2,500 to $2,999 | 0 (0.0%) | 0 (0.0%) |
| $3,000 or more | 0 (0.0%) | 0 (0.0%) |
| Total | 138 (100.0%) | 44 (100.0%) |
Physical Housing Characteristics in Hackneyville
Housing Structures in Hackneyville
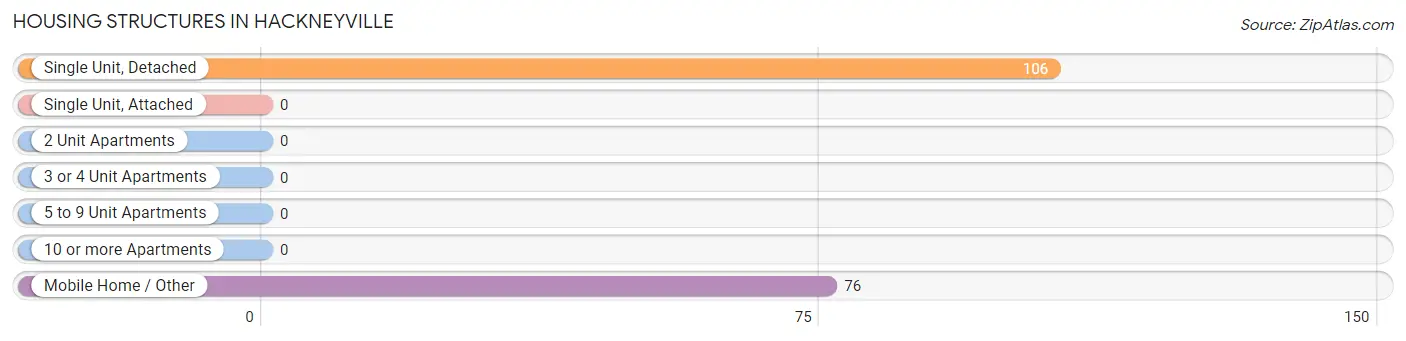
| Structure Type | # Housing Units | % Housing Units |
| Single Unit, Detached | 106 | 58.2% |
| Single Unit, Attached | 0 | 0.0% |
| 2 Unit Apartments | 0 | 0.0% |
| 3 or 4 Unit Apartments | 0 | 0.0% |
| 5 to 9 Unit Apartments | 0 | 0.0% |
| 10 or more Apartments | 0 | 0.0% |
| Mobile Home / Other | 76 | 41.8% |
| Total | 182 | 100.0% |
Housing Structures by Occupancy in Hackneyville
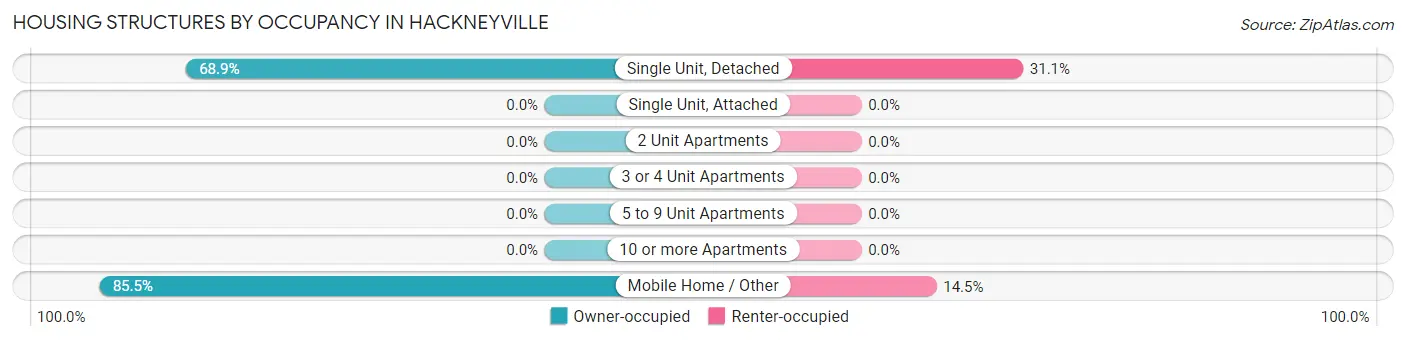
| Structure Type | Owner-occupied | Renter-occupied |
| Single Unit, Detached | 73 (68.9%) | 33 (31.1%) |
| Single Unit, Attached | 0 (0.0%) | 0 (0.0%) |
| 2 Unit Apartments | 0 (0.0%) | 0 (0.0%) |
| 3 or 4 Unit Apartments | 0 (0.0%) | 0 (0.0%) |
| 5 to 9 Unit Apartments | 0 (0.0%) | 0 (0.0%) |
| 10 or more Apartments | 0 (0.0%) | 0 (0.0%) |
| Mobile Home / Other | 65 (85.5%) | 11 (14.5%) |
| Total | 138 (75.8%) | 44 (24.2%) |
Housing Structures by Number of Rooms in Hackneyville
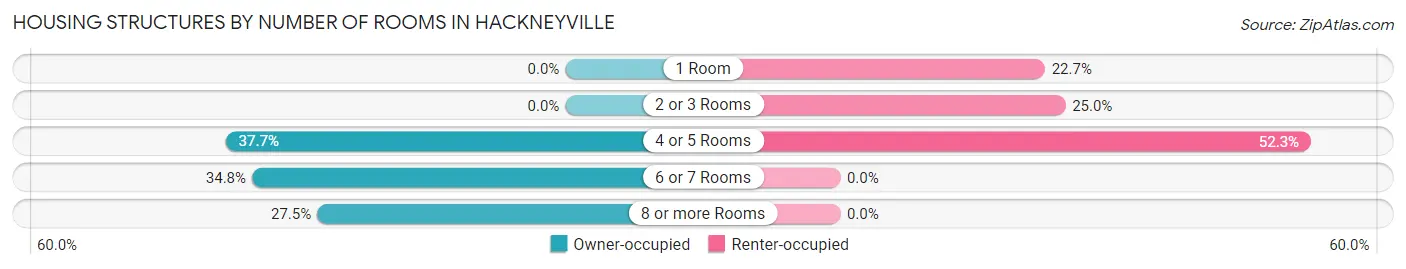
| Number of Rooms | Owner-occupied | Renter-occupied |
| 1 Room | 0 (0.0%) | 10 (22.7%) |
| 2 or 3 Rooms | 0 (0.0%) | 11 (25.0%) |
| 4 or 5 Rooms | 52 (37.7%) | 23 (52.3%) |
| 6 or 7 Rooms | 48 (34.8%) | 0 (0.0%) |
| 8 or more Rooms | 38 (27.5%) | 0 (0.0%) |
| Total | 138 (100.0%) | 44 (100.0%) |
Housing Structure by Heating Type in Hackneyville
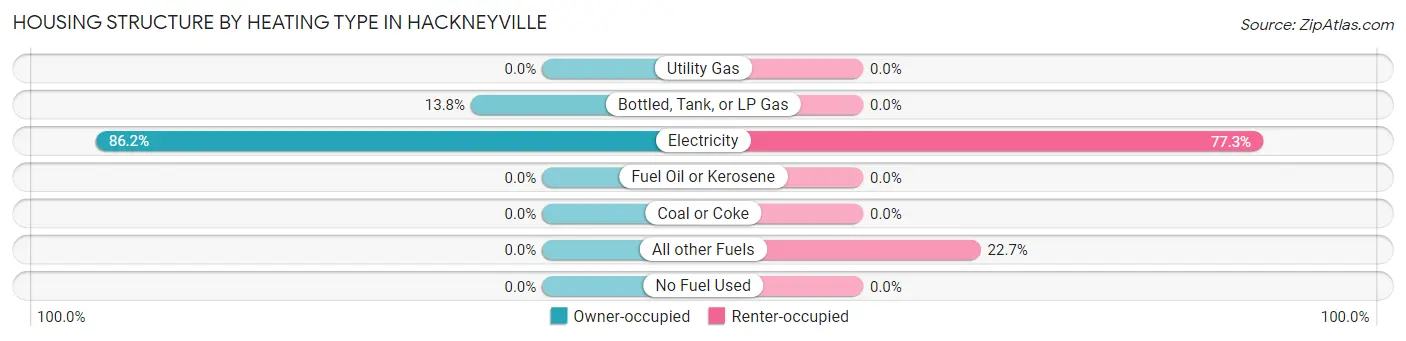
| Heating Type | Owner-occupied | Renter-occupied |
| Utility Gas | 0 (0.0%) | 0 (0.0%) |
| Bottled, Tank, or LP Gas | 19 (13.8%) | 0 (0.0%) |
| Electricity | 119 (86.2%) | 34 (77.3%) |
| Fuel Oil or Kerosene | 0 (0.0%) | 0 (0.0%) |
| Coal or Coke | 0 (0.0%) | 0 (0.0%) |
| All other Fuels | 0 (0.0%) | 10 (22.7%) |
| No Fuel Used | 0 (0.0%) | 0 (0.0%) |
| Total | 138 (100.0%) | 44 (100.0%) |
Household Vehicle Usage in Hackneyville
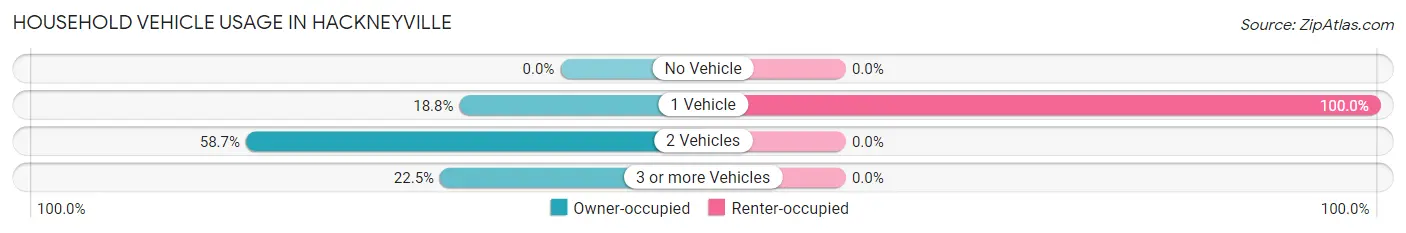
| Vehicles per Household | Owner-occupied | Renter-occupied |
| No Vehicle | 0 (0.0%) | 0 (0.0%) |
| 1 Vehicle | 26 (18.8%) | 44 (100.0%) |
| 2 Vehicles | 81 (58.7%) | 0 (0.0%) |
| 3 or more Vehicles | 31 (22.5%) | 0 (0.0%) |
| Total | 138 (100.0%) | 44 (100.0%) |
Real Estate & Mortgages in Hackneyville
Real Estate and Mortgage Overview in Hackneyville
| Characteristic | Without Mortgage | With Mortgage |
| Housing Units | 89 | 49 |
| Median Property Value | $46,200 | $161,600 |
| Median Household Income | $82,716 | $0 |
| Monthly Housing Costs | $280 | $0 |
| Real Estate Taxes | $199 | $9 |
Property Value by Mortgage Status in Hackneyville

| Property Value | Without Mortgage | With Mortgage |
| Less than $50,000 | 56 (62.9%) | 11 (22.5%) |
| $50,000 to $99,999 | 15 (16.9%) | 0 (0.0%) |
| $100,000 to $299,999 | 10 (11.2%) | 38 (77.5%) |
| $300,000 to $499,999 | 8 (9.0%) | 0 (0.0%) |
| $500,000 to $749,999 | 0 (0.0%) | 0 (0.0%) |
| $750,000 to $999,999 | 0 (0.0%) | 0 (0.0%) |
| $1,000,000 or more | 0 (0.0%) | 0 (0.0%) |
| Total | 89 (100.0%) | 49 (100.0%) |
Household Income by Mortgage Status in Hackneyville
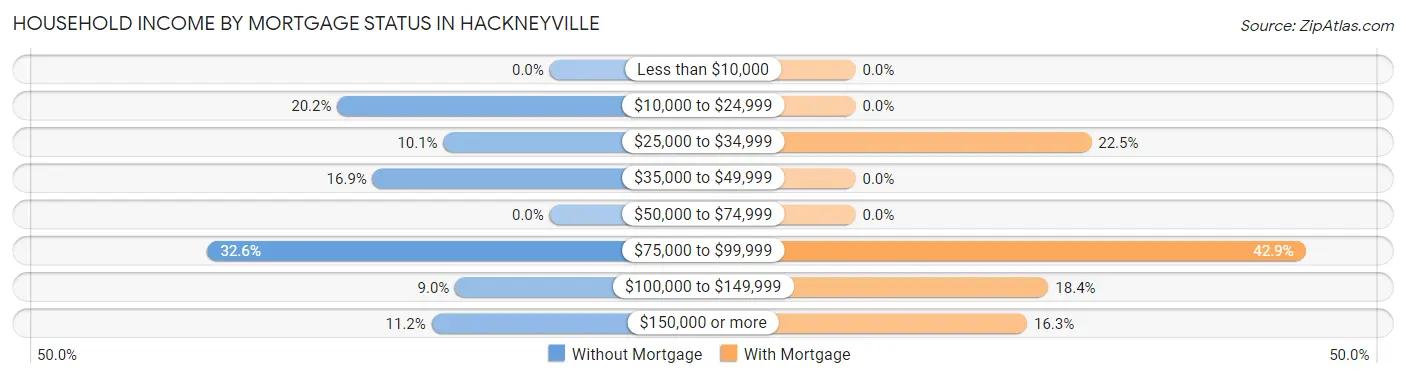
| Household Income | Without Mortgage | With Mortgage |
| Less than $10,000 | 0 (0.0%) | 0 (0.0%) |
| $10,000 to $24,999 | 18 (20.2%) | 0 (0.0%) |
| $25,000 to $34,999 | 9 (10.1%) | 11 (22.5%) |
| $35,000 to $49,999 | 15 (16.9%) | 0 (0.0%) |
| $50,000 to $74,999 | 0 (0.0%) | 0 (0.0%) |
| $75,000 to $99,999 | 29 (32.6%) | 21 (42.9%) |
| $100,000 to $149,999 | 8 (9.0%) | 9 (18.4%) |
| $150,000 or more | 10 (11.2%) | 8 (16.3%) |
| Total | 89 (100.0%) | 49 (100.0%) |
Property Value to Household Income Ratio in Hackneyville
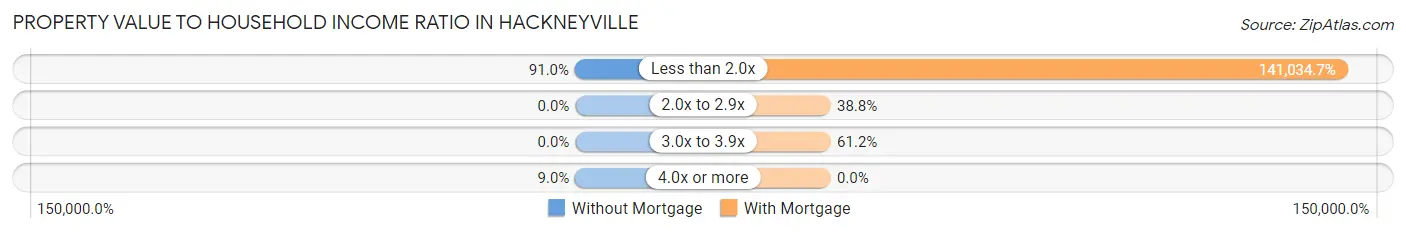
| Value-to-Income Ratio | Without Mortgage | With Mortgage |
| Less than 2.0x | 81 (91.0%) | 69,107 (141,034.7%) |
| 2.0x to 2.9x | 0 (0.0%) | 19 (38.8%) |
| 3.0x to 3.9x | 0 (0.0%) | 30 (61.2%) |
| 4.0x or more | 8 (9.0%) | 0 (0.0%) |
| Total | 89 (100.0%) | 49 (100.0%) |
Real Estate Taxes by Mortgage Status in Hackneyville
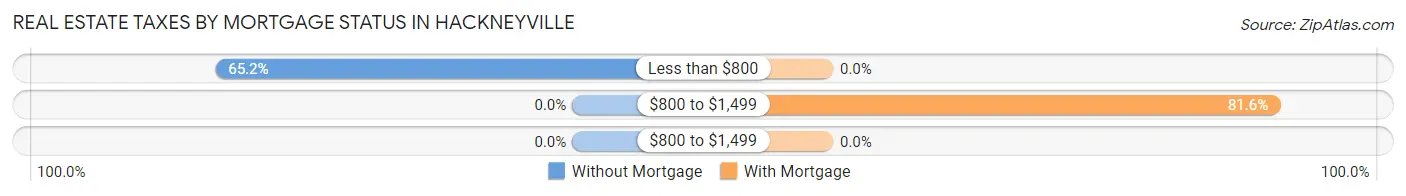
| Property Taxes | Without Mortgage | With Mortgage |
| Less than $800 | 58 (65.2%) | 0 (0.0%) |
| $800 to $1,499 | 0 (0.0%) | 40 (81.6%) |
| $800 to $1,499 | 0 (0.0%) | 0 (0.0%) |
| Total | 89 (100.0%) | 49 (100.0%) |
Health & Disability in Hackneyville
Health Insurance Coverage by Age in Hackneyville
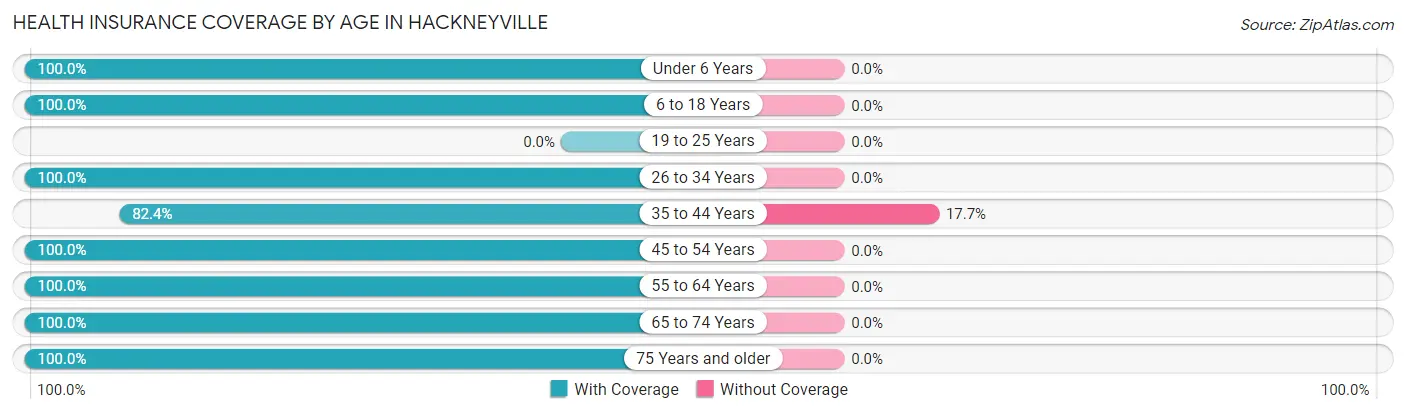
| Age Bracket | With Coverage | Without Coverage |
| Under 6 Years | 101 (100.0%) | 0 (0.0%) |
| 6 to 18 Years | 176 (100.0%) | 0 (0.0%) |
| 19 to 25 Years | 0 (0.0%) | 0 (0.0%) |
| 26 to 34 Years | 63 (100.0%) | 0 (0.0%) |
| 35 to 44 Years | 84 (82.4%) | 18 (17.6%) |
| 45 to 54 Years | 8 (100.0%) | 0 (0.0%) |
| 55 to 64 Years | 76 (100.0%) | 0 (0.0%) |
| 65 to 74 Years | 33 (100.0%) | 0 (0.0%) |
| 75 Years and older | 35 (100.0%) | 0 (0.0%) |
| Total | 576 (97.0%) | 18 (3.0%) |
Health Insurance Coverage by Citizenship Status in Hackneyville
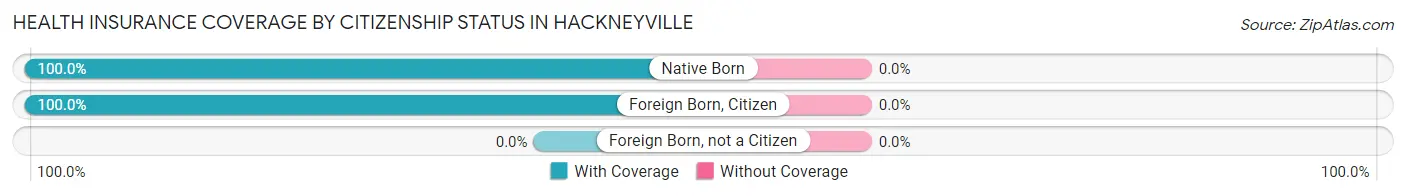
| Citizenship Status | With Coverage | Without Coverage |
| Native Born | 101 (100.0%) | 0 (0.0%) |
| Foreign Born, Citizen | 176 (100.0%) | 0 (0.0%) |
| Foreign Born, not a Citizen | 0 (0.0%) | 0 (0.0%) |
Health Insurance Coverage by Household Income in Hackneyville
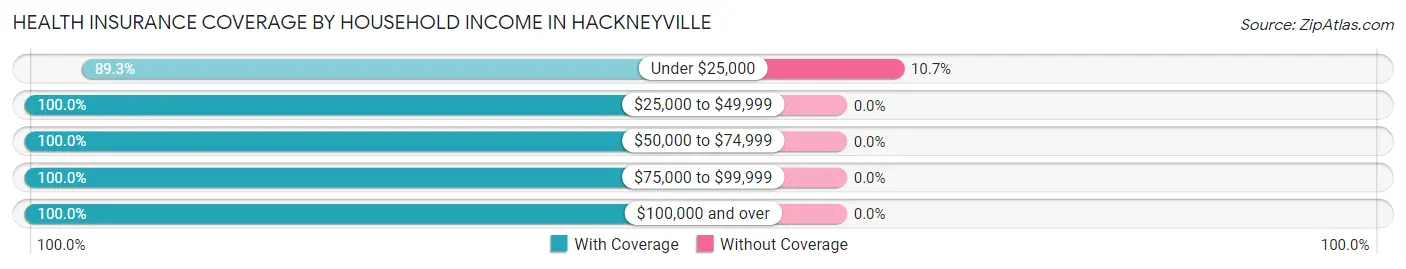
| Household Income | With Coverage | Without Coverage |
| Under $25,000 | 150 (89.3%) | 18 (10.7%) |
| $25,000 to $49,999 | 40 (100.0%) | 0 (0.0%) |
| $50,000 to $74,999 | 101 (100.0%) | 0 (0.0%) |
| $75,000 to $99,999 | 219 (100.0%) | 0 (0.0%) |
| $100,000 and over | 66 (100.0%) | 0 (0.0%) |
Public vs Private Health Insurance Coverage by Age in Hackneyville
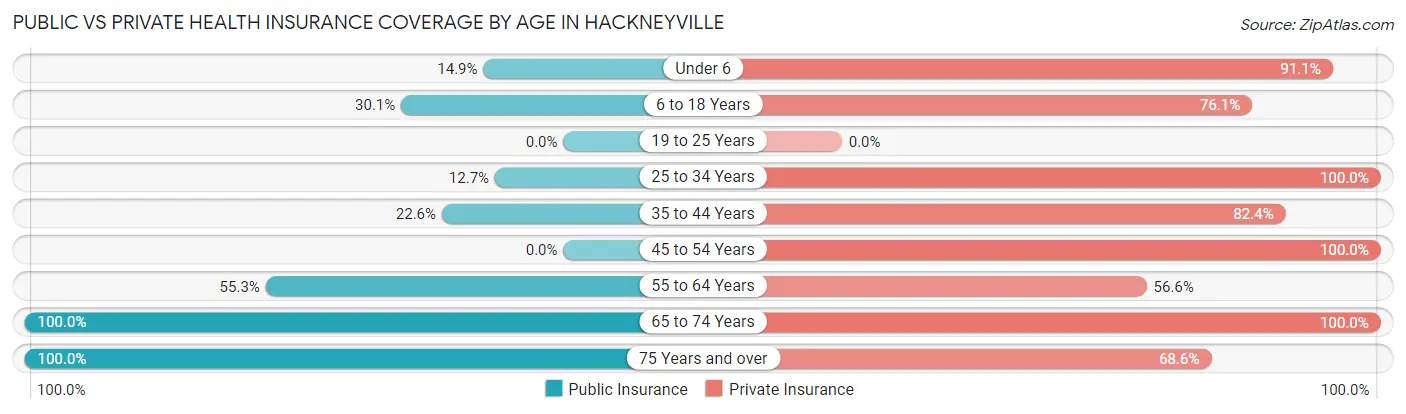
| Age Bracket | Public Insurance | Private Insurance |
| Under 6 | 15 (14.8%) | 92 (91.1%) |
| 6 to 18 Years | 53 (30.1%) | 134 (76.1%) |
| 19 to 25 Years | 0 (0.0%) | 0 (0.0%) |
| 25 to 34 Years | 8 (12.7%) | 63 (100.0%) |
| 35 to 44 Years | 23 (22.6%) | 84 (82.4%) |
| 45 to 54 Years | 0 (0.0%) | 8 (100.0%) |
| 55 to 64 Years | 42 (55.3%) | 43 (56.6%) |
| 65 to 74 Years | 33 (100.0%) | 33 (100.0%) |
| 75 Years and over | 35 (100.0%) | 24 (68.6%) |
| Total | 209 (35.2%) | 481 (81.0%) |
Disability Status by Sex by Age in Hackneyville
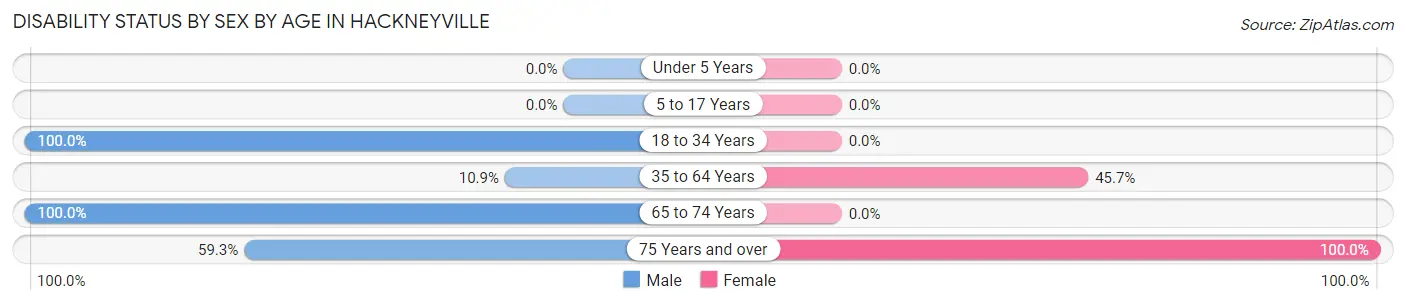
| Age Bracket | Male | Female |
| Under 5 Years | 0 (0.0%) | 0 (0.0%) |
| 5 to 17 Years | 0 (0.0%) | 0 (0.0%) |
| 18 to 34 Years | 8 (100.0%) | 0 (0.0%) |
| 35 to 64 Years | 10 (10.9%) | 43 (45.7%) |
| 65 to 74 Years | 9 (100.0%) | 0 (0.0%) |
| 75 Years and over | 16 (59.3%) | 8 (100.0%) |
Disability Class by Sex by Age in Hackneyville
Disability Class: Hearing Difficulty
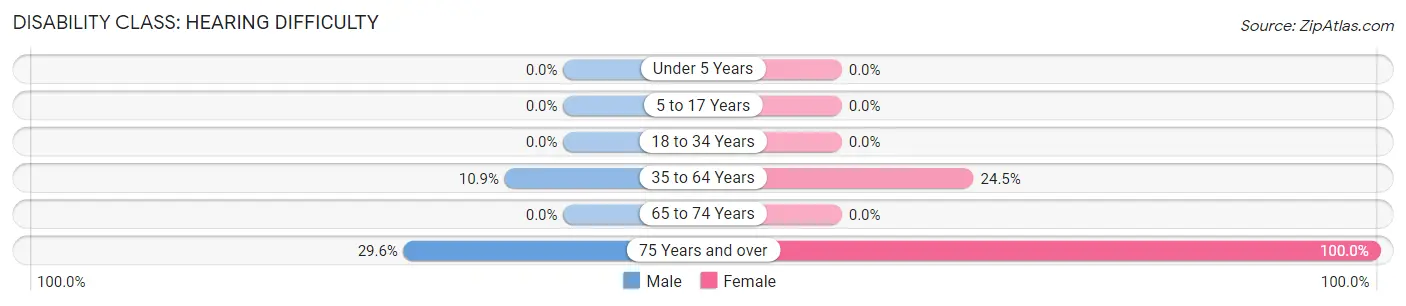
| Age Bracket | Male | Female |
| Under 5 Years | 0 (0.0%) | 0 (0.0%) |
| 5 to 17 Years | 0 (0.0%) | 0 (0.0%) |
| 18 to 34 Years | 0 (0.0%) | 0 (0.0%) |
| 35 to 64 Years | 10 (10.9%) | 23 (24.5%) |
| 65 to 74 Years | 0 (0.0%) | 0 (0.0%) |
| 75 Years and over | 8 (29.6%) | 8 (100.0%) |
Disability Class: Vision Difficulty
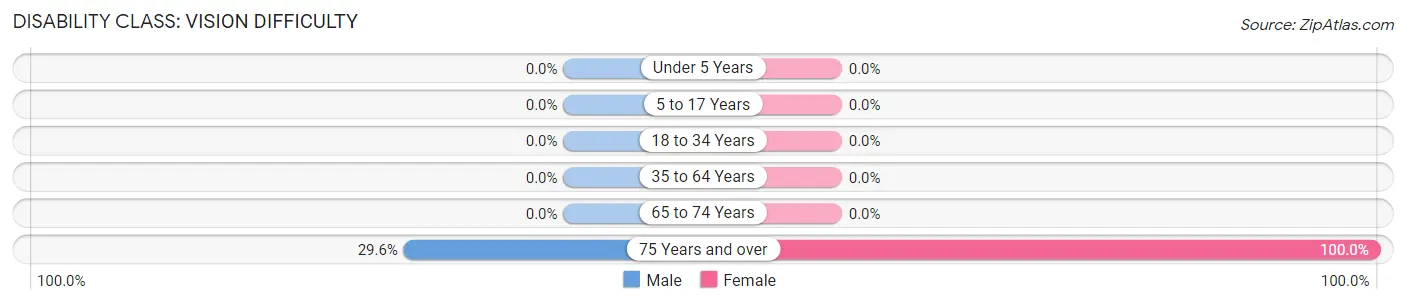
| Age Bracket | Male | Female |
| Under 5 Years | 0 (0.0%) | 0 (0.0%) |
| 5 to 17 Years | 0 (0.0%) | 0 (0.0%) |
| 18 to 34 Years | 0 (0.0%) | 0 (0.0%) |
| 35 to 64 Years | 0 (0.0%) | 0 (0.0%) |
| 65 to 74 Years | 0 (0.0%) | 0 (0.0%) |
| 75 Years and over | 8 (29.6%) | 8 (100.0%) |
Disability Class: Cognitive Difficulty
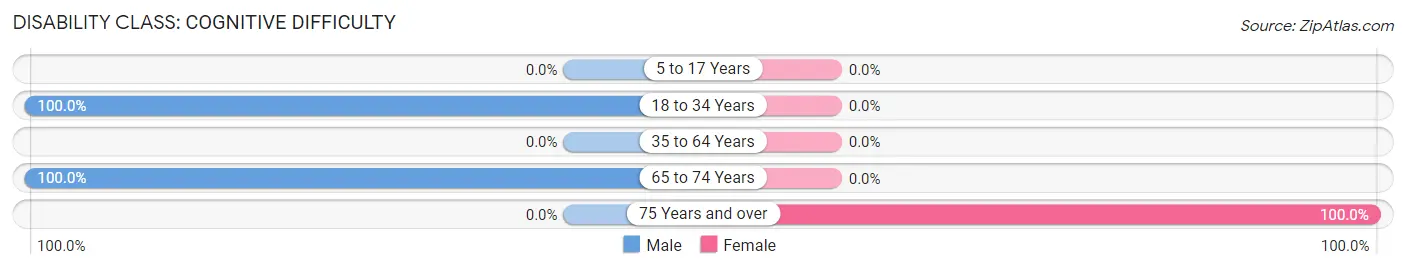
| Age Bracket | Male | Female |
| 5 to 17 Years | 0 (0.0%) | 0 (0.0%) |
| 18 to 34 Years | 8 (100.0%) | 0 (0.0%) |
| 35 to 64 Years | 0 (0.0%) | 0 (0.0%) |
| 65 to 74 Years | 9 (100.0%) | 0 (0.0%) |
| 75 Years and over | 0 (0.0%) | 8 (100.0%) |
Disability Class: Ambulatory Difficulty
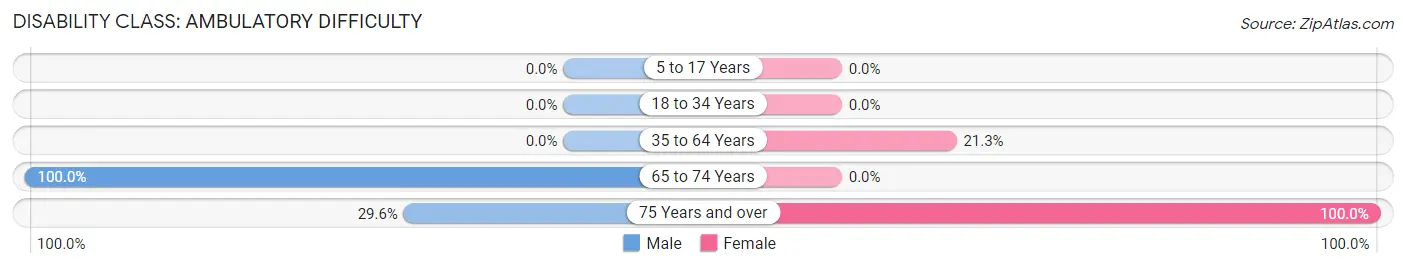
| Age Bracket | Male | Female |
| 5 to 17 Years | 0 (0.0%) | 0 (0.0%) |
| 18 to 34 Years | 0 (0.0%) | 0 (0.0%) |
| 35 to 64 Years | 0 (0.0%) | 20 (21.3%) |
| 65 to 74 Years | 9 (100.0%) | 0 (0.0%) |
| 75 Years and over | 8 (29.6%) | 8 (100.0%) |
Disability Class: Self-Care Difficulty
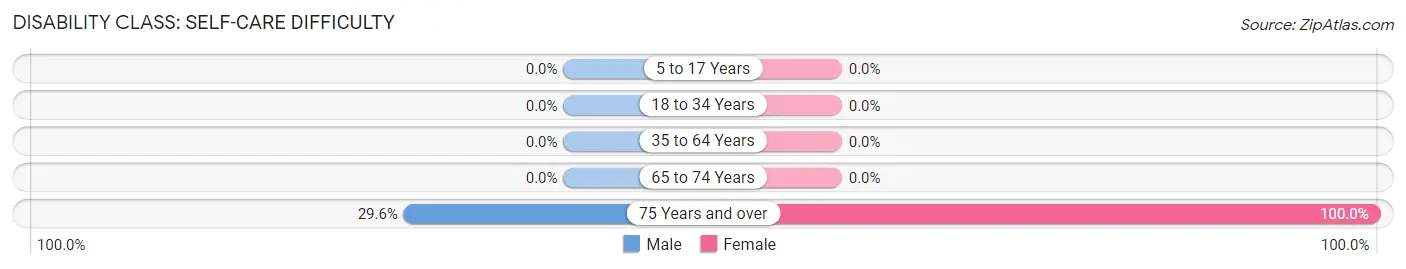
| Age Bracket | Male | Female |
| 5 to 17 Years | 0 (0.0%) | 0 (0.0%) |
| 18 to 34 Years | 0 (0.0%) | 0 (0.0%) |
| 35 to 64 Years | 0 (0.0%) | 0 (0.0%) |
| 65 to 74 Years | 0 (0.0%) | 0 (0.0%) |
| 75 Years and over | 8 (29.6%) | 8 (100.0%) |
Technology Access in Hackneyville
Computing Device Access in Hackneyville
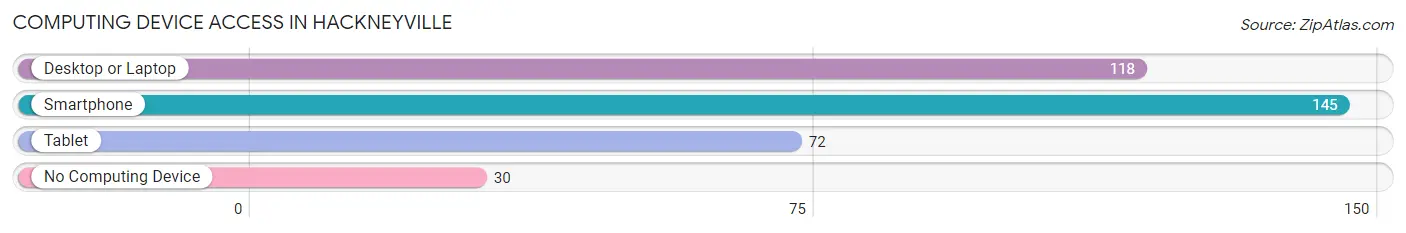
| Device Type | # Households | % Households |
| Desktop or Laptop | 118 | 64.8% |
| Smartphone | 145 | 79.7% |
| Tablet | 72 | 39.6% |
| No Computing Device | 30 | 16.5% |
| Total | 182 | 100.0% |
Internet Access in Hackneyville
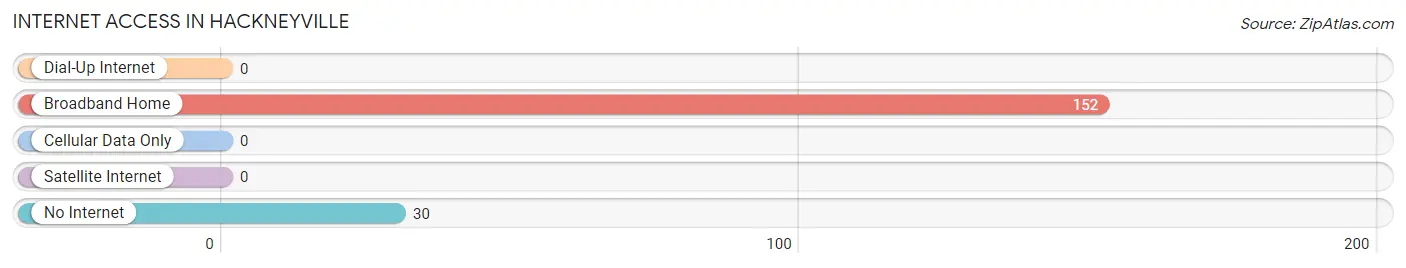
| Internet Type | # Households | % Households |
| Dial-Up Internet | 0 | 0.0% |
| Broadband Home | 152 | 83.5% |
| Cellular Data Only | 0 | 0.0% |
| Satellite Internet | 0 | 0.0% |
| No Internet | 30 | 16.5% |
| Total | 182 | 100.0% |
Hackneyville Summary
Introduction
Hackneyville is a small unincorporated community located in the southeastern corner of Alabama, in the United States. It is situated in the rural countryside of Crenshaw County, and is home to a population of just over 500 people. The town is known for its rich history, its unique geography, and its diverse economy. This paper will explore the history, geography, economy, and demographics of Hackneyville in 2000 words.
History
The history of Hackneyville dates back to the early 1800s, when the area was first settled by European settlers. The town was originally known as “Hackney’s Crossroads”, named after the Hackney family who were among the first settlers in the area. The town was officially incorporated in 1837, and was named after the Hackney family.
The town was a thriving agricultural community in the late 1800s and early 1900s, with cotton and corn being the primary crops grown in the area. The town also had a thriving timber industry, with several sawmills located in the area.
In the early 1900s, the town began to experience a decline in population as many of the residents moved away in search of better economic opportunities. This trend continued until the 1950s, when the town began to experience a resurgence in population growth. This was due in part to the construction of a new highway, which connected Hackneyville to the nearby cities of Montgomery and Mobile.
Geography
Hackneyville is located in the southeastern corner of Alabama, in the United States. It is situated in the rural countryside of Crenshaw County, and is home to a population of just over 500 people. The town is located at the intersection of two major highways, US Highway 84 and Alabama State Route 55.
The town is situated on a plateau, with an elevation of approximately 500 feet above sea level. The town is surrounded by rolling hills and forests, and is located near the Conecuh River. The town is also located near the Conecuh National Forest, which is a popular destination for outdoor recreation.
Economy
The economy of Hackneyville is largely based on agriculture and timber production. The town is home to several farms, which produce a variety of crops such as cotton, corn, soybeans, and peanuts. The town also has several sawmills, which produce lumber for the local market.
In addition to agriculture and timber production, the town is also home to several small businesses. These businesses include a grocery store, a hardware store, a gas station, and a few restaurants. The town also has a post office, a bank, and a library.
Demographics
As of the 2010 census, the population of Hackneyville was 514 people. The town is predominantly white, with the majority of the population being of European descent. The town also has a small African American population, as well as a small Hispanic population.
The median household income in Hackneyville is $31,250, and the median age is 44. The town has a high rate of poverty, with nearly 30% of the population living below the poverty line.
Conclusion
Hackneyville is a small unincorporated community located in the southeastern corner of Alabama, in the United States. It is home to a population of just over 500 people, and is known for its rich history, its unique geography, and its diverse economy. The town is largely based on agriculture and timber production, and is home to several small businesses. The town also has a high rate of poverty, with nearly 30% of the population living below the poverty line.
Common Questions
What is Per Capita Income in Hackneyville?
Per Capita income in Hackneyville is $16,903.
What is the Median Family Income in Hackneyville?
Median Family Income in Hackneyville is $68,452.
What is Income or Wage Gap in Hackneyville?
Income or Wage Gap in Hackneyville is 24.1%.
Women in Hackneyville earn 75.9 cents for every dollar earned by a man.
What is Inequality or Gini Index in Hackneyville?
Inequality or Gini Index in Hackneyville is 0.47.
What is the Total Population of Hackneyville?
Total Population of Hackneyville is 594.
What is the Total Male Population of Hackneyville?
Total Male Population of Hackneyville is 296.
What is the Total Female Population of Hackneyville?
Total Female Population of Hackneyville is 298.
What is the Ratio of Males per 100 Females in Hackneyville?
There are 99.33 Males per 100 Females in Hackneyville.
What is the Ratio of Females per 100 Males in Hackneyville?
There are 100.68 Females per 100 Males in Hackneyville.
What is the Median Population Age in Hackneyville?
Median Population Age in Hackneyville is 29.4 Years.
What is the Average Family Size in Hackneyville
Average Family Size in Hackneyville is 3.7 People.
What is the Average Household Size in Hackneyville
Average Household Size in Hackneyville is 3.3 People.
How Large is the Labor Force in Hackneyville?
There are 177 People in the Labor Forcein in Hackneyville.
What is the Percentage of People in the Labor Force in Hackneyville?
52.1% of People are in the Labor Force in Hackneyville.
What is the Unemployment Rate in Hackneyville?
Unemployment Rate in Hackneyville is 13.0%.