Monroeville, AL Map & Demographics
Monroeville Map
Monroeville Overview
$23,256
PER CAPITA INCOME
$56,806
AVG FAMILY INCOME
$32,040
AVG HOUSEHOLD INCOME
35.9%
WAGE / INCOME GAP [ % ]
64.1¢/ $1
WAGE / INCOME GAP [ $ ]
0.50
INEQUALITY / GINI INDEX
5,917
TOTAL POPULATION
2,945
MALE POPULATION
2,972
FEMALE POPULATION
99.09
MALES / 100 FEMALES
100.92
FEMALES / 100 MALES
43.3
MEDIAN AGE
3.5
AVG FAMILY SIZE
2.4
AVG HOUSEHOLD SIZE
2,193
LABOR FORCE [ PEOPLE ]
48.0%
PERCENT IN LABOR FORCE
14.5%
UNEMPLOYMENT RATE
Monroeville Zip Codes
Monroeville Area Codes
Income in Monroeville
Income Overview in Monroeville
Per Capita Income in Monroeville is $23,256, while median incomes of families and households are $56,806 and $32,040 respectively.
| Characteristic | Number | Measure |
| Per Capita Income | 5,917 | $23,256 |
| Median Family Income | 1,230 | $56,806 |
| Mean Family Income | 1,230 | $74,708 |
| Median Household Income | 2,380 | $32,040 |
| Mean Household Income | 2,380 | $53,308 |
| Income Deficit | 1,230 | $0 |
| Wage / Income Gap (%) | 5,917 | 35.92% |
| Wage / Income Gap ($) | 5,917 | 64.08¢ per $1 |
| Gini / Inequality Index | 5,917 | 0.50 |
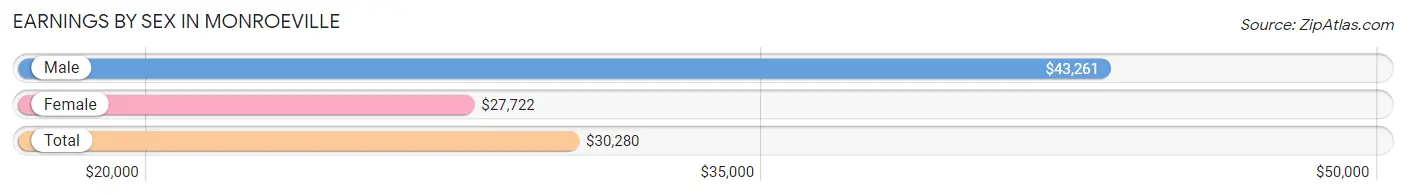
Earnings by Sex in Monroeville
Average Earnings in Monroeville are $30,280, $43,261 for men and $27,722 for women, a difference of 35.9%.
| Sex | Number | Average Earnings |
| Male | 890 (42.6%) | $43,261 |
| Female | 1,200 (57.4%) | $27,722 |
| Total | 2,090 (100.0%) | $30,280 |
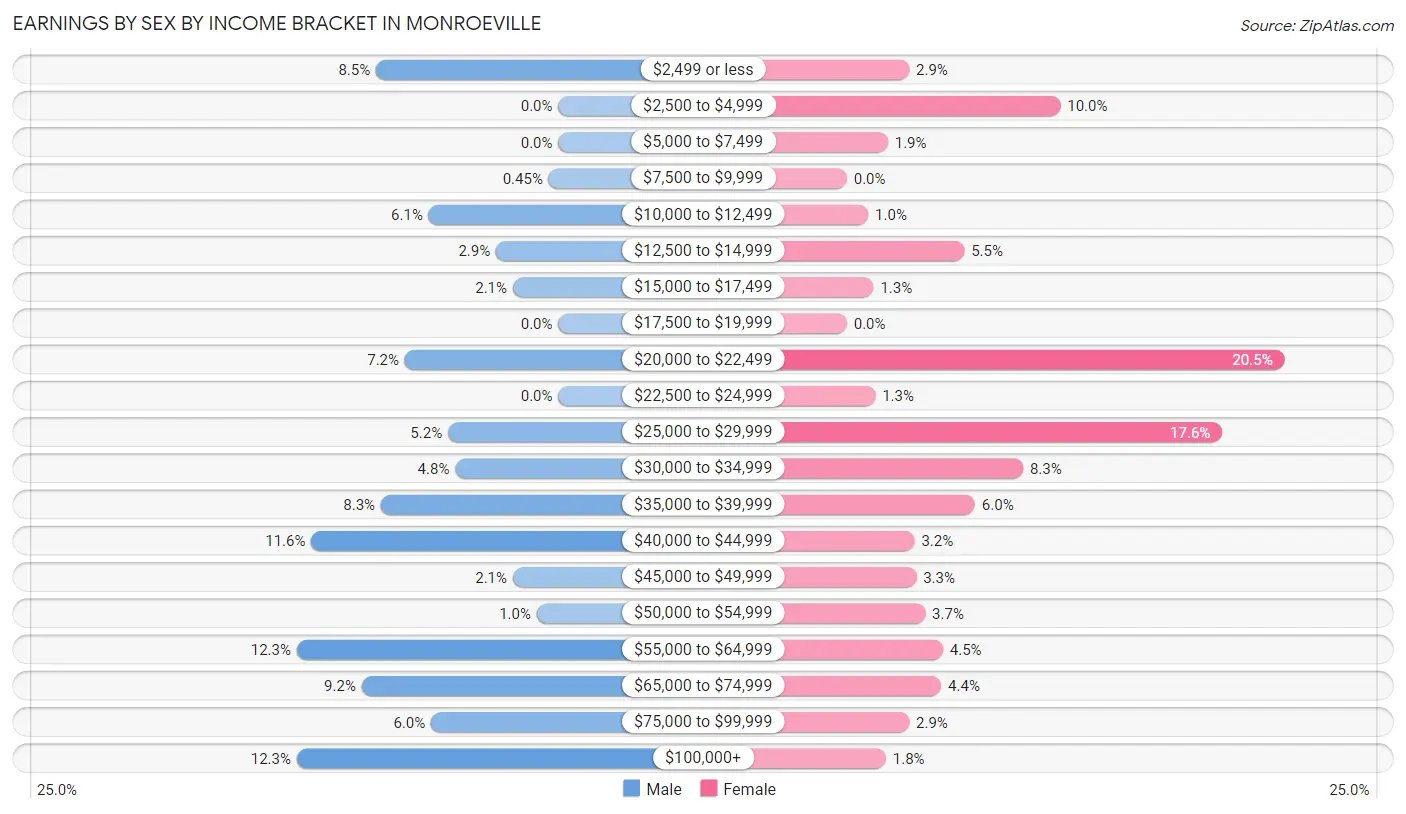
Earnings by Sex by Income Bracket in Monroeville
The most common earnings brackets in Monroeville are $55,000 to $64,999 for men (109 | 12.2%) and $20,000 to $22,499 for women (246 | 20.5%).
| Income | Male | Female |
| $2,499 or less | 76 (8.5%) | 35 (2.9%) |
| $2,500 to $4,999 | 0 (0.0%) | 120 (10.0%) |
| $5,000 to $7,499 | 0 (0.0%) | 23 (1.9%) |
| $7,500 to $9,999 | 4 (0.4%) | 0 (0.0%) |
| $10,000 to $12,499 | 54 (6.1%) | 12 (1.0%) |
| $12,500 to $14,999 | 26 (2.9%) | 66 (5.5%) |
| $15,000 to $17,499 | 19 (2.1%) | 15 (1.3%) |
| $17,500 to $19,999 | 0 (0.0%) | 0 (0.0%) |
| $20,000 to $22,499 | 64 (7.2%) | 246 (20.5%) |
| $22,500 to $24,999 | 0 (0.0%) | 16 (1.3%) |
| $25,000 to $29,999 | 46 (5.2%) | 211 (17.6%) |
| $30,000 to $34,999 | 43 (4.8%) | 99 (8.3%) |
| $35,000 to $39,999 | 74 (8.3%) | 72 (6.0%) |
| $40,000 to $44,999 | 103 (11.6%) | 38 (3.2%) |
| $45,000 to $49,999 | 19 (2.1%) | 39 (3.3%) |
| $50,000 to $54,999 | 9 (1.0%) | 44 (3.7%) |
| $55,000 to $64,999 | 109 (12.2%) | 54 (4.5%) |
| $65,000 to $74,999 | 82 (9.2%) | 53 (4.4%) |
| $75,000 to $99,999 | 53 (6.0%) | 35 (2.9%) |
| $100,000+ | 109 (12.2%) | 22 (1.8%) |
| Total | 890 (100.0%) | 1,200 (100.0%) |
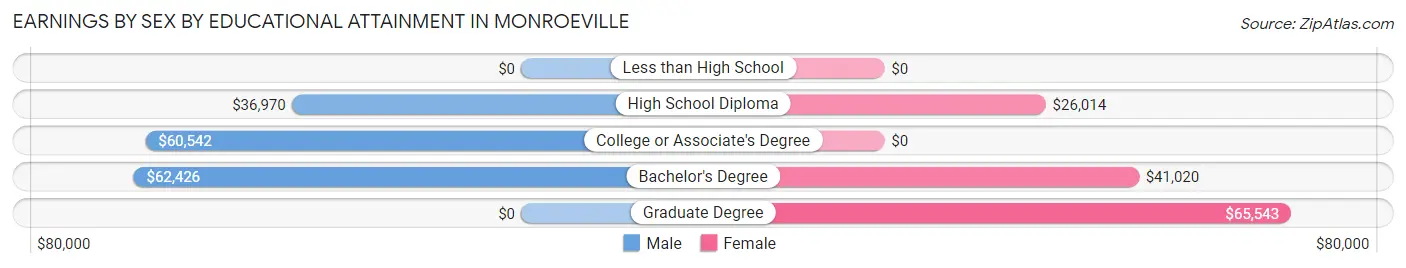
Earnings by Sex by Educational Attainment in Monroeville
Average earnings in Monroeville are $47,763 for men and $29,153 for women, a difference of 39.0%. Men with an educational attainment of bachelor's degree enjoy the highest average annual earnings of $62,426, while those with high school diploma education earn the least with $36,970. Women with an educational attainment of graduate degree earn the most with the average annual earnings of $65,543, while those with high school diploma education have the smallest earnings of $26,014.
| Educational Attainment | Male Income | Female Income |
| Less than High School | - | - |
| High School Diploma | $36,970 | $26,014 |
| College or Associate's Degree | $60,542 | $0 |
| Bachelor's Degree | $62,426 | $41,020 |
| Graduate Degree | - | - |
| Total | $47,763 | $29,153 |
Family Income in Monroeville
Family Income Brackets in Monroeville
According to the Monroeville family income data, there are 271 families falling into the $50,000 to $74,999 income range, which is the most common income bracket and makes up 22.0% of all families. Conversely, the $200,000+ income bracket is the least frequent group with only 36 families (2.9%) belonging to this category.
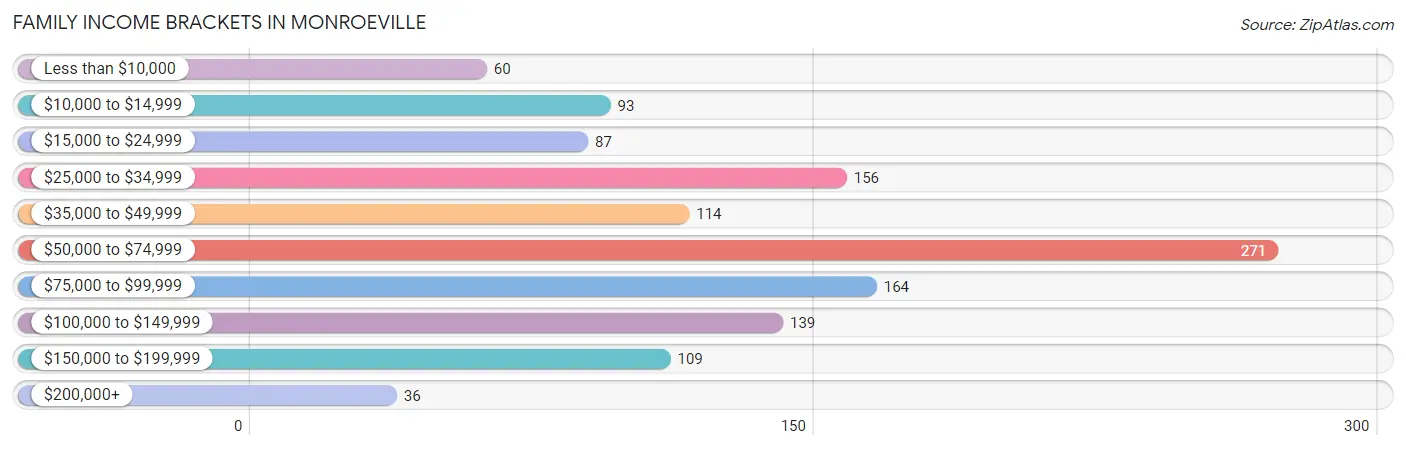
| Income Bracket | # Families | % Families |
| Less than $10,000 | 60 | 4.9% |
| $10,000 to $14,999 | 93 | 7.6% |
| $15,000 to $24,999 | 87 | 7.1% |
| $25,000 to $34,999 | 156 | 12.7% |
| $35,000 to $49,999 | 114 | 9.3% |
| $50,000 to $74,999 | 271 | 22.0% |
| $75,000 to $99,999 | 164 | 13.3% |
| $100,000 to $149,999 | 139 | 11.3% |
| $150,000 to $199,999 | 109 | 8.9% |
| $200,000+ | 36 | 2.9% |
Family Income by Famaliy Size in Monroeville
5-person families (15 | 1.2%) account for the highest median family income in Monroeville with $137,656 per family, while 2-person families (733 | 59.6%) have the highest median income of $28,872 per family member.
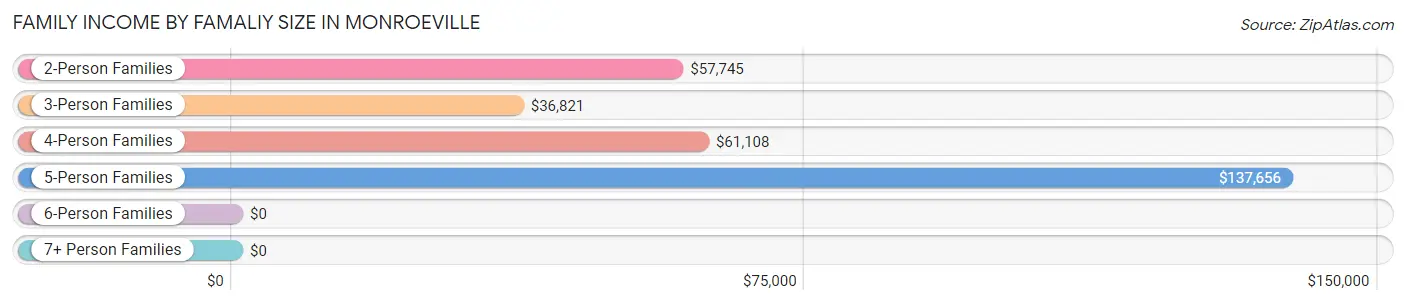
| Income Bracket | # Families | Median Income |
| 2-Person Families | 733 (59.6%) | $57,745 |
| 3-Person Families | 295 (24.0%) | $36,821 |
| 4-Person Families | 187 (15.2%) | $61,108 |
| 5-Person Families | 15 (1.2%) | $137,656 |
| 6-Person Families | 0 (0.0%) | $0 |
| 7+ Person Families | 0 (0.0%) | $0 |
| Total | 1,230 (100.0%) | $56,806 |
Family Income by Number of Earners in Monroeville
The median family income in Monroeville is $56,806, with families comprising 3+ earners (37) having the highest median family income of $134,375, while families with no earners (392) have the lowest median family income of $33,696, accounting for 3.0% and 31.9% of families, respectively.
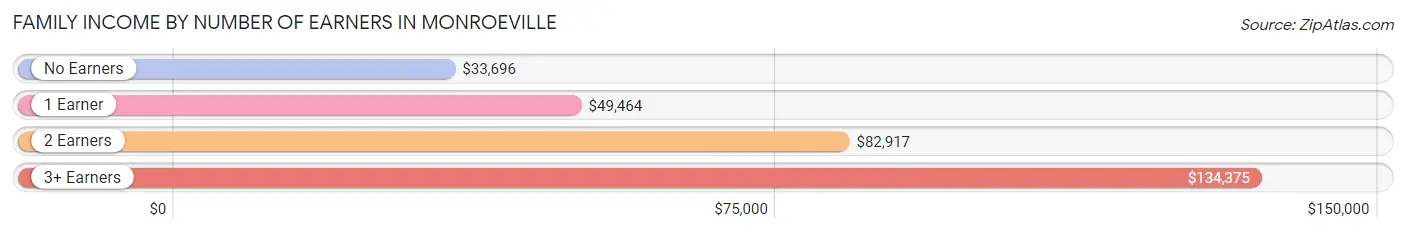
| Number of Earners | # Families | Median Income |
| No Earners | 392 (31.9%) | $33,696 |
| 1 Earner | 349 (28.4%) | $49,464 |
| 2 Earners | 452 (36.7%) | $82,917 |
| 3+ Earners | 37 (3.0%) | $134,375 |
| Total | 1,230 (100.0%) | $56,806 |
Household Income in Monroeville
Household Income Brackets in Monroeville
With 426 households falling in the category, the $15,000 to $24,999 income range is the most frequent in Monroeville, accounting for 17.9% of all households. In contrast, only 36 households (1.5%) fall into the $200,000+ income bracket, making it the least populous group.
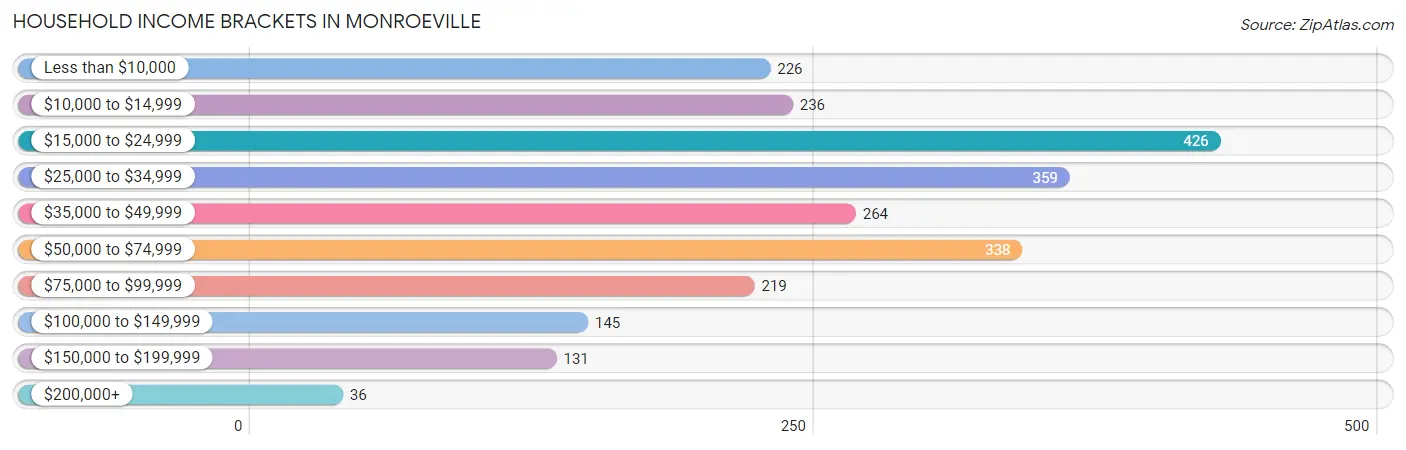
| Income Bracket | # Households | % Households |
| Less than $10,000 | 226 | 9.5% |
| $10,000 to $14,999 | 236 | 9.9% |
| $15,000 to $24,999 | 426 | 17.9% |
| $25,000 to $34,999 | 359 | 15.1% |
| $35,000 to $49,999 | 264 | 11.1% |
| $50,000 to $74,999 | 338 | 14.2% |
| $75,000 to $99,999 | 219 | 9.2% |
| $100,000 to $149,999 | 145 | 6.1% |
| $150,000 to $199,999 | 131 | 5.5% |
| $200,000+ | 36 | 1.5% |
Household Income by Householder Age in Monroeville
The median household income in Monroeville is $32,040, with the highest median household income of $55,990 found in the 45 to 64 years age bracket for the primary householder. A total of 847 households (35.6%) fall into this category. Meanwhile, the 25 to 44 years age bracket for the primary householder has the lowest median household income of $28,908, with 562 households (23.6%) in this group.
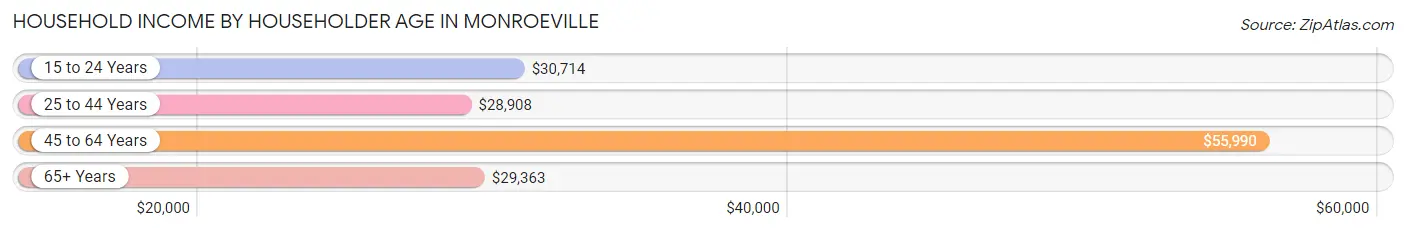
| Income Bracket | # Households | Median Income |
| 15 to 24 Years | 194 (8.2%) | $30,714 |
| 25 to 44 Years | 562 (23.6%) | $28,908 |
| 45 to 64 Years | 847 (35.6%) | $55,990 |
| 65+ Years | 777 (32.7%) | $29,363 |
| Total | 2,380 (100.0%) | $32,040 |
Poverty in Monroeville
Income Below Poverty by Sex and Age in Monroeville
With 20.9% poverty level for males and 28.7% for females among the residents of Monroeville, 16 and 17 year old males and 12 to 14 year old females are the most vulnerable to poverty, with 41 males (100.0%) and 108 females (59.0%) in their respective age groups living below the poverty level.
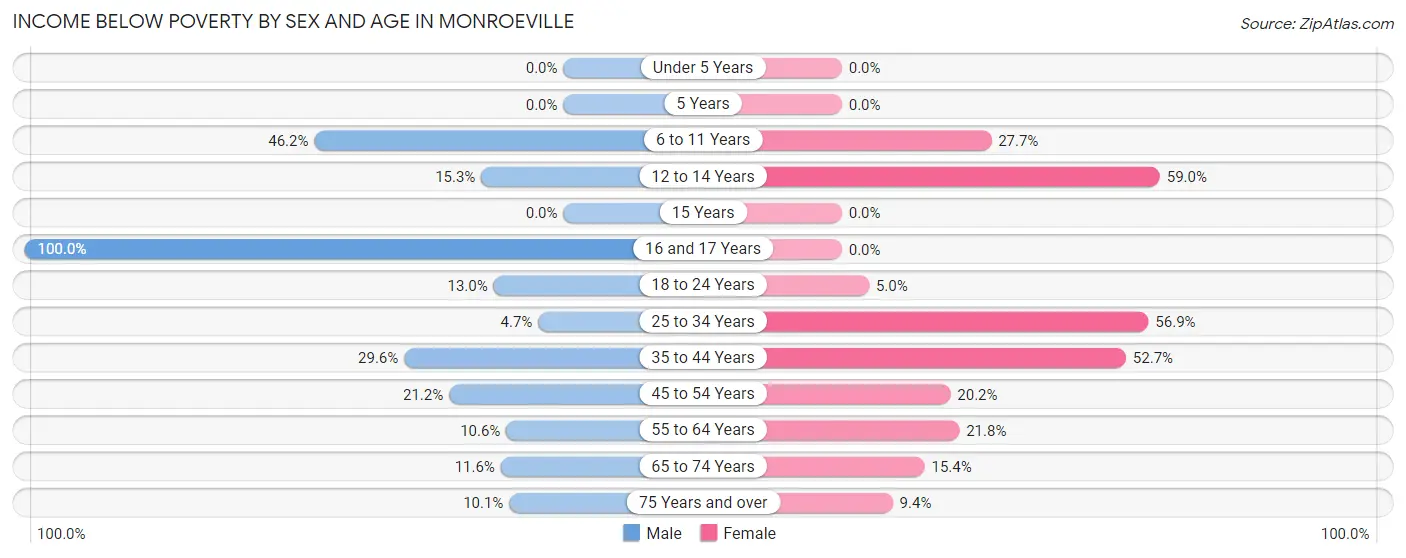
| Age Bracket | Male | Female |
| Under 5 Years | 0 (0.0%) | 0 (0.0%) |
| 5 Years | 0 (0.0%) | 0 (0.0%) |
| 6 to 11 Years | 233 (46.2%) | 66 (27.7%) |
| 12 to 14 Years | 34 (15.2%) | 108 (59.0%) |
| 15 Years | 0 (0.0%) | 0 (0.0%) |
| 16 and 17 Years | 41 (100.0%) | 0 (0.0%) |
| 18 to 24 Years | 21 (13.0%) | 14 (5.0%) |
| 25 to 34 Years | 11 (4.7%) | 206 (56.9%) |
| 35 to 44 Years | 81 (29.6%) | 193 (52.7%) |
| 45 to 54 Years | 70 (21.2%) | 83 (20.2%) |
| 55 to 64 Years | 38 (10.6%) | 80 (21.8%) |
| 65 to 74 Years | 40 (11.6%) | 51 (15.4%) |
| 75 Years and over | 21 (10.1%) | 17 (9.4%) |
| Total | 590 (20.9%) | 818 (28.7%) |
Income Above Poverty by Sex and Age in Monroeville
According to the poverty statistics in Monroeville, males aged under 5 years and females aged under 5 years are the age groups that are most secure financially, with 100.0% of males and 100.0% of females in these age groups living above the poverty line.
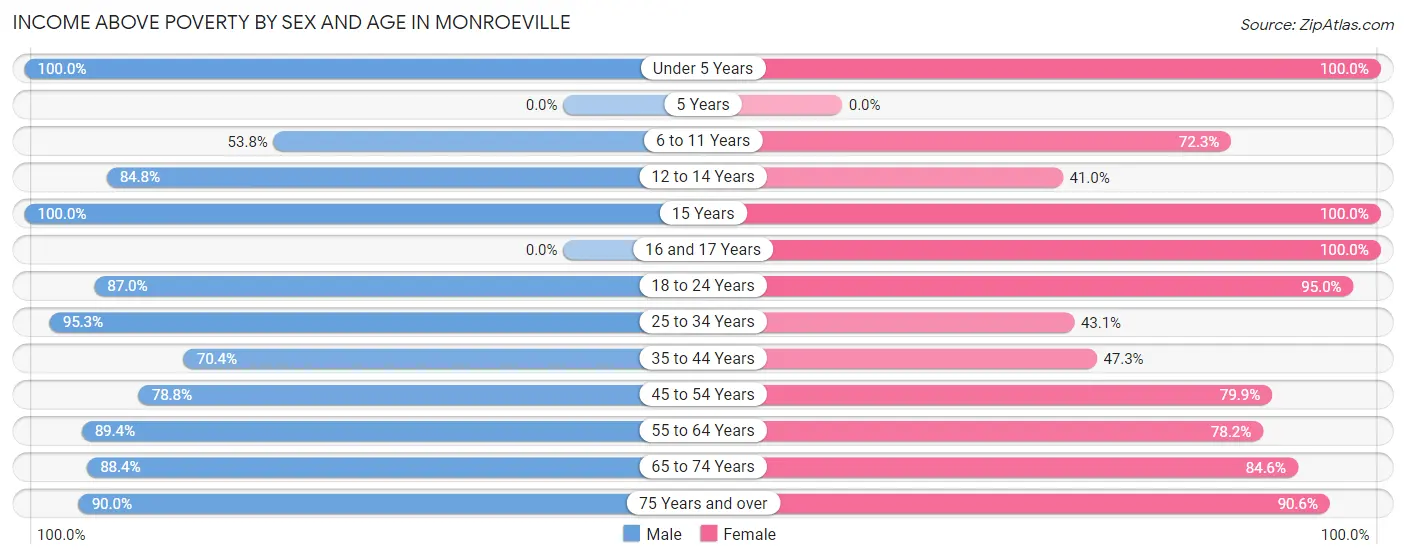
| Age Bracket | Male | Female |
| Under 5 Years | 102 (100.0%) | 27 (100.0%) |
| 5 Years | 0 (0.0%) | 0 (0.0%) |
| 6 to 11 Years | 271 (53.8%) | 172 (72.3%) |
| 12 to 14 Years | 189 (84.8%) | 75 (41.0%) |
| 15 Years | 45 (100.0%) | 18 (100.0%) |
| 16 and 17 Years | 0 (0.0%) | 85 (100.0%) |
| 18 to 24 Years | 141 (87.0%) | 264 (95.0%) |
| 25 to 34 Years | 224 (95.3%) | 156 (43.1%) |
| 35 to 44 Years | 193 (70.4%) | 173 (47.3%) |
| 45 to 54 Years | 260 (78.8%) | 329 (79.8%) |
| 55 to 64 Years | 320 (89.4%) | 287 (78.2%) |
| 65 to 74 Years | 304 (88.4%) | 281 (84.6%) |
| 75 Years and over | 188 (89.9%) | 163 (90.6%) |
| Total | 2,237 (79.1%) | 2,030 (71.3%) |
Income Below Poverty Among Married-Couple Families in Monroeville
The poverty statistics for married-couple families in Monroeville show that 6.3% or 50 of the total 792 families live below the poverty line. Families with no children have the highest poverty rate of 8.1%, comprising of 50 families. On the other hand, families with 1 or 2 children have the lowest poverty rate of 0.0%, which includes 0 families.
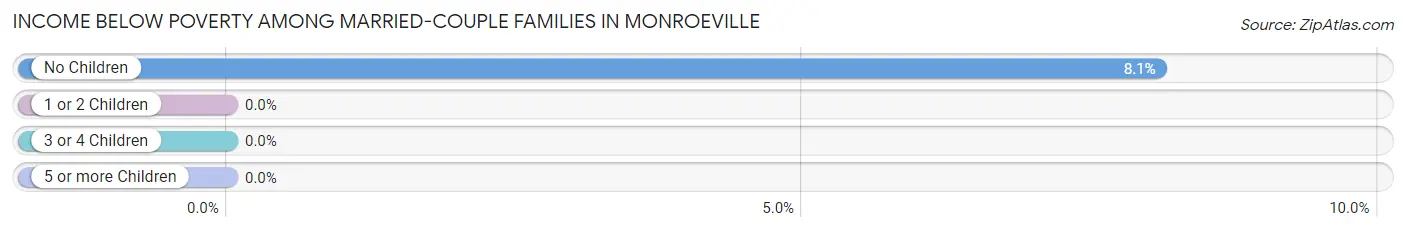
| Children | Above Poverty | Below Poverty |
| No Children | 568 (91.9%) | 50 (8.1%) |
| 1 or 2 Children | 171 (100.0%) | 0 (0.0%) |
| 3 or 4 Children | 3 (100.0%) | 0 (0.0%) |
| 5 or more Children | 0 (0.0%) | 0 (0.0%) |
| Total | 742 (93.7%) | 50 (6.3%) |
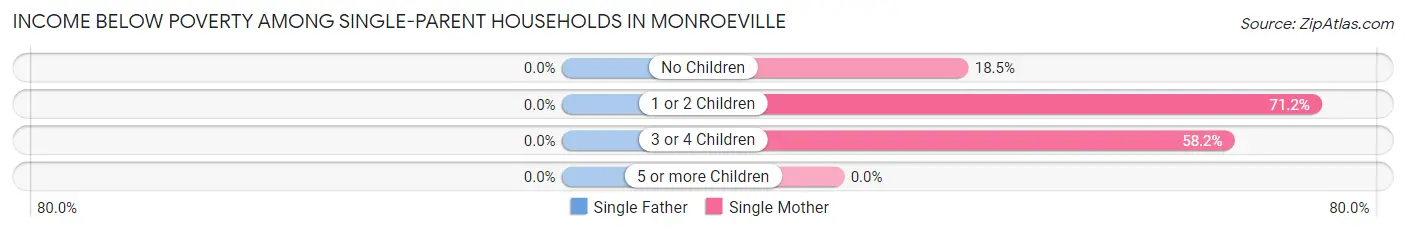
Income Below Poverty Among Single-Parent Households in Monroeville
| Children | Single Father | Single Mother |
| No Children | 0 (0.0%) | 27 (18.5%) |
| 1 or 2 Children | 0 (0.0%) | 146 (71.2%) |
| 3 or 4 Children | 0 (0.0%) | 39 (58.2%) |
| 5 or more Children | 0 (0.0%) | 0 (0.0%) |
| Total | 0 (0.0%) | 212 (50.7%) |
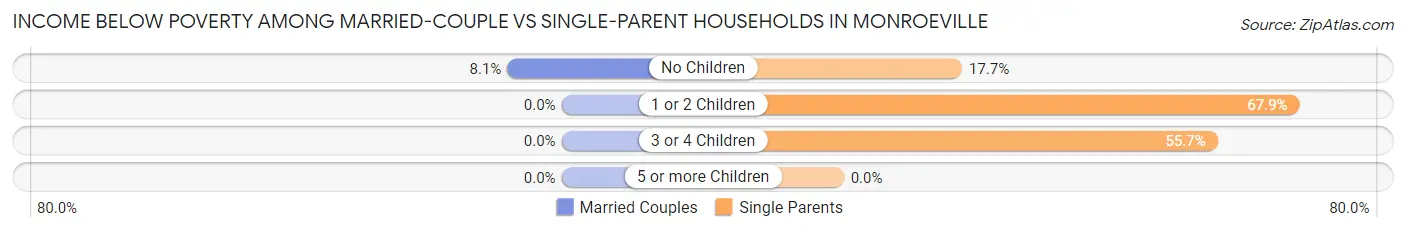
Income Below Poverty Among Married-Couple vs Single-Parent Households in Monroeville
The poverty data for Monroeville shows that 50 of the married-couple family households (6.3%) and 212 of the single-parent households (48.4%) are living below the poverty level. Within the married-couple family households, those with no children have the highest poverty rate, with 50 households (8.1%) falling below the poverty line. Among the single-parent households, those with 1 or 2 children have the highest poverty rate, with 146 household (67.9%) living below poverty.
| Children | Married-Couple Families | Single-Parent Households |
| No Children | 50 (8.1%) | 27 (17.6%) |
| 1 or 2 Children | 0 (0.0%) | 146 (67.9%) |
| 3 or 4 Children | 0 (0.0%) | 39 (55.7%) |
| 5 or more Children | 0 (0.0%) | 0 (0.0%) |
| Total | 50 (6.3%) | 212 (48.4%) |
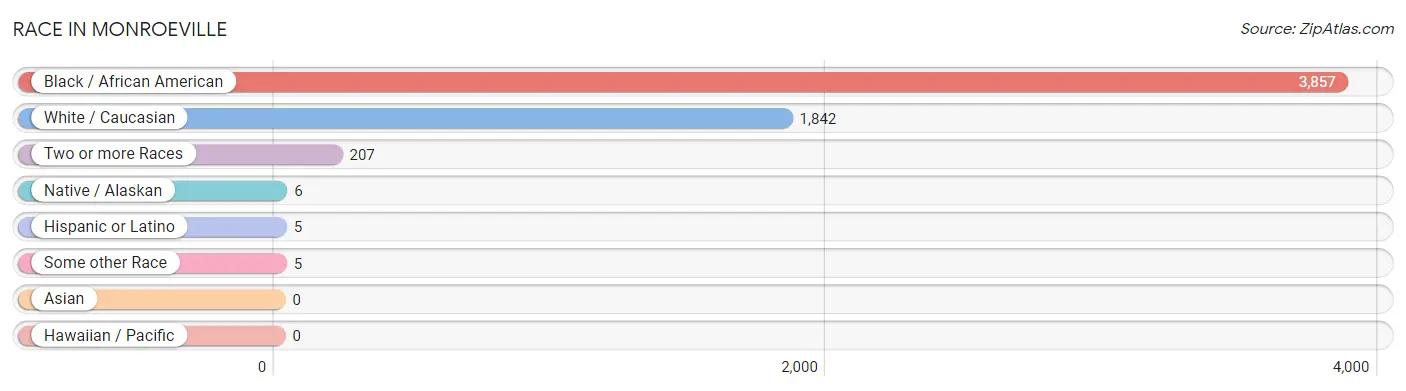
Race in Monroeville
The most populous races in Monroeville are Black / African American (3,857 | 65.2%), White / Caucasian (1,842 | 31.1%), and Two or more Races (207 | 3.5%).
| Race | # Population | % Population |
| Asian | 0 | 0.0% |
| Black / African American | 3,857 | 65.2% |
| Hawaiian / Pacific | 0 | 0.0% |
| Hispanic or Latino | 5 | 0.1% |
| Native / Alaskan | 6 | 0.1% |
| White / Caucasian | 1,842 | 31.1% |
| Two or more Races | 207 | 3.5% |
| Some other Race | 5 | 0.1% |
| Total | 5,917 | 100.0% |
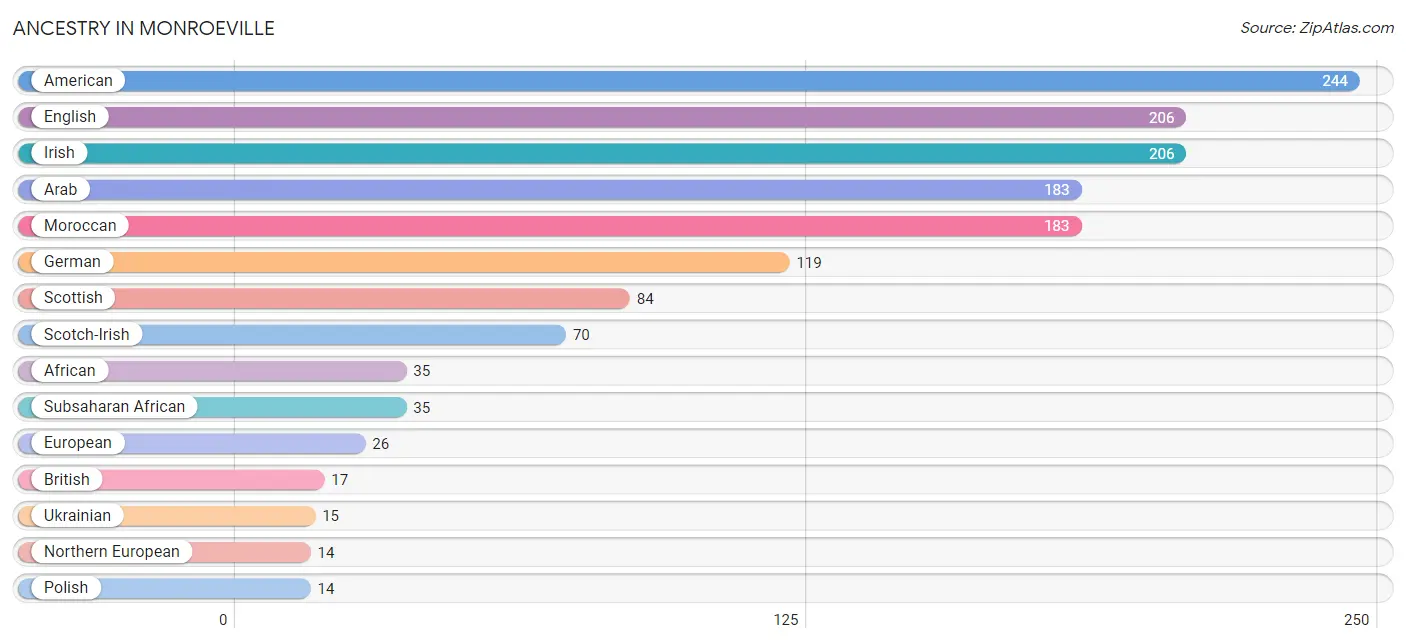
Ancestry in Monroeville
The most populous ancestries reported in Monroeville are American (244 | 4.1%), English (206 | 3.5%), Irish (206 | 3.5%), Arab (183 | 3.1%), and Moroccan (183 | 3.1%), together accounting for 17.3% of all Monroeville residents.
| Ancestry | # Population | % Population |
| African | 35 | 0.6% |
| American | 244 | 4.1% |
| Arab | 183 | 3.1% |
| British | 17 | 0.3% |
| Cherokee | 6 | 0.1% |
| Dutch | 1 | 0.0% |
| English | 206 | 3.5% |
| European | 26 | 0.4% |
| French | 10 | 0.2% |
| German | 119 | 2.0% |
| Irish | 206 | 3.5% |
| Italian | 12 | 0.2% |
| Mexican | 5 | 0.1% |
| Moroccan | 183 | 3.1% |
| Northern European | 14 | 0.2% |
| Norwegian | 7 | 0.1% |
| Polish | 14 | 0.2% |
| Scotch-Irish | 70 | 1.2% |
| Scottish | 84 | 1.4% |
| Subsaharan African | 35 | 0.6% |
| Ukrainian | 15 | 0.3% |
| Yugoslavian | 6 | 0.1% | View All 22 Rows |
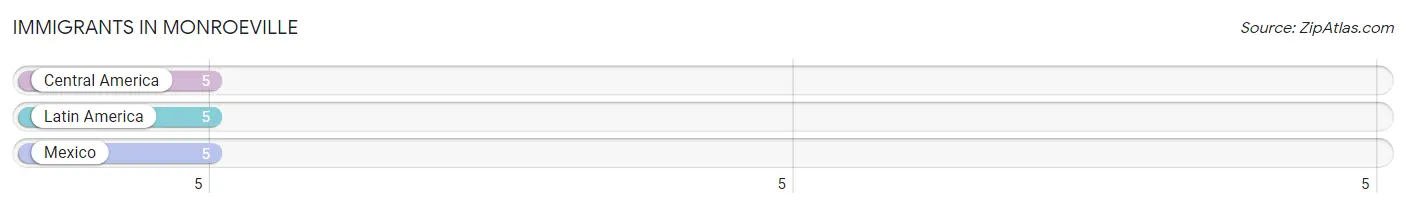
Immigrants in Monroeville
The most numerous immigrant groups reported in Monroeville came from Central America (5 | 0.1%), Latin America (5 | 0.1%), and Mexico (5 | 0.1%), together accounting for 0.2% of all Monroeville residents.
| Immigration Origin | # Population | % Population |
| Central America | 5 | 0.1% |
| Latin America | 5 | 0.1% |
| Mexico | 5 | 0.1% | View All 3 Rows |
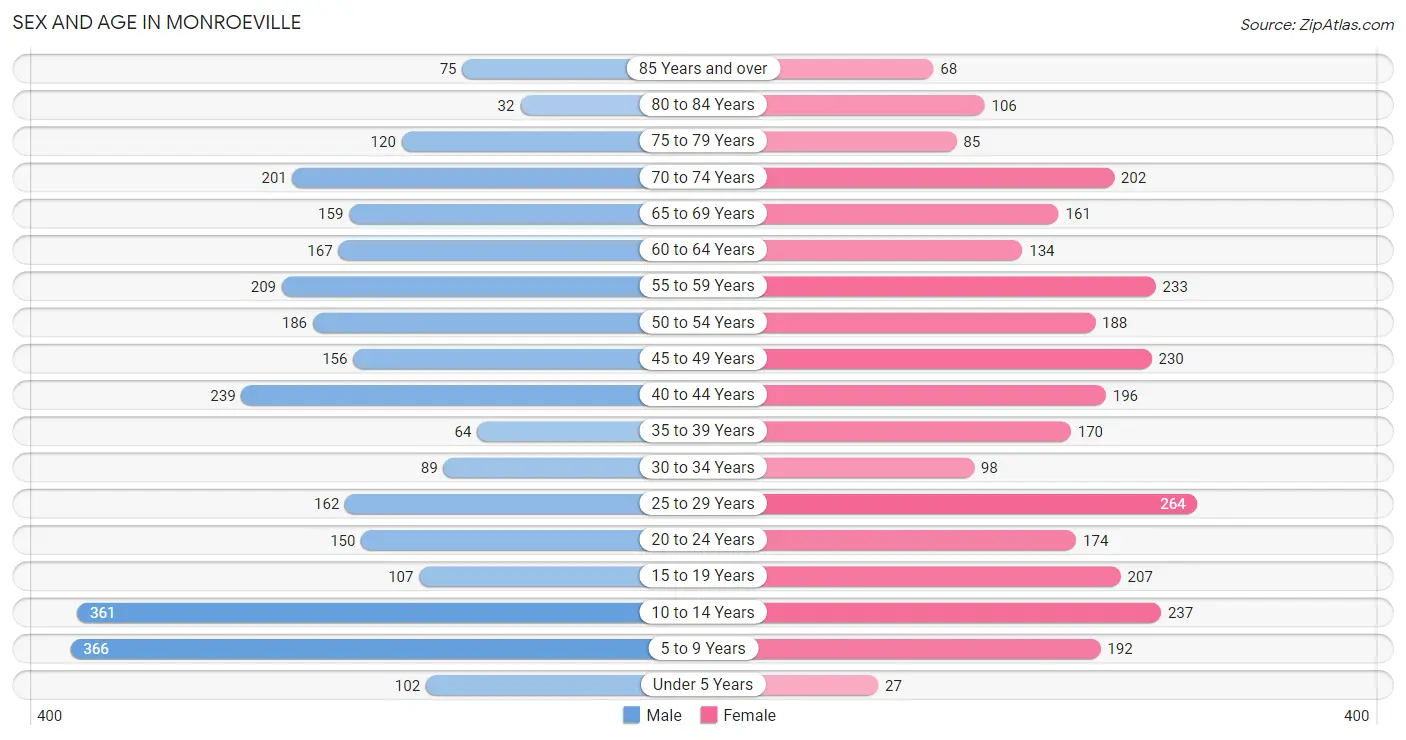
Sex and Age in Monroeville
Sex and Age in Monroeville
The most populous age groups in Monroeville are 5 to 9 Years (366 | 12.4%) for men and 25 to 29 Years (264 | 8.9%) for women.
| Age Bracket | Male | Female |
| Under 5 Years | 102 (3.5%) | 27 (0.9%) |
| 5 to 9 Years | 366 (12.4%) | 192 (6.5%) |
| 10 to 14 Years | 361 (12.3%) | 237 (8.0%) |
| 15 to 19 Years | 107 (3.6%) | 207 (7.0%) |
| 20 to 24 Years | 150 (5.1%) | 174 (5.9%) |
| 25 to 29 Years | 162 (5.5%) | 264 (8.9%) |
| 30 to 34 Years | 89 (3.0%) | 98 (3.3%) |
| 35 to 39 Years | 64 (2.2%) | 170 (5.7%) |
| 40 to 44 Years | 239 (8.1%) | 196 (6.6%) |
| 45 to 49 Years | 156 (5.3%) | 230 (7.7%) |
| 50 to 54 Years | 186 (6.3%) | 188 (6.3%) |
| 55 to 59 Years | 209 (7.1%) | 233 (7.8%) |
| 60 to 64 Years | 167 (5.7%) | 134 (4.5%) |
| 65 to 69 Years | 159 (5.4%) | 161 (5.4%) |
| 70 to 74 Years | 201 (6.8%) | 202 (6.8%) |
| 75 to 79 Years | 120 (4.1%) | 85 (2.9%) |
| 80 to 84 Years | 32 (1.1%) | 106 (3.6%) |
| 85 Years and over | 75 (2.5%) | 68 (2.3%) |
| Total | 2,945 (100.0%) | 2,972 (100.0%) |
Families and Households in Monroeville
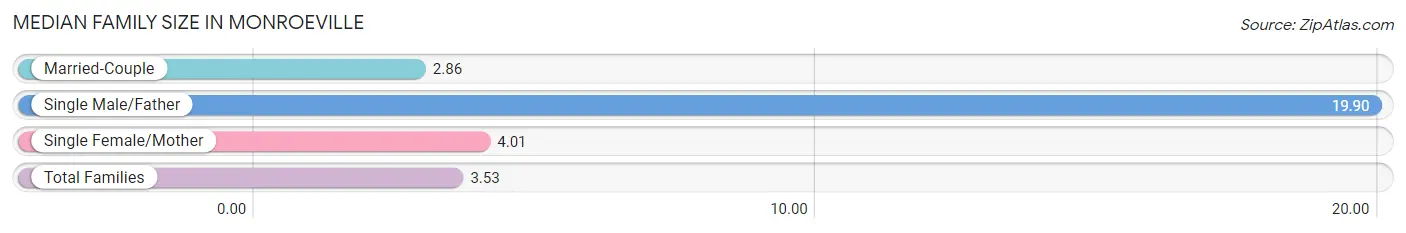
Median Family Size in Monroeville
The median family size in Monroeville is 3.53 persons per family, with single male/father families (20 | 1.6%) accounting for the largest median family size of 19.9 persons per family. On the other hand, married-couple families (792 | 64.4%) represent the smallest median family size with 2.86 persons per family.
| Family Type | # Families | Family Size |
| Married-Couple | 792 (64.4%) | 2.86 |
| Single Male/Father | 20 (1.6%) | 19.90 |
| Single Female/Mother | 418 (34.0%) | 4.01 |
| Total Families | 1,230 (100.0%) | 3.53 |
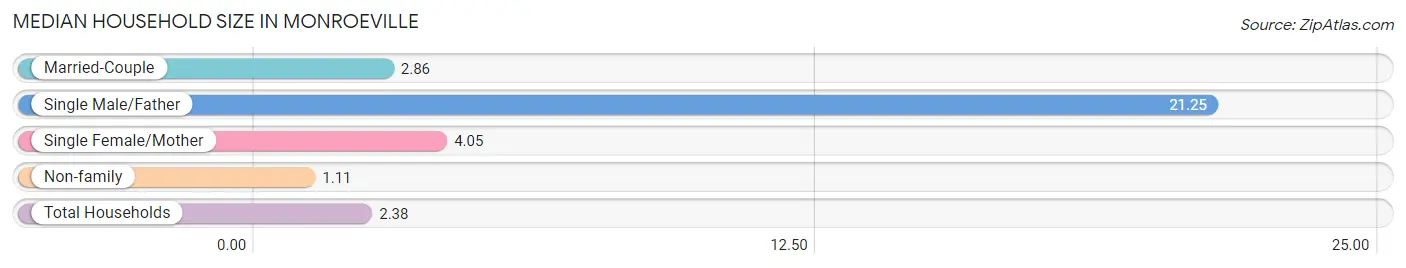
Median Household Size in Monroeville
The median household size in Monroeville is 2.38 persons per household, with single male/father households (20 | 0.8%) accounting for the largest median household size of 21.25 persons per household. non-family households (1,150 | 48.3%) represent the smallest median household size with 1.11 persons per household.
| Household Type | # Households | Household Size |
| Married-Couple | 792 (33.3%) | 2.86 |
| Single Male/Father | 20 (0.8%) | 21.25 |
| Single Female/Mother | 418 (17.6%) | 4.05 |
| Non-family | 1,150 (48.3%) | 1.11 |
| Total Households | 2,380 (100.0%) | 2.38 |
Household Size by Marriage Status in Monroeville
Out of a total of 2,380 households in Monroeville, 1,230 (51.7%) are family households, while 1,150 (48.3%) are nonfamily households. The most numerous type of family households are 2-person households, comprising 704, and the most common type of nonfamily households are 1-person households, comprising 1,105.
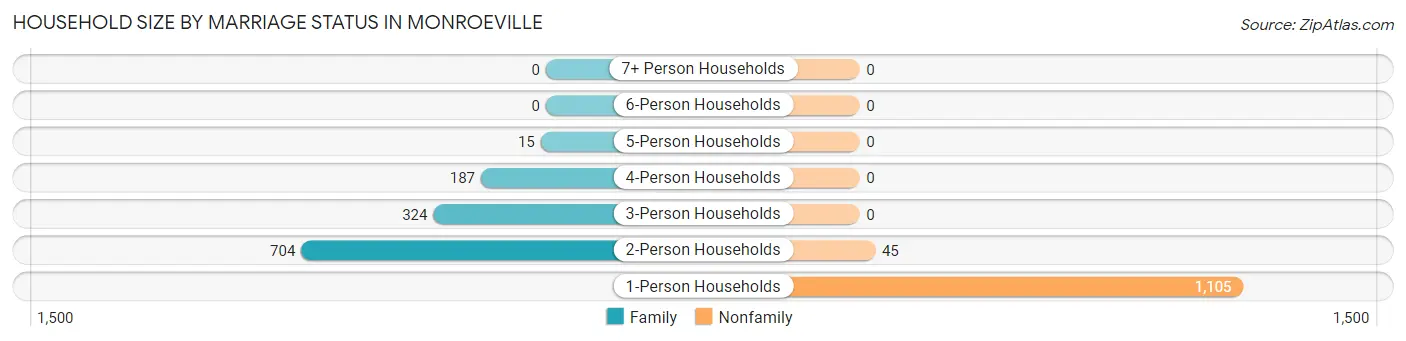
| Household Size | Family Households | Nonfamily Households |
| 1-Person Households | - | 1,105 (46.4%) |
| 2-Person Households | 704 (29.6%) | 45 (1.9%) |
| 3-Person Households | 324 (13.6%) | 0 (0.0%) |
| 4-Person Households | 187 (7.9%) | 0 (0.0%) |
| 5-Person Households | 15 (0.6%) | 0 (0.0%) |
| 6-Person Households | 0 (0.0%) | 0 (0.0%) |
| 7+ Person Households | 0 (0.0%) | 0 (0.0%) |
| Total | 1,230 (51.7%) | 1,150 (48.3%) |
Female Fertility in Monroeville
Fertility by Age in Monroeville
Average fertility rate in Monroeville is 52.0 births per 1,000 women. Women in the age bracket of 35 to 50 years have the highest fertility rate with 76.0 births per 1,000 women. Women in the age bracket of 35 to 50 years acount for 68.5% of all women with births.
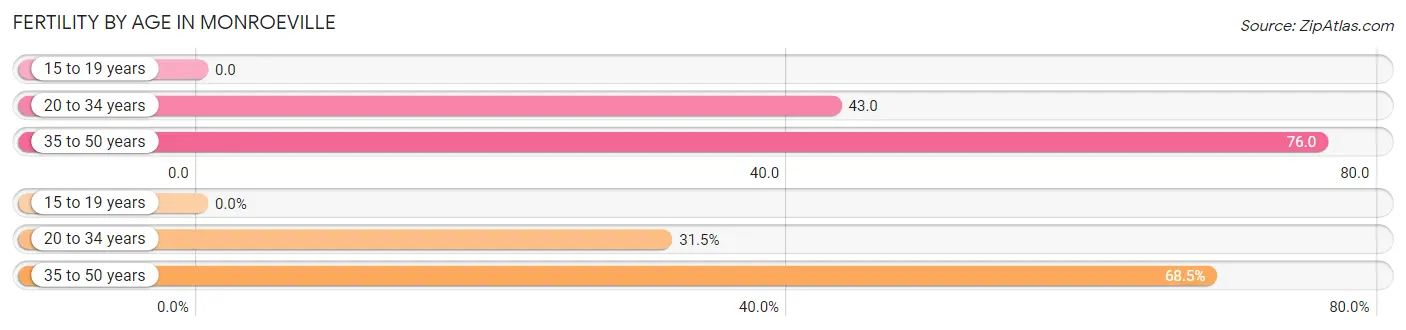
| Age Bracket | Women with Births | Births / 1,000 Women |
| 15 to 19 years | 0 (0.0%) | 0.0 |
| 20 to 34 years | 23 (31.5%) | 43.0 |
| 35 to 50 years | 50 (68.5%) | 76.0 |
| Total | 73 (100.0%) | 52.0 |
Fertility by Age by Marriage Status in Monroeville
31.5% of women with births (73) in Monroeville are married. The highest percentage of unmarried women with births falls into 35 to 50 years age bracket with 100.0% of them unmarried at the time of birth, while the lowest percentage of unmarried women with births belong to 20 to 34 years age bracket with 0.0% of them unmarried.
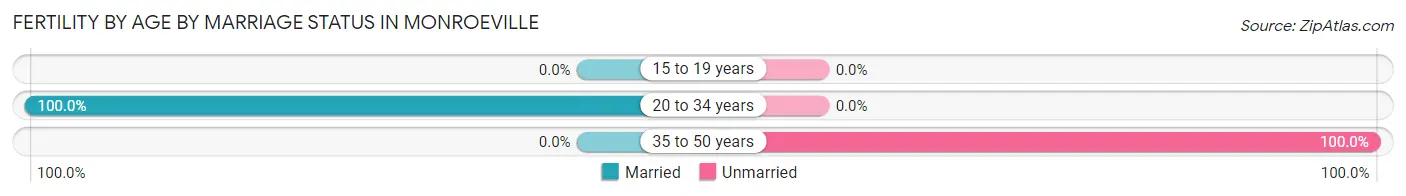
| Age Bracket | Married | Unmarried |
| 15 to 19 years | 0 (0.0%) | 0 (0.0%) |
| 20 to 34 years | 23 (100.0%) | 0 (0.0%) |
| 35 to 50 years | 0 (0.0%) | 50 (100.0%) |
| Total | 23 (31.5%) | 50 (68.5%) |
Fertility by Education in Monroeville
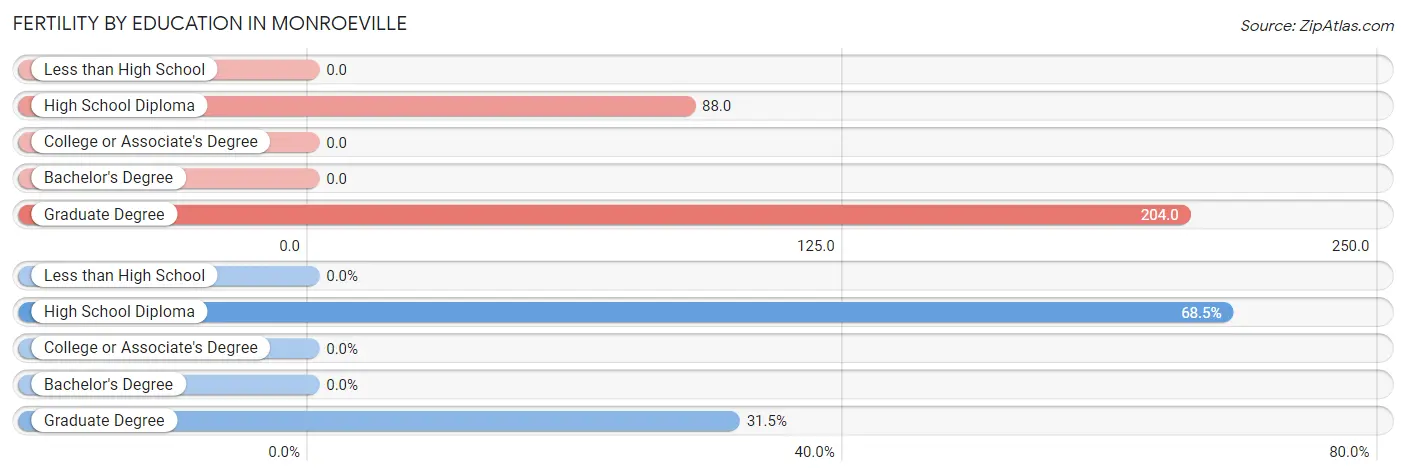
| Educational Attainment | Women with Births | Births / 1,000 Women |
| Less than High School | 0 (0.0%) | 0.0 |
| High School Diploma | 50 (68.5%) | 88.0 |
| College or Associate's Degree | 0 (0.0%) | 0.0 |
| Bachelor's Degree | 0 (0.0%) | 0.0 |
| Graduate Degree | 23 (31.5%) | 204.0 |
| Total | 73 (100.0%) | 52.0 |
Fertility by Education by Marriage Status in Monroeville
68.5% of women with births in Monroeville are unmarried. Women with the educational attainment of graduate degree are most likely to be married with 100.0% of them married at childbirth, while women with the educational attainment of high school diploma are least likely to be married with 100.0% of them unmarried at childbirth.
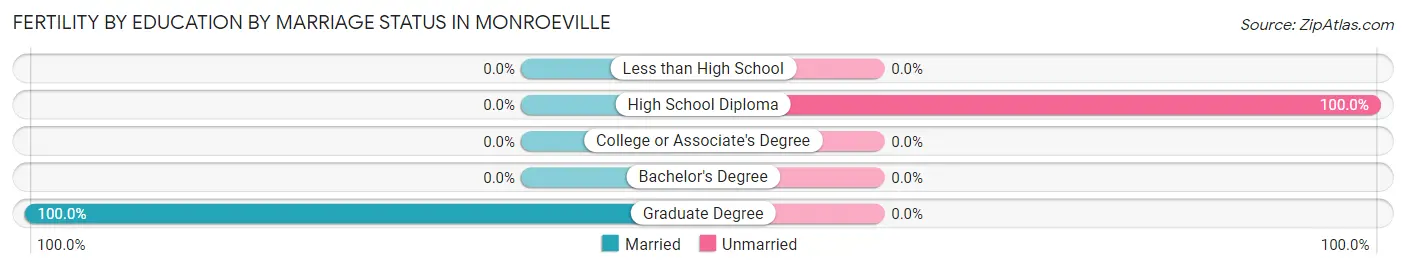
| Educational Attainment | Married | Unmarried |
| Less than High School | 0 (0.0%) | 0 (0.0%) |
| High School Diploma | 0 (0.0%) | 50 (100.0%) |
| College or Associate's Degree | 0 (0.0%) | 0 (0.0%) |
| Bachelor's Degree | 0 (0.0%) | 0 (0.0%) |
| Graduate Degree | 23 (100.0%) | 0 (0.0%) |
| Total | 23 (31.5%) | 50 (68.5%) |
Employment Characteristics in Monroeville
Employment by Class of Employer in Monroeville
Among the 1,882 employed individuals in Monroeville, private company employees (1,230 | 65.4%), local government employees (231 | 12.3%), and federal government employees (115 | 6.1%) make up the most common classes of employment.
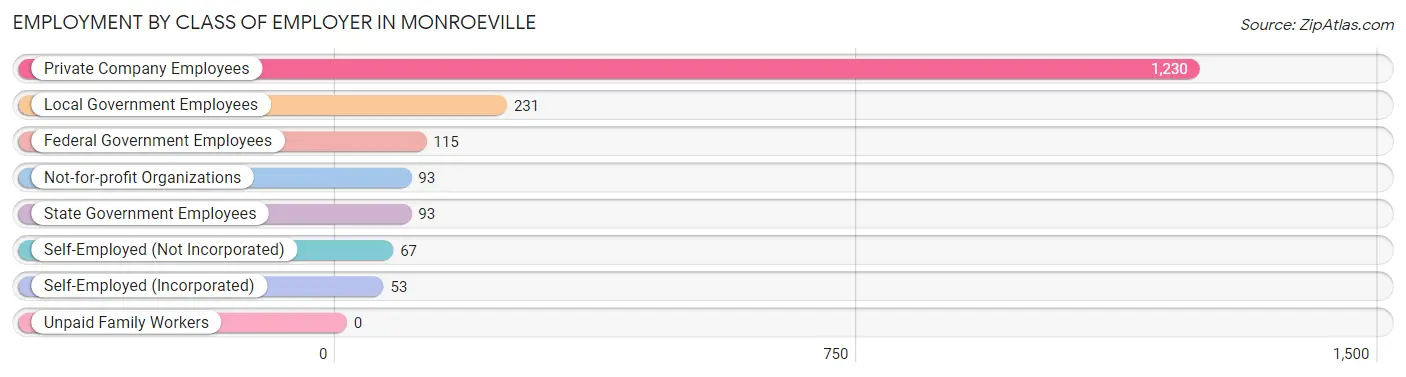
| Employer Class | # Employees | % Employees |
| Private Company Employees | 1,230 | 65.4% |
| Self-Employed (Incorporated) | 53 | 2.8% |
| Self-Employed (Not Incorporated) | 67 | 3.6% |
| Not-for-profit Organizations | 93 | 4.9% |
| Local Government Employees | 231 | 12.3% |
| State Government Employees | 93 | 4.9% |
| Federal Government Employees | 115 | 6.1% |
| Unpaid Family Workers | 0 | 0.0% |
| Total | 1,882 | 100.0% |
Employment Status by Age in Monroeville
According to the labor force statistics for Monroeville, out of the total population over 16 years of age (4,569), 48.0% or 2,193 individuals are in the labor force, with 14.5% or 318 of them unemployed. The age group with the highest labor force participation rate is 20 to 24 years, with 80.6% or 261 individuals in the labor force. Within the labor force, the 25 to 29 years age range has the highest percentage of unemployed individuals, with 57.7% or 147 of them being unemployed.
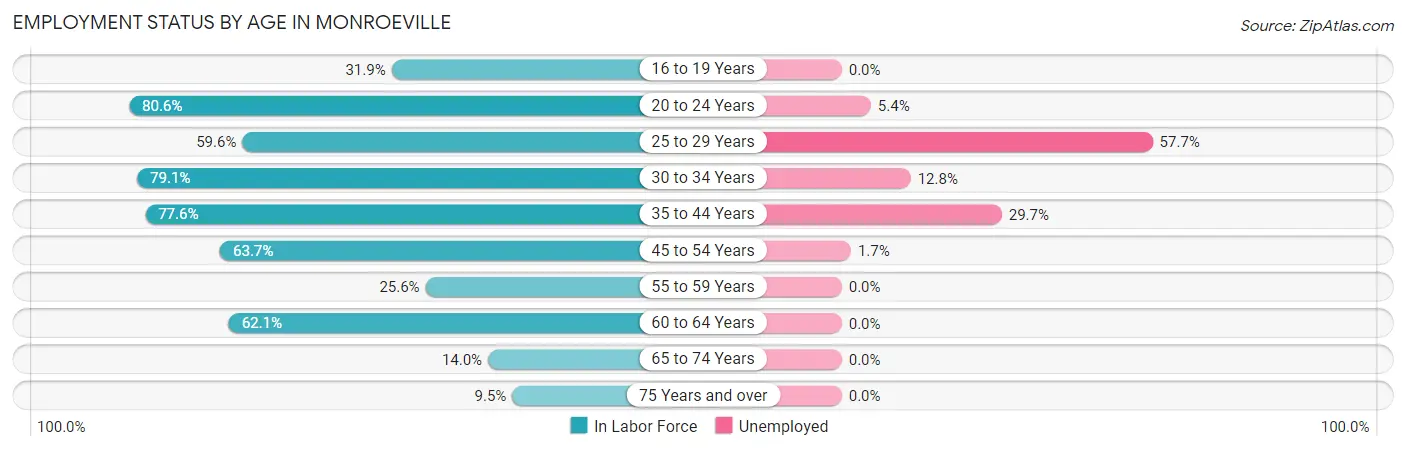
| Age Bracket | In Labor Force | Unemployed |
| 16 to 19 Years | 80 (31.9%) | 0 (0.0%) |
| 20 to 24 Years | 261 (80.6%) | 14 (5.4%) |
| 25 to 29 Years | 254 (59.6%) | 147 (57.7%) |
| 30 to 34 Years | 148 (79.1%) | 19 (12.8%) |
| 35 to 44 Years | 519 (77.6%) | 154 (29.7%) |
| 45 to 54 Years | 484 (63.7%) | 8 (1.7%) |
| 55 to 59 Years | 113 (25.6%) | 0 (0.0%) |
| 60 to 64 Years | 187 (62.1%) | 0 (0.0%) |
| 65 to 74 Years | 101 (14.0%) | 0 (0.0%) |
| 75 Years and over | 46 (9.5%) | 0 (0.0%) |
| Total | 2,193 (48.0%) | 318 (14.5%) |
Employment Status by Educational Attainment in Monroeville
According to labor force statistics for Monroeville, 61.2% of individuals (1,704) out of the total population between 25 and 64 years of age (2,785) are in the labor force, with 18.0% or 307 of them being unemployed. The group with the highest labor force participation rate are those with the educational attainment of high school diploma, with 71.9% or 830 individuals in the labor force. Within the labor force, individuals with high school diploma education have the highest percentage of unemployment, with 32.5% or 270 of them being unemployed.
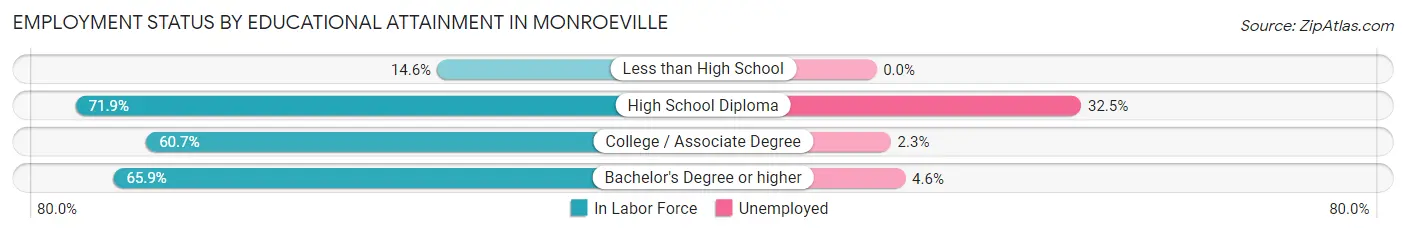
| Educational Attainment | In Labor Force | Unemployed |
| Less than High School | 46 (14.6%) | 0 (0.0%) |
| High School Diploma | 830 (71.9%) | 375 (32.5%) |
| College / Associate Degree | 438 (60.7%) | 17 (2.3%) |
| Bachelor's Degree or higher | 391 (65.9%) | 27 (4.6%) |
| Total | 1,704 (61.2%) | 501 (18.0%) |
Employment Occupations by Sex in Monroeville
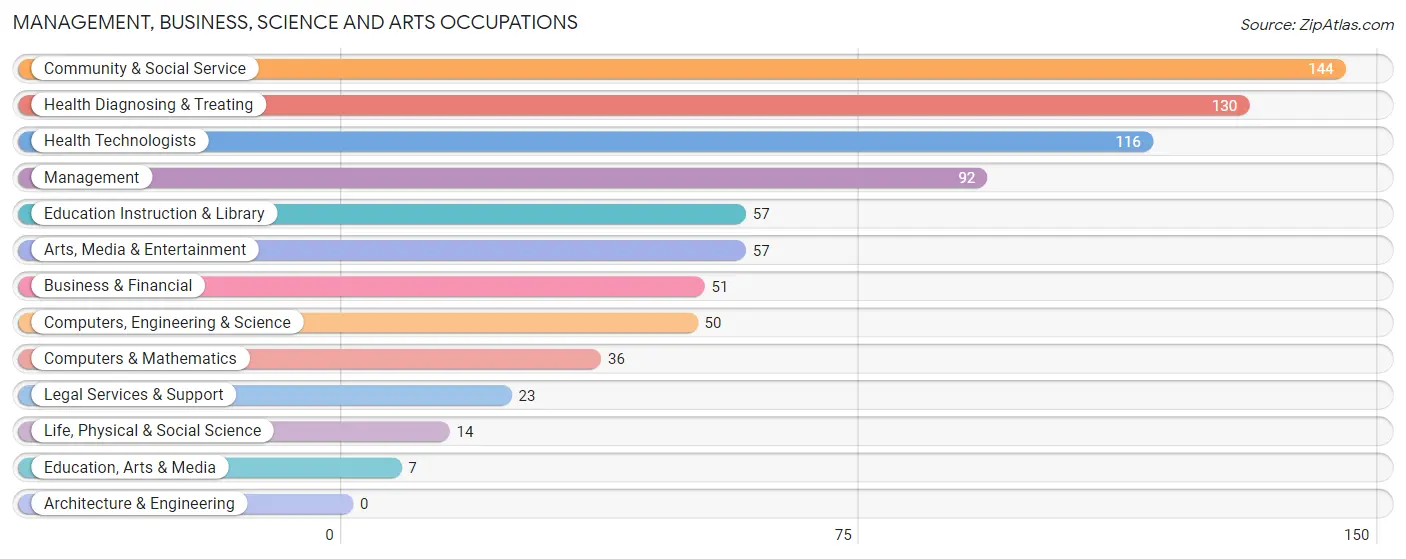
Management, Business, Science and Arts Occupations
The most common Management, Business, Science and Arts occupations in Monroeville are Community & Social Service (144 | 7.9%), Health Diagnosing & Treating (130 | 7.1%), Health Technologists (116 | 6.3%), Management (92 | 5.0%), and Education Instruction & Library (57 | 3.1%).
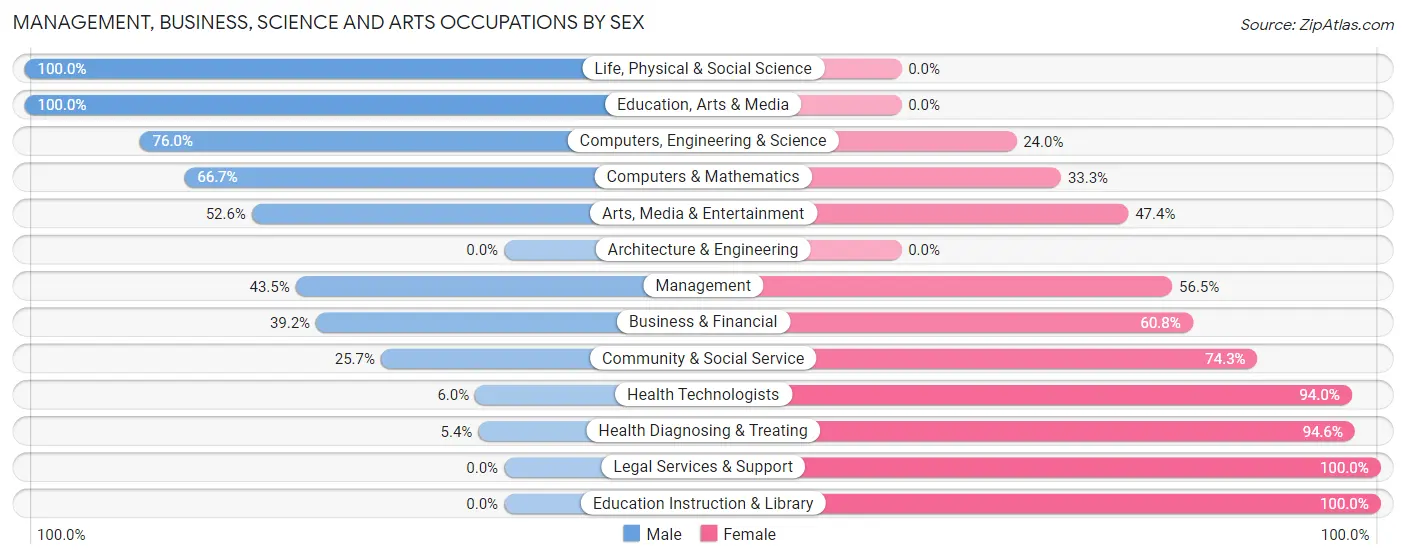
Management, Business, Science and Arts Occupations by Sex
Within the Management, Business, Science and Arts occupations in Monroeville, the most male-oriented occupations are Life, Physical & Social Science (100.0%), Education, Arts & Media (100.0%), and Computers, Engineering & Science (76.0%), while the most female-oriented occupations are Legal Services & Support (100.0%), Education Instruction & Library (100.0%), and Health Diagnosing & Treating (94.6%).
| Occupation | Male | Female |
| Management | 40 (43.5%) | 52 (56.5%) |
| Business & Financial | 20 (39.2%) | 31 (60.8%) |
| Computers, Engineering & Science | 38 (76.0%) | 12 (24.0%) |
| Computers & Mathematics | 24 (66.7%) | 12 (33.3%) |
| Architecture & Engineering | 0 (0.0%) | 0 (0.0%) |
| Life, Physical & Social Science | 14 (100.0%) | 0 (0.0%) |
| Community & Social Service | 37 (25.7%) | 107 (74.3%) |
| Education, Arts & Media | 7 (100.0%) | 0 (0.0%) |
| Legal Services & Support | 0 (0.0%) | 23 (100.0%) |
| Education Instruction & Library | 0 (0.0%) | 57 (100.0%) |
| Arts, Media & Entertainment | 30 (52.6%) | 27 (47.4%) |
| Health Diagnosing & Treating | 7 (5.4%) | 123 (94.6%) |
| Health Technologists | 7 (6.0%) | 109 (94.0%) |
| Total (Category) | 142 (30.4%) | 325 (69.6%) |
| Total (Overall) | 736 (40.2%) | 1,093 (59.8%) |
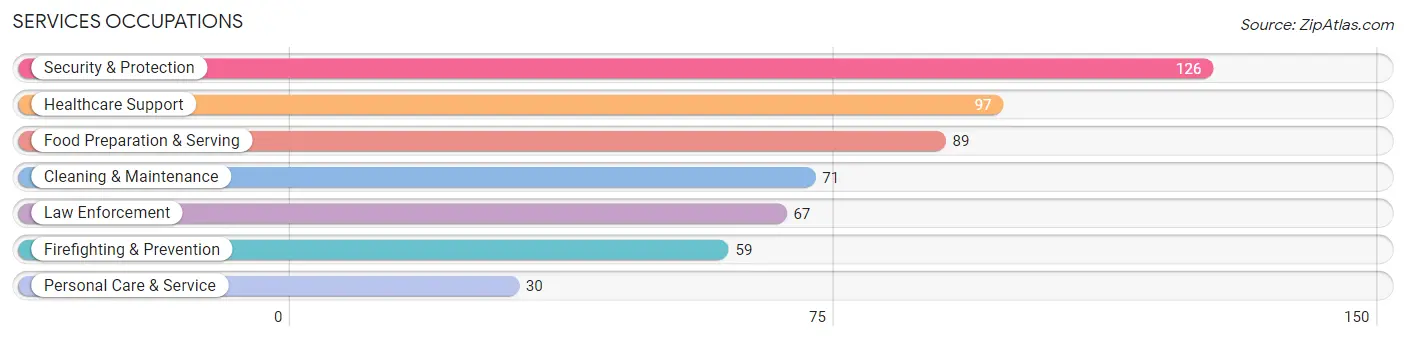
Services Occupations
The most common Services occupations in Monroeville are Security & Protection (126 | 6.9%), Healthcare Support (97 | 5.3%), Food Preparation & Serving (89 | 4.9%), Cleaning & Maintenance (71 | 3.9%), and Law Enforcement (67 | 3.7%).
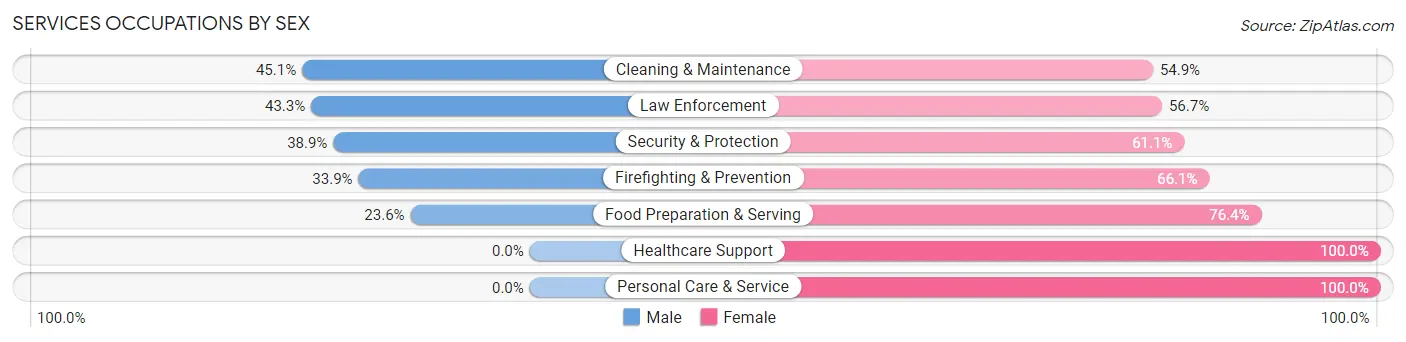
Services Occupations by Sex
Within the Services occupations in Monroeville, the most male-oriented occupations are Cleaning & Maintenance (45.1%), Law Enforcement (43.3%), and Security & Protection (38.9%), while the most female-oriented occupations are Healthcare Support (100.0%), Personal Care & Service (100.0%), and Food Preparation & Serving (76.4%).
| Occupation | Male | Female |
| Healthcare Support | 0 (0.0%) | 97 (100.0%) |
| Security & Protection | 49 (38.9%) | 77 (61.1%) |
| Firefighting & Prevention | 20 (33.9%) | 39 (66.1%) |
| Law Enforcement | 29 (43.3%) | 38 (56.7%) |
| Food Preparation & Serving | 21 (23.6%) | 68 (76.4%) |
| Cleaning & Maintenance | 32 (45.1%) | 39 (54.9%) |
| Personal Care & Service | 0 (0.0%) | 30 (100.0%) |
| Total (Category) | 102 (24.7%) | 311 (75.3%) |
| Total (Overall) | 736 (40.2%) | 1,093 (59.8%) |
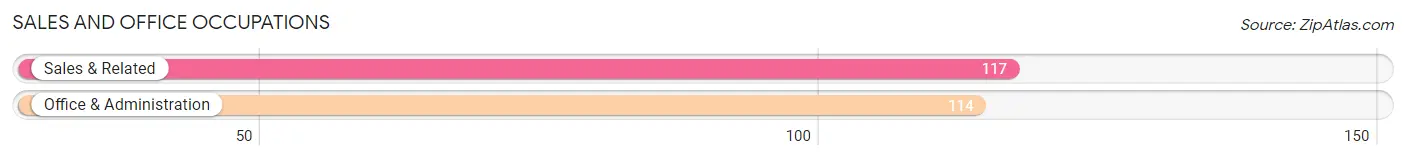
Sales and Office Occupations
The most common Sales and Office occupations in Monroeville are Sales & Related (117 | 6.4%), and Office & Administration (114 | 6.2%).
Sales and Office Occupations by Sex
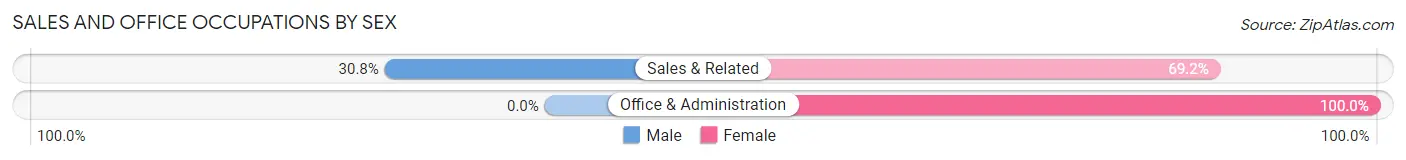
| Occupation | Male | Female |
| Sales & Related | 36 (30.8%) | 81 (69.2%) |
| Office & Administration | 0 (0.0%) | 114 (100.0%) |
| Total (Category) | 36 (15.6%) | 195 (84.4%) |
| Total (Overall) | 736 (40.2%) | 1,093 (59.8%) |
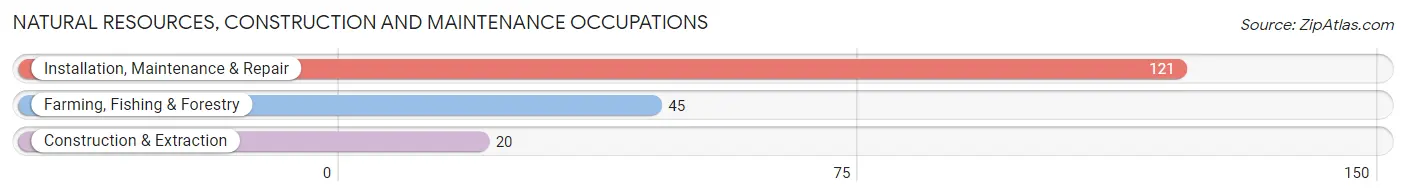
Natural Resources, Construction and Maintenance Occupations
The most common Natural Resources, Construction and Maintenance occupations in Monroeville are Installation, Maintenance & Repair (121 | 6.6%), Farming, Fishing & Forestry (45 | 2.5%), and Construction & Extraction (20 | 1.1%).
Natural Resources, Construction and Maintenance Occupations by Sex
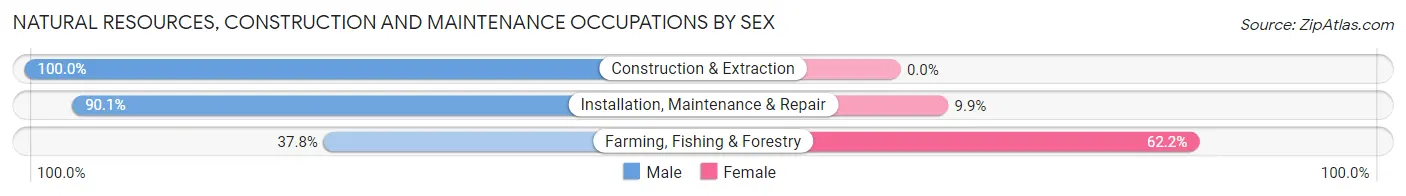
| Occupation | Male | Female |
| Farming, Fishing & Forestry | 17 (37.8%) | 28 (62.2%) |
| Construction & Extraction | 20 (100.0%) | 0 (0.0%) |
| Installation, Maintenance & Repair | 109 (90.1%) | 12 (9.9%) |
| Total (Category) | 146 (78.5%) | 40 (21.5%) |
| Total (Overall) | 736 (40.2%) | 1,093 (59.8%) |
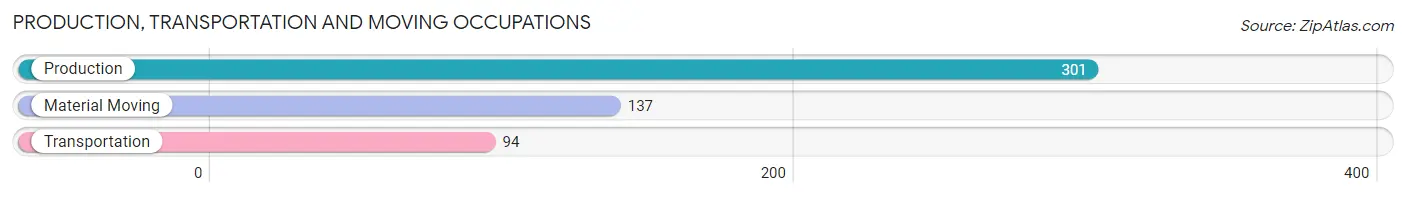
Production, Transportation and Moving Occupations
The most common Production, Transportation and Moving occupations in Monroeville are Production (301 | 16.5%), Material Moving (137 | 7.5%), and Transportation (94 | 5.1%).
Production, Transportation and Moving Occupations by Sex
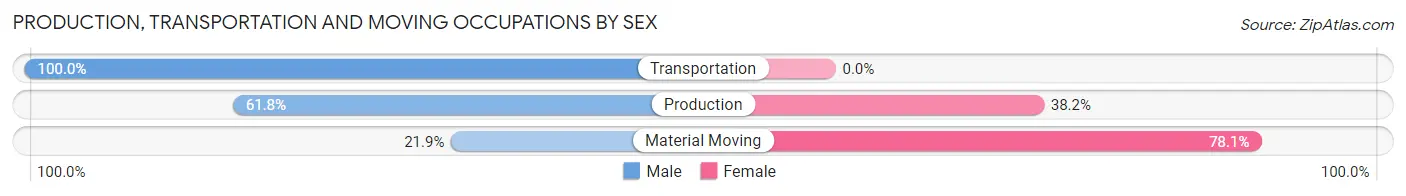
| Occupation | Male | Female |
| Production | 186 (61.8%) | 115 (38.2%) |
| Transportation | 94 (100.0%) | 0 (0.0%) |
| Material Moving | 30 (21.9%) | 107 (78.1%) |
| Total (Category) | 310 (58.3%) | 222 (41.7%) |
| Total (Overall) | 736 (40.2%) | 1,093 (59.8%) |
Employment Industries by Sex in Monroeville
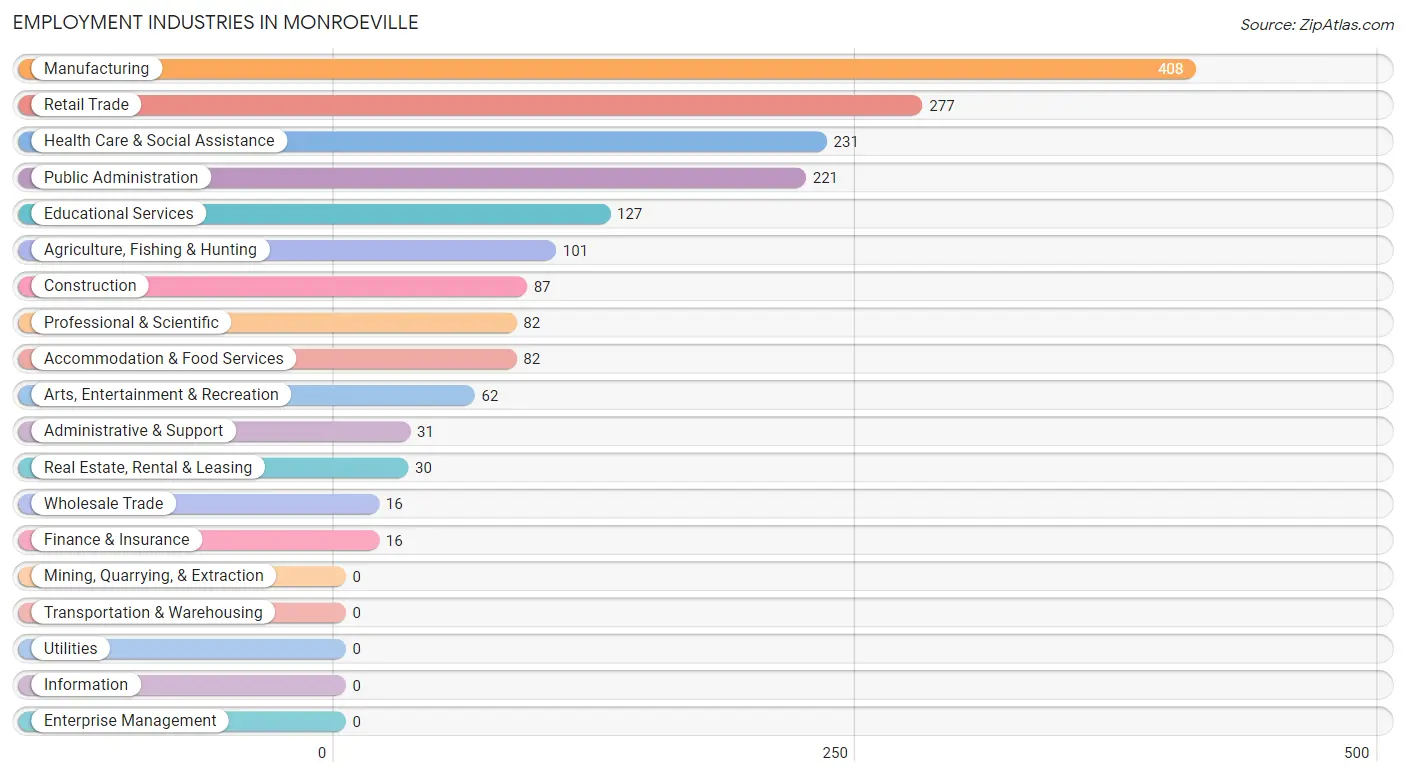
Employment Industries in Monroeville
The major employment industries in Monroeville include Manufacturing (408 | 22.3%), Retail Trade (277 | 15.1%), Health Care & Social Assistance (231 | 12.6%), Public Administration (221 | 12.1%), and Educational Services (127 | 6.9%).
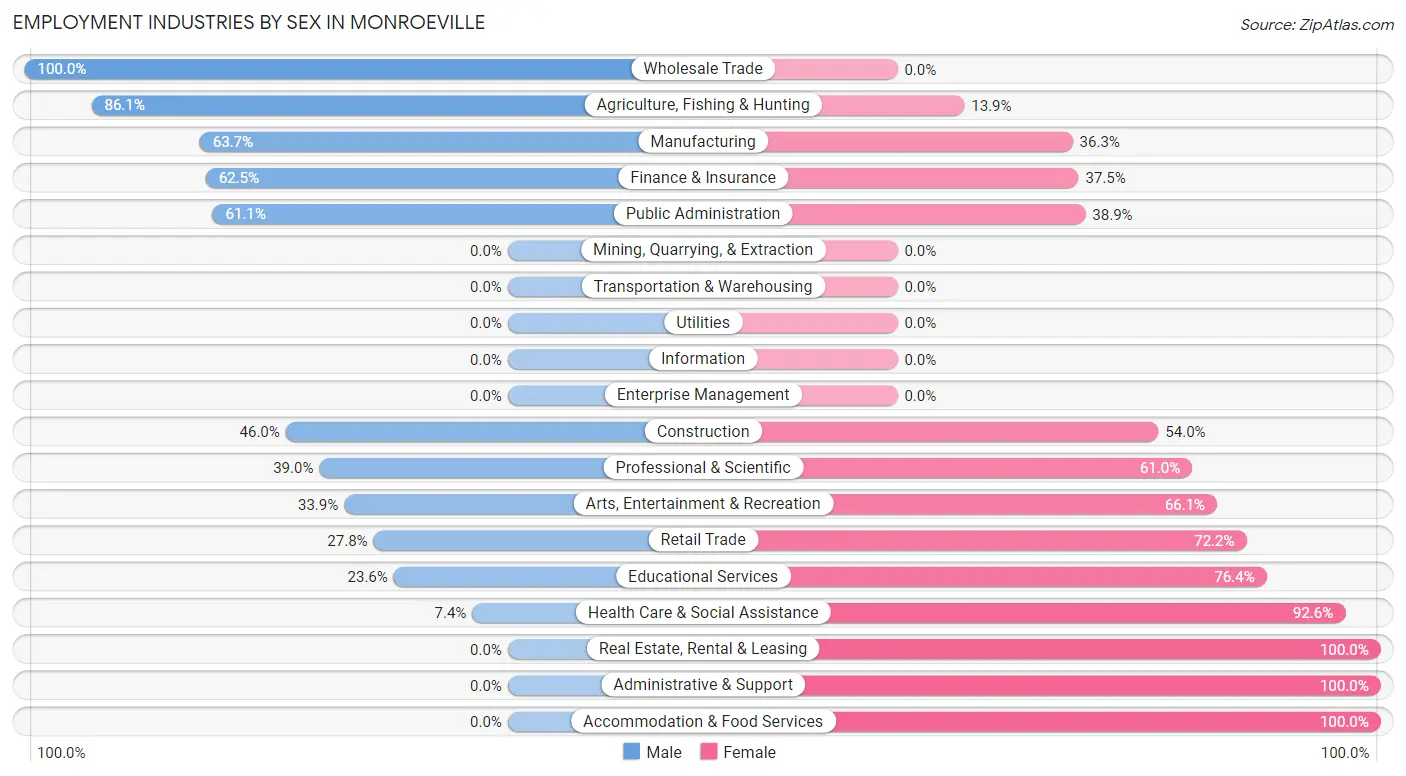
Employment Industries by Sex in Monroeville
The Monroeville industries that see more men than women are Wholesale Trade (100.0%), Agriculture, Fishing & Hunting (86.1%), and Manufacturing (63.7%), whereas the industries that tend to have a higher number of women are Real Estate, Rental & Leasing (100.0%), Administrative & Support (100.0%), and Accommodation & Food Services (100.0%).
| Industry | Male | Female |
| Agriculture, Fishing & Hunting | 87 (86.1%) | 14 (13.9%) |
| Mining, Quarrying, & Extraction | 0 (0.0%) | 0 (0.0%) |
| Construction | 40 (46.0%) | 47 (54.0%) |
| Manufacturing | 260 (63.7%) | 148 (36.3%) |
| Wholesale Trade | 16 (100.0%) | 0 (0.0%) |
| Retail Trade | 77 (27.8%) | 200 (72.2%) |
| Transportation & Warehousing | 0 (0.0%) | 0 (0.0%) |
| Utilities | 0 (0.0%) | 0 (0.0%) |
| Information | 0 (0.0%) | 0 (0.0%) |
| Finance & Insurance | 10 (62.5%) | 6 (37.5%) |
| Real Estate, Rental & Leasing | 0 (0.0%) | 30 (100.0%) |
| Professional & Scientific | 32 (39.0%) | 50 (61.0%) |
| Enterprise Management | 0 (0.0%) | 0 (0.0%) |
| Administrative & Support | 0 (0.0%) | 31 (100.0%) |
| Educational Services | 30 (23.6%) | 97 (76.4%) |
| Health Care & Social Assistance | 17 (7.4%) | 214 (92.6%) |
| Arts, Entertainment & Recreation | 21 (33.9%) | 41 (66.1%) |
| Accommodation & Food Services | 0 (0.0%) | 82 (100.0%) |
| Public Administration | 135 (61.1%) | 86 (38.9%) |
| Total | 736 (40.2%) | 1,093 (59.8%) |
Education in Monroeville
School Enrollment in Monroeville
The most common levels of schooling among the 1,474 students in Monroeville are elementary school (539 | 36.6%), middle school (497 | 33.7%), and high school (246 | 16.7%).
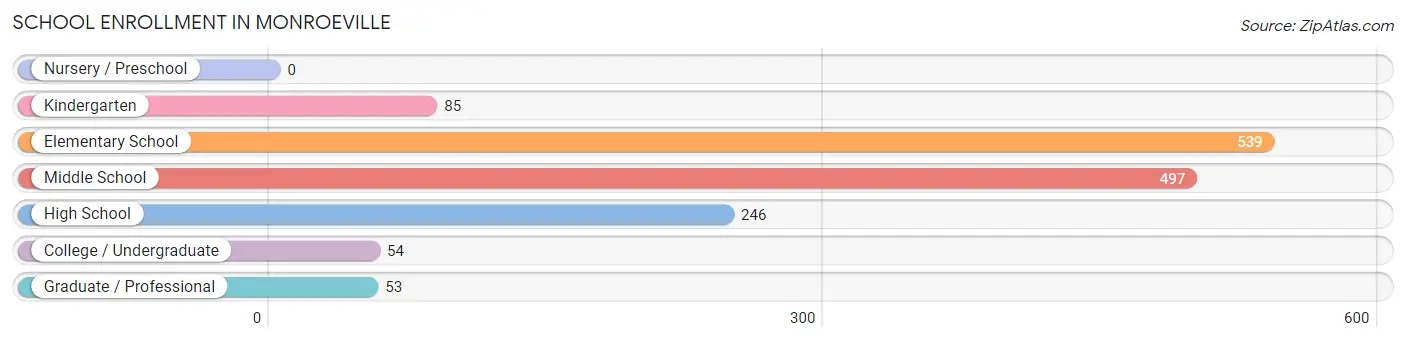
| School Level | # Students | % Students |
| Nursery / Preschool | 0 | 0.0% |
| Kindergarten | 85 | 5.8% |
| Elementary School | 539 | 36.6% |
| Middle School | 497 | 33.7% |
| High School | 246 | 16.7% |
| College / Undergraduate | 54 | 3.7% |
| Graduate / Professional | 53 | 3.6% |
| Total | 1,474 | 100.0% |
School Enrollment by Age by Funding Source in Monroeville
Out of a total of 1,474 students who are enrolled in schools in Monroeville, 181 (12.3%) attend a private institution, while the remaining 1,293 (87.7%) are enrolled in public schools. The age group of 15 to 17 year olds has the highest likelihood of being enrolled in private schools, with 77 (40.7% in the age bracket) enrolled. Conversely, the age group of 35 years and over has the lowest likelihood of being enrolled in a private school, with 64 (100.0% in the age bracket) attending a public institution.
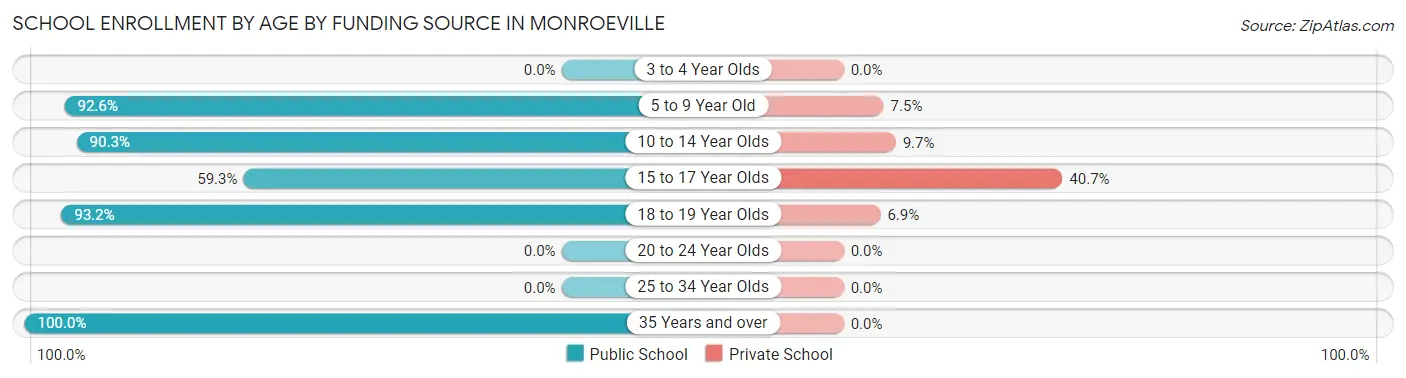
| Age Bracket | Public School | Private School |
| 3 to 4 Year Olds | 0 (0.0%) | 0 (0.0%) |
| 5 to 9 Year Old | 509 (92.5%) | 41 (7.4%) |
| 10 to 14 Year Olds | 540 (90.3%) | 58 (9.7%) |
| 15 to 17 Year Olds | 112 (59.3%) | 77 (40.7%) |
| 18 to 19 Year Olds | 68 (93.1%) | 5 (6.9%) |
| 20 to 24 Year Olds | 0 (0.0%) | 0 (0.0%) |
| 25 to 34 Year Olds | 0 (0.0%) | 0 (0.0%) |
| 35 Years and over | 64 (100.0%) | 0 (0.0%) |
| Total | 1,293 (87.7%) | 181 (12.3%) |
Educational Attainment by Field of Study in Monroeville
Education (320 | 34.9%), science & technology (256 | 27.9%), arts & humanities (82 | 8.9%), liberal arts & history (62 | 6.8%), and bio, nature & agricultural (57 | 6.2%) are the most common fields of study among 918 individuals in Monroeville who have obtained a bachelor's degree or higher.
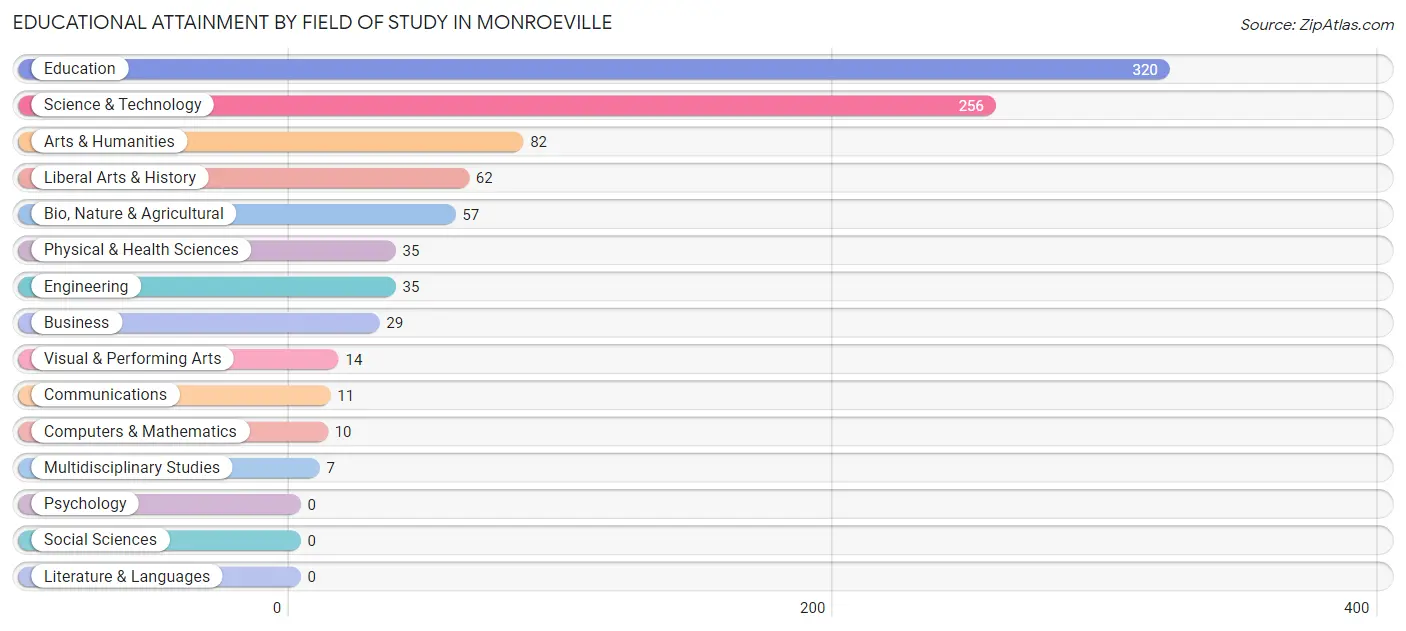
| Field of Study | # Graduates | % Graduates |
| Computers & Mathematics | 10 | 1.1% |
| Bio, Nature & Agricultural | 57 | 6.2% |
| Physical & Health Sciences | 35 | 3.8% |
| Psychology | 0 | 0.0% |
| Social Sciences | 0 | 0.0% |
| Engineering | 35 | 3.8% |
| Multidisciplinary Studies | 7 | 0.8% |
| Science & Technology | 256 | 27.9% |
| Business | 29 | 3.2% |
| Education | 320 | 34.9% |
| Literature & Languages | 0 | 0.0% |
| Liberal Arts & History | 62 | 6.8% |
| Visual & Performing Arts | 14 | 1.5% |
| Communications | 11 | 1.2% |
| Arts & Humanities | 82 | 8.9% |
| Total | 918 | 100.0% |
Transportation & Commute in Monroeville
Vehicle Availability by Sex in Monroeville
The most prevalent vehicle ownership categories in Monroeville are males with 3 vehicles (247, accounting for 31.4%) and females with 3 vehicles (207, making up 22.7%).
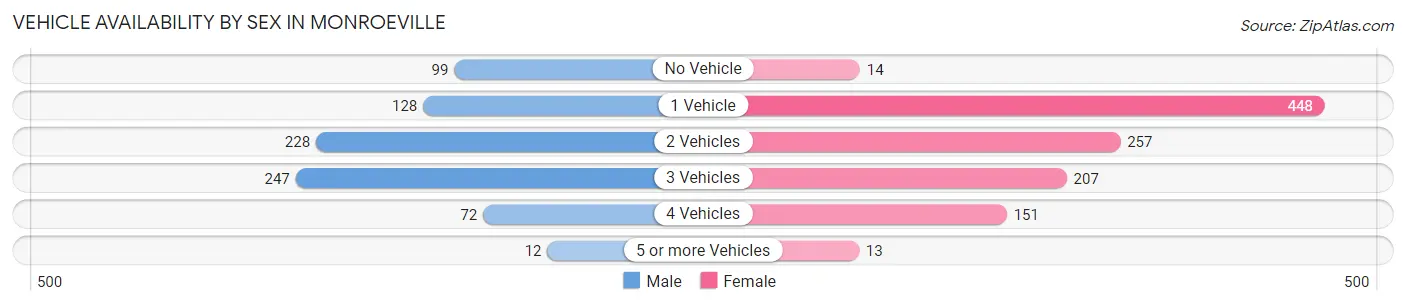
| Vehicles Available | Male | Female |
| No Vehicle | 99 (12.6%) | 14 (1.3%) |
| 1 Vehicle | 128 (16.3%) | 448 (41.1%) |
| 2 Vehicles | 228 (29.0%) | 257 (23.6%) |
| 3 Vehicles | 247 (31.4%) | 207 (19.0%) |
| 4 Vehicles | 72 (9.2%) | 151 (13.9%) |
| 5 or more Vehicles | 12 (1.5%) | 13 (1.2%) |
| Total | 786 (100.0%) | 1,090 (100.0%) |
Commute Time in Monroeville
The most frequently occuring commute durations in Monroeville are 5 to 9 minutes (532 commuters, 28.7%), 10 to 14 minutes (447 commuters, 24.1%), and 20 to 24 minutes (182 commuters, 9.8%).
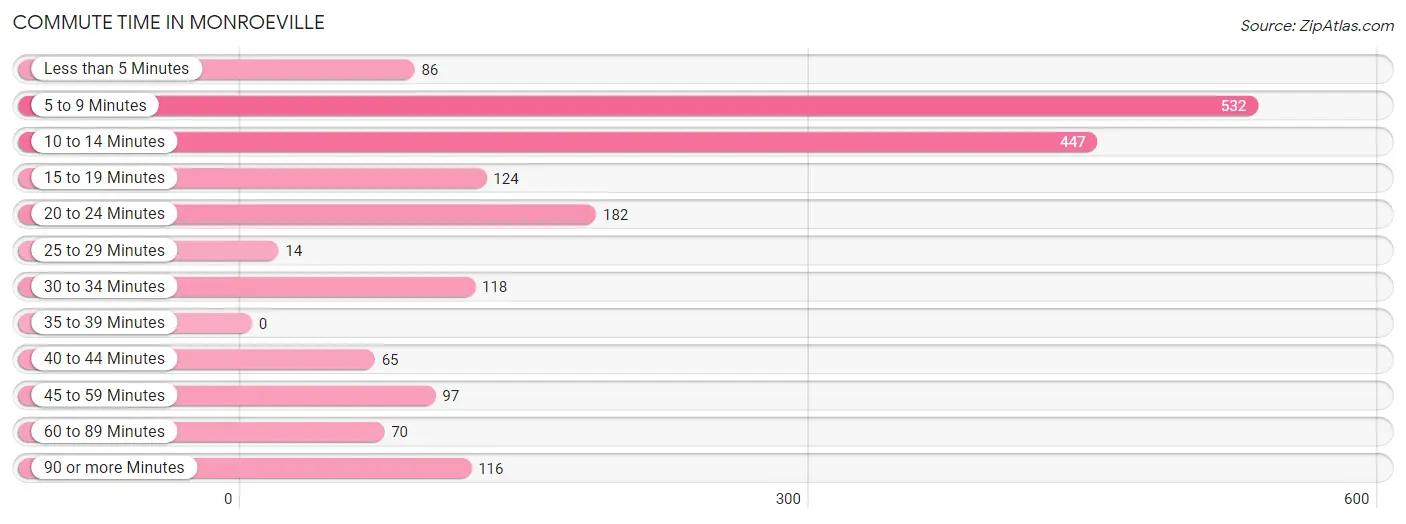
| Commute Time | # Commuters | % Commuters |
| Less than 5 Minutes | 86 | 4.6% |
| 5 to 9 Minutes | 532 | 28.7% |
| 10 to 14 Minutes | 447 | 24.1% |
| 15 to 19 Minutes | 124 | 6.7% |
| 20 to 24 Minutes | 182 | 9.8% |
| 25 to 29 Minutes | 14 | 0.8% |
| 30 to 34 Minutes | 118 | 6.4% |
| 35 to 39 Minutes | 0 | 0.0% |
| 40 to 44 Minutes | 65 | 3.5% |
| 45 to 59 Minutes | 97 | 5.2% |
| 60 to 89 Minutes | 70 | 3.8% |
| 90 or more Minutes | 116 | 6.3% |
Commute Time by Sex in Monroeville
The most common commute times in Monroeville are 5 to 9 minutes (246 commuters, 32.5%) for males and 10 to 14 minutes (326 commuters, 29.8%) for females.
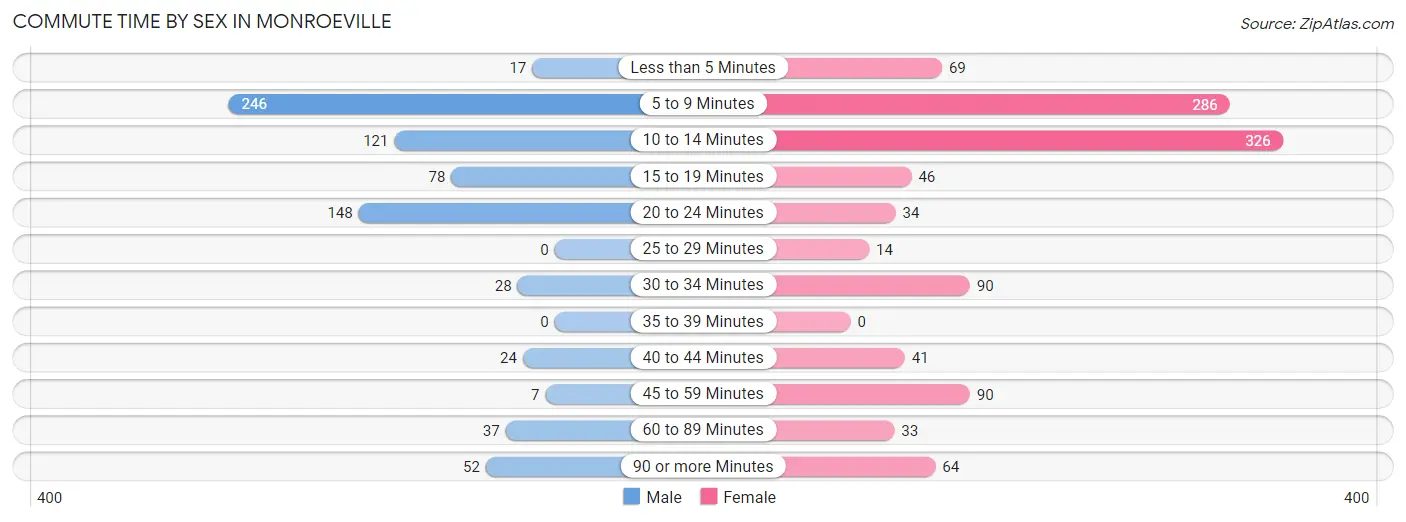
| Commute Time | Male | Female |
| Less than 5 Minutes | 17 (2.2%) | 69 (6.3%) |
| 5 to 9 Minutes | 246 (32.5%) | 286 (26.2%) |
| 10 to 14 Minutes | 121 (16.0%) | 326 (29.8%) |
| 15 to 19 Minutes | 78 (10.3%) | 46 (4.2%) |
| 20 to 24 Minutes | 148 (19.5%) | 34 (3.1%) |
| 25 to 29 Minutes | 0 (0.0%) | 14 (1.3%) |
| 30 to 34 Minutes | 28 (3.7%) | 90 (8.2%) |
| 35 to 39 Minutes | 0 (0.0%) | 0 (0.0%) |
| 40 to 44 Minutes | 24 (3.2%) | 41 (3.7%) |
| 45 to 59 Minutes | 7 (0.9%) | 90 (8.2%) |
| 60 to 89 Minutes | 37 (4.9%) | 33 (3.0%) |
| 90 or more Minutes | 52 (6.9%) | 64 (5.9%) |
Time of Departure to Work by Sex in Monroeville
The most frequent times of departure to work in Monroeville are 7:00 AM to 7:29 AM (124, 16.4%) for males and 7:00 AM to 7:29 AM (166, 15.2%) for females.
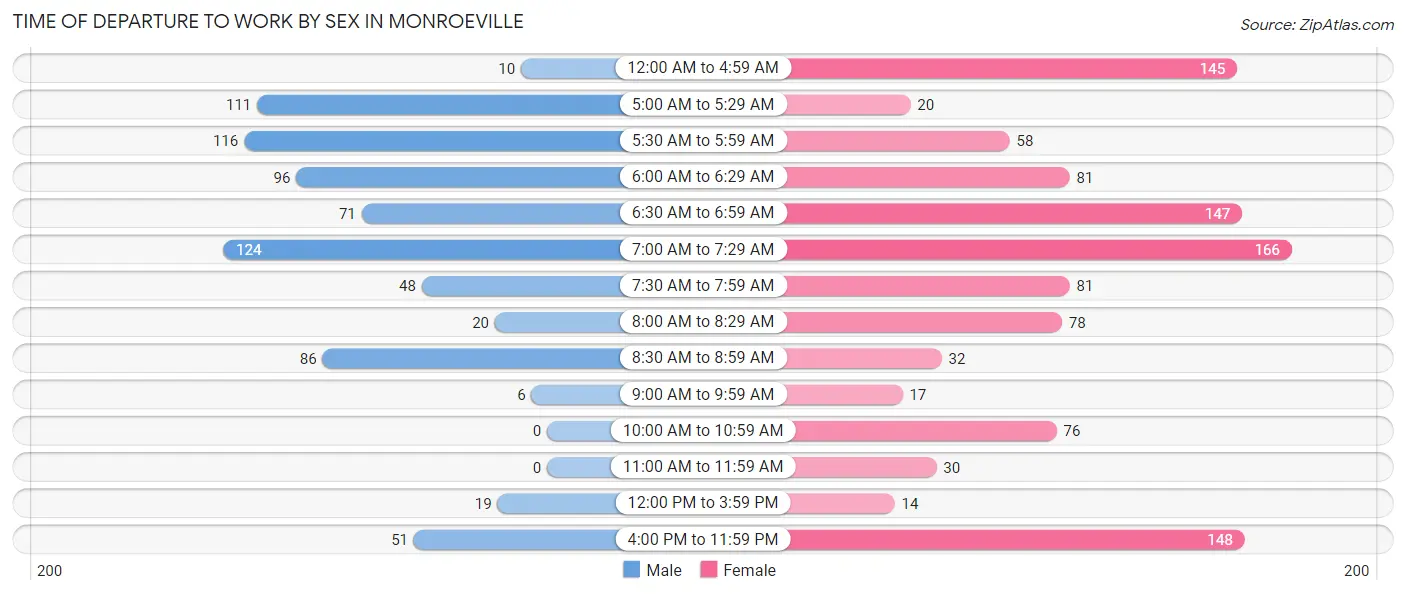
| Time of Departure | Male | Female |
| 12:00 AM to 4:59 AM | 10 (1.3%) | 145 (13.3%) |
| 5:00 AM to 5:29 AM | 111 (14.6%) | 20 (1.8%) |
| 5:30 AM to 5:59 AM | 116 (15.3%) | 58 (5.3%) |
| 6:00 AM to 6:29 AM | 96 (12.7%) | 81 (7.4%) |
| 6:30 AM to 6:59 AM | 71 (9.4%) | 147 (13.5%) |
| 7:00 AM to 7:29 AM | 124 (16.4%) | 166 (15.2%) |
| 7:30 AM to 7:59 AM | 48 (6.3%) | 81 (7.4%) |
| 8:00 AM to 8:29 AM | 20 (2.6%) | 78 (7.1%) |
| 8:30 AM to 8:59 AM | 86 (11.4%) | 32 (2.9%) |
| 9:00 AM to 9:59 AM | 6 (0.8%) | 17 (1.6%) |
| 10:00 AM to 10:59 AM | 0 (0.0%) | 76 (7.0%) |
| 11:00 AM to 11:59 AM | 0 (0.0%) | 30 (2.7%) |
| 12:00 PM to 3:59 PM | 19 (2.5%) | 14 (1.3%) |
| 4:00 PM to 11:59 PM | 51 (6.7%) | 148 (13.5%) |
| Total | 758 (100.0%) | 1,093 (100.0%) |
Housing Occupancy in Monroeville
Occupancy by Ownership in Monroeville
Of the total 2,380 dwellings in Monroeville, owner-occupied units account for 1,318 (55.4%), while renter-occupied units make up 1,062 (44.6%).
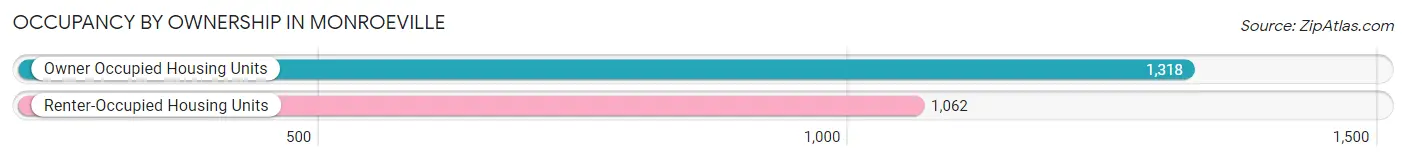
| Occupancy | # Housing Units | % Housing Units |
| Owner Occupied Housing Units | 1,318 | 55.4% |
| Renter-Occupied Housing Units | 1,062 | 44.6% |
| Total Occupied Housing Units | 2,380 | 100.0% |
Occupancy by Household Size in Monroeville
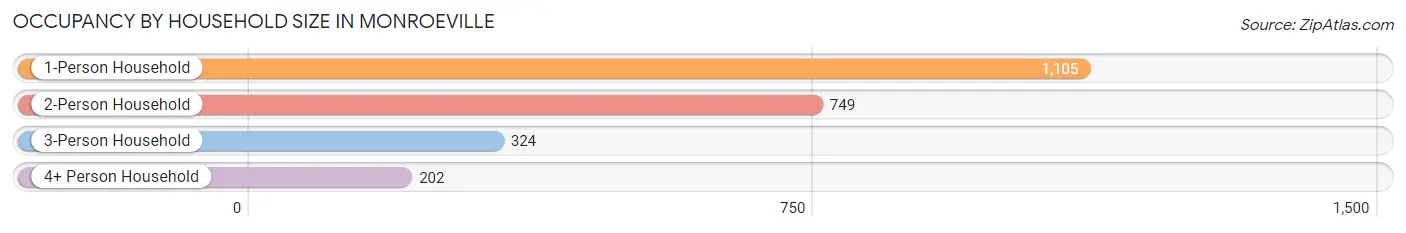
| Household Size | # Housing Units | % Housing Units |
| 1-Person Household | 1,105 | 46.4% |
| 2-Person Household | 749 | 31.5% |
| 3-Person Household | 324 | 13.6% |
| 4+ Person Household | 202 | 8.5% |
| Total Housing Units | 2,380 | 100.0% |
Occupancy by Ownership by Household Size in Monroeville
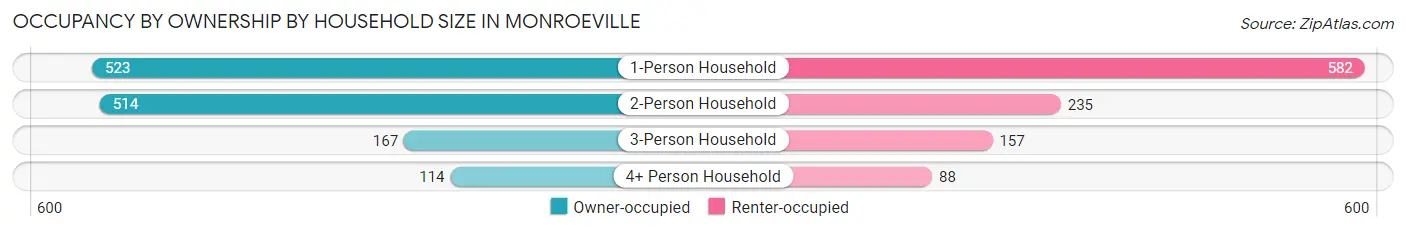
| Household Size | Owner-occupied | Renter-occupied |
| 1-Person Household | 523 (47.3%) | 582 (52.7%) |
| 2-Person Household | 514 (68.6%) | 235 (31.4%) |
| 3-Person Household | 167 (51.5%) | 157 (48.5%) |
| 4+ Person Household | 114 (56.4%) | 88 (43.6%) |
| Total Housing Units | 1,318 (55.4%) | 1,062 (44.6%) |
Occupancy by Educational Attainment in Monroeville
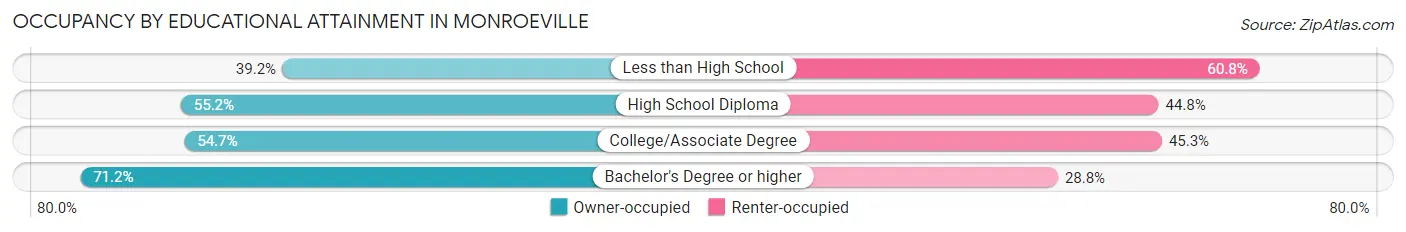
| Household Size | Owner-occupied | Renter-occupied |
| Less than High School | 136 (39.2%) | 211 (60.8%) |
| High School Diploma | 593 (55.2%) | 481 (44.8%) |
| College/Associate Degree | 310 (54.7%) | 257 (45.3%) |
| Bachelor's Degree or higher | 279 (71.2%) | 113 (28.8%) |
Occupancy by Age of Householder in Monroeville
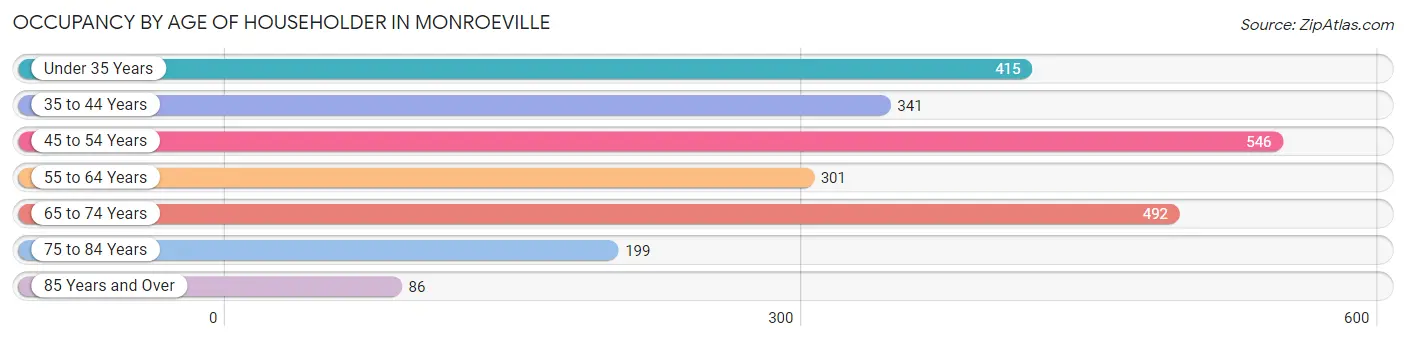
| Age Bracket | # Households | % Households |
| Under 35 Years | 415 | 17.4% |
| 35 to 44 Years | 341 | 14.3% |
| 45 to 54 Years | 546 | 22.9% |
| 55 to 64 Years | 301 | 12.7% |
| 65 to 74 Years | 492 | 20.7% |
| 75 to 84 Years | 199 | 8.4% |
| 85 Years and Over | 86 | 3.6% |
| Total | 2,380 | 100.0% |
Housing Finances in Monroeville
Median Income by Occupancy in Monroeville
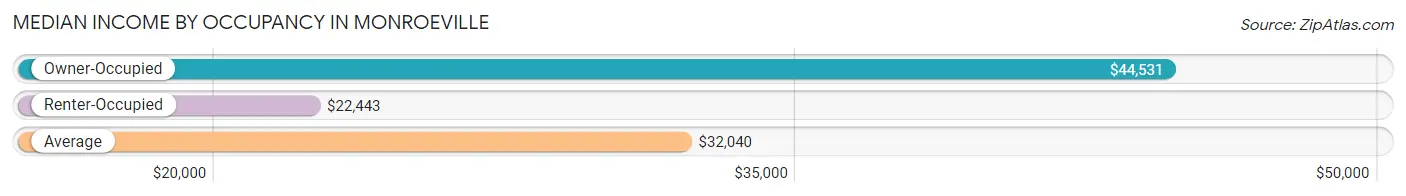
| Occupancy Type | # Households | Median Income |
| Owner-Occupied | 1,318 (55.4%) | $44,531 |
| Renter-Occupied | 1,062 (44.6%) | $22,443 |
| Average | 2,380 (100.0%) | $32,040 |
Occupancy by Householder Income Bracket in Monroeville
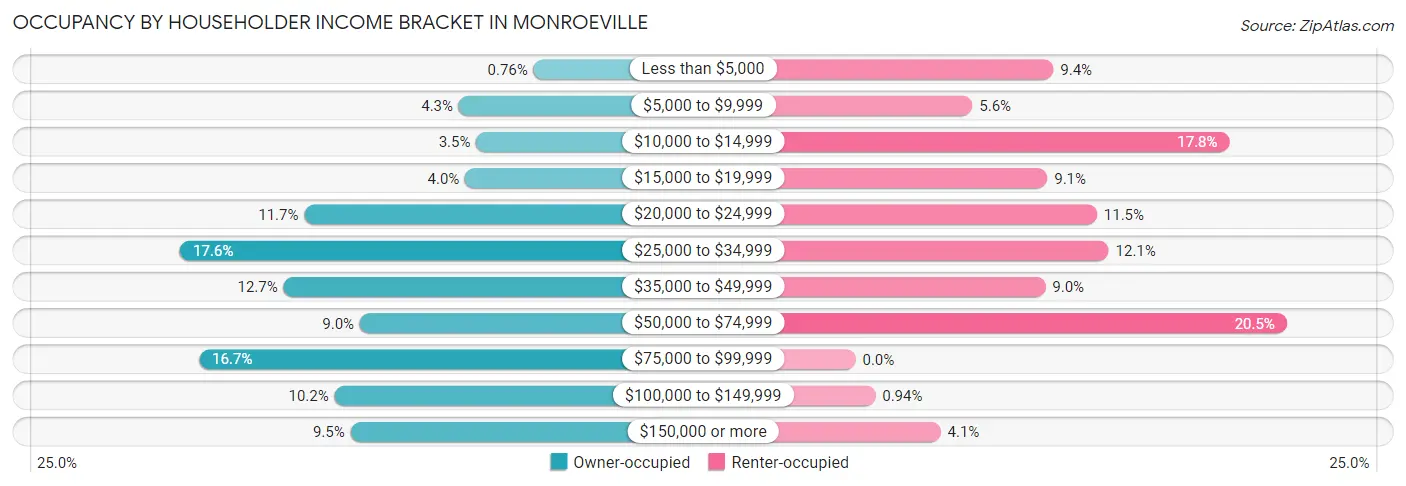
| Income Bracket | Owner-occupied | Renter-occupied |
| Less than $5,000 | 10 (0.8%) | 100 (9.4%) |
| $5,000 to $9,999 | 57 (4.3%) | 59 (5.6%) |
| $10,000 to $14,999 | 46 (3.5%) | 189 (17.8%) |
| $15,000 to $19,999 | 53 (4.0%) | 97 (9.1%) |
| $20,000 to $24,999 | 154 (11.7%) | 122 (11.5%) |
| $25,000 to $34,999 | 232 (17.6%) | 128 (12.0%) |
| $35,000 to $49,999 | 167 (12.7%) | 96 (9.0%) |
| $50,000 to $74,999 | 119 (9.0%) | 218 (20.5%) |
| $75,000 to $99,999 | 220 (16.7%) | 0 (0.0%) |
| $100,000 to $149,999 | 135 (10.2%) | 10 (0.9%) |
| $150,000 or more | 125 (9.5%) | 43 (4.1%) |
| Total | 1,318 (100.0%) | 1,062 (100.0%) |
Monthly Housing Cost Tiers in Monroeville
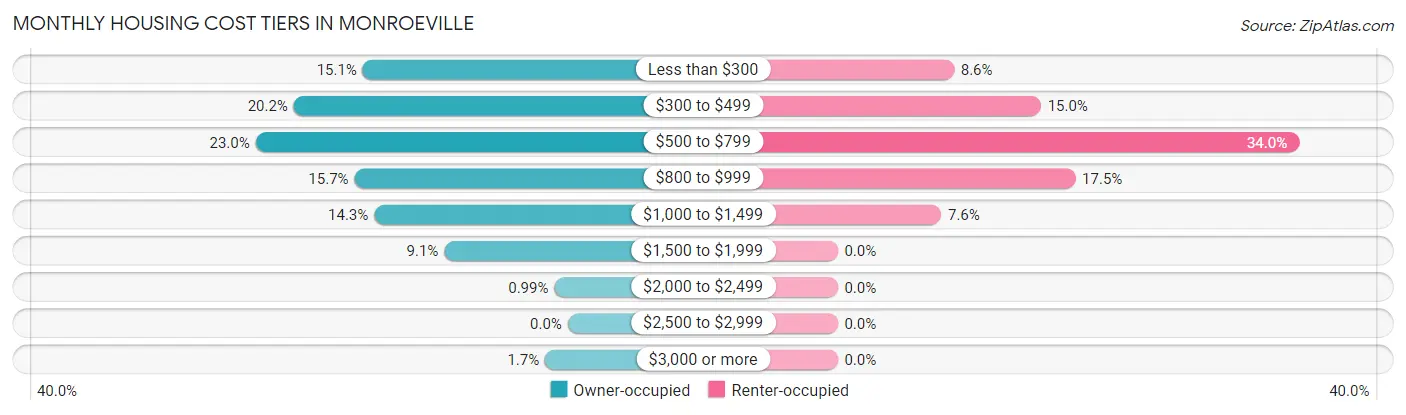
| Monthly Cost | Owner-occupied | Renter-occupied |
| Less than $300 | 199 (15.1%) | 91 (8.6%) |
| $300 to $499 | 266 (20.2%) | 159 (15.0%) |
| $500 to $799 | 303 (23.0%) | 361 (34.0%) |
| $800 to $999 | 207 (15.7%) | 186 (17.5%) |
| $1,000 to $1,499 | 188 (14.3%) | 81 (7.6%) |
| $1,500 to $1,999 | 120 (9.1%) | 0 (0.0%) |
| $2,000 to $2,499 | 13 (1.0%) | 0 (0.0%) |
| $2,500 to $2,999 | 0 (0.0%) | 0 (0.0%) |
| $3,000 or more | 22 (1.7%) | 0 (0.0%) |
| Total | 1,318 (100.0%) | 1,062 (100.0%) |
Physical Housing Characteristics in Monroeville
Housing Structures in Monroeville
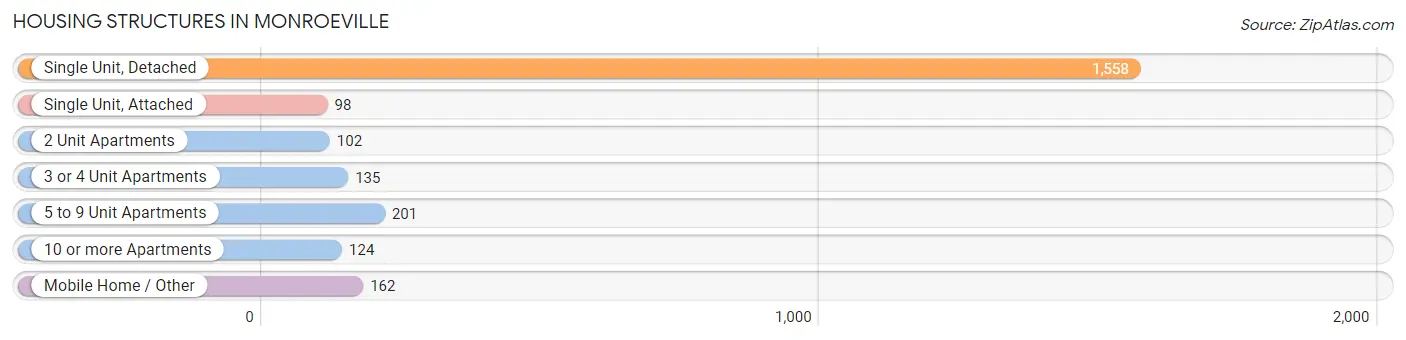
| Structure Type | # Housing Units | % Housing Units |
| Single Unit, Detached | 1,558 | 65.5% |
| Single Unit, Attached | 98 | 4.1% |
| 2 Unit Apartments | 102 | 4.3% |
| 3 or 4 Unit Apartments | 135 | 5.7% |
| 5 to 9 Unit Apartments | 201 | 8.5% |
| 10 or more Apartments | 124 | 5.2% |
| Mobile Home / Other | 162 | 6.8% |
| Total | 2,380 | 100.0% |
Housing Structures by Occupancy in Monroeville
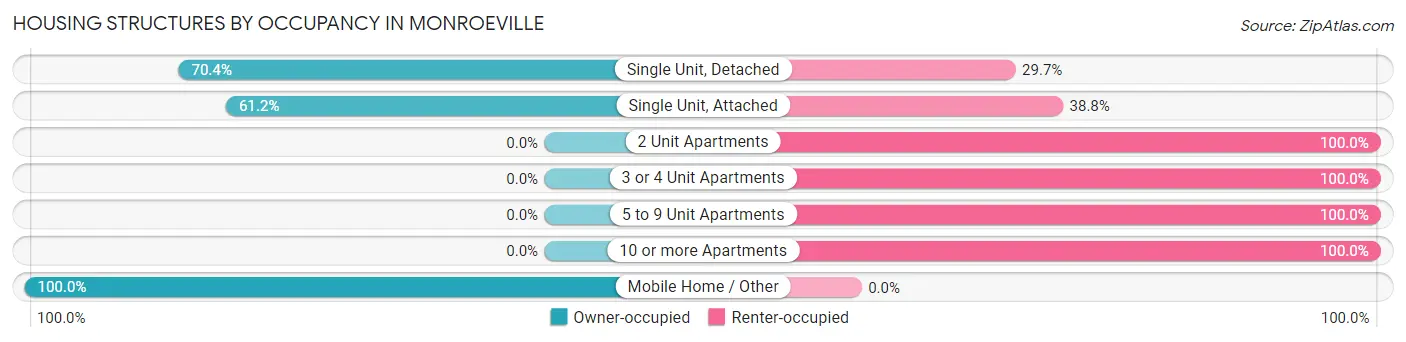
| Structure Type | Owner-occupied | Renter-occupied |
| Single Unit, Detached | 1,096 (70.4%) | 462 (29.6%) |
| Single Unit, Attached | 60 (61.2%) | 38 (38.8%) |
| 2 Unit Apartments | 0 (0.0%) | 102 (100.0%) |
| 3 or 4 Unit Apartments | 0 (0.0%) | 135 (100.0%) |
| 5 to 9 Unit Apartments | 0 (0.0%) | 201 (100.0%) |
| 10 or more Apartments | 0 (0.0%) | 124 (100.0%) |
| Mobile Home / Other | 162 (100.0%) | 0 (0.0%) |
| Total | 1,318 (55.4%) | 1,062 (44.6%) |
Housing Structures by Number of Rooms in Monroeville
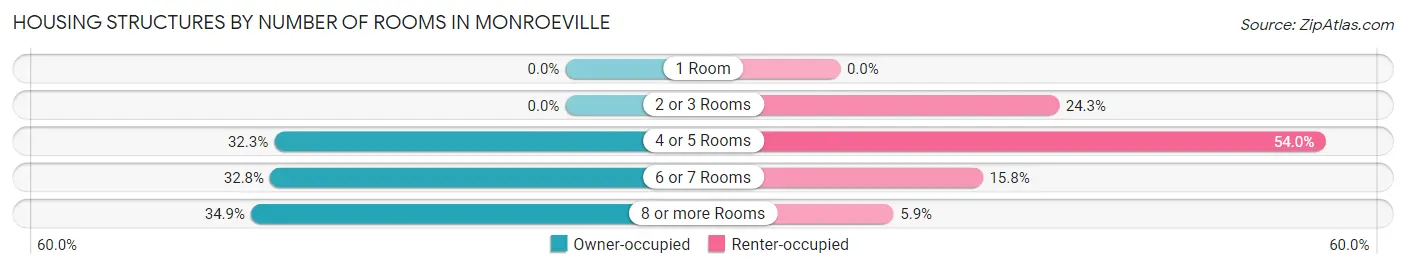
| Number of Rooms | Owner-occupied | Renter-occupied |
| 1 Room | 0 (0.0%) | 0 (0.0%) |
| 2 or 3 Rooms | 0 (0.0%) | 258 (24.3%) |
| 4 or 5 Rooms | 426 (32.3%) | 573 (53.9%) |
| 6 or 7 Rooms | 432 (32.8%) | 168 (15.8%) |
| 8 or more Rooms | 460 (34.9%) | 63 (5.9%) |
| Total | 1,318 (100.0%) | 1,062 (100.0%) |
Housing Structure by Heating Type in Monroeville
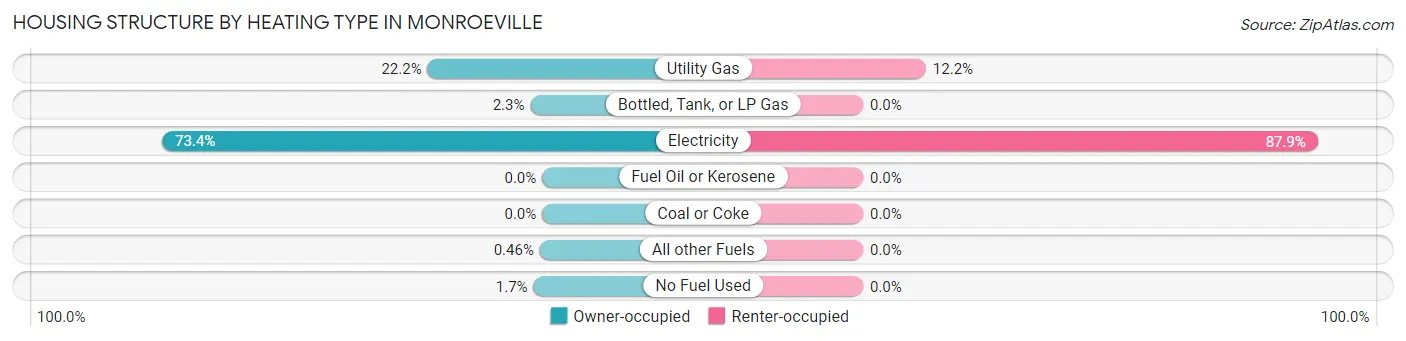
| Heating Type | Owner-occupied | Renter-occupied |
| Utility Gas | 292 (22.2%) | 129 (12.1%) |
| Bottled, Tank, or LP Gas | 30 (2.3%) | 0 (0.0%) |
| Electricity | 968 (73.4%) | 933 (87.8%) |
| Fuel Oil or Kerosene | 0 (0.0%) | 0 (0.0%) |
| Coal or Coke | 0 (0.0%) | 0 (0.0%) |
| All other Fuels | 6 (0.5%) | 0 (0.0%) |
| No Fuel Used | 22 (1.7%) | 0 (0.0%) |
| Total | 1,318 (100.0%) | 1,062 (100.0%) |
Household Vehicle Usage in Monroeville
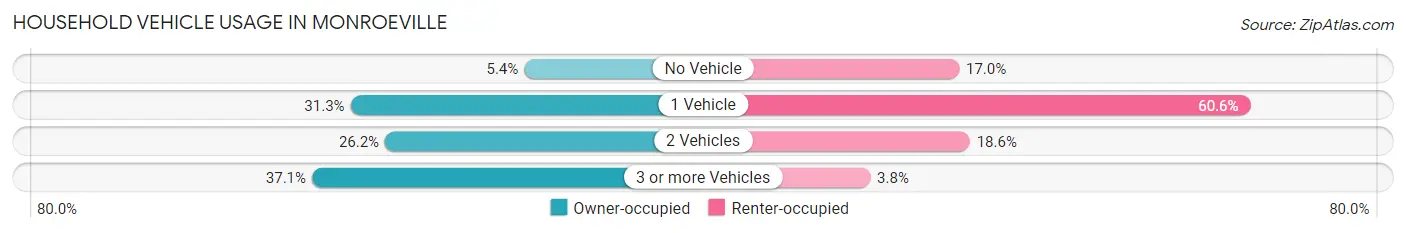
| Vehicles per Household | Owner-occupied | Renter-occupied |
| No Vehicle | 71 (5.4%) | 181 (17.0%) |
| 1 Vehicle | 413 (31.3%) | 643 (60.6%) |
| 2 Vehicles | 345 (26.2%) | 198 (18.6%) |
| 3 or more Vehicles | 489 (37.1%) | 40 (3.8%) |
| Total | 1,318 (100.0%) | 1,062 (100.0%) |
Real Estate & Mortgages in Monroeville
Real Estate and Mortgage Overview in Monroeville
| Characteristic | Without Mortgage | With Mortgage |
| Housing Units | 652 | 666 |
| Median Property Value | $103,100 | $178,300 |
| Median Household Income | $29,959 | $85 |
| Monthly Housing Costs | $359 | $22 |
| Real Estate Taxes | $362 | $120 |
Property Value by Mortgage Status in Monroeville
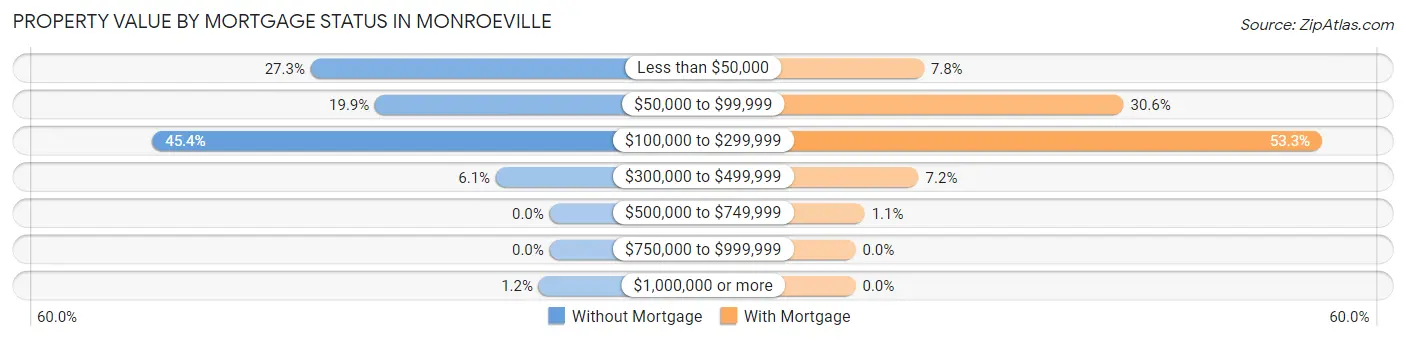
| Property Value | Without Mortgage | With Mortgage |
| Less than $50,000 | 178 (27.3%) | 52 (7.8%) |
| $50,000 to $99,999 | 130 (19.9%) | 204 (30.6%) |
| $100,000 to $299,999 | 296 (45.4%) | 355 (53.3%) |
| $300,000 to $499,999 | 40 (6.1%) | 48 (7.2%) |
| $500,000 to $749,999 | 0 (0.0%) | 7 (1.1%) |
| $750,000 to $999,999 | 0 (0.0%) | 0 (0.0%) |
| $1,000,000 or more | 8 (1.2%) | 0 (0.0%) |
| Total | 652 (100.0%) | 666 (100.0%) |
Household Income by Mortgage Status in Monroeville
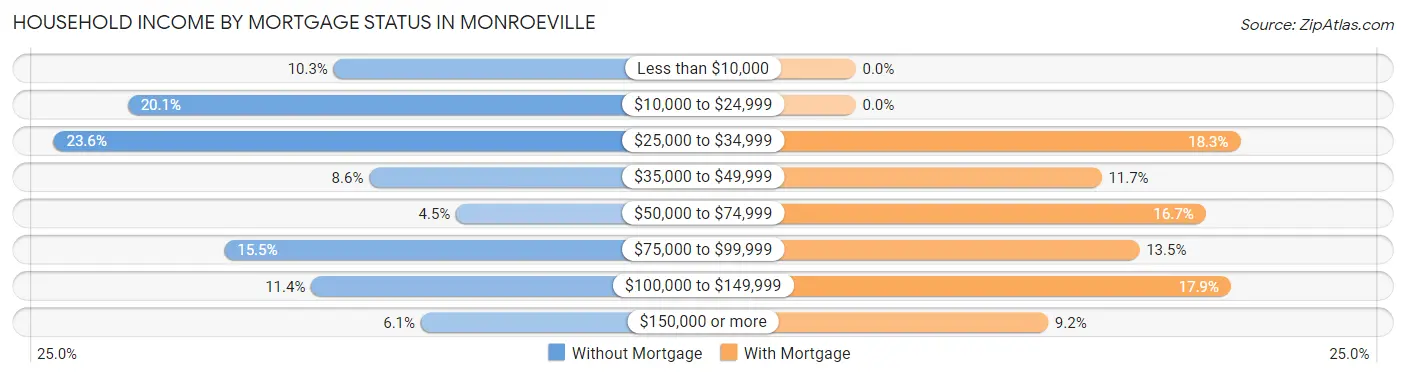
| Household Income | Without Mortgage | With Mortgage |
| Less than $10,000 | 67 (10.3%) | 0 (0.0%) |
| $10,000 to $24,999 | 131 (20.1%) | 0 (0.0%) |
| $25,000 to $34,999 | 154 (23.6%) | 122 (18.3%) |
| $35,000 to $49,999 | 56 (8.6%) | 78 (11.7%) |
| $50,000 to $74,999 | 29 (4.4%) | 111 (16.7%) |
| $75,000 to $99,999 | 101 (15.5%) | 90 (13.5%) |
| $100,000 to $149,999 | 74 (11.4%) | 119 (17.9%) |
| $150,000 or more | 40 (6.1%) | 61 (9.2%) |
| Total | 652 (100.0%) | 666 (100.0%) |
Property Value to Household Income Ratio in Monroeville
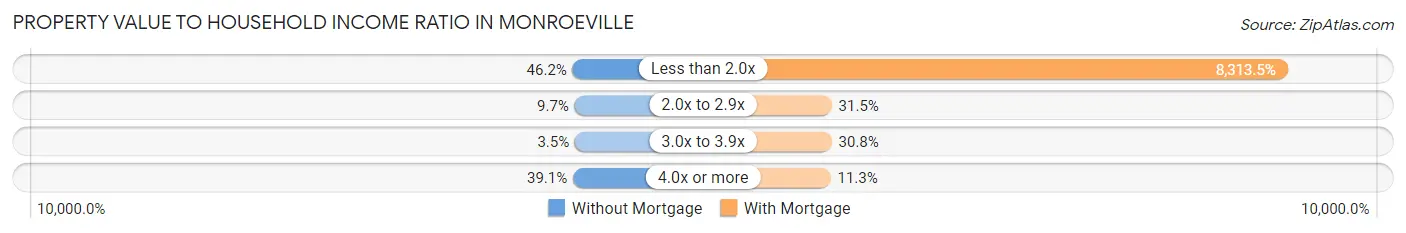
| Value-to-Income Ratio | Without Mortgage | With Mortgage |
| Less than 2.0x | 301 (46.2%) | 55,368 (8,313.5%) |
| 2.0x to 2.9x | 63 (9.7%) | 210 (31.5%) |
| 3.0x to 3.9x | 23 (3.5%) | 205 (30.8%) |
| 4.0x or more | 255 (39.1%) | 75 (11.3%) |
| Total | 652 (100.0%) | 666 (100.0%) |
Real Estate Taxes by Mortgage Status in Monroeville
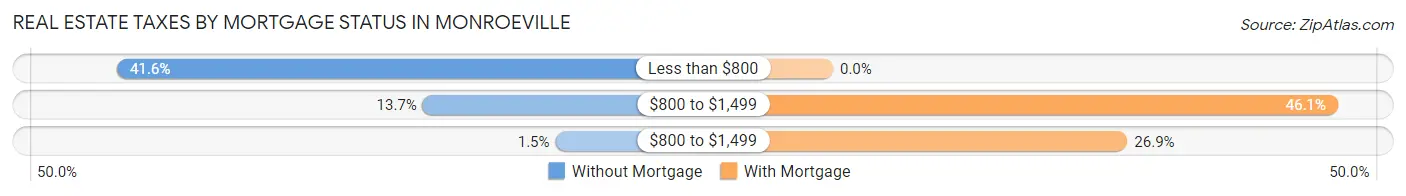
| Property Taxes | Without Mortgage | With Mortgage |
| Less than $800 | 271 (41.6%) | 0 (0.0%) |
| $800 to $1,499 | 89 (13.7%) | 307 (46.1%) |
| $800 to $1,499 | 10 (1.5%) | 179 (26.9%) |
| Total | 652 (100.0%) | 666 (100.0%) |
Health & Disability in Monroeville
Health Insurance Coverage by Age in Monroeville
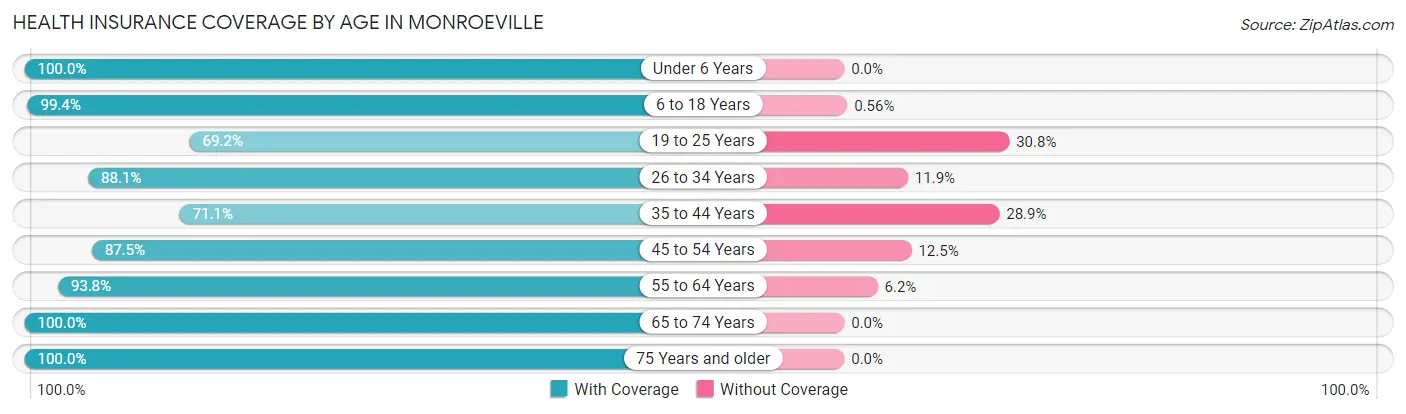
| Age Bracket | With Coverage | Without Coverage |
| Under 6 Years | 129 (100.0%) | 0 (0.0%) |
| 6 to 18 Years | 1,431 (99.4%) | 8 (0.6%) |
| 19 to 25 Years | 412 (69.2%) | 183 (30.8%) |
| 26 to 34 Years | 260 (88.1%) | 35 (11.9%) |
| 35 to 44 Years | 455 (71.1%) | 185 (28.9%) |
| 45 to 54 Years | 649 (87.5%) | 93 (12.5%) |
| 55 to 64 Years | 680 (93.8%) | 45 (6.2%) |
| 65 to 74 Years | 676 (100.0%) | 0 (0.0%) |
| 75 Years and older | 389 (100.0%) | 0 (0.0%) |
| Total | 5,081 (90.2%) | 549 (9.8%) |
Health Insurance Coverage by Citizenship Status in Monroeville
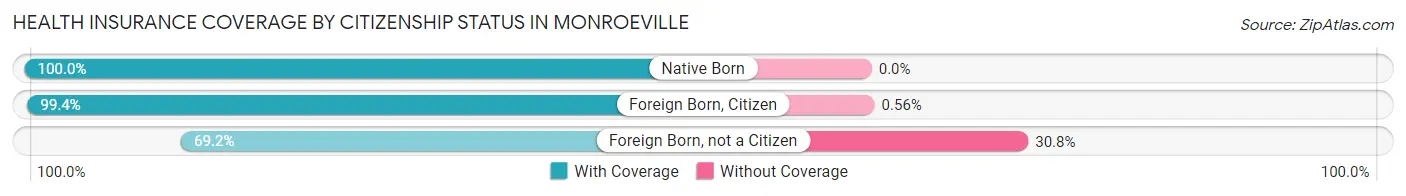
| Citizenship Status | With Coverage | Without Coverage |
| Native Born | 129 (100.0%) | 0 (0.0%) |
| Foreign Born, Citizen | 1,431 (99.4%) | 8 (0.6%) |
| Foreign Born, not a Citizen | 412 (69.2%) | 183 (30.8%) |
Health Insurance Coverage by Household Income in Monroeville
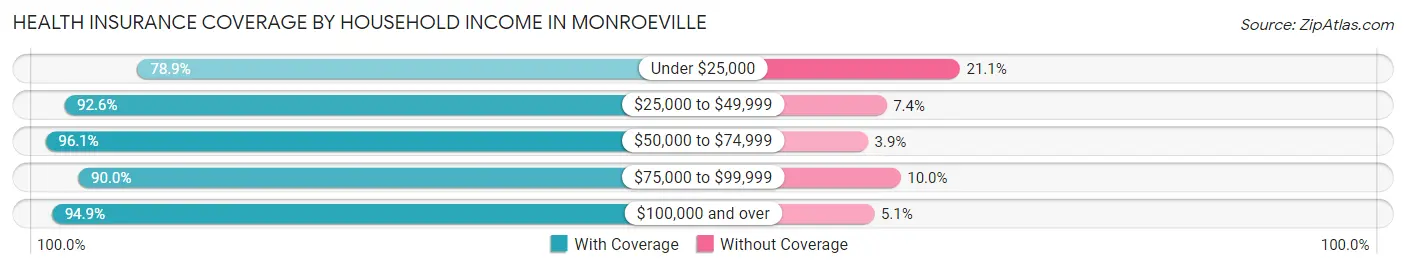
| Household Income | With Coverage | Without Coverage |
| Under $25,000 | 1,060 (78.9%) | 284 (21.1%) |
| $25,000 to $49,999 | 1,316 (92.6%) | 105 (7.4%) |
| $50,000 to $74,999 | 1,208 (96.1%) | 49 (3.9%) |
| $75,000 to $99,999 | 404 (90.0%) | 45 (10.0%) |
| $100,000 and over | 1,081 (94.9%) | 58 (5.1%) |
Public vs Private Health Insurance Coverage by Age in Monroeville
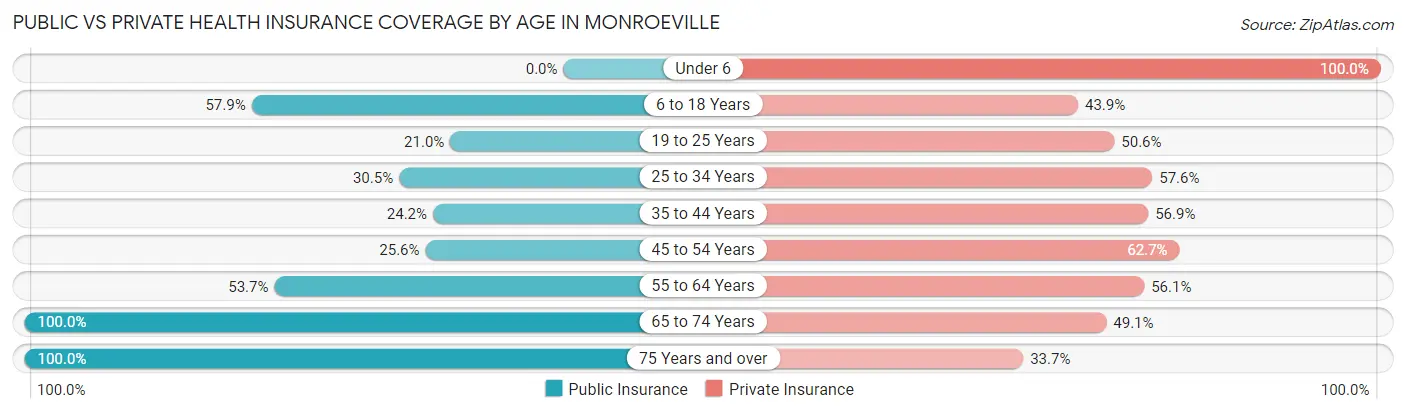
| Age Bracket | Public Insurance | Private Insurance |
| Under 6 | 0 (0.0%) | 129 (100.0%) |
| 6 to 18 Years | 833 (57.9%) | 631 (43.9%) |
| 19 to 25 Years | 125 (21.0%) | 301 (50.6%) |
| 25 to 34 Years | 90 (30.5%) | 170 (57.6%) |
| 35 to 44 Years | 155 (24.2%) | 364 (56.9%) |
| 45 to 54 Years | 190 (25.6%) | 465 (62.7%) |
| 55 to 64 Years | 389 (53.7%) | 407 (56.1%) |
| 65 to 74 Years | 676 (100.0%) | 332 (49.1%) |
| 75 Years and over | 389 (100.0%) | 131 (33.7%) |
| Total | 2,847 (50.6%) | 2,930 (52.0%) |
Disability Status by Sex by Age in Monroeville
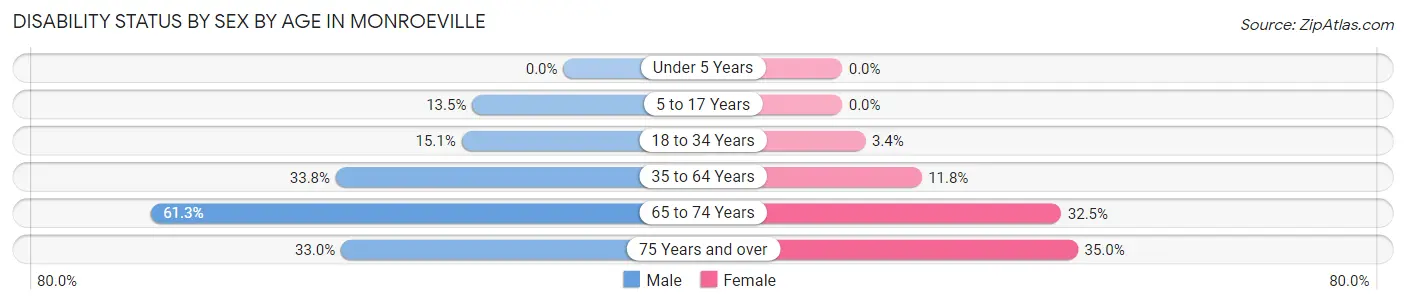
| Age Bracket | Male | Female |
| Under 5 Years | 0 (0.0%) | 0 (0.0%) |
| 5 to 17 Years | 110 (13.5%) | 0 (0.0%) |
| 18 to 34 Years | 52 (15.1%) | 22 (3.4%) |
| 35 to 64 Years | 325 (33.8%) | 135 (11.8%) |
| 65 to 74 Years | 211 (61.3%) | 108 (32.5%) |
| 75 Years and over | 69 (33.0%) | 63 (35.0%) |
Disability Class by Sex by Age in Monroeville
Disability Class: Hearing Difficulty
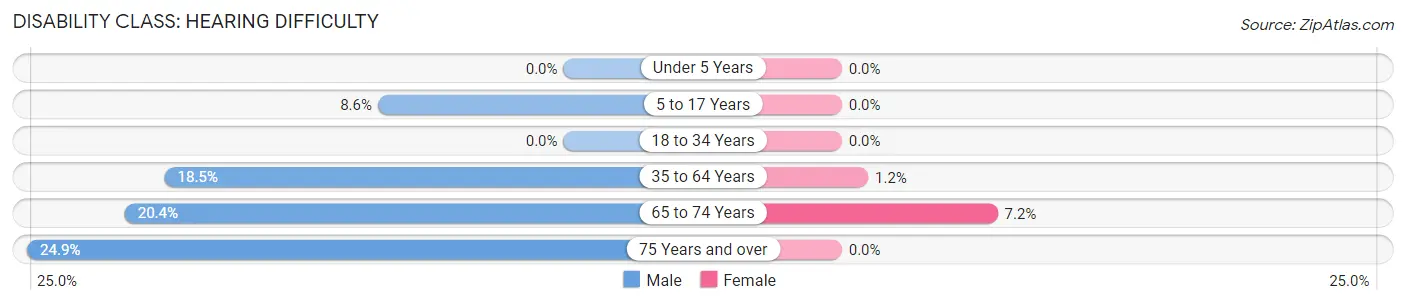
| Age Bracket | Male | Female |
| Under 5 Years | 0 (0.0%) | 0 (0.0%) |
| 5 to 17 Years | 70 (8.6%) | 0 (0.0%) |
| 18 to 34 Years | 0 (0.0%) | 0 (0.0%) |
| 35 to 64 Years | 178 (18.5%) | 14 (1.2%) |
| 65 to 74 Years | 70 (20.3%) | 24 (7.2%) |
| 75 Years and over | 52 (24.9%) | 0 (0.0%) |
Disability Class: Vision Difficulty
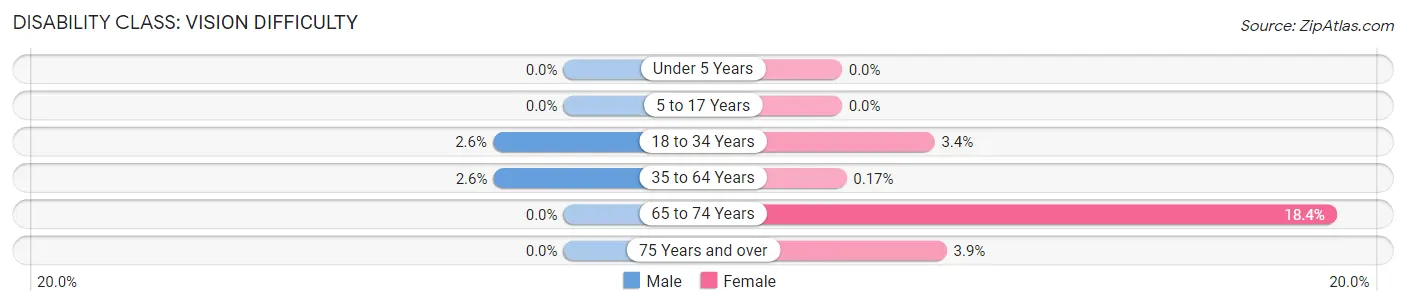
| Age Bracket | Male | Female |
| Under 5 Years | 0 (0.0%) | 0 (0.0%) |
| 5 to 17 Years | 0 (0.0%) | 0 (0.0%) |
| 18 to 34 Years | 9 (2.6%) | 22 (3.4%) |
| 35 to 64 Years | 25 (2.6%) | 2 (0.2%) |
| 65 to 74 Years | 0 (0.0%) | 61 (18.4%) |
| 75 Years and over | 0 (0.0%) | 7 (3.9%) |
Disability Class: Cognitive Difficulty
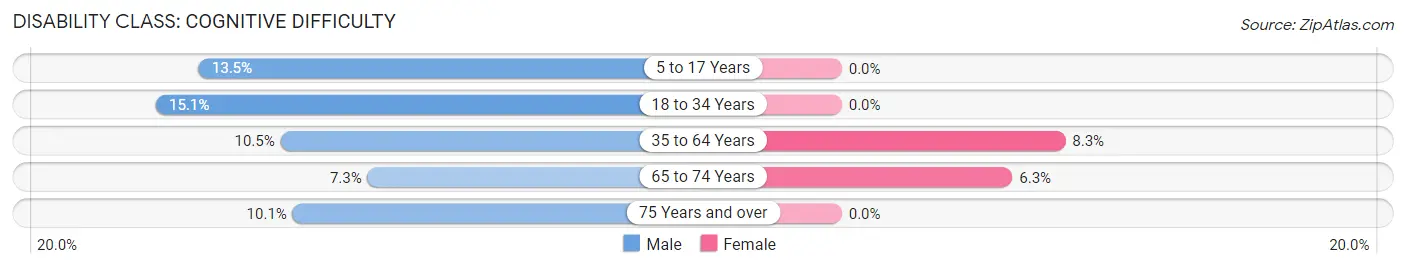
| Age Bracket | Male | Female |
| 5 to 17 Years | 110 (13.5%) | 0 (0.0%) |
| 18 to 34 Years | 52 (15.1%) | 0 (0.0%) |
| 35 to 64 Years | 101 (10.5%) | 95 (8.3%) |
| 65 to 74 Years | 25 (7.3%) | 21 (6.3%) |
| 75 Years and over | 21 (10.1%) | 0 (0.0%) |
Disability Class: Ambulatory Difficulty
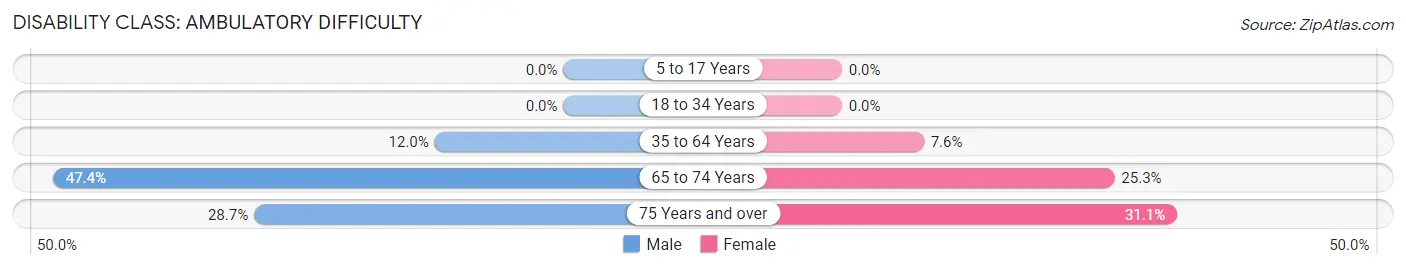
| Age Bracket | Male | Female |
| 5 to 17 Years | 0 (0.0%) | 0 (0.0%) |
| 18 to 34 Years | 0 (0.0%) | 0 (0.0%) |
| 35 to 64 Years | 115 (11.9%) | 87 (7.6%) |
| 65 to 74 Years | 163 (47.4%) | 84 (25.3%) |
| 75 Years and over | 60 (28.7%) | 56 (31.1%) |
Disability Class: Self-Care Difficulty
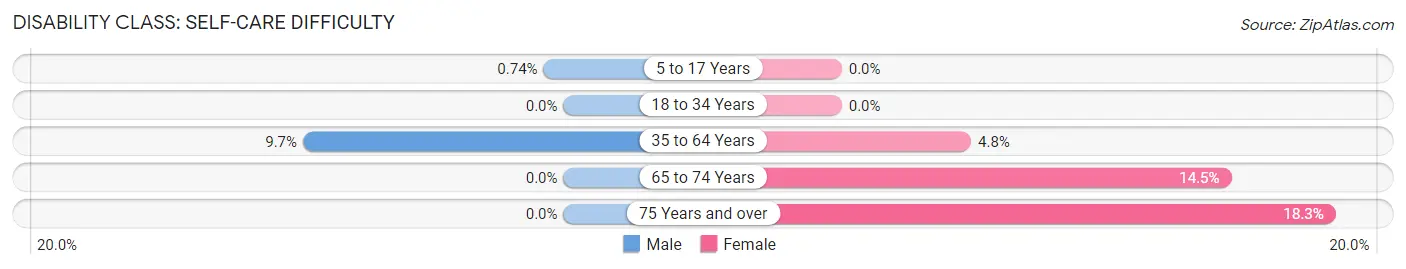
| Age Bracket | Male | Female |
| 5 to 17 Years | 6 (0.7%) | 0 (0.0%) |
| 18 to 34 Years | 0 (0.0%) | 0 (0.0%) |
| 35 to 64 Years | 93 (9.7%) | 55 (4.8%) |
| 65 to 74 Years | 0 (0.0%) | 48 (14.5%) |
| 75 Years and over | 0 (0.0%) | 33 (18.3%) |
Technology Access in Monroeville
Computing Device Access in Monroeville
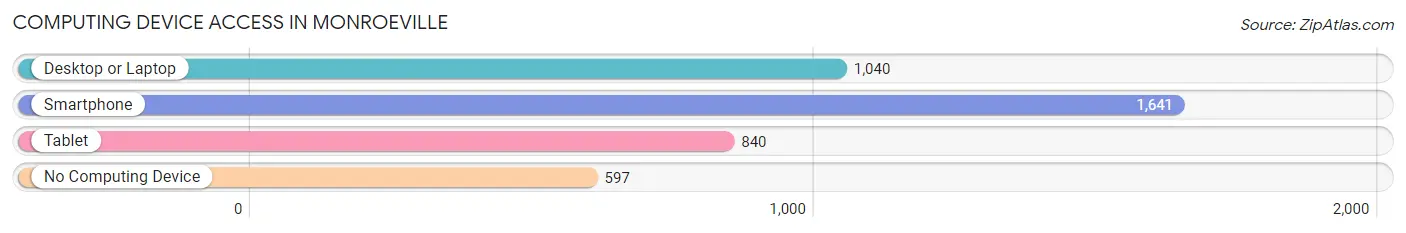
| Device Type | # Households | % Households |
| Desktop or Laptop | 1,040 | 43.7% |
| Smartphone | 1,641 | 69.0% |
| Tablet | 840 | 35.3% |
| No Computing Device | 597 | 25.1% |
| Total | 2,380 | 100.0% |
Internet Access in Monroeville
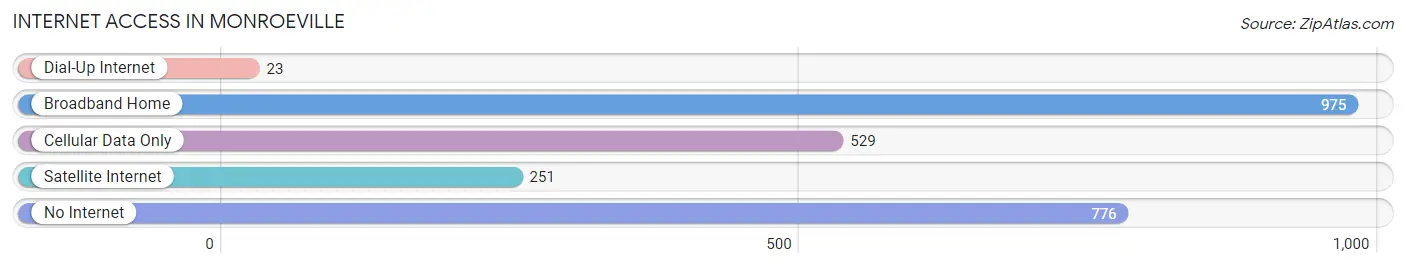
| Internet Type | # Households | % Households |
| Dial-Up Internet | 23 | 1.0% |
| Broadband Home | 975 | 41.0% |
| Cellular Data Only | 529 | 22.2% |
| Satellite Internet | 251 | 10.5% |
| No Internet | 776 | 32.6% |
| Total | 2,380 | 100.0% |
Monroeville Summary
Monroeville, Alabama is a small city located in Monroe County, Alabama. It is the county seat of Monroe County and is located in the southeastern part of the state. The city has a population of 6,519 as of the 2010 census.
History
Monroeville was founded in 1815 by settlers from Virginia and North Carolina. The city was named after James Monroe, the fifth President of the United States. The city was incorporated in 1821 and was the county seat of Monroe County.
In the early 1900s, Monroeville was a thriving agricultural center. The city was known for its cotton production and was home to several cotton mills. The city also had a thriving lumber industry.
In the 1930s, Monroeville became the home of the famous author Harper Lee. Lee wrote her Pulitzer Prize-winning novel, To Kill a Mockingbird, while living in Monroeville. The novel was set in the fictional town of Maycomb, which was based on Monroeville.
Geography
Monroeville is located in the southeastern part of Alabama, about 40 miles south of Montgomery. The city is situated on the banks of the Alabama River and is surrounded by rolling hills and forests. The city has a total area of 8.2 square miles, all of which is land.
Economy
Monroeville’s economy is largely based on agriculture and manufacturing. The city is home to several cotton mills and lumber mills. The city also has a thriving tourism industry, as it is the home of Harper Lee and the setting of her novel, To Kill a Mockingbird.
Demographics
As of the 2010 census, Monroeville had a population of 6,519. The racial makeup of the city was 57.3% White, 39.3% African American, 0.3% Native American, 0.7% Asian, 0.1% Pacific Islander, 1.2% from other races, and 1.2% from two or more races. Hispanic or Latino of any race were 2.3% of the population.
Monroeville is a small city with a diverse population. The city has a median household income of $30,945 and a poverty rate of 22.3%. The city has a high school graduation rate of 79.3%.
Monroeville is a small city with a rich history and a diverse population. The city is home to Harper Lee and the setting of her novel, To Kill a Mockingbird. The city’s economy is largely based on agriculture and manufacturing, and the city has a thriving tourism industry. Monroeville is a great place to live and work, and it is a great place to visit.
Common Questions
What is Per Capita Income in Monroeville?
Per Capita income in Monroeville is $23,256.
What is the Median Family Income in Monroeville?
Median Family Income in Monroeville is $56,806.
What is the Median Household income in Monroeville?
Median Household Income in Monroeville is $32,040.
What is Income or Wage Gap in Monroeville?
Income or Wage Gap in Monroeville is 35.9%.
Women in Monroeville earn 64.1 cents for every dollar earned by a man.
What is Inequality or Gini Index in Monroeville?
Inequality or Gini Index in Monroeville is 0.50.
What is the Total Population of Monroeville?
Total Population of Monroeville is 5,917.
What is the Total Male Population of Monroeville?
Total Male Population of Monroeville is 2,945.
What is the Total Female Population of Monroeville?
Total Female Population of Monroeville is 2,972.
What is the Ratio of Males per 100 Females in Monroeville?
There are 99.09 Males per 100 Females in Monroeville.
What is the Ratio of Females per 100 Males in Monroeville?
There are 100.92 Females per 100 Males in Monroeville.
What is the Median Population Age in Monroeville?
Median Population Age in Monroeville is 43.3 Years.
What is the Average Family Size in Monroeville
Average Family Size in Monroeville is 3.5 People.
What is the Average Household Size in Monroeville
Average Household Size in Monroeville is 2.4 People.
How Large is the Labor Force in Monroeville?
There are 2,193 People in the Labor Forcein in Monroeville.
What is the Percentage of People in the Labor Force in Monroeville?
48.0% of People are in the Labor Force in Monroeville.
What is the Unemployment Rate in Monroeville?
Unemployment Rate in Monroeville is 14.5%.