Zip Codes with the Highest Percentage of Population Employed in Security & Protection in Birmingham, AL
RELATED REPORTS & OPTIONS
Security & Protection
Birmingham
Compare Zip Codes
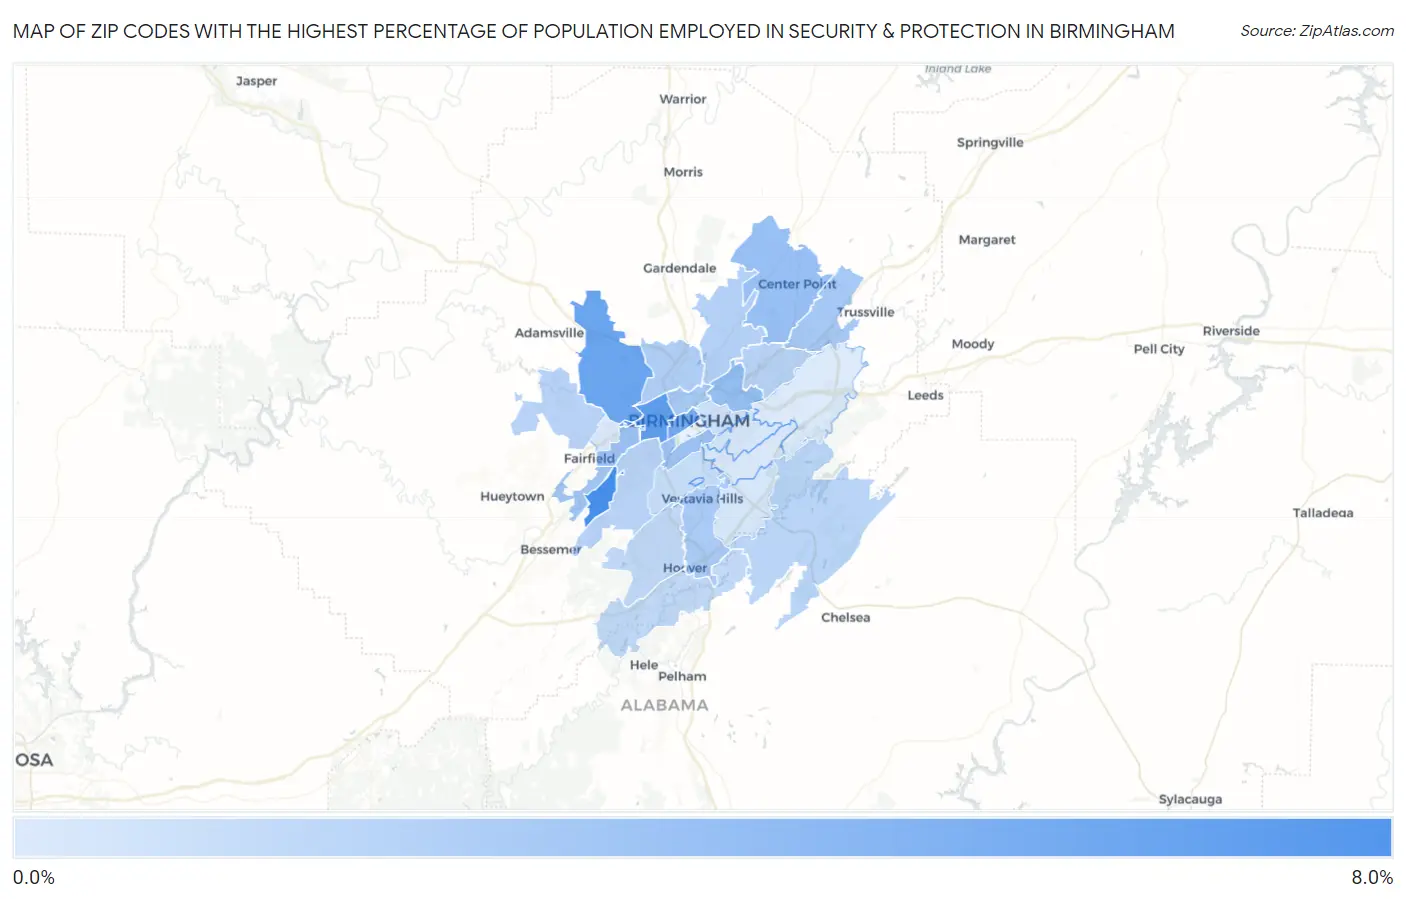
Map of Zip Codes with the Highest Percentage of Population Employed in Security & Protection in Birmingham
0.44%
6.2%
Zip Codes with the Highest Percentage of Population Employed in Security & Protection in Birmingham, AL
| Zip Code | % Employed | vs State | vs National | |
| 1. | 35221 | 6.2% | 2.3%(+3.93)#46 | 2.1%(+4.05)#1,953 |
| 2. | 35204 | 5.2% | 2.3%(+2.92)#65 | 2.1%(+3.04)#2,721 |
| 3. | 35214 | 4.8% | 2.3%(+2.49)#73 | 2.1%(+2.61)#3,231 |
| 4. | 35203 | 4.3% | 2.3%(+2.05)#90 | 2.1%(+2.17)#3,918 |
| 5. | 35212 | 3.1% | 2.3%(+0.858)#146 | 2.1%(+0.979)#6,787 |
| 6. | 35215 | 3.1% | 2.3%(+0.805)#153 | 2.1%(+0.926)#6,976 |
| 7. | 35205 | 3.0% | 2.3%(+0.715)#160 | 2.1%(+0.836)#7,291 |
| 8. | 35208 | 3.0% | 2.3%(+0.710)#161 | 2.1%(+0.831)#7,308 |
| 9. | 35228 | 2.7% | 2.3%(+0.381)#195 | 2.1%(+0.502)#8,759 |
| 10. | 35235 | 2.5% | 2.3%(+0.253)#210 | 2.1%(+0.374)#9,394 |
| 11. | 35234 | 2.4% | 2.3%(+0.159)#221 | 2.1%(+0.280)#9,911 |
| 12. | 35216 | 2.4% | 2.3%(+0.104)#227 | 2.1%(+0.225)#10,201 |
| 13. | 35207 | 2.2% | 2.3%(-0.118)#257 | 2.1%(+0.004)#11,557 |
| 14. | 35217 | 2.0% | 2.3%(-0.228)#270 | 2.1%(-0.107)#12,303 |
| 15. | 35206 | 1.8% | 2.3%(-0.468)#304 | 2.1%(-0.346)#13,927 |
| 16. | 35224 | 1.8% | 2.3%(-0.473)#305 | 2.1%(-0.352)#13,972 |
| 17. | 35211 | 1.8% | 2.3%(-0.480)#307 | 2.1%(-0.358)#14,029 |
| 18. | 35242 | 1.7% | 2.3%(-0.574)#317 | 2.1%(-0.453)#14,716 |
| 19. | 35244 | 1.5% | 2.3%(-0.775)#346 | 2.1%(-0.654)#16,251 |
| 20. | 35226 | 1.5% | 2.3%(-0.799)#347 | 2.1%(-0.678)#16,422 |
| 21. | 35209 | 1.3% | 2.3%(-0.942)#365 | 2.1%(-0.821)#17,514 |
| 22. | 35254 | 1.3% | 2.3%(-1.01)#374 | 2.1%(-0.893)#18,095 |
| 23. | 35229 | 1.2% | 2.3%(-1.12)#390 | 2.1%(-0.996)#18,876 |
| 24. | 35222 | 0.94% | 2.3%(-1.33)#418 | 2.1%(-1.21)#20,477 |
| 25. | 35213 | 0.70% | 2.3%(-1.57)#442 | 2.1%(-1.45)#22,108 |
| 26. | 35243 | 0.67% | 2.3%(-1.60)#447 | 2.1%(-1.48)#22,300 |
| 27. | 35223 | 0.57% | 2.3%(-1.70)#458 | 2.1%(-1.58)#22,844 |
| 28. | 35218 | 0.54% | 2.3%(-1.73)#460 | 2.1%(-1.61)#23,027 |
| 29. | 35210 | 0.44% | 2.3%(-1.83)#468 | 2.1%(-1.71)#23,559 |
1
Common Questions
What are the Top 10 Zip Codes with the Highest Percentage of Population Employed in Security & Protection in Birmingham, AL?
Top 10 Zip Codes with the Highest Percentage of Population Employed in Security & Protection in Birmingham, AL are:
What zip code has the Highest Percentage of Population Employed in Security & Protection in Birmingham, AL?
35221 has the Highest Percentage of Population Employed in Security & Protection in Birmingham, AL with 6.2%.
What is the Percentage of Population Employed in Security & Protection in Birmingham, AL?
Percentage of Population Employed in Security & Protection in Birmingham is 2.3%.
What is the Percentage of Population Employed in Security & Protection in Alabama?
Percentage of Population Employed in Security & Protection in Alabama is 2.3%.
What is the Percentage of Population Employed in Security & Protection in the United States?
Percentage of Population Employed in Security & Protection in the United States is 2.1%.