Sheffield, AL Map & Demographics
Sheffield Map
Sheffield Overview
$26,627
PER CAPITA INCOME
$61,923
AVG FAMILY INCOME
$39,666
AVG HOUSEHOLD INCOME
14.7%
WAGE / INCOME GAP [ % ]
85.3¢/ $1
WAGE / INCOME GAP [ $ ]
$11,709
FAMILY INCOME DEFICIT
0.49
INEQUALITY / GINI INDEX
9,330
TOTAL POPULATION
4,712
MALE POPULATION
4,618
FEMALE POPULATION
102.04
MALES / 100 FEMALES
98.01
FEMALES / 100 MALES
42.0
MEDIAN AGE
3.1
AVG FAMILY SIZE
2.1
AVG HOUSEHOLD SIZE
4,169
LABOR FORCE [ PEOPLE ]
54.3%
PERCENT IN LABOR FORCE
3.8%
UNEMPLOYMENT RATE
Sheffield Zip Codes
Sheffield Area Codes
Income in Sheffield
Income Overview in Sheffield
Per Capita Income in Sheffield is $26,627, while median incomes of families and households are $61,923 and $39,666 respectively.
| Characteristic | Number | Measure |
| Per Capita Income | 9,330 | $26,627 |
| Median Family Income | 2,104 | $61,923 |
| Mean Family Income | 2,104 | $74,897 |
| Median Household Income | 4,309 | $39,666 |
| Mean Household Income | 4,309 | $54,855 |
| Income Deficit | 2,104 | $11,709 |
| Wage / Income Gap (%) | 9,330 | 14.71% |
| Wage / Income Gap ($) | 9,330 | 85.29¢ per $1 |
| Gini / Inequality Index | 9,330 | 0.49 |
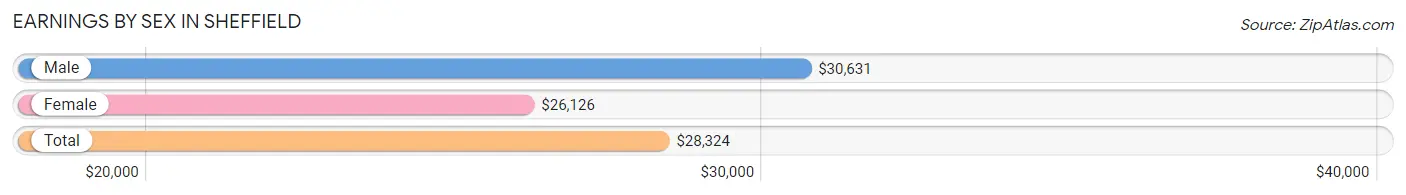
Earnings by Sex in Sheffield
Average Earnings in Sheffield are $28,324, $30,631 for men and $26,126 for women, a difference of 14.7%.
| Sex | Number | Average Earnings |
| Male | 2,260 (52.3%) | $30,631 |
| Female | 2,059 (47.7%) | $26,126 |
| Total | 4,319 (100.0%) | $28,324 |
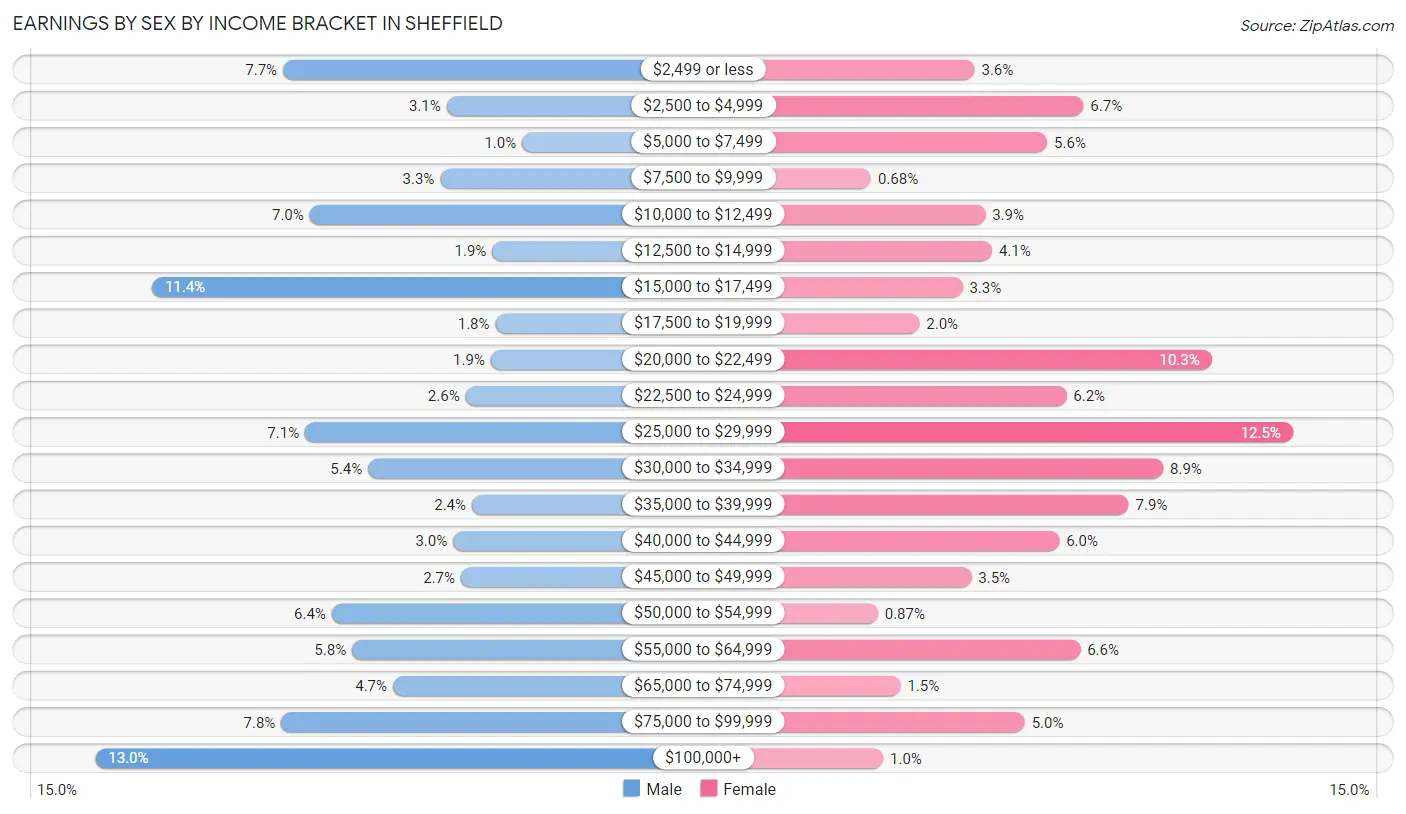
Earnings by Sex by Income Bracket in Sheffield
The most common earnings brackets in Sheffield are $100,000+ for men (294 | 13.0%) and $25,000 to $29,999 for women (258 | 12.5%).
| Income | Male | Female |
| $2,499 or less | 175 (7.7%) | 74 (3.6%) |
| $2,500 to $4,999 | 71 (3.1%) | 137 (6.7%) |
| $5,000 to $7,499 | 23 (1.0%) | 116 (5.6%) |
| $7,500 to $9,999 | 75 (3.3%) | 14 (0.7%) |
| $10,000 to $12,499 | 158 (7.0%) | 80 (3.9%) |
| $12,500 to $14,999 | 42 (1.9%) | 84 (4.1%) |
| $15,000 to $17,499 | 258 (11.4%) | 67 (3.3%) |
| $17,500 to $19,999 | 40 (1.8%) | 42 (2.0%) |
| $20,000 to $22,499 | 43 (1.9%) | 211 (10.2%) |
| $22,500 to $24,999 | 59 (2.6%) | 127 (6.2%) |
| $25,000 to $29,999 | 161 (7.1%) | 258 (12.5%) |
| $30,000 to $34,999 | 121 (5.3%) | 183 (8.9%) |
| $35,000 to $39,999 | 55 (2.4%) | 163 (7.9%) |
| $40,000 to $44,999 | 67 (3.0%) | 123 (6.0%) |
| $45,000 to $49,999 | 62 (2.7%) | 72 (3.5%) |
| $50,000 to $54,999 | 144 (6.4%) | 18 (0.9%) |
| $55,000 to $64,999 | 131 (5.8%) | 135 (6.6%) |
| $65,000 to $74,999 | 105 (4.6%) | 31 (1.5%) |
| $75,000 to $99,999 | 176 (7.8%) | 103 (5.0%) |
| $100,000+ | 294 (13.0%) | 21 (1.0%) |
| Total | 2,260 (100.0%) | 2,059 (100.0%) |
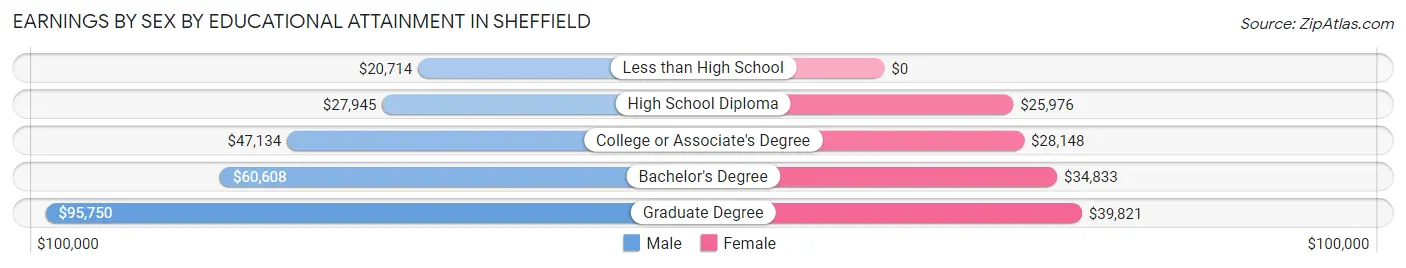
Earnings by Sex by Educational Attainment in Sheffield
Average earnings in Sheffield are $40,372 for men and $28,474 for women, a difference of 29.5%. Men with an educational attainment of graduate degree enjoy the highest average annual earnings of $95,750, while those with less than high school education earn the least with $20,714. Women with an educational attainment of graduate degree earn the most with the average annual earnings of $39,821, while those with high school diploma education have the smallest earnings of $25,976.
| Educational Attainment | Male Income | Female Income |
| Less than High School | $20,714 | $0 |
| High School Diploma | $27,945 | $25,976 |
| College or Associate's Degree | $47,134 | $28,148 |
| Bachelor's Degree | $60,608 | $34,833 |
| Graduate Degree | $95,750 | $39,821 |
| Total | $40,372 | $28,474 |
Family Income in Sheffield
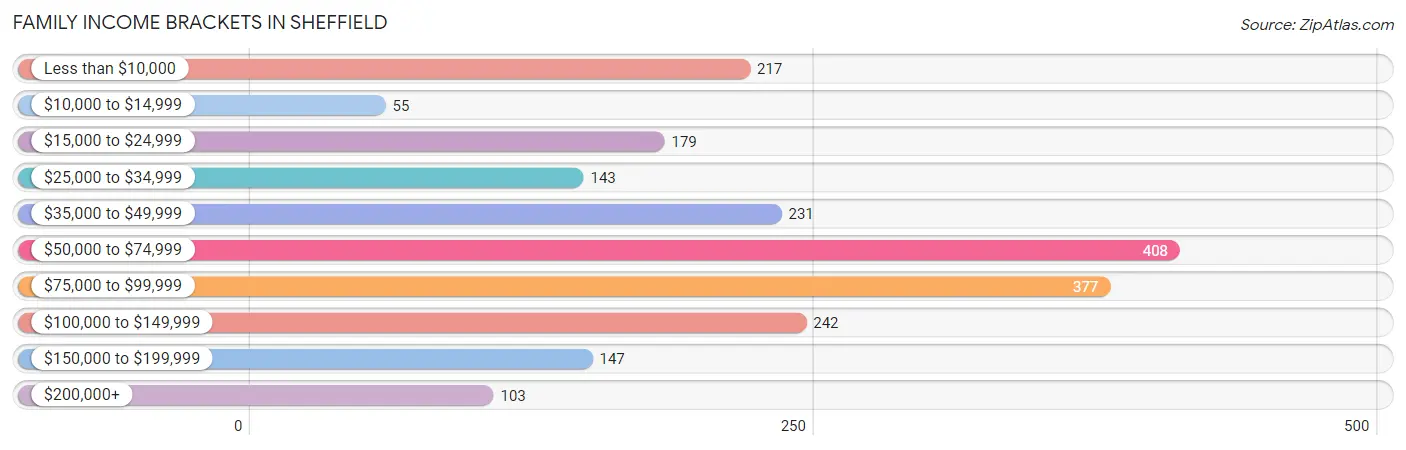
Family Income Brackets in Sheffield
According to the Sheffield family income data, there are 408 families falling into the $50,000 to $74,999 income range, which is the most common income bracket and makes up 19.4% of all families. Conversely, the $10,000 to $14,999 income bracket is the least frequent group with only 55 families (2.6%) belonging to this category.
| Income Bracket | # Families | % Families |
| Less than $10,000 | 217 | 10.3% |
| $10,000 to $14,999 | 55 | 2.6% |
| $15,000 to $24,999 | 179 | 8.5% |
| $25,000 to $34,999 | 143 | 6.8% |
| $35,000 to $49,999 | 231 | 11.0% |
| $50,000 to $74,999 | 408 | 19.4% |
| $75,000 to $99,999 | 377 | 17.9% |
| $100,000 to $149,999 | 242 | 11.5% |
| $150,000 to $199,999 | 147 | 7.0% |
| $200,000+ | 103 | 4.9% |
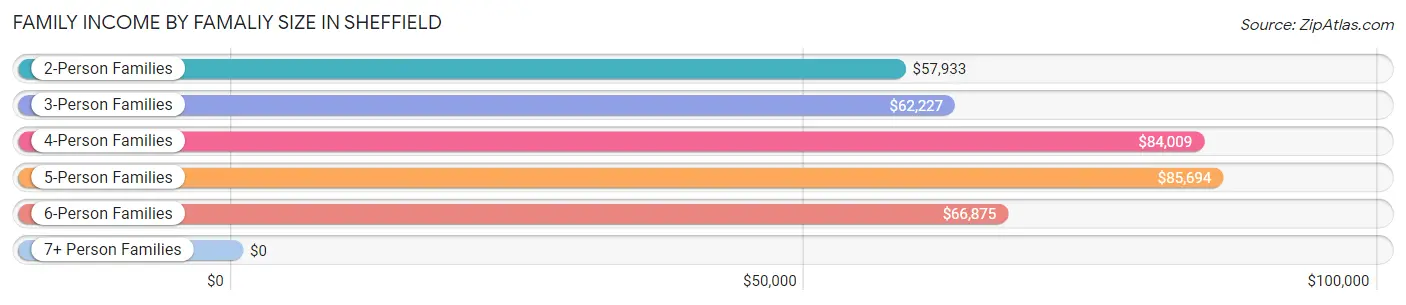
Family Income by Famaliy Size in Sheffield
5-person families (87 | 4.1%) account for the highest median family income in Sheffield with $85,694 per family, while 2-person families (1,120 | 53.2%) have the highest median income of $28,966 per family member.
| Income Bracket | # Families | Median Income |
| 2-Person Families | 1,120 (53.2%) | $57,933 |
| 3-Person Families | 469 (22.3%) | $62,227 |
| 4-Person Families | 375 (17.8%) | $84,009 |
| 5-Person Families | 87 (4.1%) | $85,694 |
| 6-Person Families | 41 (1.9%) | $66,875 |
| 7+ Person Families | 12 (0.6%) | $0 |
| Total | 2,104 (100.0%) | $61,923 |
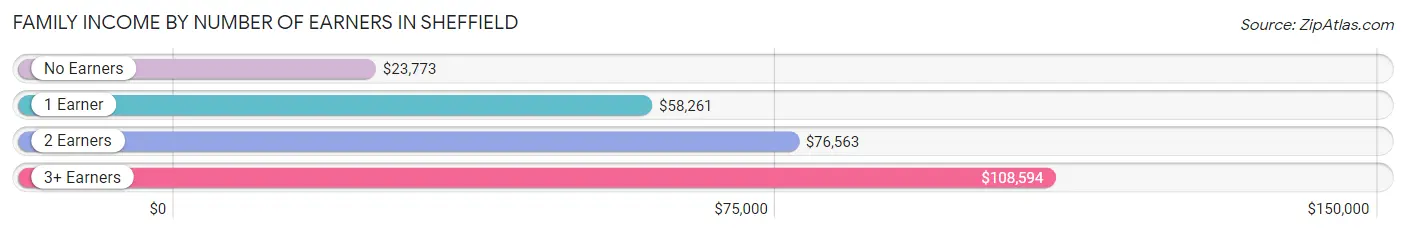
Family Income by Number of Earners in Sheffield
The median family income in Sheffield is $61,923, with families comprising 3+ earners (213) having the highest median family income of $108,594, while families with no earners (533) have the lowest median family income of $23,773, accounting for 10.1% and 25.3% of families, respectively.
| Number of Earners | # Families | Median Income |
| No Earners | 533 (25.3%) | $23,773 |
| 1 Earner | 710 (33.8%) | $58,261 |
| 2 Earners | 648 (30.8%) | $76,563 |
| 3+ Earners | 213 (10.1%) | $108,594 |
| Total | 2,104 (100.0%) | $61,923 |
Household Income in Sheffield
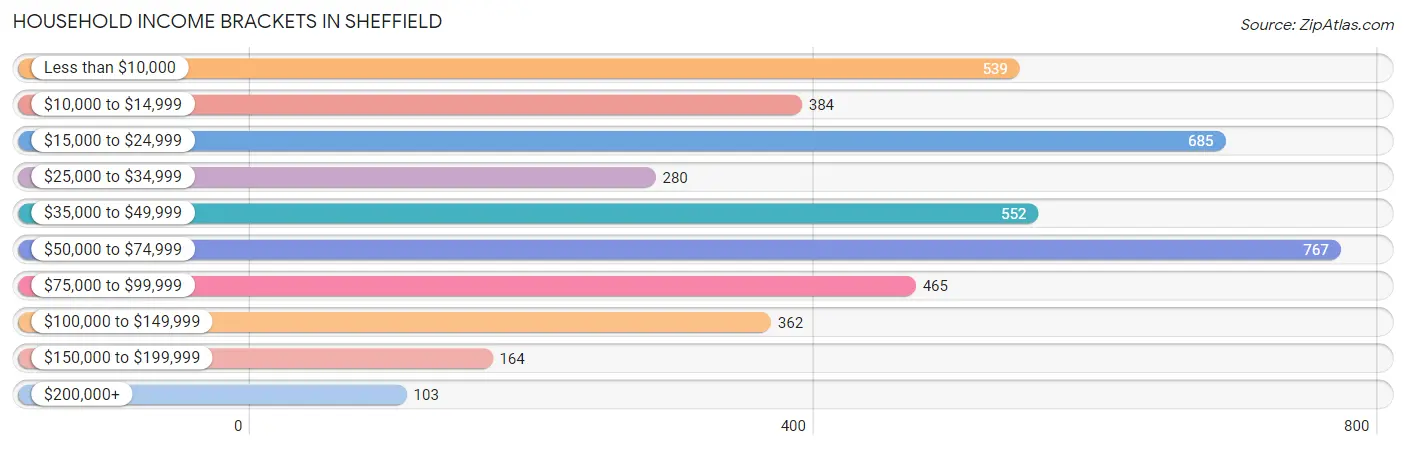
Household Income Brackets in Sheffield
With 767 households falling in the category, the $50,000 to $74,999 income range is the most frequent in Sheffield, accounting for 17.8% of all households. In contrast, only 103 households (2.4%) fall into the $200,000+ income bracket, making it the least populous group.
| Income Bracket | # Households | % Households |
| Less than $10,000 | 539 | 12.5% |
| $10,000 to $14,999 | 384 | 8.9% |
| $15,000 to $24,999 | 685 | 15.9% |
| $25,000 to $34,999 | 280 | 6.5% |
| $35,000 to $49,999 | 552 | 12.8% |
| $50,000 to $74,999 | 767 | 17.8% |
| $75,000 to $99,999 | 465 | 10.8% |
| $100,000 to $149,999 | 362 | 8.4% |
| $150,000 to $199,999 | 164 | 3.8% |
| $200,000+ | 103 | 2.4% |
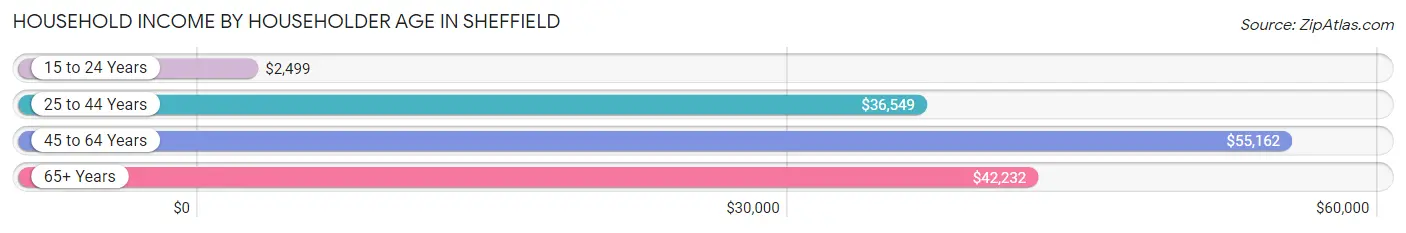
Household Income by Householder Age in Sheffield
The median household income in Sheffield is $39,666, with the highest median household income of $55,162 found in the 45 to 64 years age bracket for the primary householder. A total of 1,564 households (36.3%) fall into this category. Meanwhile, the 15 to 24 years age bracket for the primary householder has the lowest median household income of $2,499, with 299 households (6.9%) in this group.
| Income Bracket | # Households | Median Income |
| 15 to 24 Years | 299 (6.9%) | $2,499 |
| 25 to 44 Years | 1,151 (26.7%) | $36,549 |
| 45 to 64 Years | 1,564 (36.3%) | $55,162 |
| 65+ Years | 1,295 (30.0%) | $42,232 |
| Total | 4,309 (100.0%) | $39,666 |
Poverty in Sheffield
Income Below Poverty by Sex and Age in Sheffield
With 21.6% poverty level for males and 26.3% for females among the residents of Sheffield, 15 year old males and 6 to 11 year old females are the most vulnerable to poverty, with 33 males (76.7%) and 111 females (55.2%) in their respective age groups living below the poverty level.
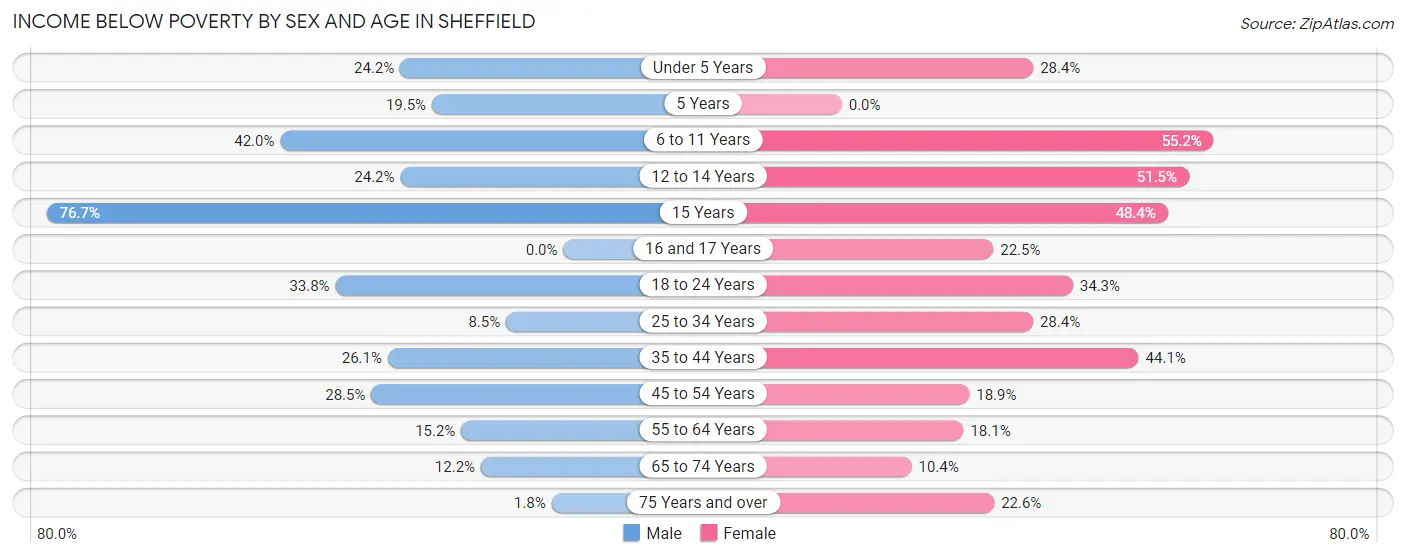
| Age Bracket | Male | Female |
| Under 5 Years | 24 (24.2%) | 54 (28.4%) |
| 5 Years | 16 (19.5%) | 0 (0.0%) |
| 6 to 11 Years | 203 (42.0%) | 111 (55.2%) |
| 12 to 14 Years | 53 (24.2%) | 84 (51.5%) |
| 15 Years | 33 (76.7%) | 15 (48.4%) |
| 16 and 17 Years | 0 (0.0%) | 9 (22.5%) |
| 18 to 24 Years | 199 (33.8%) | 129 (34.3%) |
| 25 to 34 Years | 63 (8.5%) | 134 (28.4%) |
| 35 to 44 Years | 110 (26.1%) | 268 (44.1%) |
| 45 to 54 Years | 168 (28.5%) | 113 (18.9%) |
| 55 to 64 Years | 76 (15.2%) | 131 (18.1%) |
| 65 to 74 Years | 64 (12.2%) | 70 (10.4%) |
| 75 Years and over | 6 (1.8%) | 93 (22.6%) |
| Total | 1,015 (21.6%) | 1,211 (26.3%) |
Income Above Poverty by Sex and Age in Sheffield
According to the poverty statistics in Sheffield, males aged 16 and 17 years and females aged 5 years are the age groups that are most secure financially, with 100.0% of males and 100.0% of females in these age groups living above the poverty line.
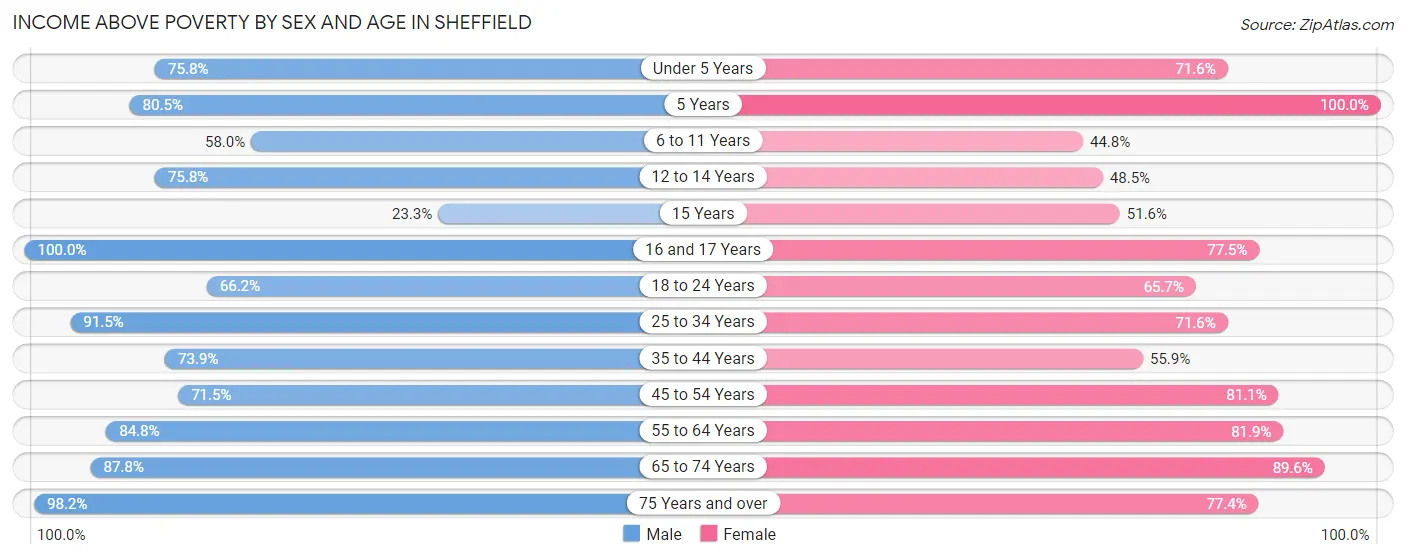
| Age Bracket | Male | Female |
| Under 5 Years | 75 (75.8%) | 136 (71.6%) |
| 5 Years | 66 (80.5%) | 120 (100.0%) |
| 6 to 11 Years | 280 (58.0%) | 90 (44.8%) |
| 12 to 14 Years | 166 (75.8%) | 79 (48.5%) |
| 15 Years | 10 (23.3%) | 16 (51.6%) |
| 16 and 17 Years | 69 (100.0%) | 31 (77.5%) |
| 18 to 24 Years | 389 (66.2%) | 247 (65.7%) |
| 25 to 34 Years | 677 (91.5%) | 338 (71.6%) |
| 35 to 44 Years | 312 (73.9%) | 340 (55.9%) |
| 45 to 54 Years | 421 (71.5%) | 484 (81.1%) |
| 55 to 64 Years | 425 (84.8%) | 594 (81.9%) |
| 65 to 74 Years | 459 (87.8%) | 605 (89.6%) |
| 75 Years and over | 334 (98.2%) | 318 (77.4%) |
| Total | 3,683 (78.4%) | 3,398 (73.7%) |
Income Below Poverty Among Married-Couple Families in Sheffield
The poverty statistics for married-couple families in Sheffield show that 3.8% or 47 of the total 1,250 families live below the poverty line. Families with no children have the highest poverty rate of 5.0%, comprising of 47 families. On the other hand, families with 1 or 2 children have the lowest poverty rate of 0.0%, which includes 0 families.
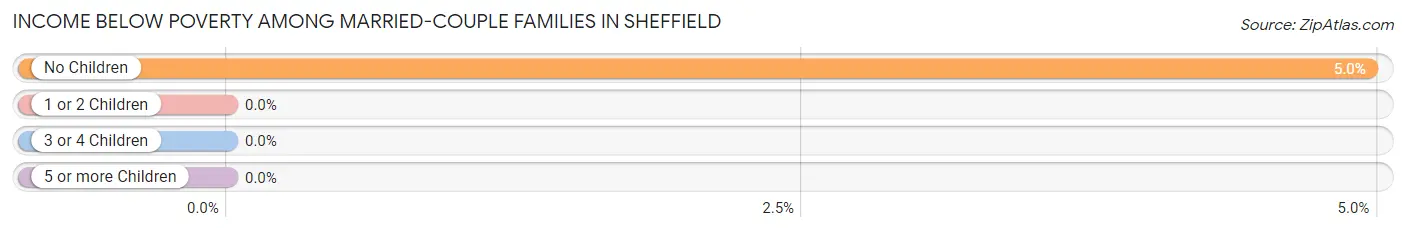
| Children | Above Poverty | Below Poverty |
| No Children | 901 (95.0%) | 47 (5.0%) |
| 1 or 2 Children | 220 (100.0%) | 0 (0.0%) |
| 3 or 4 Children | 82 (100.0%) | 0 (0.0%) |
| 5 or more Children | 0 (0.0%) | 0 (0.0%) |
| Total | 1,203 (96.2%) | 47 (3.8%) |
Income Below Poverty Among Single-Parent Households in Sheffield
According to the poverty data in Sheffield, 22.9% or 51 single-father households and 47.9% or 302 single-mother households are living below the poverty line. Among single-father households, those with no children have the highest poverty rate, with 26 households (25.2%) experiencing poverty. Likewise, among single-mother households, those with 3 or 4 children have the highest poverty rate, with 85 households (72.7%) falling below the poverty line.
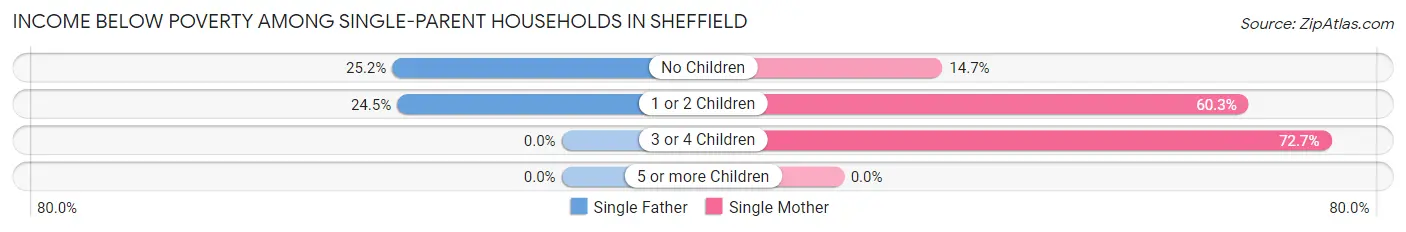
| Children | Single Father | Single Mother |
| No Children | 26 (25.2%) | 30 (14.7%) |
| 1 or 2 Children | 25 (24.5%) | 187 (60.3%) |
| 3 or 4 Children | 0 (0.0%) | 85 (72.7%) |
| 5 or more Children | 0 (0.0%) | 0 (0.0%) |
| Total | 51 (22.9%) | 302 (47.9%) |
Income Below Poverty Among Married-Couple vs Single-Parent Households in Sheffield
The poverty data for Sheffield shows that 47 of the married-couple family households (3.8%) and 353 of the single-parent households (41.3%) are living below the poverty level. Within the married-couple family households, those with no children have the highest poverty rate, with 47 households (5.0%) falling below the poverty line. Among the single-parent households, those with 3 or 4 children have the highest poverty rate, with 85 household (63.0%) living below poverty.
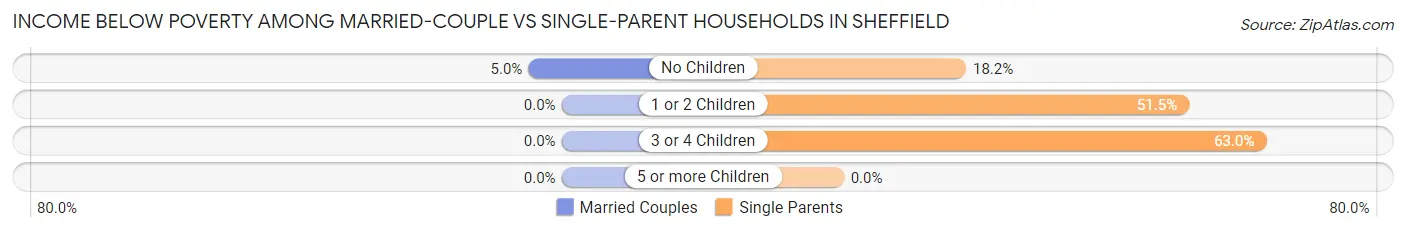
| Children | Married-Couple Families | Single-Parent Households |
| No Children | 47 (5.0%) | 56 (18.2%) |
| 1 or 2 Children | 0 (0.0%) | 212 (51.5%) |
| 3 or 4 Children | 0 (0.0%) | 85 (63.0%) |
| 5 or more Children | 0 (0.0%) | 0 (0.0%) |
| Total | 47 (3.8%) | 353 (41.3%) |
Race in Sheffield
The most populous races in Sheffield are White / Caucasian (6,636 | 71.1%), Black / African American (2,156 | 23.1%), and Two or more Races (296 | 3.2%).
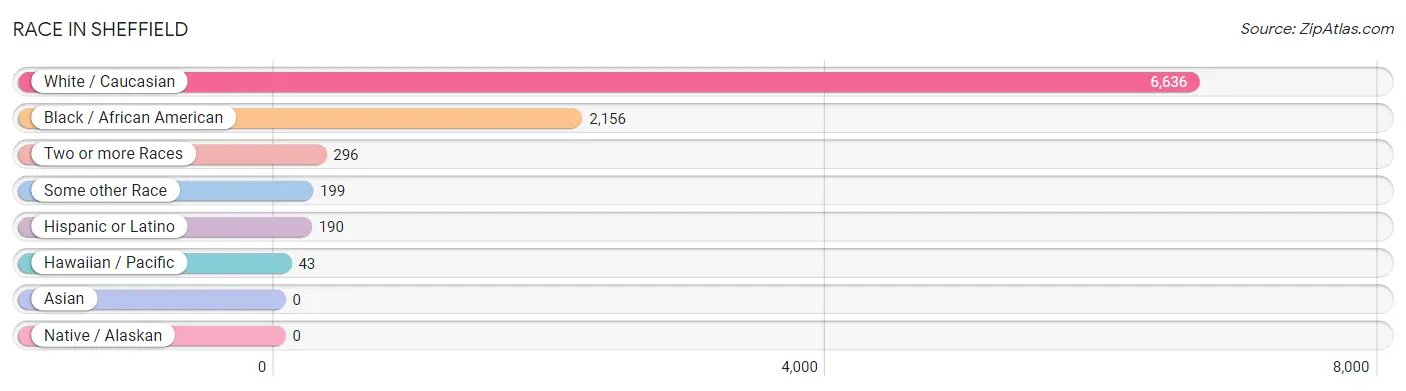
| Race | # Population | % Population |
| Asian | 0 | 0.0% |
| Black / African American | 2,156 | 23.1% |
| Hawaiian / Pacific | 43 | 0.5% |
| Hispanic or Latino | 190 | 2.0% |
| Native / Alaskan | 0 | 0.0% |
| White / Caucasian | 6,636 | 71.1% |
| Two or more Races | 296 | 3.2% |
| Some other Race | 199 | 2.1% |
| Total | 9,330 | 100.0% |
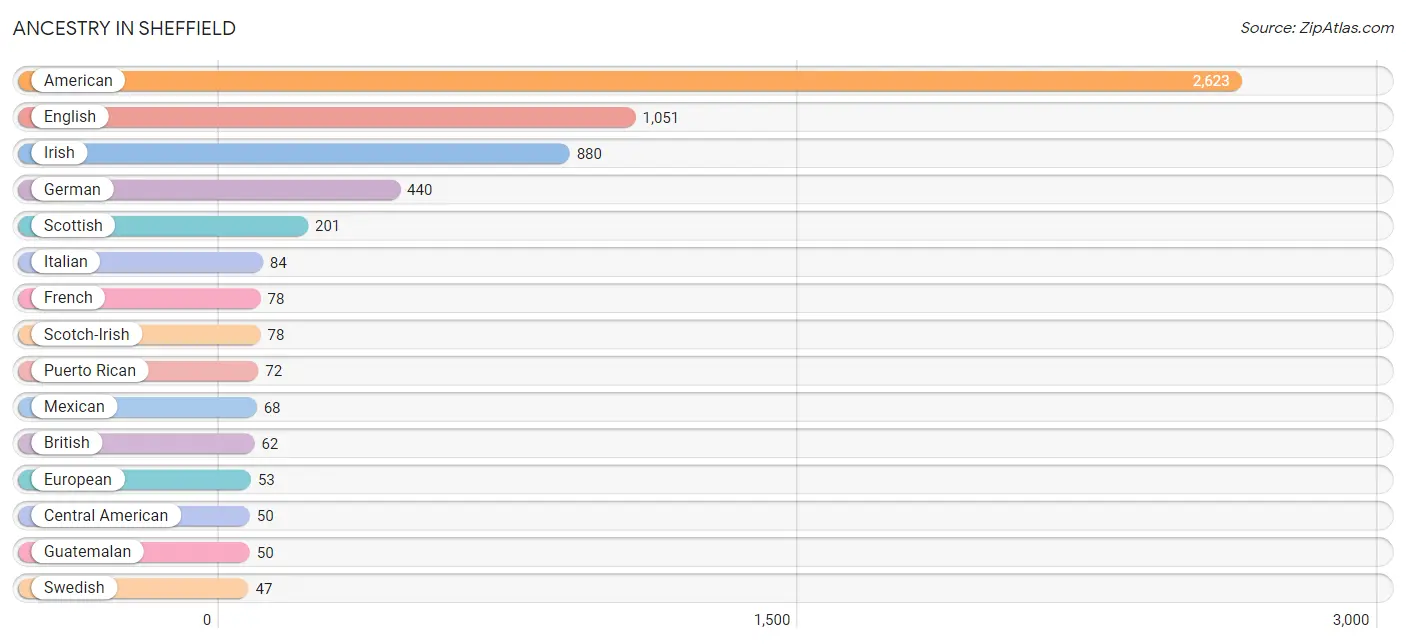
Ancestry in Sheffield
The most populous ancestries reported in Sheffield are American (2,623 | 28.1%), English (1,051 | 11.3%), Irish (880 | 9.4%), German (440 | 4.7%), and Scottish (201 | 2.1%), together accounting for 55.7% of all Sheffield residents.
| Ancestry | # Population | % Population |
| African | 29 | 0.3% |
| American | 2,623 | 28.1% |
| Austrian | 11 | 0.1% |
| Bhutanese | 15 | 0.2% |
| British | 62 | 0.7% |
| Canadian | 1 | 0.0% |
| Central American | 50 | 0.5% |
| Dutch | 45 | 0.5% |
| English | 1,051 | 11.3% |
| European | 53 | 0.6% |
| French | 78 | 0.8% |
| German | 440 | 4.7% |
| Greek | 6 | 0.1% |
| Guamanian / Chamorro | 21 | 0.2% |
| Guatemalan | 50 | 0.5% |
| Irish | 880 | 9.4% |
| Italian | 84 | 0.9% |
| Korean | 16 | 0.2% |
| Lithuanian | 11 | 0.1% |
| Mexican | 68 | 0.7% |
| Native Hawaiian | 37 | 0.4% |
| Navajo | 9 | 0.1% |
| Northern European | 5 | 0.1% |
| Norwegian | 6 | 0.1% |
| Pennsylvania German | 10 | 0.1% |
| Polish | 34 | 0.4% |
| Puerto Rican | 72 | 0.8% |
| Scotch-Irish | 78 | 0.8% |
| Scottish | 201 | 2.1% |
| Subsaharan African | 29 | 0.3% |
| Swedish | 47 | 0.5% |
| Swiss | 31 | 0.3% |
| Thai | 3 | 0.0% |
| Welsh | 42 | 0.4% |
| Yugoslavian | 14 | 0.2% | View All 35 Rows |
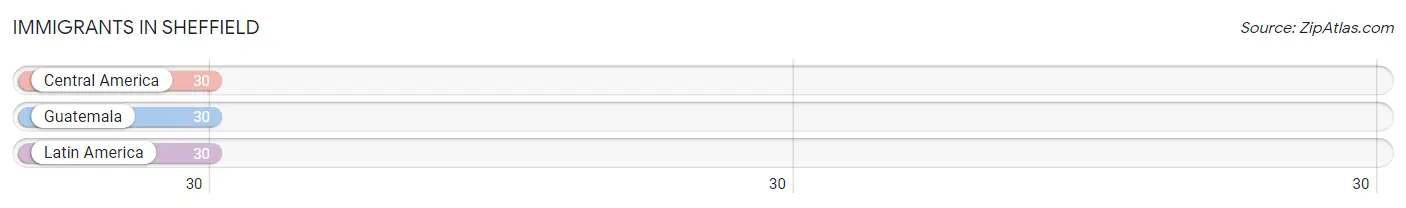
Immigrants in Sheffield
The most numerous immigrant groups reported in Sheffield came from Central America (30 | 0.3%), Guatemala (30 | 0.3%), and Latin America (30 | 0.3%), together accounting for 1.0% of all Sheffield residents.
| Immigration Origin | # Population | % Population |
| Central America | 30 | 0.3% |
| Guatemala | 30 | 0.3% |
| Latin America | 30 | 0.3% | View All 3 Rows |
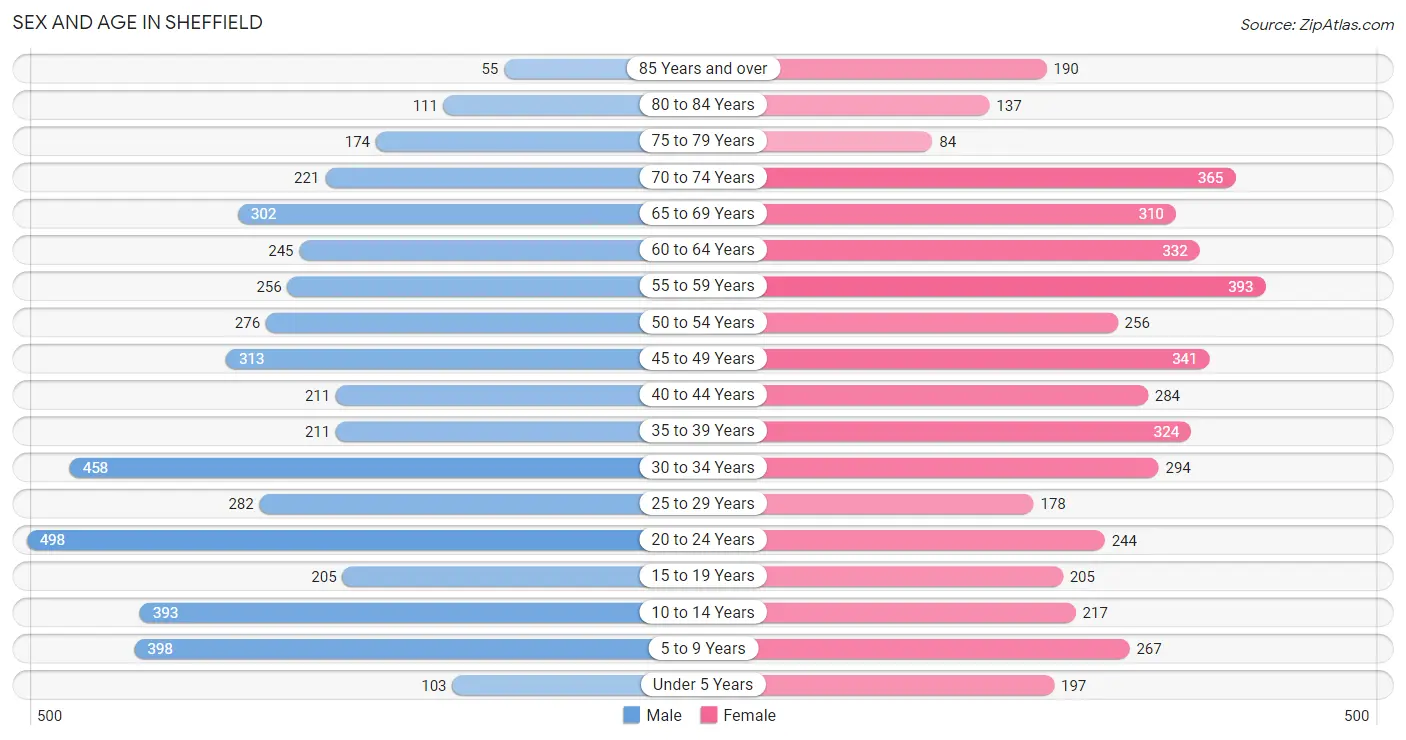
Sex and Age in Sheffield
Sex and Age in Sheffield
The most populous age groups in Sheffield are 20 to 24 Years (498 | 10.6%) for men and 55 to 59 Years (393 | 8.5%) for women.
| Age Bracket | Male | Female |
| Under 5 Years | 103 (2.2%) | 197 (4.3%) |
| 5 to 9 Years | 398 (8.5%) | 267 (5.8%) |
| 10 to 14 Years | 393 (8.3%) | 217 (4.7%) |
| 15 to 19 Years | 205 (4.3%) | 205 (4.4%) |
| 20 to 24 Years | 498 (10.6%) | 244 (5.3%) |
| 25 to 29 Years | 282 (6.0%) | 178 (3.8%) |
| 30 to 34 Years | 458 (9.7%) | 294 (6.4%) |
| 35 to 39 Years | 211 (4.5%) | 324 (7.0%) |
| 40 to 44 Years | 211 (4.5%) | 284 (6.1%) |
| 45 to 49 Years | 313 (6.6%) | 341 (7.4%) |
| 50 to 54 Years | 276 (5.9%) | 256 (5.5%) |
| 55 to 59 Years | 256 (5.4%) | 393 (8.5%) |
| 60 to 64 Years | 245 (5.2%) | 332 (7.2%) |
| 65 to 69 Years | 302 (6.4%) | 310 (6.7%) |
| 70 to 74 Years | 221 (4.7%) | 365 (7.9%) |
| 75 to 79 Years | 174 (3.7%) | 84 (1.8%) |
| 80 to 84 Years | 111 (2.4%) | 137 (3.0%) |
| 85 Years and over | 55 (1.2%) | 190 (4.1%) |
| Total | 4,712 (100.0%) | 4,618 (100.0%) |
Families and Households in Sheffield
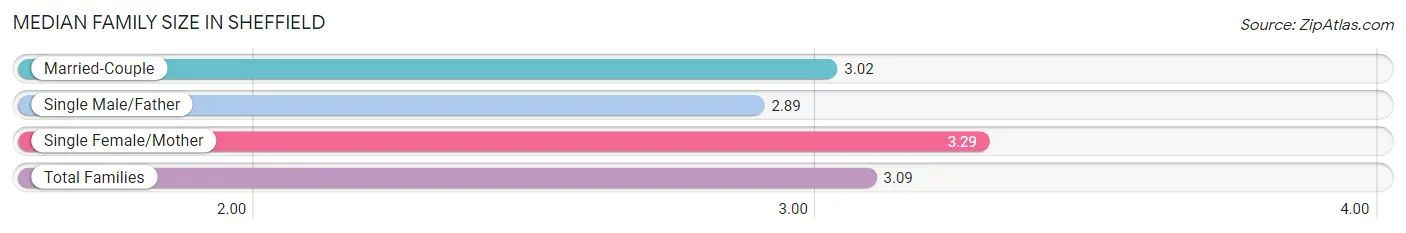
Median Family Size in Sheffield
The median family size in Sheffield is 3.09 persons per family, with single female/mother families (631 | 30.0%) accounting for the largest median family size of 3.29 persons per family. On the other hand, single male/father families (223 | 10.6%) represent the smallest median family size with 2.89 persons per family.
| Family Type | # Families | Family Size |
| Married-Couple | 1,250 (59.4%) | 3.02 |
| Single Male/Father | 223 (10.6%) | 2.89 |
| Single Female/Mother | 631 (30.0%) | 3.29 |
| Total Families | 2,104 (100.0%) | 3.09 |
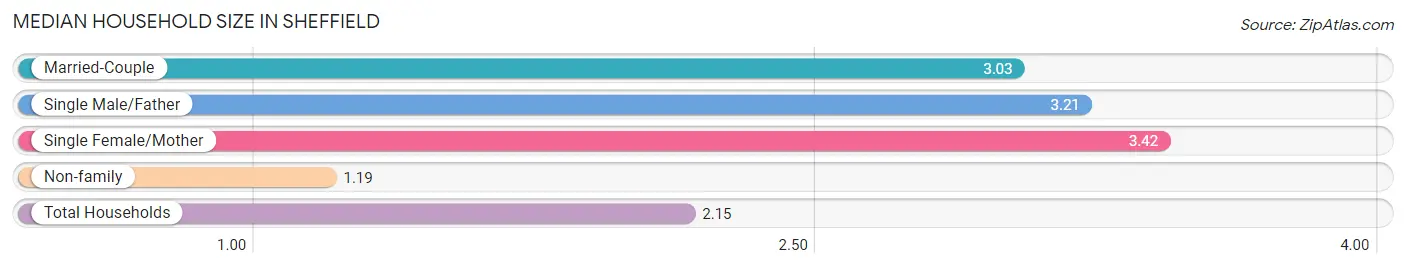
Median Household Size in Sheffield
The median household size in Sheffield is 2.15 persons per household, with single female/mother households (631 | 14.6%) accounting for the largest median household size of 3.42 persons per household. non-family households (2,205 | 51.2%) represent the smallest median household size with 1.19 persons per household.
| Household Type | # Households | Household Size |
| Married-Couple | 1,250 (29.0%) | 3.03 |
| Single Male/Father | 223 (5.2%) | 3.21 |
| Single Female/Mother | 631 (14.6%) | 3.42 |
| Non-family | 2,205 (51.2%) | 1.19 |
| Total Households | 4,309 (100.0%) | 2.15 |
Household Size by Marriage Status in Sheffield
Out of a total of 4,309 households in Sheffield, 2,104 (48.8%) are family households, while 2,205 (51.2%) are nonfamily households. The most numerous type of family households are 2-person households, comprising 1,050, and the most common type of nonfamily households are 1-person households, comprising 1,856.
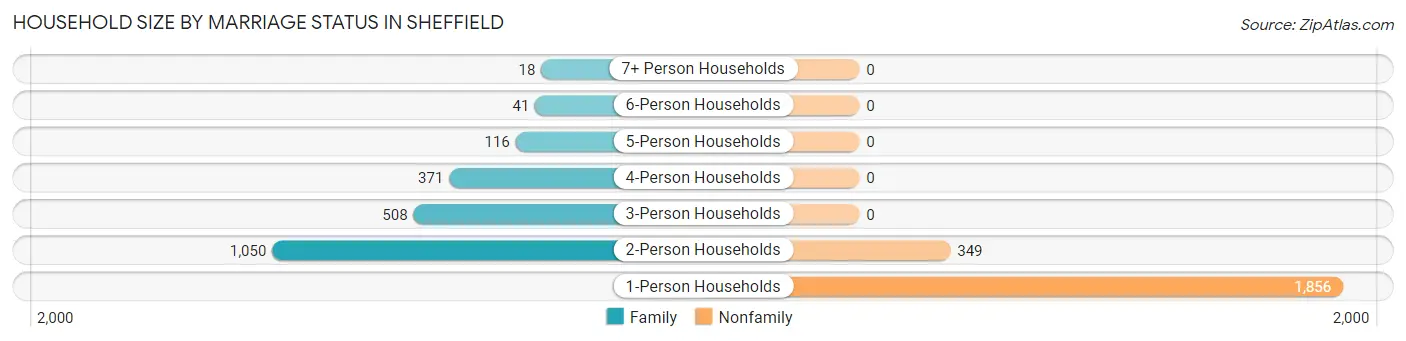
| Household Size | Family Households | Nonfamily Households |
| 1-Person Households | - | 1,856 (43.1%) |
| 2-Person Households | 1,050 (24.4%) | 349 (8.1%) |
| 3-Person Households | 508 (11.8%) | 0 (0.0%) |
| 4-Person Households | 371 (8.6%) | 0 (0.0%) |
| 5-Person Households | 116 (2.7%) | 0 (0.0%) |
| 6-Person Households | 41 (0.9%) | 0 (0.0%) |
| 7+ Person Households | 18 (0.4%) | 0 (0.0%) |
| Total | 2,104 (48.8%) | 2,205 (51.2%) |
Female Fertility in Sheffield
Fertility by Age in Sheffield
Average fertility rate in Sheffield is 38.0 births per 1,000 women. Women in the age bracket of 20 to 34 years have the highest fertility rate with 54.0 births per 1,000 women. Women in the age bracket of 20 to 34 years acount for 52.7% of all women with births.
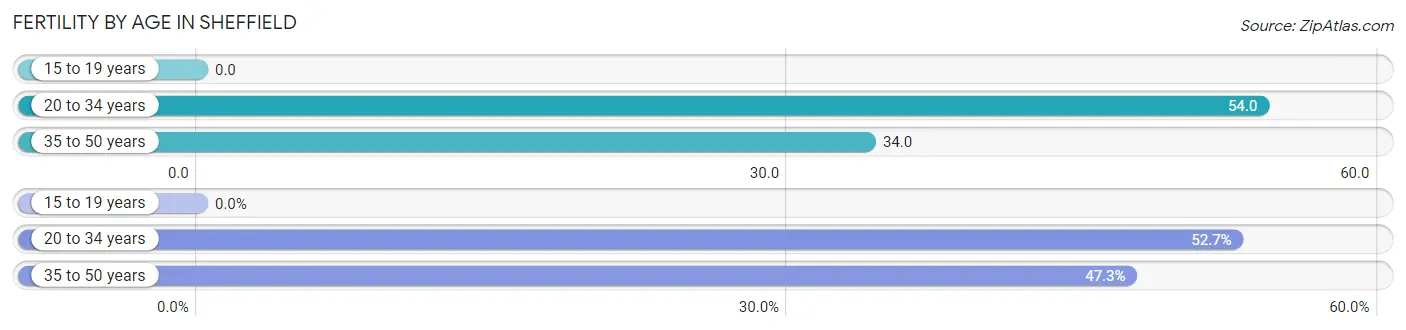
| Age Bracket | Women with Births | Births / 1,000 Women |
| 15 to 19 years | 0 (0.0%) | 0.0 |
| 20 to 34 years | 39 (52.7%) | 54.0 |
| 35 to 50 years | 35 (47.3%) | 34.0 |
| Total | 74 (100.0%) | 38.0 |
Fertility by Age by Marriage Status in Sheffield
48.6% of women with births (74) in Sheffield are married. The highest percentage of unmarried women with births falls into 20 to 34 years age bracket with 79.5% of them unmarried at the time of birth, while the lowest percentage of unmarried women with births belong to 35 to 50 years age bracket with 20.0% of them unmarried.
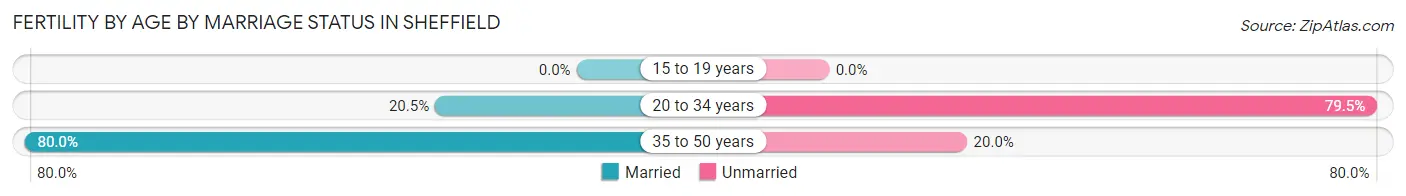
| Age Bracket | Married | Unmarried |
| 15 to 19 years | 0 (0.0%) | 0 (0.0%) |
| 20 to 34 years | 8 (20.5%) | 31 (79.5%) |
| 35 to 50 years | 28 (80.0%) | 7 (20.0%) |
| Total | 36 (48.6%) | 38 (51.3%) |
Fertility by Education in Sheffield
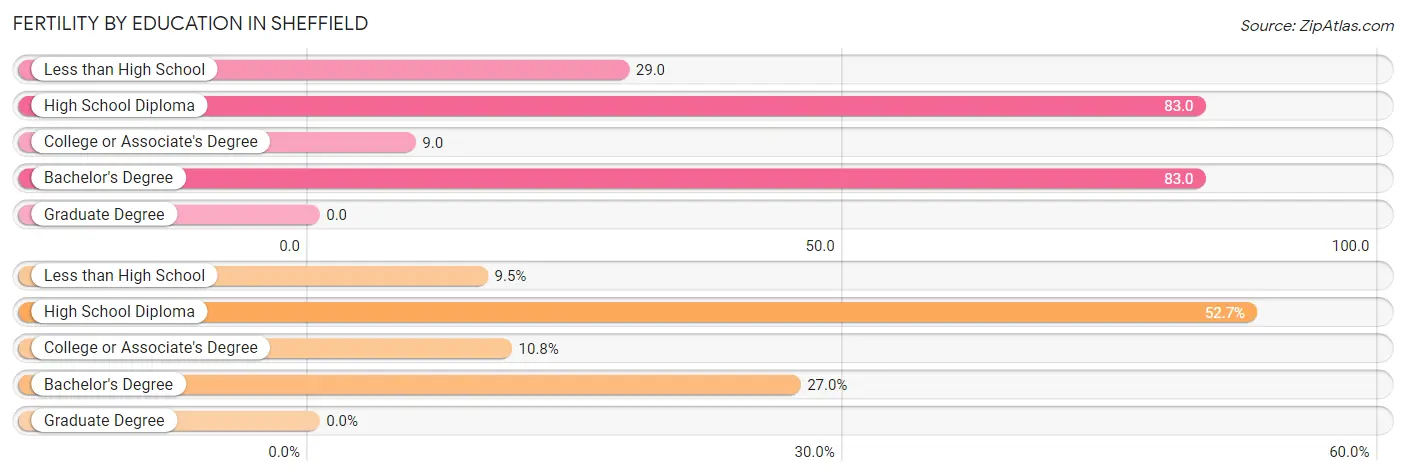
| Educational Attainment | Women with Births | Births / 1,000 Women |
| Less than High School | 7 (9.5%) | 29.0 |
| High School Diploma | 39 (52.7%) | 83.0 |
| College or Associate's Degree | 8 (10.8%) | 9.0 |
| Bachelor's Degree | 20 (27.0%) | 83.0 |
| Graduate Degree | 0 (0.0%) | 0.0 |
| Total | 74 (100.0%) | 38.0 |
Fertility by Education by Marriage Status in Sheffield
51.3% of women with births in Sheffield are unmarried. Women with the educational attainment of college or associate's degree are most likely to be married with 100.0% of them married at childbirth, while women with the educational attainment of less than high school are least likely to be married with 100.0% of them unmarried at childbirth.
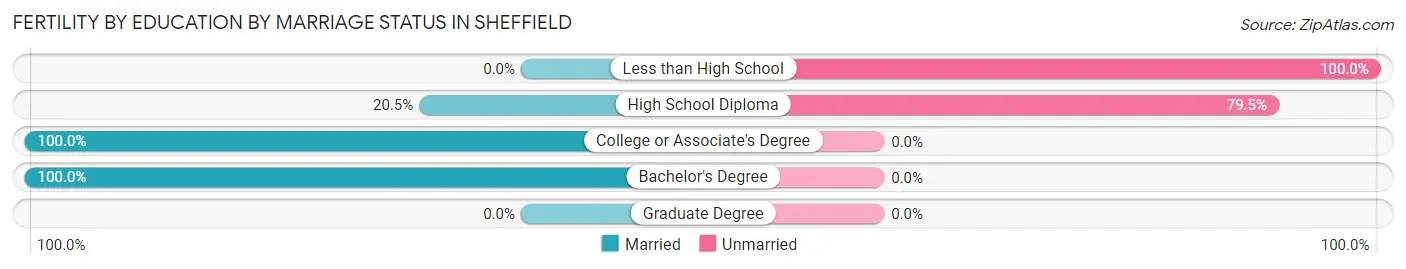
| Educational Attainment | Married | Unmarried |
| Less than High School | 0 (0.0%) | 7 (100.0%) |
| High School Diploma | 8 (20.5%) | 31 (79.5%) |
| College or Associate's Degree | 8 (100.0%) | 0 (0.0%) |
| Bachelor's Degree | 20 (100.0%) | 0 (0.0%) |
| Graduate Degree | 0 (0.0%) | 0 (0.0%) |
| Total | 36 (48.6%) | 38 (51.3%) |
Employment Characteristics in Sheffield
Employment by Class of Employer in Sheffield
Among the 3,981 employed individuals in Sheffield, private company employees (2,761 | 69.4%), not-for-profit organizations (417 | 10.5%), and local government employees (255 | 6.4%) make up the most common classes of employment.
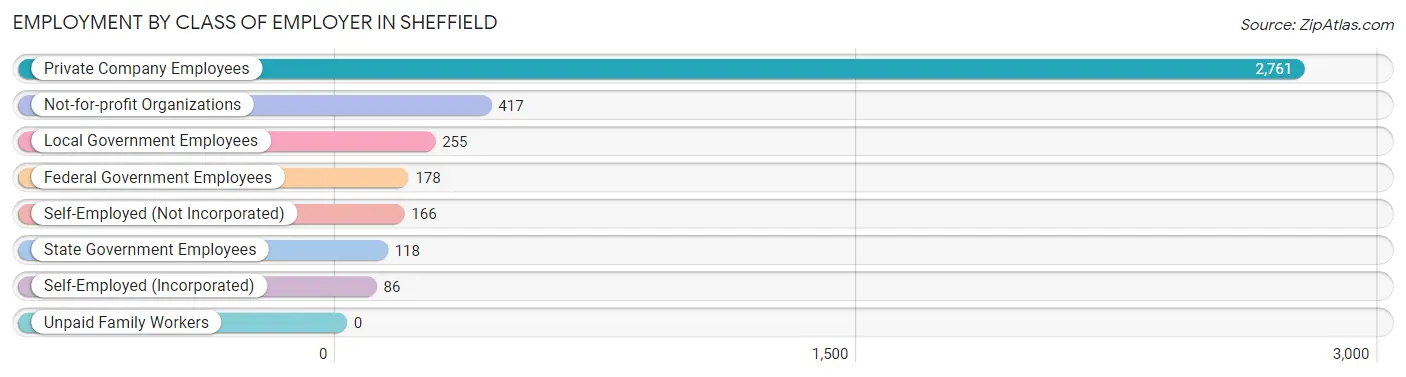
| Employer Class | # Employees | % Employees |
| Private Company Employees | 2,761 | 69.4% |
| Self-Employed (Incorporated) | 86 | 2.2% |
| Self-Employed (Not Incorporated) | 166 | 4.2% |
| Not-for-profit Organizations | 417 | 10.5% |
| Local Government Employees | 255 | 6.4% |
| State Government Employees | 118 | 3.0% |
| Federal Government Employees | 178 | 4.5% |
| Unpaid Family Workers | 0 | 0.0% |
| Total | 3,981 | 100.0% |
Employment Status by Age in Sheffield
According to the labor force statistics for Sheffield, out of the total population over 16 years of age (7,678), 54.3% or 4,169 individuals are in the labor force, with 3.8% or 158 of them unemployed. The age group with the highest labor force participation rate is 30 to 34 years, with 87.1% or 655 individuals in the labor force. Within the labor force, the 35 to 44 years age range has the highest percentage of unemployed individuals, with 9.0% or 61 of them being unemployed.
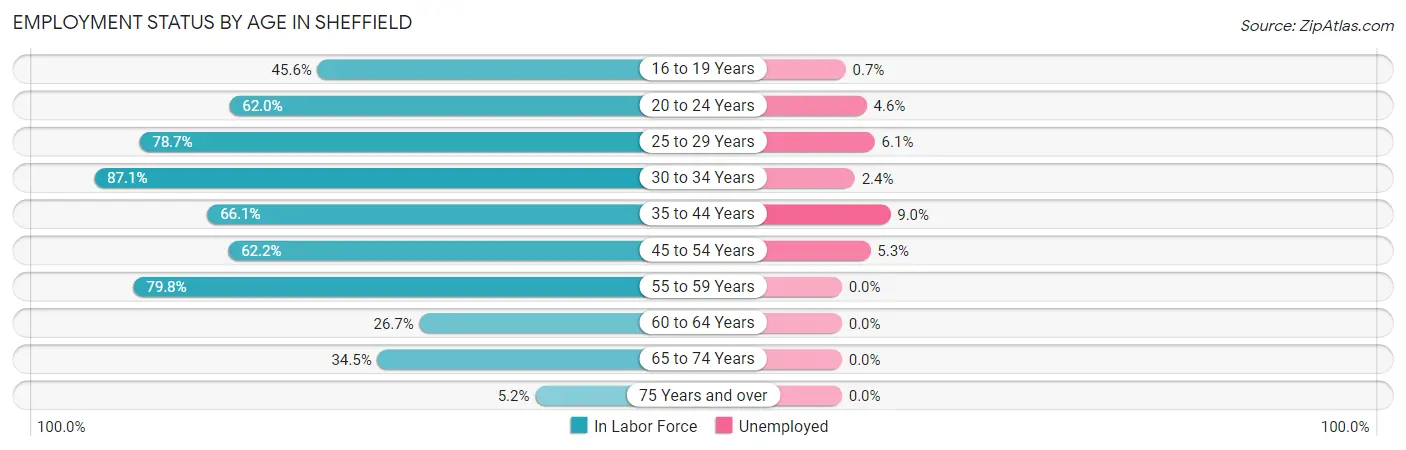
| Age Bracket | In Labor Force | Unemployed |
| 16 to 19 Years | 152 (45.6%) | 1 (0.7%) |
| 20 to 24 Years | 460 (62.0%) | 21 (4.6%) |
| 25 to 29 Years | 362 (78.7%) | 22 (6.1%) |
| 30 to 34 Years | 655 (87.1%) | 16 (2.4%) |
| 35 to 44 Years | 681 (66.1%) | 61 (9.0%) |
| 45 to 54 Years | 738 (62.2%) | 39 (5.3%) |
| 55 to 59 Years | 518 (79.8%) | 0 (0.0%) |
| 60 to 64 Years | 154 (26.7%) | 0 (0.0%) |
| 65 to 74 Years | 413 (34.5%) | 0 (0.0%) |
| 75 Years and over | 39 (5.2%) | 0 (0.0%) |
| Total | 4,169 (54.3%) | 158 (3.8%) |
Employment Status by Educational Attainment in Sheffield
According to labor force statistics for Sheffield, 66.8% of individuals (3,109) out of the total population between 25 and 64 years of age (4,654) are in the labor force, with 4.4% or 137 of them being unemployed. The group with the highest labor force participation rate are those with the educational attainment of college / associate degree, with 78.3% or 1,370 individuals in the labor force. Within the labor force, individuals with less than high school education have the highest percentage of unemployment, with 20.8% or 59 of them being unemployed.
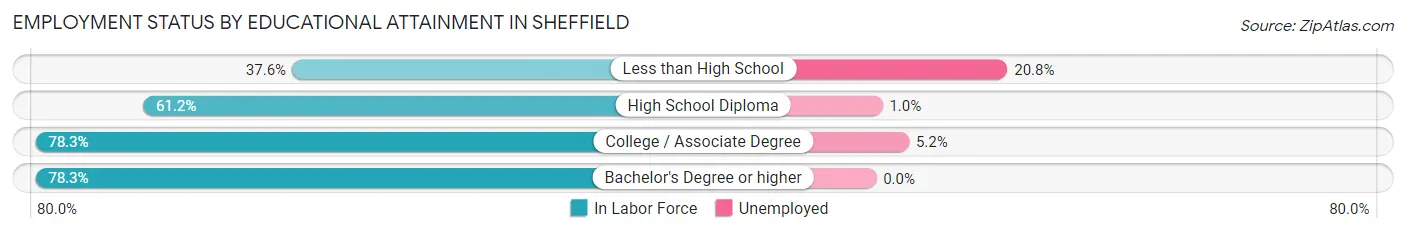
| Educational Attainment | In Labor Force | Unemployed |
| Less than High School | 283 (37.6%) | 157 (20.8%) |
| High School Diploma | 818 (61.2%) | 13 (1.0%) |
| College / Associate Degree | 1,370 (78.3%) | 91 (5.2%) |
| Bachelor's Degree or higher | 637 (78.3%) | 0 (0.0%) |
| Total | 3,109 (66.8%) | 205 (4.4%) |
Employment Occupations by Sex in Sheffield
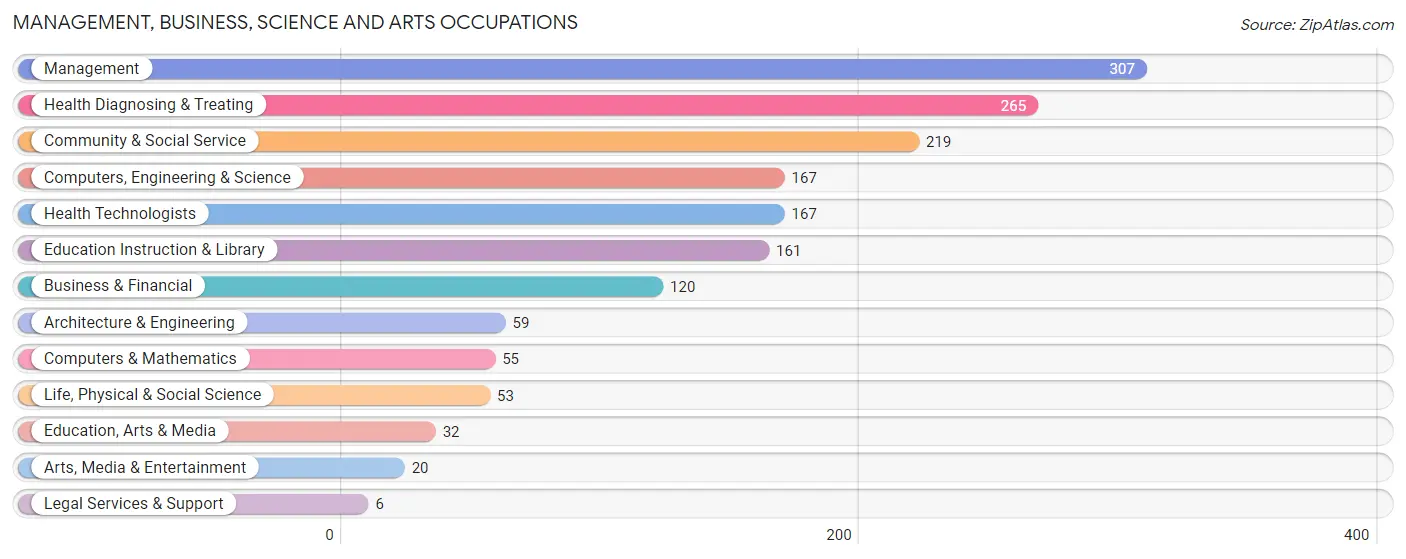
Management, Business, Science and Arts Occupations
The most common Management, Business, Science and Arts occupations in Sheffield are Management (307 | 7.6%), Health Diagnosing & Treating (265 | 6.6%), Community & Social Service (219 | 5.5%), Computers, Engineering & Science (167 | 4.2%), and Health Technologists (167 | 4.2%).
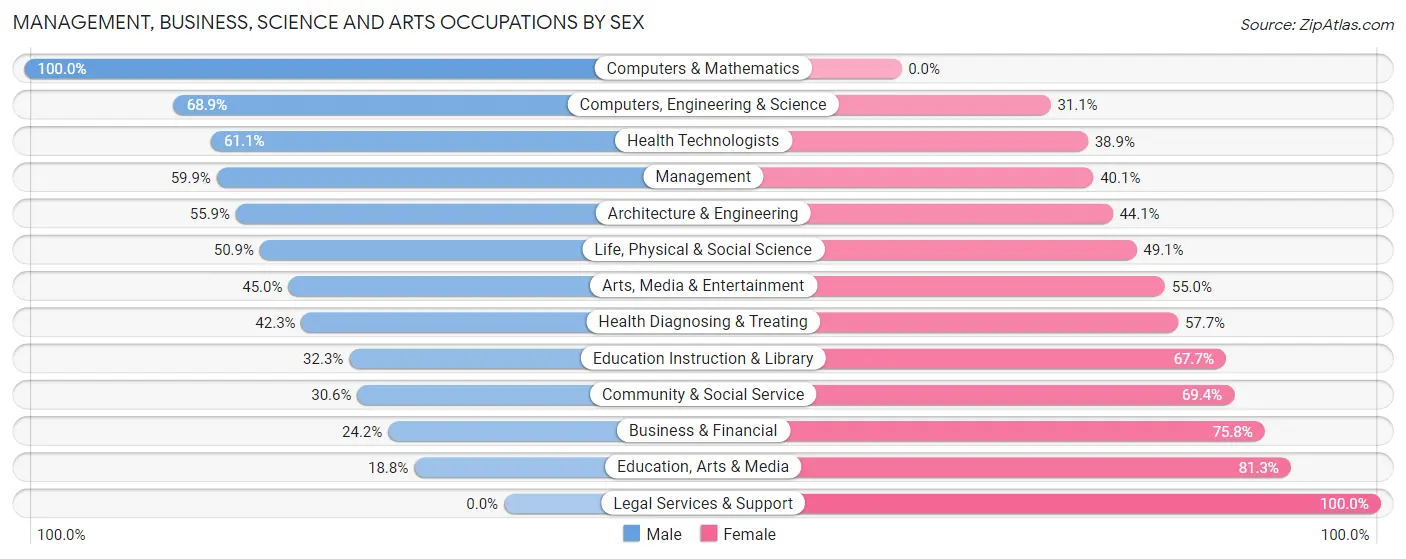
Management, Business, Science and Arts Occupations by Sex
Within the Management, Business, Science and Arts occupations in Sheffield, the most male-oriented occupations are Computers & Mathematics (100.0%), Computers, Engineering & Science (68.9%), and Health Technologists (61.1%), while the most female-oriented occupations are Legal Services & Support (100.0%), Education, Arts & Media (81.2%), and Business & Financial (75.8%).
| Occupation | Male | Female |
| Management | 184 (59.9%) | 123 (40.1%) |
| Business & Financial | 29 (24.2%) | 91 (75.8%) |
| Computers, Engineering & Science | 115 (68.9%) | 52 (31.1%) |
| Computers & Mathematics | 55 (100.0%) | 0 (0.0%) |
| Architecture & Engineering | 33 (55.9%) | 26 (44.1%) |
| Life, Physical & Social Science | 27 (50.9%) | 26 (49.1%) |
| Community & Social Service | 67 (30.6%) | 152 (69.4%) |
| Education, Arts & Media | 6 (18.8%) | 26 (81.2%) |
| Legal Services & Support | 0 (0.0%) | 6 (100.0%) |
| Education Instruction & Library | 52 (32.3%) | 109 (67.7%) |
| Arts, Media & Entertainment | 9 (45.0%) | 11 (55.0%) |
| Health Diagnosing & Treating | 112 (42.3%) | 153 (57.7%) |
| Health Technologists | 102 (61.1%) | 65 (38.9%) |
| Total (Category) | 507 (47.0%) | 571 (53.0%) |
| Total (Overall) | 2,127 (53.0%) | 1,885 (47.0%) |
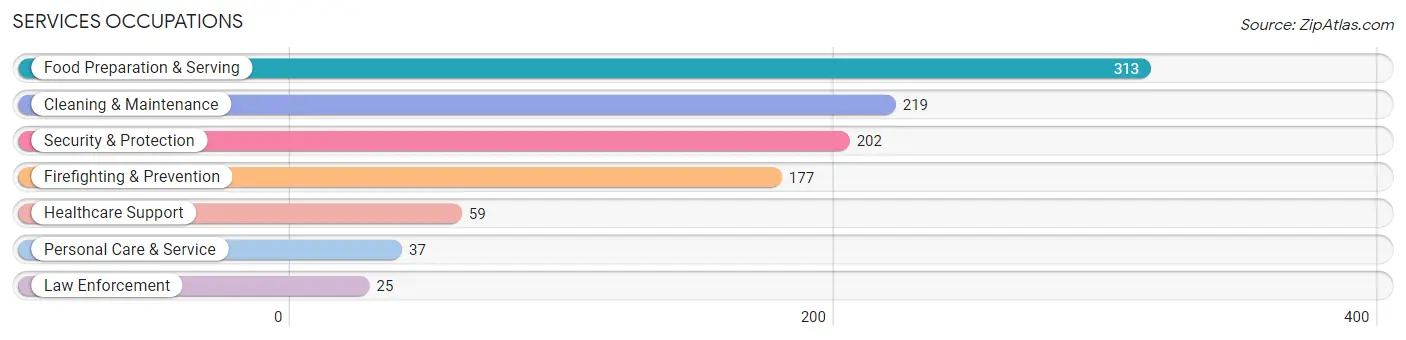
Services Occupations
The most common Services occupations in Sheffield are Food Preparation & Serving (313 | 7.8%), Cleaning & Maintenance (219 | 5.5%), Security & Protection (202 | 5.0%), Firefighting & Prevention (177 | 4.4%), and Healthcare Support (59 | 1.5%).
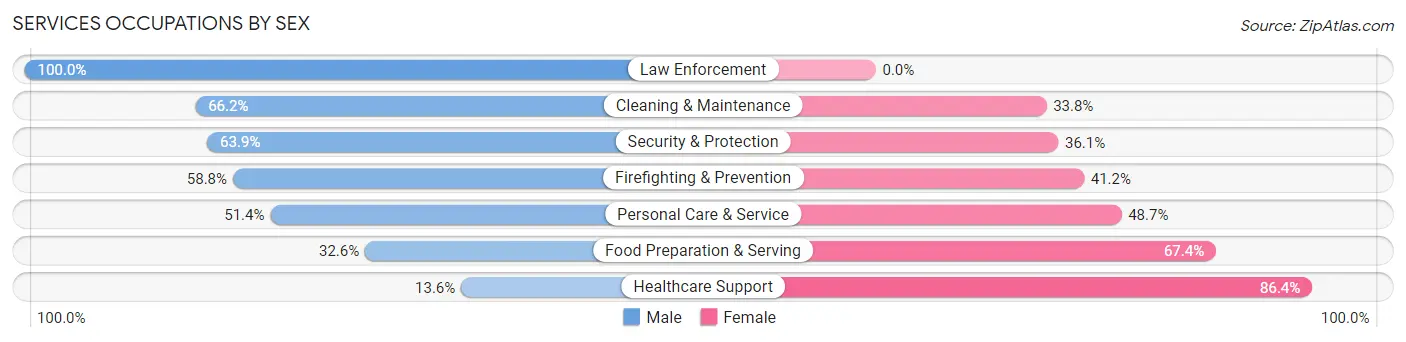
Services Occupations by Sex
Within the Services occupations in Sheffield, the most male-oriented occupations are Law Enforcement (100.0%), Cleaning & Maintenance (66.2%), and Security & Protection (63.9%), while the most female-oriented occupations are Healthcare Support (86.4%), Food Preparation & Serving (67.4%), and Personal Care & Service (48.6%).
| Occupation | Male | Female |
| Healthcare Support | 8 (13.6%) | 51 (86.4%) |
| Security & Protection | 129 (63.9%) | 73 (36.1%) |
| Firefighting & Prevention | 104 (58.8%) | 73 (41.2%) |
| Law Enforcement | 25 (100.0%) | 0 (0.0%) |
| Food Preparation & Serving | 102 (32.6%) | 211 (67.4%) |
| Cleaning & Maintenance | 145 (66.2%) | 74 (33.8%) |
| Personal Care & Service | 19 (51.3%) | 18 (48.6%) |
| Total (Category) | 403 (48.5%) | 427 (51.4%) |
| Total (Overall) | 2,127 (53.0%) | 1,885 (47.0%) |
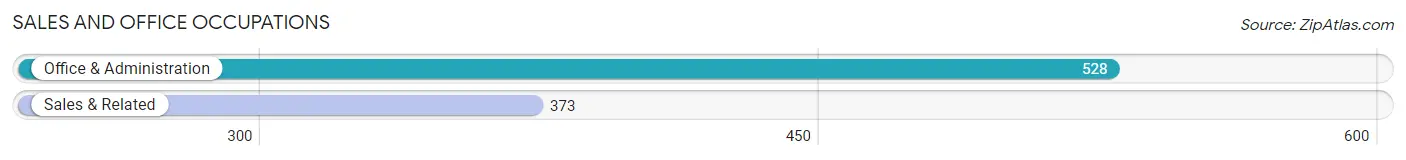
Sales and Office Occupations
The most common Sales and Office occupations in Sheffield are Office & Administration (528 | 13.2%), and Sales & Related (373 | 9.3%).
Sales and Office Occupations by Sex
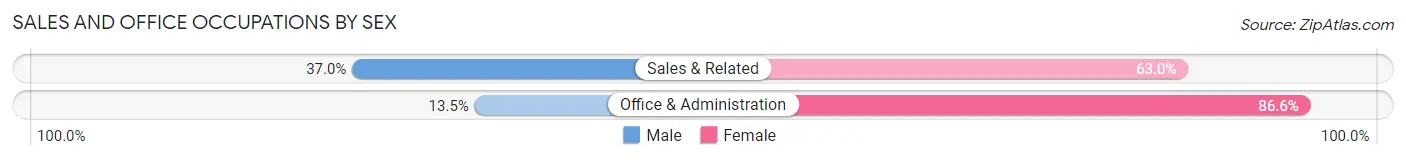
| Occupation | Male | Female |
| Sales & Related | 138 (37.0%) | 235 (63.0%) |
| Office & Administration | 71 (13.5%) | 457 (86.6%) |
| Total (Category) | 209 (23.2%) | 692 (76.8%) |
| Total (Overall) | 2,127 (53.0%) | 1,885 (47.0%) |
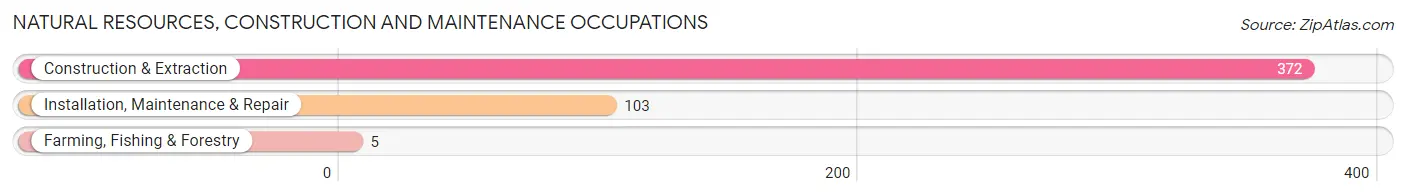
Natural Resources, Construction and Maintenance Occupations
The most common Natural Resources, Construction and Maintenance occupations in Sheffield are Construction & Extraction (372 | 9.3%), Installation, Maintenance & Repair (103 | 2.6%), and Farming, Fishing & Forestry (5 | 0.1%).
Natural Resources, Construction and Maintenance Occupations by Sex
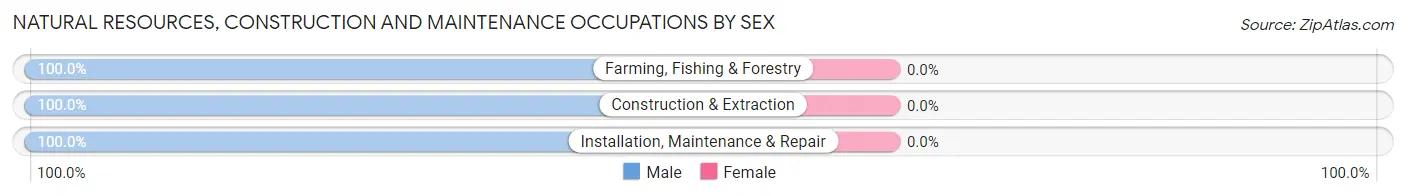
| Occupation | Male | Female |
| Farming, Fishing & Forestry | 5 (100.0%) | 0 (0.0%) |
| Construction & Extraction | 372 (100.0%) | 0 (0.0%) |
| Installation, Maintenance & Repair | 103 (100.0%) | 0 (0.0%) |
| Total (Category) | 480 (100.0%) | 0 (0.0%) |
| Total (Overall) | 2,127 (53.0%) | 1,885 (47.0%) |
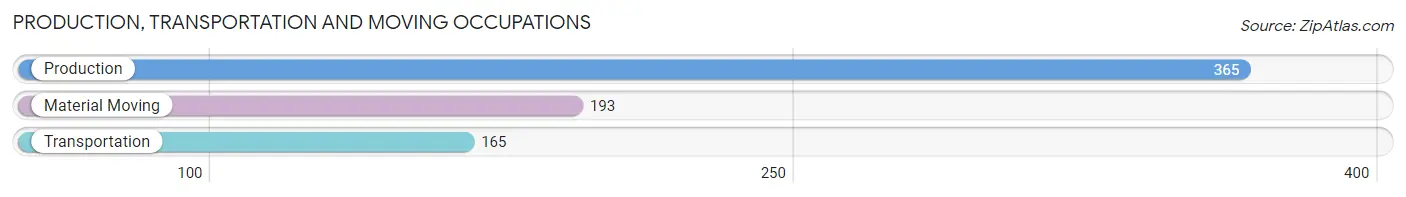
Production, Transportation and Moving Occupations
The most common Production, Transportation and Moving occupations in Sheffield are Production (365 | 9.1%), Material Moving (193 | 4.8%), and Transportation (165 | 4.1%).
Production, Transportation and Moving Occupations by Sex
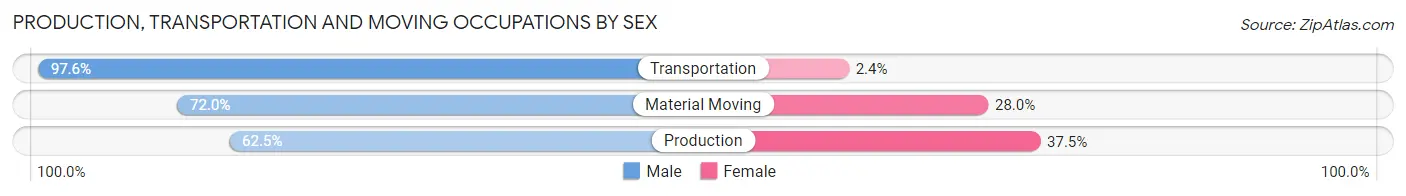
| Occupation | Male | Female |
| Production | 228 (62.5%) | 137 (37.5%) |
| Transportation | 161 (97.6%) | 4 (2.4%) |
| Material Moving | 139 (72.0%) | 54 (28.0%) |
| Total (Category) | 528 (73.0%) | 195 (27.0%) |
| Total (Overall) | 2,127 (53.0%) | 1,885 (47.0%) |
Employment Industries by Sex in Sheffield
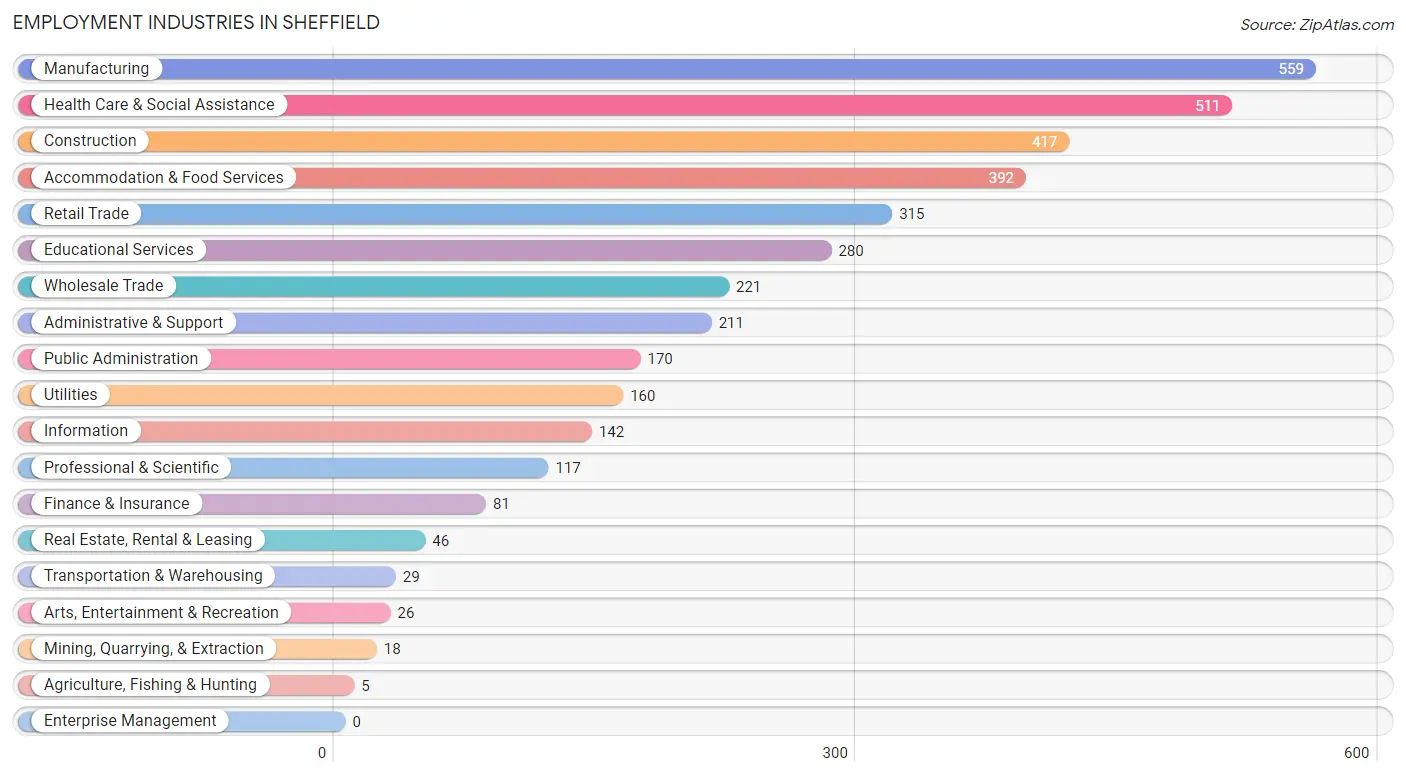
Employment Industries in Sheffield
The major employment industries in Sheffield include Manufacturing (559 | 13.9%), Health Care & Social Assistance (511 | 12.7%), Construction (417 | 10.4%), Accommodation & Food Services (392 | 9.8%), and Retail Trade (315 | 7.9%).
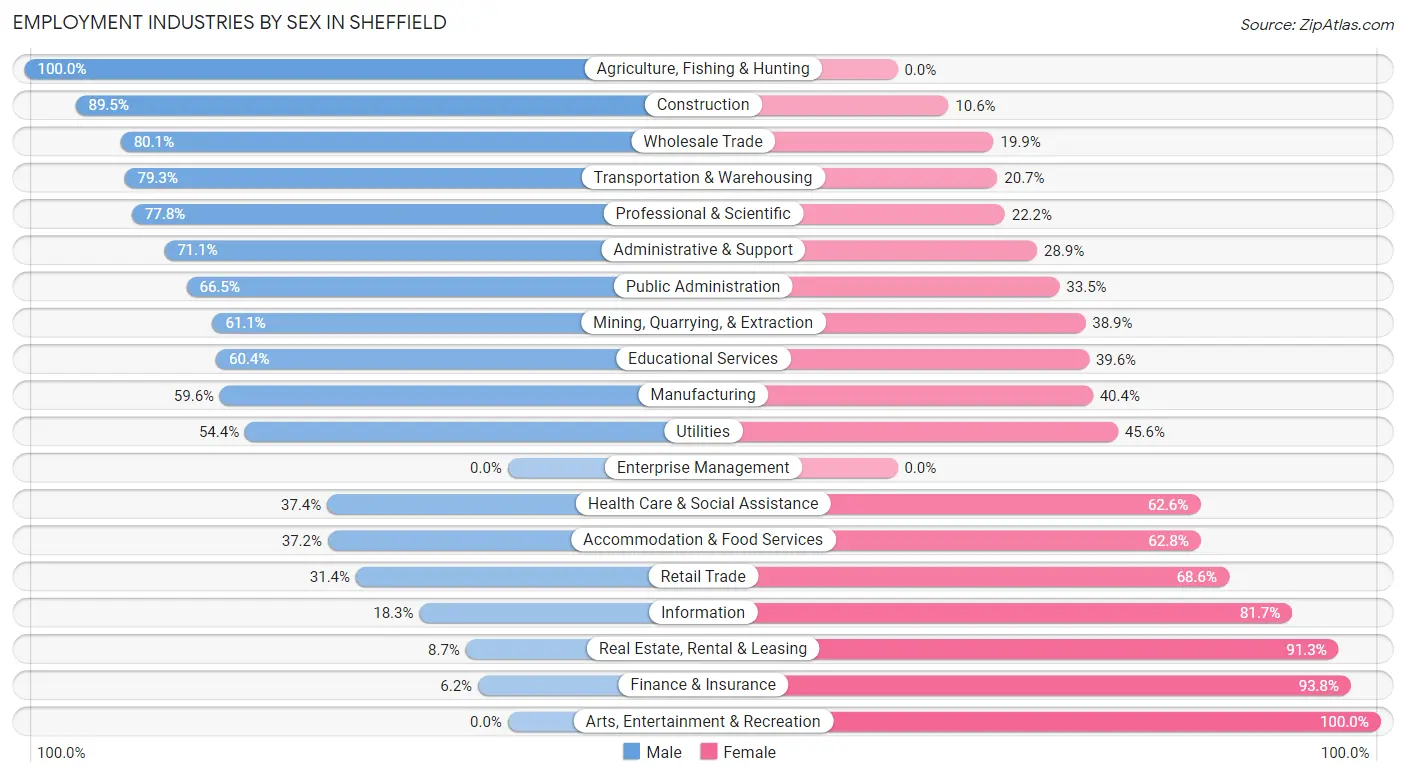
Employment Industries by Sex in Sheffield
The Sheffield industries that see more men than women are Agriculture, Fishing & Hunting (100.0%), Construction (89.4%), and Wholesale Trade (80.1%), whereas the industries that tend to have a higher number of women are Arts, Entertainment & Recreation (100.0%), Finance & Insurance (93.8%), and Real Estate, Rental & Leasing (91.3%).
| Industry | Male | Female |
| Agriculture, Fishing & Hunting | 5 (100.0%) | 0 (0.0%) |
| Mining, Quarrying, & Extraction | 11 (61.1%) | 7 (38.9%) |
| Construction | 373 (89.4%) | 44 (10.5%) |
| Manufacturing | 333 (59.6%) | 226 (40.4%) |
| Wholesale Trade | 177 (80.1%) | 44 (19.9%) |
| Retail Trade | 99 (31.4%) | 216 (68.6%) |
| Transportation & Warehousing | 23 (79.3%) | 6 (20.7%) |
| Utilities | 87 (54.4%) | 73 (45.6%) |
| Information | 26 (18.3%) | 116 (81.7%) |
| Finance & Insurance | 5 (6.2%) | 76 (93.8%) |
| Real Estate, Rental & Leasing | 4 (8.7%) | 42 (91.3%) |
| Professional & Scientific | 91 (77.8%) | 26 (22.2%) |
| Enterprise Management | 0 (0.0%) | 0 (0.0%) |
| Administrative & Support | 150 (71.1%) | 61 (28.9%) |
| Educational Services | 169 (60.4%) | 111 (39.6%) |
| Health Care & Social Assistance | 191 (37.4%) | 320 (62.6%) |
| Arts, Entertainment & Recreation | 0 (0.0%) | 26 (100.0%) |
| Accommodation & Food Services | 146 (37.2%) | 246 (62.8%) |
| Public Administration | 113 (66.5%) | 57 (33.5%) |
| Total | 2,127 (53.0%) | 1,885 (47.0%) |
Education in Sheffield
School Enrollment in Sheffield
The most common levels of schooling among the 1,802 students in Sheffield are elementary school (564 | 31.3%), middle school (445 | 24.7%), and high school (257 | 14.3%).
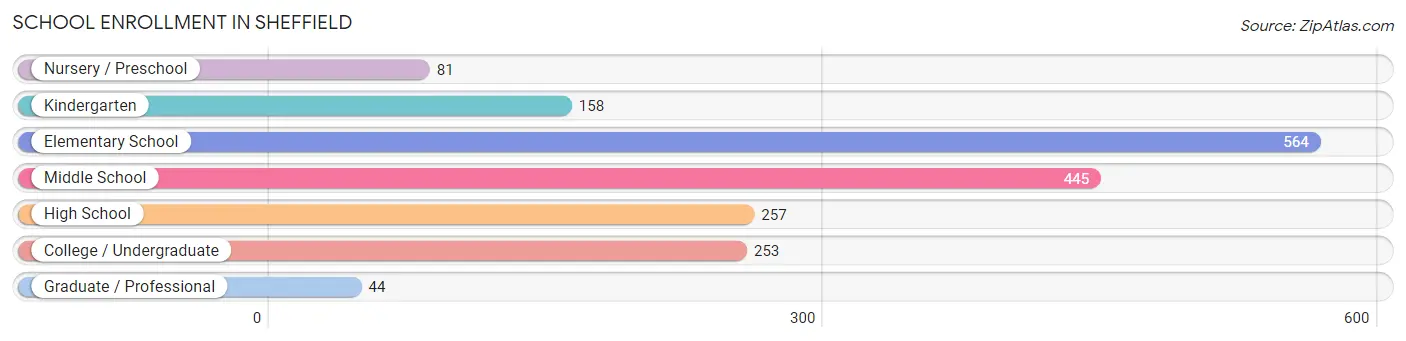
| School Level | # Students | % Students |
| Nursery / Preschool | 81 | 4.5% |
| Kindergarten | 158 | 8.8% |
| Elementary School | 564 | 31.3% |
| Middle School | 445 | 24.7% |
| High School | 257 | 14.3% |
| College / Undergraduate | 253 | 14.0% |
| Graduate / Professional | 44 | 2.4% |
| Total | 1,802 | 100.0% |
School Enrollment by Age by Funding Source in Sheffield
Out of a total of 1,802 students who are enrolled in schools in Sheffield, 204 (11.3%) attend a private institution, while the remaining 1,598 (88.7%) are enrolled in public schools. The age group of 3 to 4 year olds has the highest likelihood of being enrolled in private schools, with 21 (36.8% in the age bracket) enrolled. Conversely, the age group of 25 to 34 year olds has the lowest likelihood of being enrolled in a private school, with 68 (100.0% in the age bracket) attending a public institution.
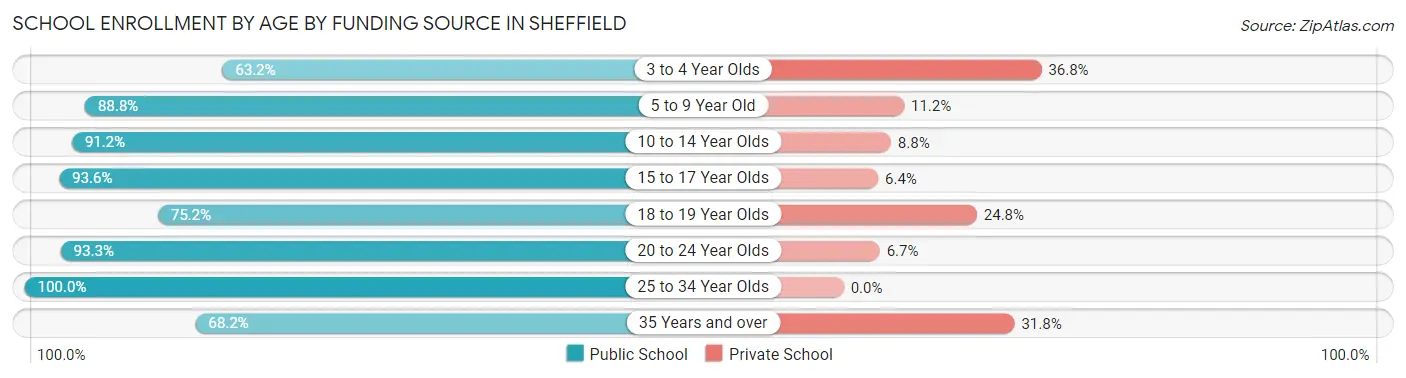
| Age Bracket | Public School | Private School |
| 3 to 4 Year Olds | 36 (63.2%) | 21 (36.8%) |
| 5 to 9 Year Old | 545 (88.8%) | 69 (11.2%) |
| 10 to 14 Year Olds | 549 (91.2%) | 53 (8.8%) |
| 15 to 17 Year Olds | 175 (93.6%) | 12 (6.4%) |
| 18 to 19 Year Olds | 100 (75.2%) | 33 (24.8%) |
| 20 to 24 Year Olds | 111 (93.3%) | 8 (6.7%) |
| 25 to 34 Year Olds | 68 (100.0%) | 0 (0.0%) |
| 35 Years and over | 15 (68.2%) | 7 (31.8%) |
| Total | 1,598 (88.7%) | 204 (11.3%) |
Educational Attainment by Field of Study in Sheffield
Business (277 | 23.1%), science & technology (202 | 16.9%), education (155 | 12.9%), bio, nature & agricultural (114 | 9.5%), and liberal arts & history (94 | 7.9%) are the most common fields of study among 1,198 individuals in Sheffield who have obtained a bachelor's degree or higher.
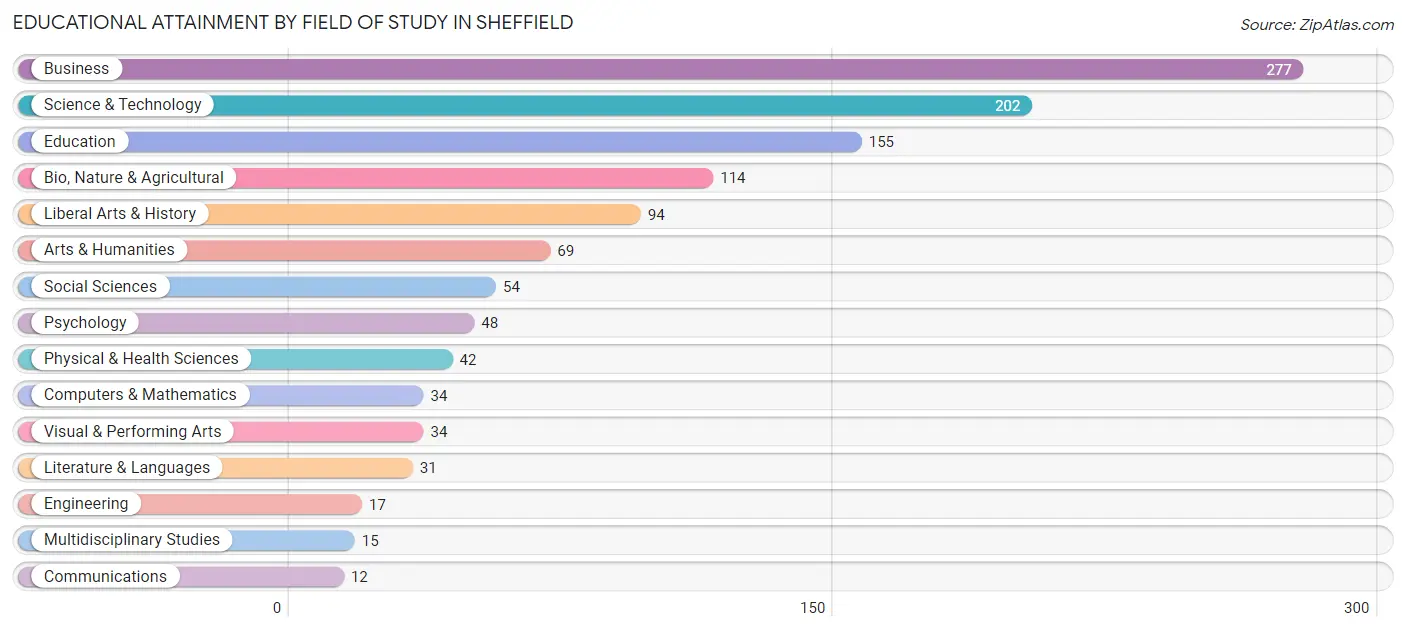
| Field of Study | # Graduates | % Graduates |
| Computers & Mathematics | 34 | 2.8% |
| Bio, Nature & Agricultural | 114 | 9.5% |
| Physical & Health Sciences | 42 | 3.5% |
| Psychology | 48 | 4.0% |
| Social Sciences | 54 | 4.5% |
| Engineering | 17 | 1.4% |
| Multidisciplinary Studies | 15 | 1.3% |
| Science & Technology | 202 | 16.9% |
| Business | 277 | 23.1% |
| Education | 155 | 12.9% |
| Literature & Languages | 31 | 2.6% |
| Liberal Arts & History | 94 | 7.9% |
| Visual & Performing Arts | 34 | 2.8% |
| Communications | 12 | 1.0% |
| Arts & Humanities | 69 | 5.8% |
| Total | 1,198 | 100.0% |
Transportation & Commute in Sheffield
Vehicle Availability by Sex in Sheffield
The most prevalent vehicle ownership categories in Sheffield are males with 2 vehicles (1,015, accounting for 48.2%) and females with 2 vehicles (647, making up 54.1%).

| Vehicles Available | Male | Female |
| No Vehicle | 15 (0.7%) | 40 (2.1%) |
| 1 Vehicle | 280 (13.3%) | 790 (42.1%) |
| 2 Vehicles | 1,015 (48.2%) | 647 (34.5%) |
| 3 Vehicles | 542 (25.8%) | 254 (13.5%) |
| 4 Vehicles | 117 (5.6%) | 72 (3.8%) |
| 5 or more Vehicles | 136 (6.5%) | 73 (3.9%) |
| Total | 2,105 (100.0%) | 1,876 (100.0%) |
Commute Time in Sheffield
The most frequently occuring commute durations in Sheffield are 15 to 19 minutes (934 commuters, 24.4%), 10 to 14 minutes (763 commuters, 19.9%), and 20 to 24 minutes (558 commuters, 14.6%).
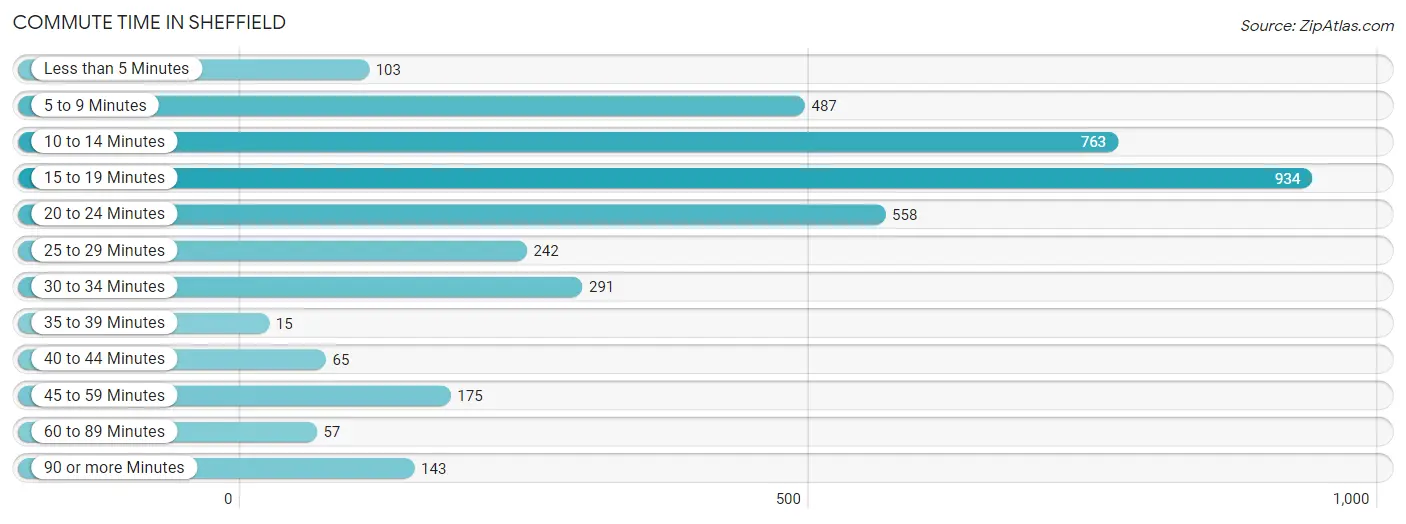
| Commute Time | # Commuters | % Commuters |
| Less than 5 Minutes | 103 | 2.7% |
| 5 to 9 Minutes | 487 | 12.7% |
| 10 to 14 Minutes | 763 | 19.9% |
| 15 to 19 Minutes | 934 | 24.4% |
| 20 to 24 Minutes | 558 | 14.6% |
| 25 to 29 Minutes | 242 | 6.3% |
| 30 to 34 Minutes | 291 | 7.6% |
| 35 to 39 Minutes | 15 | 0.4% |
| 40 to 44 Minutes | 65 | 1.7% |
| 45 to 59 Minutes | 175 | 4.6% |
| 60 to 89 Minutes | 57 | 1.5% |
| 90 or more Minutes | 143 | 3.7% |
Commute Time by Sex in Sheffield
The most common commute times in Sheffield are 15 to 19 minutes (485 commuters, 23.6%) for males and 15 to 19 minutes (449 commuters, 25.2%) for females.
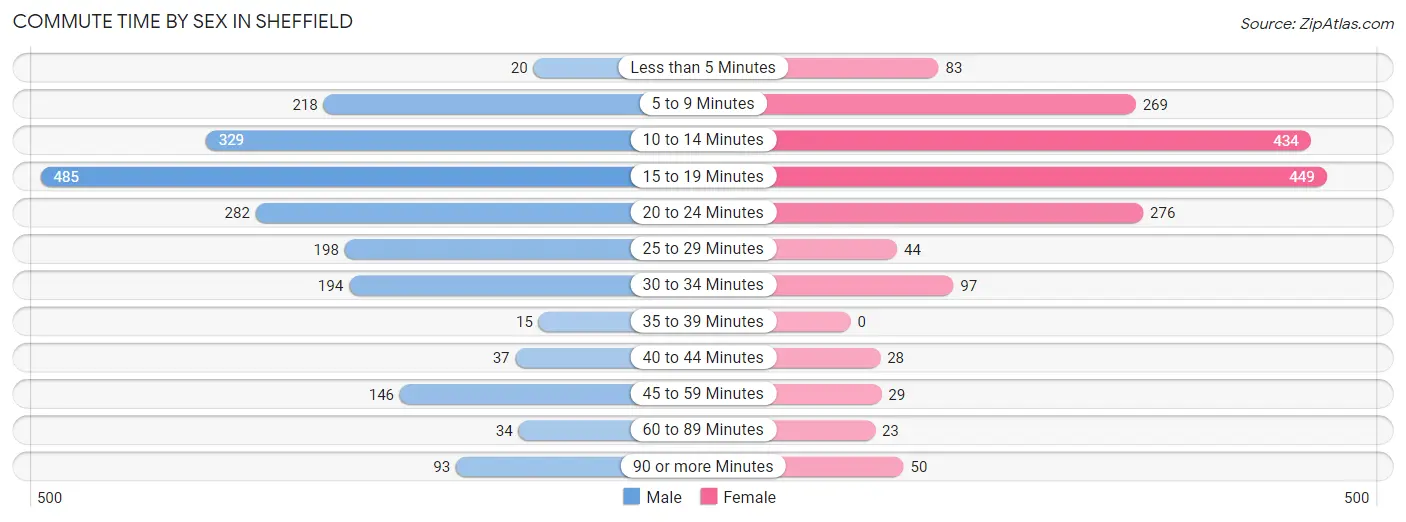
| Commute Time | Male | Female |
| Less than 5 Minutes | 20 (1.0%) | 83 (4.7%) |
| 5 to 9 Minutes | 218 (10.6%) | 269 (15.1%) |
| 10 to 14 Minutes | 329 (16.0%) | 434 (24.3%) |
| 15 to 19 Minutes | 485 (23.6%) | 449 (25.2%) |
| 20 to 24 Minutes | 282 (13.8%) | 276 (15.5%) |
| 25 to 29 Minutes | 198 (9.7%) | 44 (2.5%) |
| 30 to 34 Minutes | 194 (9.5%) | 97 (5.4%) |
| 35 to 39 Minutes | 15 (0.7%) | 0 (0.0%) |
| 40 to 44 Minutes | 37 (1.8%) | 28 (1.6%) |
| 45 to 59 Minutes | 146 (7.1%) | 29 (1.6%) |
| 60 to 89 Minutes | 34 (1.7%) | 23 (1.3%) |
| 90 or more Minutes | 93 (4.5%) | 50 (2.8%) |
Time of Departure to Work by Sex in Sheffield
The most frequent times of departure to work in Sheffield are 6:00 AM to 6:29 AM (354, 17.3%) for males and 7:00 AM to 7:29 AM (449, 25.2%) for females.
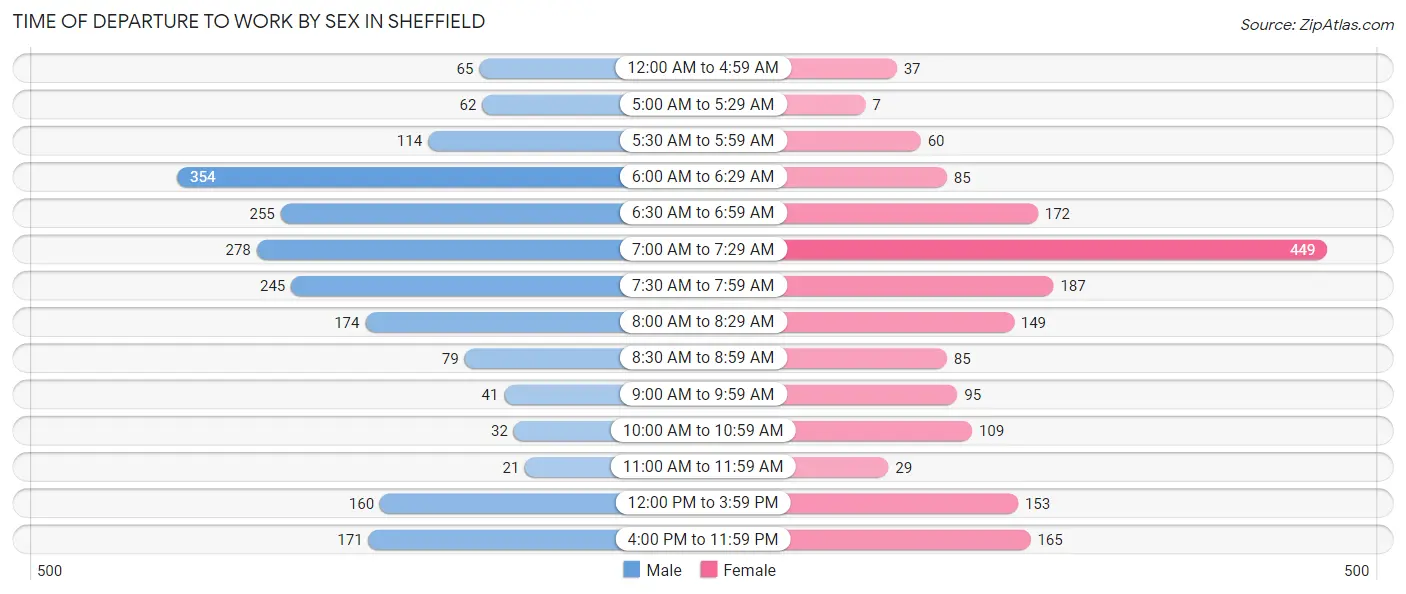
| Time of Departure | Male | Female |
| 12:00 AM to 4:59 AM | 65 (3.2%) | 37 (2.1%) |
| 5:00 AM to 5:29 AM | 62 (3.0%) | 7 (0.4%) |
| 5:30 AM to 5:59 AM | 114 (5.6%) | 60 (3.4%) |
| 6:00 AM to 6:29 AM | 354 (17.3%) | 85 (4.8%) |
| 6:30 AM to 6:59 AM | 255 (12.4%) | 172 (9.7%) |
| 7:00 AM to 7:29 AM | 278 (13.6%) | 449 (25.2%) |
| 7:30 AM to 7:59 AM | 245 (11.9%) | 187 (10.5%) |
| 8:00 AM to 8:29 AM | 174 (8.5%) | 149 (8.4%) |
| 8:30 AM to 8:59 AM | 79 (3.8%) | 85 (4.8%) |
| 9:00 AM to 9:59 AM | 41 (2.0%) | 95 (5.3%) |
| 10:00 AM to 10:59 AM | 32 (1.6%) | 109 (6.1%) |
| 11:00 AM to 11:59 AM | 21 (1.0%) | 29 (1.6%) |
| 12:00 PM to 3:59 PM | 160 (7.8%) | 153 (8.6%) |
| 4:00 PM to 11:59 PM | 171 (8.3%) | 165 (9.3%) |
| Total | 2,051 (100.0%) | 1,782 (100.0%) |
Housing Occupancy in Sheffield
Occupancy by Ownership in Sheffield
Of the total 4,309 dwellings in Sheffield, owner-occupied units account for 2,508 (58.2%), while renter-occupied units make up 1,801 (41.8%).
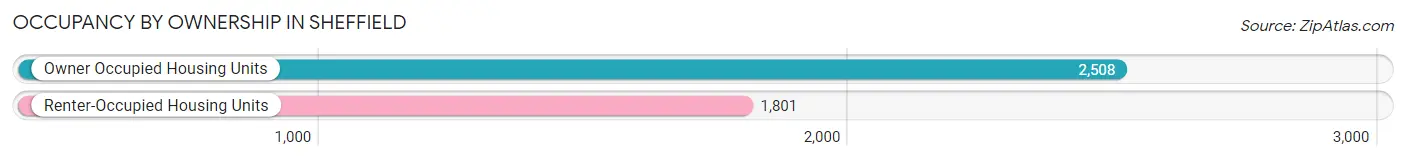
| Occupancy | # Housing Units | % Housing Units |
| Owner Occupied Housing Units | 2,508 | 58.2% |
| Renter-Occupied Housing Units | 1,801 | 41.8% |
| Total Occupied Housing Units | 4,309 | 100.0% |
Occupancy by Household Size in Sheffield
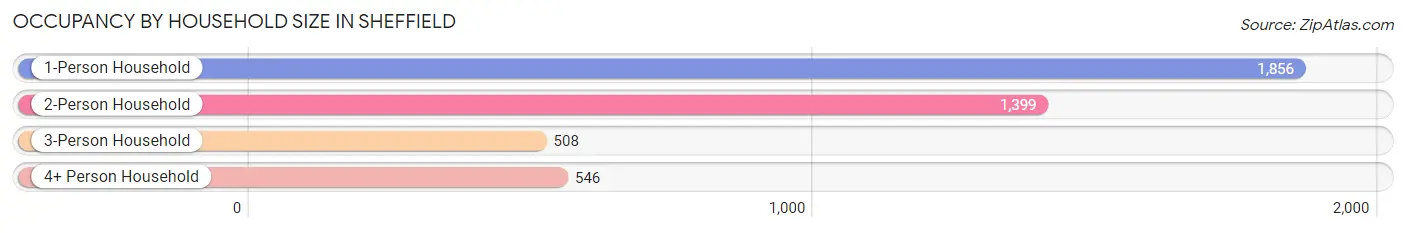
| Household Size | # Housing Units | % Housing Units |
| 1-Person Household | 1,856 | 43.1% |
| 2-Person Household | 1,399 | 32.5% |
| 3-Person Household | 508 | 11.8% |
| 4+ Person Household | 546 | 12.7% |
| Total Housing Units | 4,309 | 100.0% |
Occupancy by Ownership by Household Size in Sheffield
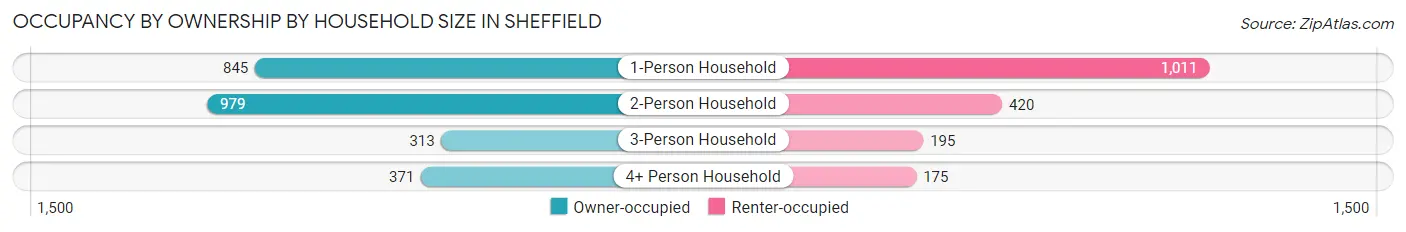
| Household Size | Owner-occupied | Renter-occupied |
| 1-Person Household | 845 (45.5%) | 1,011 (54.5%) |
| 2-Person Household | 979 (70.0%) | 420 (30.0%) |
| 3-Person Household | 313 (61.6%) | 195 (38.4%) |
| 4+ Person Household | 371 (67.9%) | 175 (32.1%) |
| Total Housing Units | 2,508 (58.2%) | 1,801 (41.8%) |
Occupancy by Educational Attainment in Sheffield
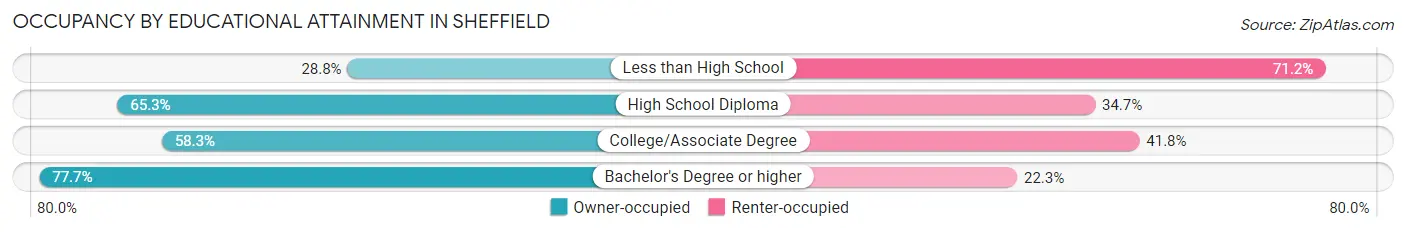
| Household Size | Owner-occupied | Renter-occupied |
| Less than High School | 247 (28.8%) | 611 (71.2%) |
| High School Diploma | 908 (65.3%) | 483 (34.7%) |
| College/Associate Degree | 741 (58.3%) | 531 (41.7%) |
| Bachelor's Degree or higher | 612 (77.7%) | 176 (22.3%) |
Occupancy by Age of Householder in Sheffield
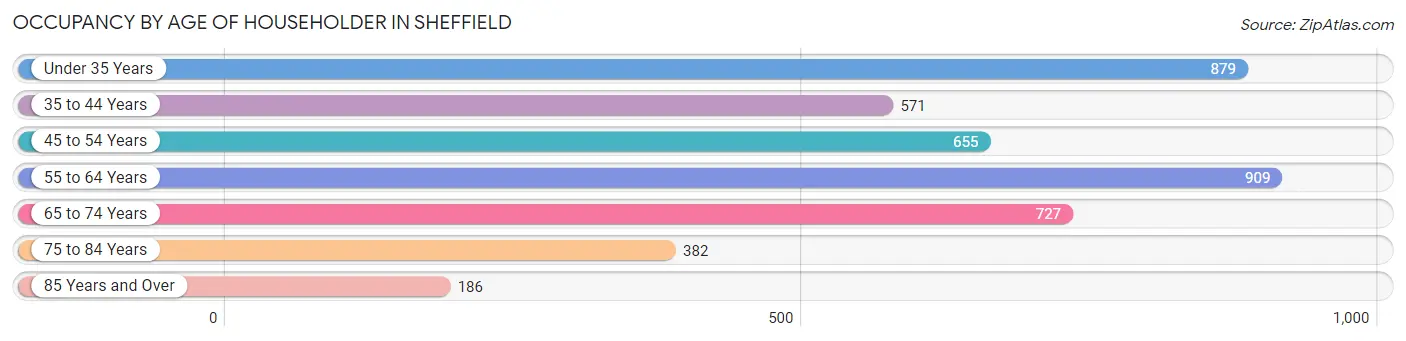
| Age Bracket | # Households | % Households |
| Under 35 Years | 879 | 20.4% |
| 35 to 44 Years | 571 | 13.3% |
| 45 to 54 Years | 655 | 15.2% |
| 55 to 64 Years | 909 | 21.1% |
| 65 to 74 Years | 727 | 16.9% |
| 75 to 84 Years | 382 | 8.9% |
| 85 Years and Over | 186 | 4.3% |
| Total | 4,309 | 100.0% |
Housing Finances in Sheffield
Median Income by Occupancy in Sheffield
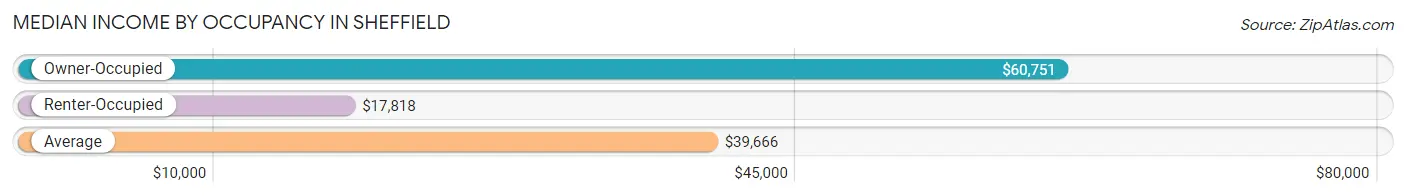
| Occupancy Type | # Households | Median Income |
| Owner-Occupied | 2,508 (58.2%) | $60,751 |
| Renter-Occupied | 1,801 (41.8%) | $17,818 |
| Average | 4,309 (100.0%) | $39,666 |
Occupancy by Householder Income Bracket in Sheffield
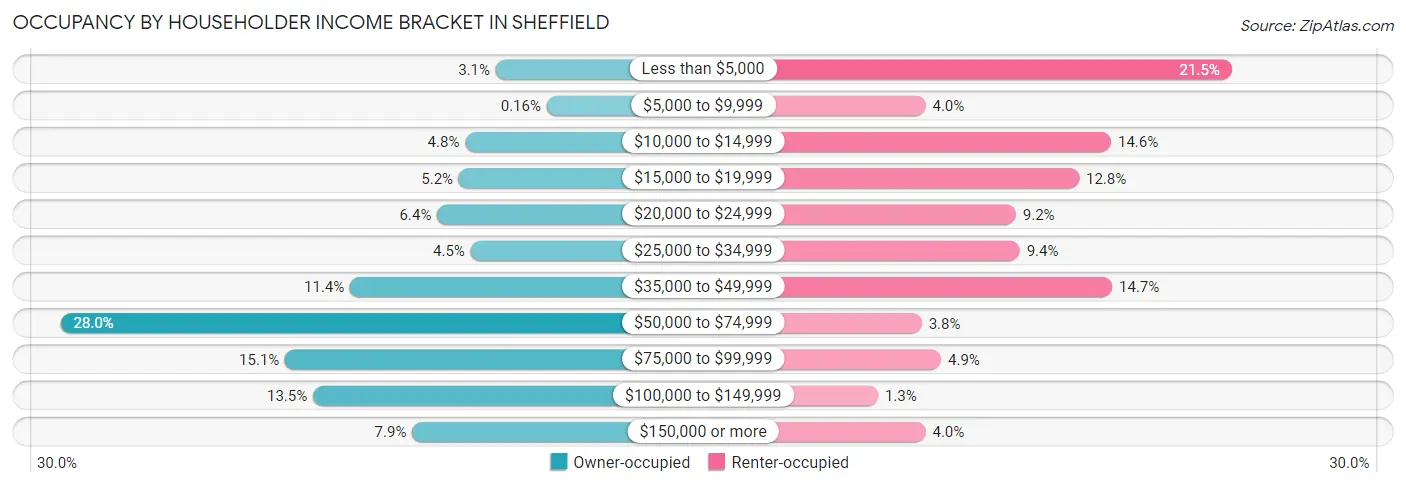
| Income Bracket | Owner-occupied | Renter-occupied |
| Less than $5,000 | 77 (3.1%) | 387 (21.5%) |
| $5,000 to $9,999 | 4 (0.2%) | 72 (4.0%) |
| $10,000 to $14,999 | 121 (4.8%) | 263 (14.6%) |
| $15,000 to $19,999 | 130 (5.2%) | 230 (12.8%) |
| $20,000 to $24,999 | 161 (6.4%) | 165 (9.2%) |
| $25,000 to $34,999 | 113 (4.5%) | 169 (9.4%) |
| $35,000 to $49,999 | 286 (11.4%) | 264 (14.7%) |
| $50,000 to $74,999 | 701 (28.0%) | 68 (3.8%) |
| $75,000 to $99,999 | 379 (15.1%) | 88 (4.9%) |
| $100,000 to $149,999 | 339 (13.5%) | 23 (1.3%) |
| $150,000 or more | 197 (7.9%) | 72 (4.0%) |
| Total | 2,508 (100.0%) | 1,801 (100.0%) |
Monthly Housing Cost Tiers in Sheffield
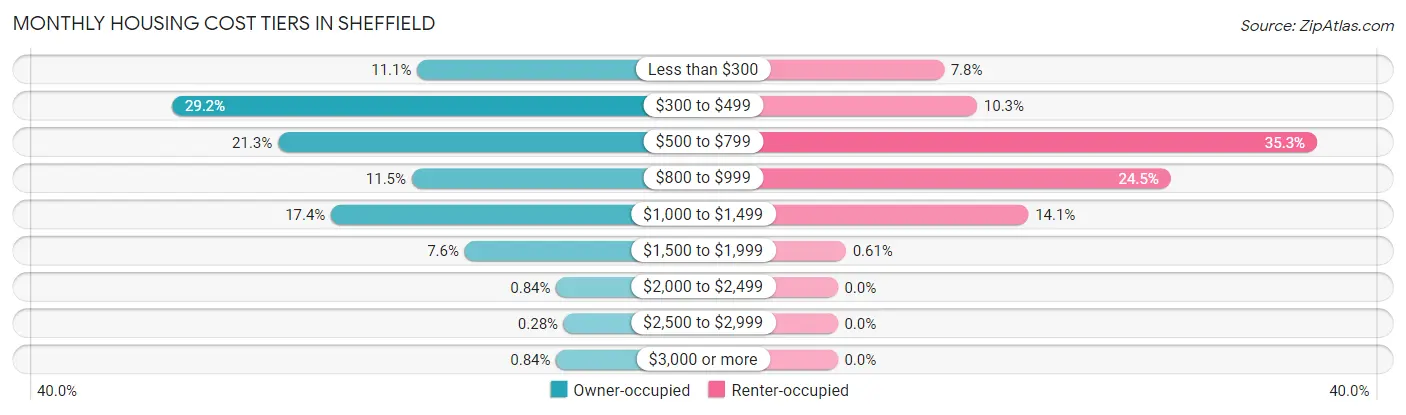
| Monthly Cost | Owner-occupied | Renter-occupied |
| Less than $300 | 278 (11.1%) | 141 (7.8%) |
| $300 to $499 | 731 (29.1%) | 185 (10.3%) |
| $500 to $799 | 535 (21.3%) | 636 (35.3%) |
| $800 to $999 | 288 (11.5%) | 442 (24.5%) |
| $1,000 to $1,499 | 437 (17.4%) | 253 (14.1%) |
| $1,500 to $1,999 | 190 (7.6%) | 11 (0.6%) |
| $2,000 to $2,499 | 21 (0.8%) | 0 (0.0%) |
| $2,500 to $2,999 | 7 (0.3%) | 0 (0.0%) |
| $3,000 or more | 21 (0.8%) | 0 (0.0%) |
| Total | 2,508 (100.0%) | 1,801 (100.0%) |
Physical Housing Characteristics in Sheffield
Housing Structures in Sheffield
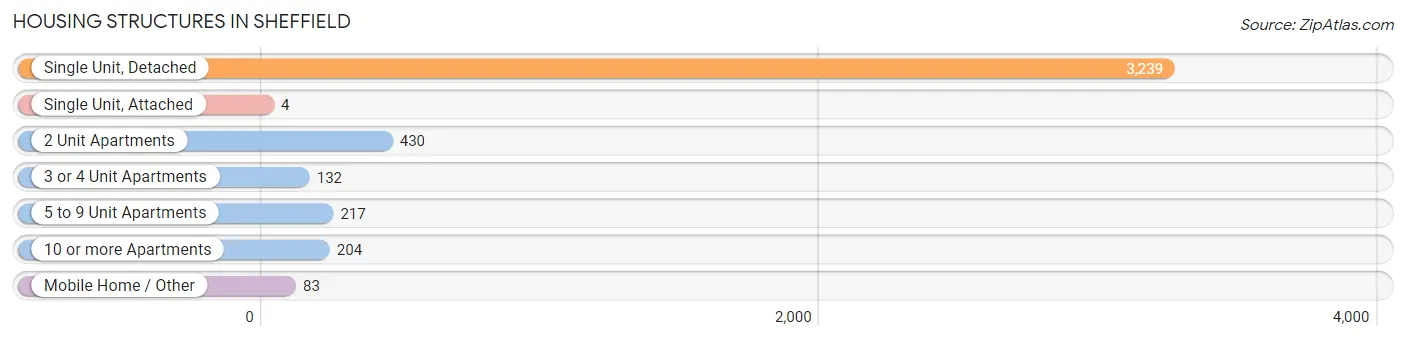
| Structure Type | # Housing Units | % Housing Units |
| Single Unit, Detached | 3,239 | 75.2% |
| Single Unit, Attached | 4 | 0.1% |
| 2 Unit Apartments | 430 | 10.0% |
| 3 or 4 Unit Apartments | 132 | 3.1% |
| 5 to 9 Unit Apartments | 217 | 5.0% |
| 10 or more Apartments | 204 | 4.7% |
| Mobile Home / Other | 83 | 1.9% |
| Total | 4,309 | 100.0% |
Housing Structures by Occupancy in Sheffield
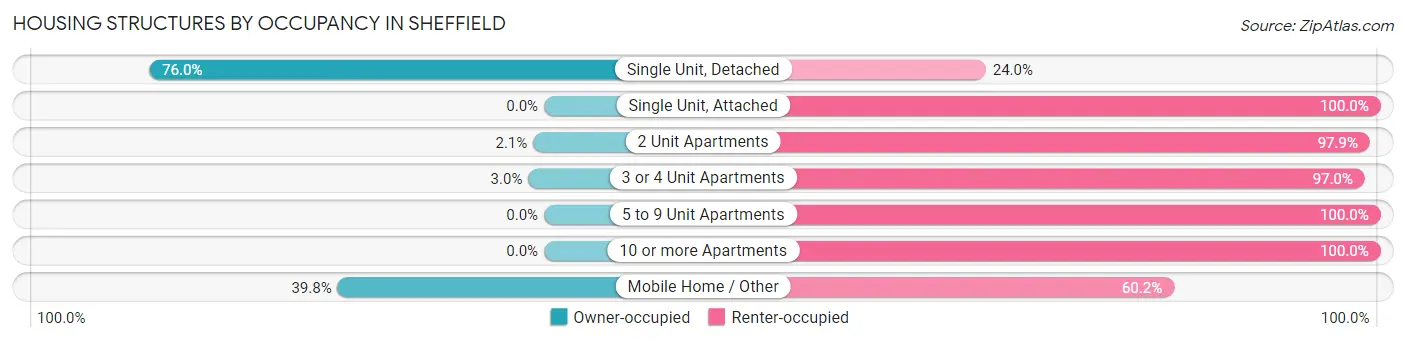
| Structure Type | Owner-occupied | Renter-occupied |
| Single Unit, Detached | 2,462 (76.0%) | 777 (24.0%) |
| Single Unit, Attached | 0 (0.0%) | 4 (100.0%) |
| 2 Unit Apartments | 9 (2.1%) | 421 (97.9%) |
| 3 or 4 Unit Apartments | 4 (3.0%) | 128 (97.0%) |
| 5 to 9 Unit Apartments | 0 (0.0%) | 217 (100.0%) |
| 10 or more Apartments | 0 (0.0%) | 204 (100.0%) |
| Mobile Home / Other | 33 (39.8%) | 50 (60.2%) |
| Total | 2,508 (58.2%) | 1,801 (41.8%) |
Housing Structures by Number of Rooms in Sheffield
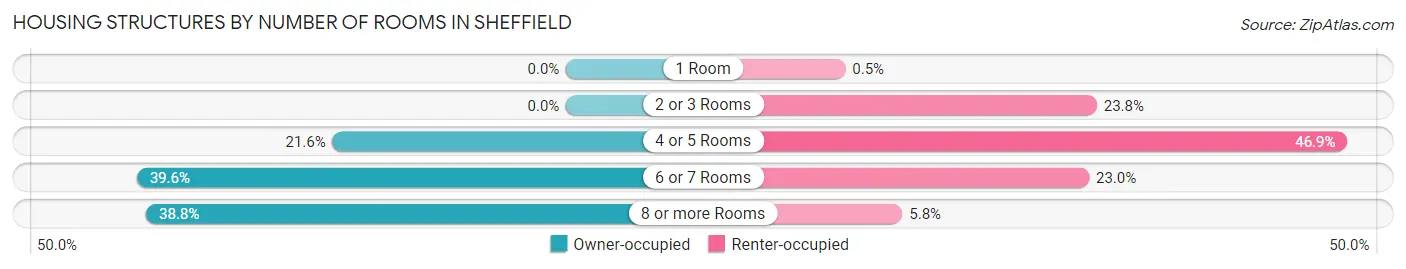
| Number of Rooms | Owner-occupied | Renter-occupied |
| 1 Room | 0 (0.0%) | 9 (0.5%) |
| 2 or 3 Rooms | 0 (0.0%) | 428 (23.8%) |
| 4 or 5 Rooms | 542 (21.6%) | 845 (46.9%) |
| 6 or 7 Rooms | 994 (39.6%) | 415 (23.0%) |
| 8 or more Rooms | 972 (38.8%) | 104 (5.8%) |
| Total | 2,508 (100.0%) | 1,801 (100.0%) |
Housing Structure by Heating Type in Sheffield
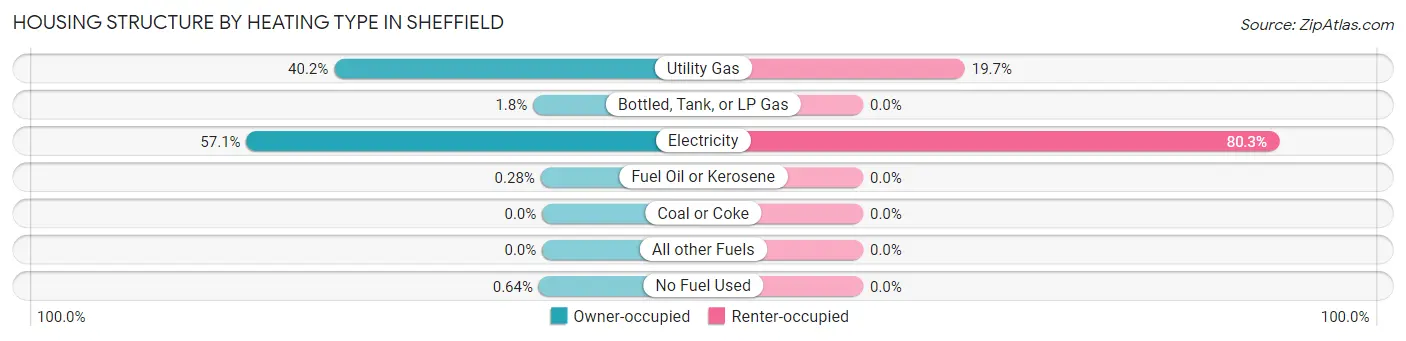
| Heating Type | Owner-occupied | Renter-occupied |
| Utility Gas | 1,008 (40.2%) | 354 (19.7%) |
| Bottled, Tank, or LP Gas | 44 (1.8%) | 0 (0.0%) |
| Electricity | 1,433 (57.1%) | 1,447 (80.3%) |
| Fuel Oil or Kerosene | 7 (0.3%) | 0 (0.0%) |
| Coal or Coke | 0 (0.0%) | 0 (0.0%) |
| All other Fuels | 0 (0.0%) | 0 (0.0%) |
| No Fuel Used | 16 (0.6%) | 0 (0.0%) |
| Total | 2,508 (100.0%) | 1,801 (100.0%) |
Household Vehicle Usage in Sheffield
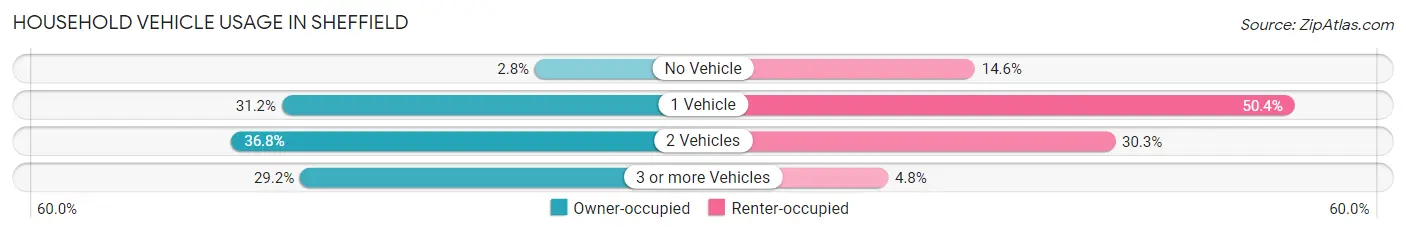
| Vehicles per Household | Owner-occupied | Renter-occupied |
| No Vehicle | 71 (2.8%) | 262 (14.5%) |
| 1 Vehicle | 782 (31.2%) | 907 (50.4%) |
| 2 Vehicles | 924 (36.8%) | 545 (30.3%) |
| 3 or more Vehicles | 731 (29.1%) | 87 (4.8%) |
| Total | 2,508 (100.0%) | 1,801 (100.0%) |
Real Estate & Mortgages in Sheffield
Real Estate and Mortgage Overview in Sheffield
| Characteristic | Without Mortgage | With Mortgage |
| Housing Units | 1,355 | 1,153 |
| Median Property Value | $93,900 | $135,800 |
| Median Household Income | $51,308 | $93 |
| Monthly Housing Costs | $388 | $21 |
| Real Estate Taxes | $494 | $274 |
Property Value by Mortgage Status in Sheffield
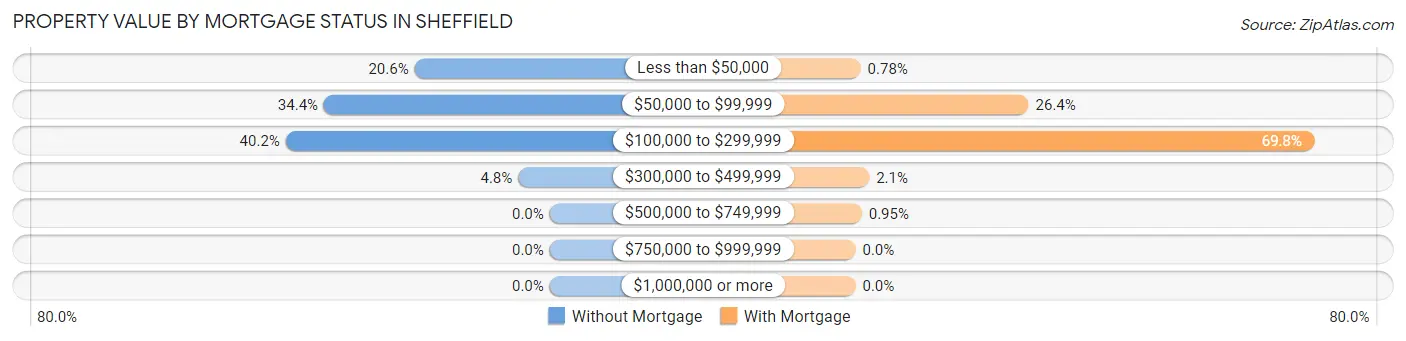
| Property Value | Without Mortgage | With Mortgage |
| Less than $50,000 | 279 (20.6%) | 9 (0.8%) |
| $50,000 to $99,999 | 466 (34.4%) | 304 (26.4%) |
| $100,000 to $299,999 | 545 (40.2%) | 805 (69.8%) |
| $300,000 to $499,999 | 65 (4.8%) | 24 (2.1%) |
| $500,000 to $749,999 | 0 (0.0%) | 11 (0.9%) |
| $750,000 to $999,999 | 0 (0.0%) | 0 (0.0%) |
| $1,000,000 or more | 0 (0.0%) | 0 (0.0%) |
| Total | 1,355 (100.0%) | 1,153 (100.0%) |
Household Income by Mortgage Status in Sheffield
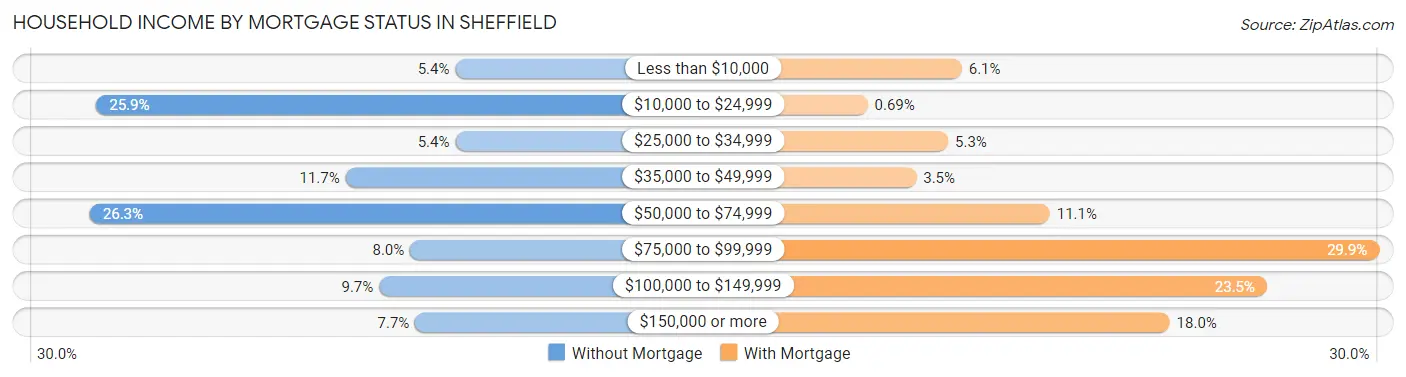
| Household Income | Without Mortgage | With Mortgage |
| Less than $10,000 | 73 (5.4%) | 70 (6.1%) |
| $10,000 to $24,999 | 351 (25.9%) | 8 (0.7%) |
| $25,000 to $34,999 | 73 (5.4%) | 61 (5.3%) |
| $35,000 to $49,999 | 158 (11.7%) | 40 (3.5%) |
| $50,000 to $74,999 | 356 (26.3%) | 128 (11.1%) |
| $75,000 to $99,999 | 108 (8.0%) | 345 (29.9%) |
| $100,000 to $149,999 | 132 (9.7%) | 271 (23.5%) |
| $150,000 or more | 104 (7.7%) | 207 (17.9%) |
| Total | 1,355 (100.0%) | 1,153 (100.0%) |
Property Value to Household Income Ratio in Sheffield
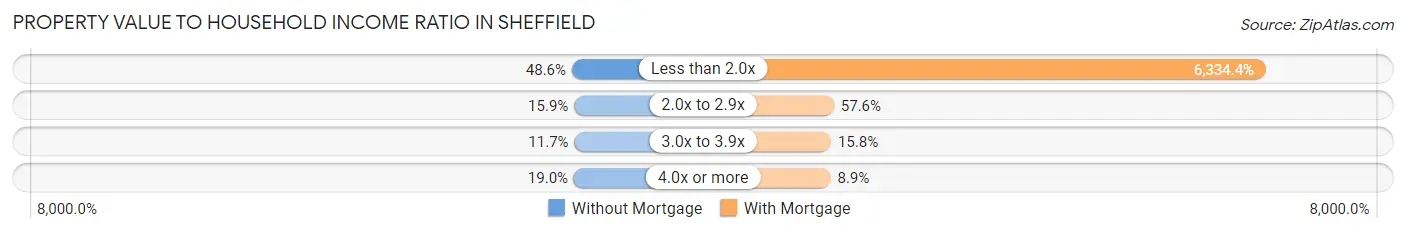
| Value-to-Income Ratio | Without Mortgage | With Mortgage |
| Less than 2.0x | 659 (48.6%) | 73,036 (6,334.4%) |
| 2.0x to 2.9x | 215 (15.9%) | 664 (57.6%) |
| 3.0x to 3.9x | 158 (11.7%) | 182 (15.8%) |
| 4.0x or more | 258 (19.0%) | 103 (8.9%) |
| Total | 1,355 (100.0%) | 1,153 (100.0%) |
Real Estate Taxes by Mortgage Status in Sheffield
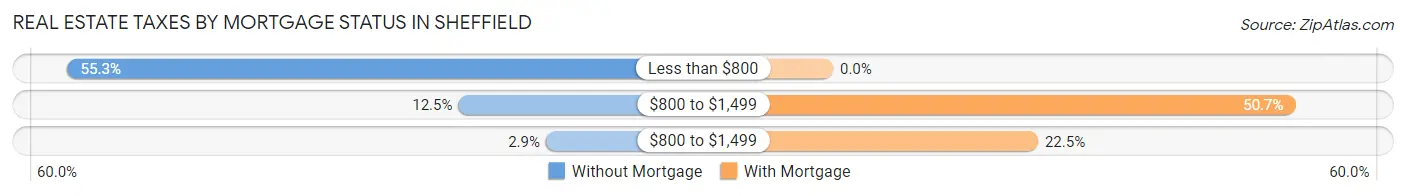
| Property Taxes | Without Mortgage | With Mortgage |
| Less than $800 | 749 (55.3%) | 0 (0.0%) |
| $800 to $1,499 | 169 (12.5%) | 584 (50.6%) |
| $800 to $1,499 | 39 (2.9%) | 259 (22.5%) |
| Total | 1,355 (100.0%) | 1,153 (100.0%) |
Health & Disability in Sheffield
Health Insurance Coverage by Age in Sheffield
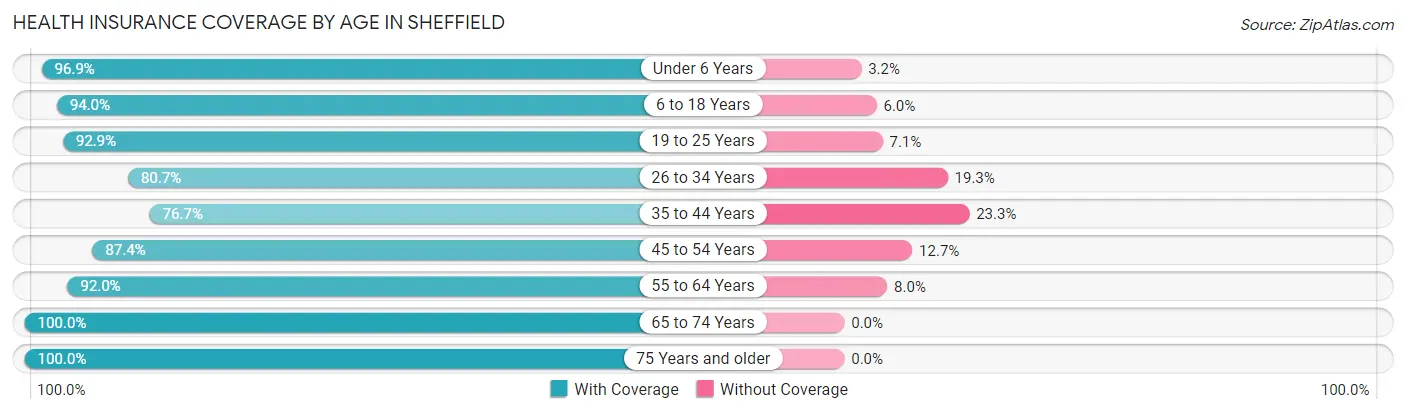
| Age Bracket | With Coverage | Without Coverage |
| Under 6 Years | 492 (96.9%) | 16 (3.2%) |
| 6 to 18 Years | 1,251 (94.0%) | 80 (6.0%) |
| 19 to 25 Years | 899 (92.9%) | 69 (7.1%) |
| 26 to 34 Years | 909 (80.7%) | 217 (19.3%) |
| 35 to 44 Years | 790 (76.7%) | 240 (23.3%) |
| 45 to 54 Years | 1,036 (87.4%) | 150 (12.7%) |
| 55 to 64 Years | 1,128 (92.0%) | 98 (8.0%) |
| 65 to 74 Years | 1,198 (100.0%) | 0 (0.0%) |
| 75 Years and older | 751 (100.0%) | 0 (0.0%) |
| Total | 8,454 (90.7%) | 870 (9.3%) |
Health Insurance Coverage by Citizenship Status in Sheffield
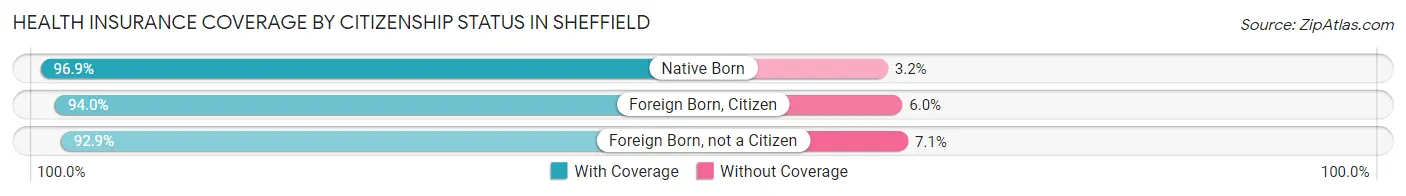
| Citizenship Status | With Coverage | Without Coverage |
| Native Born | 492 (96.9%) | 16 (3.2%) |
| Foreign Born, Citizen | 1,251 (94.0%) | 80 (6.0%) |
| Foreign Born, not a Citizen | 899 (92.9%) | 69 (7.1%) |
Health Insurance Coverage by Household Income in Sheffield
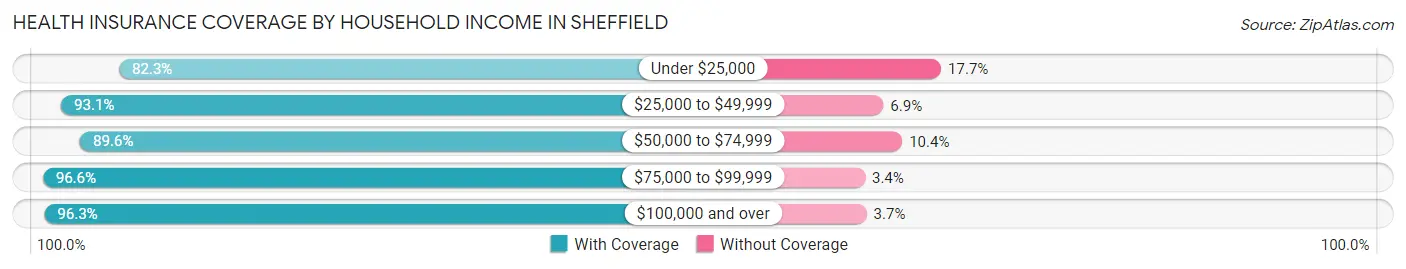
| Household Income | With Coverage | Without Coverage |
| Under $25,000 | 2,100 (82.3%) | 451 (17.7%) |
| $25,000 to $49,999 | 1,521 (93.1%) | 112 (6.9%) |
| $50,000 to $74,999 | 1,639 (89.6%) | 190 (10.4%) |
| $75,000 to $99,999 | 1,410 (96.6%) | 50 (3.4%) |
| $100,000 and over | 1,735 (96.3%) | 67 (3.7%) |
Public vs Private Health Insurance Coverage by Age in Sheffield
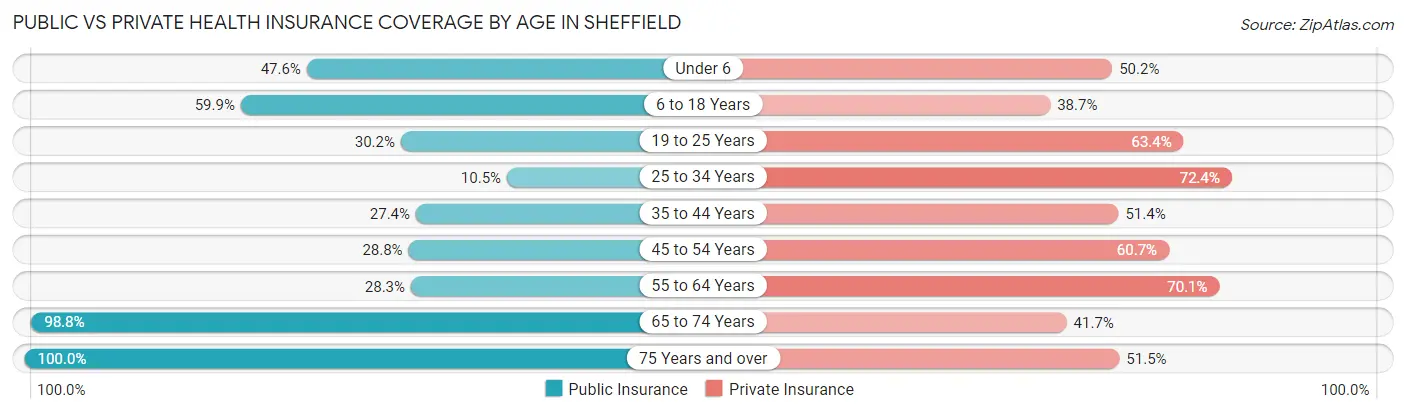
| Age Bracket | Public Insurance | Private Insurance |
| Under 6 | 242 (47.6%) | 255 (50.2%) |
| 6 to 18 Years | 797 (59.9%) | 515 (38.7%) |
| 19 to 25 Years | 292 (30.2%) | 614 (63.4%) |
| 25 to 34 Years | 118 (10.5%) | 815 (72.4%) |
| 35 to 44 Years | 282 (27.4%) | 529 (51.4%) |
| 45 to 54 Years | 341 (28.7%) | 720 (60.7%) |
| 55 to 64 Years | 347 (28.3%) | 859 (70.1%) |
| 65 to 74 Years | 1,183 (98.8%) | 500 (41.7%) |
| 75 Years and over | 751 (100.0%) | 387 (51.5%) |
| Total | 4,353 (46.7%) | 5,194 (55.7%) |
Disability Status by Sex by Age in Sheffield
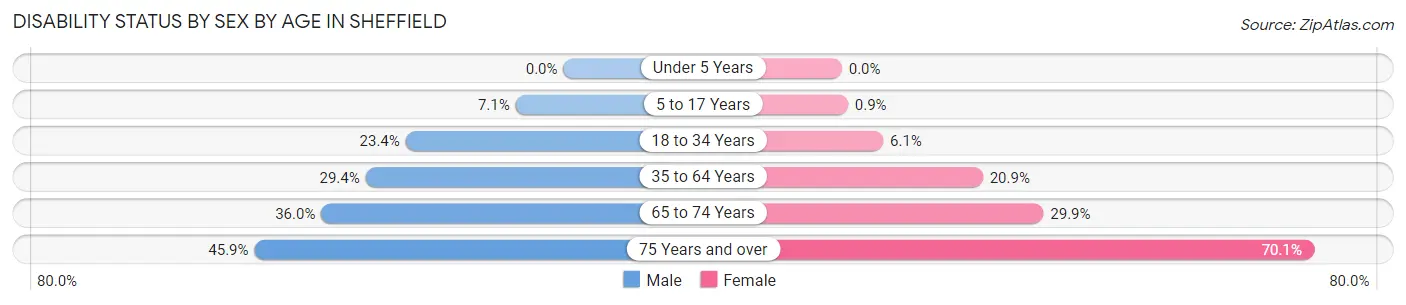
| Age Bracket | Male | Female |
| Under 5 Years | 0 (0.0%) | 0 (0.0%) |
| 5 to 17 Years | 64 (7.1%) | 5 (0.9%) |
| 18 to 34 Years | 311 (23.4%) | 52 (6.1%) |
| 35 to 64 Years | 444 (29.4%) | 404 (20.9%) |
| 65 to 74 Years | 188 (35.9%) | 202 (29.9%) |
| 75 Years and over | 156 (45.9%) | 288 (70.1%) |
Disability Class by Sex by Age in Sheffield
Disability Class: Hearing Difficulty
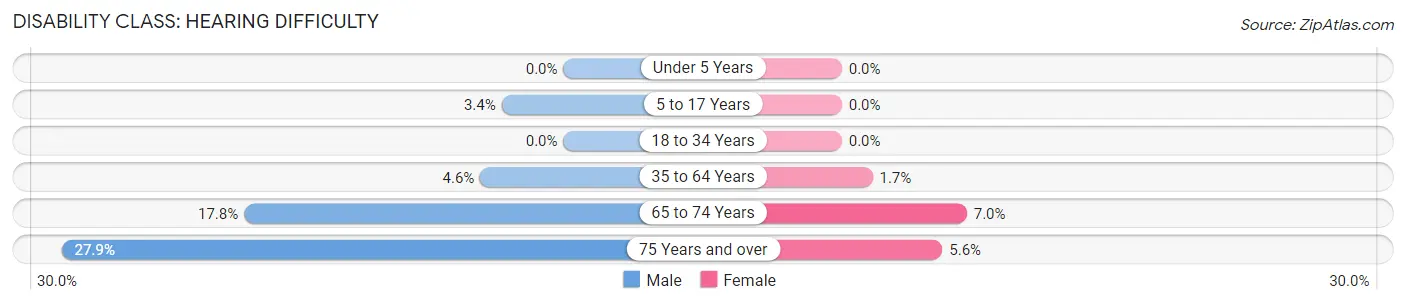
| Age Bracket | Male | Female |
| Under 5 Years | 0 (0.0%) | 0 (0.0%) |
| 5 to 17 Years | 31 (3.4%) | 0 (0.0%) |
| 18 to 34 Years | 0 (0.0%) | 0 (0.0%) |
| 35 to 64 Years | 70 (4.6%) | 33 (1.7%) |
| 65 to 74 Years | 93 (17.8%) | 47 (7.0%) |
| 75 Years and over | 95 (27.9%) | 23 (5.6%) |
Disability Class: Vision Difficulty
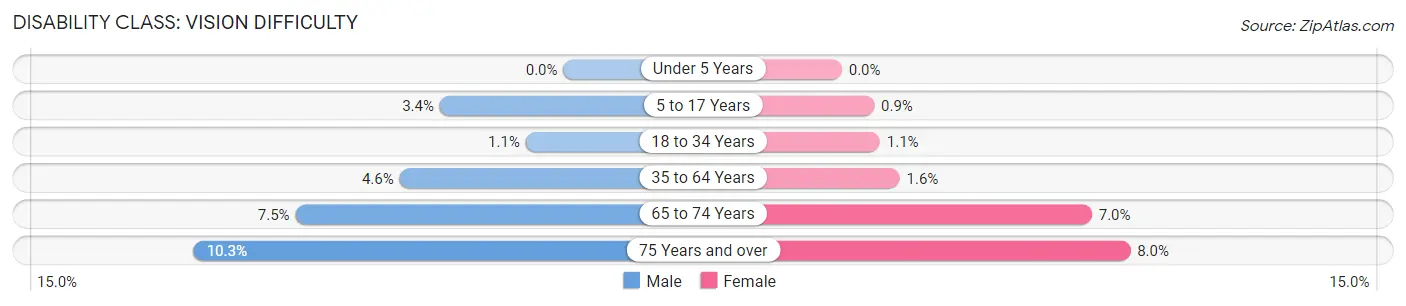
| Age Bracket | Male | Female |
| Under 5 Years | 0 (0.0%) | 0 (0.0%) |
| 5 to 17 Years | 31 (3.4%) | 5 (0.9%) |
| 18 to 34 Years | 14 (1.1%) | 9 (1.1%) |
| 35 to 64 Years | 69 (4.6%) | 31 (1.6%) |
| 65 to 74 Years | 39 (7.5%) | 47 (7.0%) |
| 75 Years and over | 35 (10.3%) | 33 (8.0%) |
Disability Class: Cognitive Difficulty
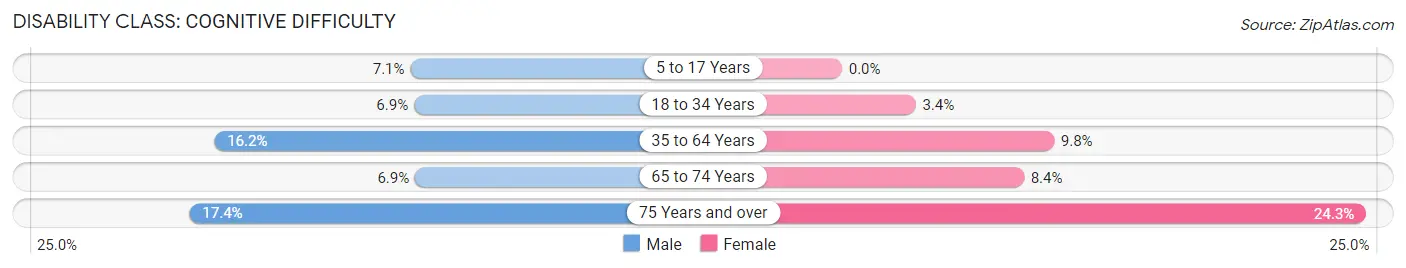
| Age Bracket | Male | Female |
| 5 to 17 Years | 64 (7.1%) | 0 (0.0%) |
| 18 to 34 Years | 92 (6.9%) | 29 (3.4%) |
| 35 to 64 Years | 245 (16.2%) | 190 (9.8%) |
| 65 to 74 Years | 36 (6.9%) | 57 (8.4%) |
| 75 Years and over | 59 (17.3%) | 100 (24.3%) |
Disability Class: Ambulatory Difficulty
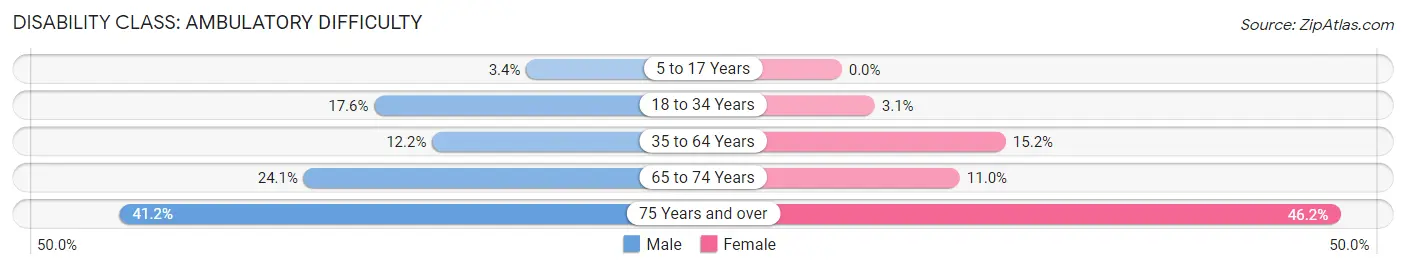
| Age Bracket | Male | Female |
| 5 to 17 Years | 31 (3.4%) | 0 (0.0%) |
| 18 to 34 Years | 233 (17.5%) | 26 (3.1%) |
| 35 to 64 Years | 184 (12.2%) | 294 (15.2%) |
| 65 to 74 Years | 126 (24.1%) | 74 (11.0%) |
| 75 Years and over | 140 (41.2%) | 190 (46.2%) |
Disability Class: Self-Care Difficulty
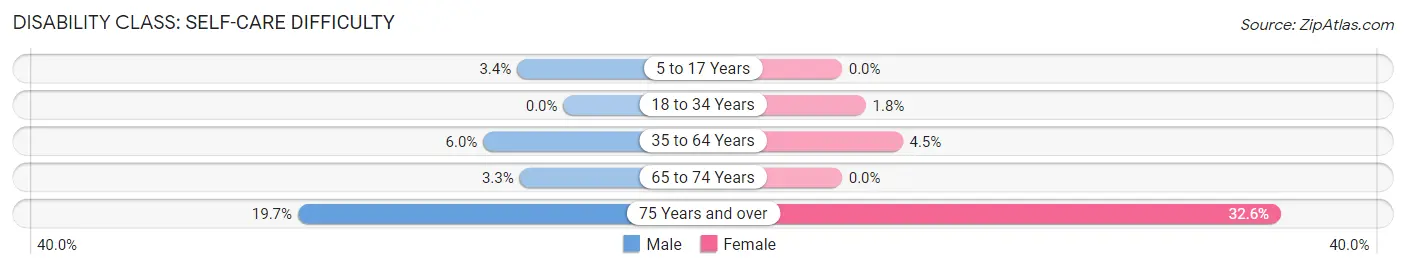
| Age Bracket | Male | Female |
| 5 to 17 Years | 31 (3.4%) | 0 (0.0%) |
| 18 to 34 Years | 0 (0.0%) | 15 (1.8%) |
| 35 to 64 Years | 90 (5.9%) | 87 (4.5%) |
| 65 to 74 Years | 17 (3.3%) | 0 (0.0%) |
| 75 Years and over | 67 (19.7%) | 134 (32.6%) |
Technology Access in Sheffield
Computing Device Access in Sheffield
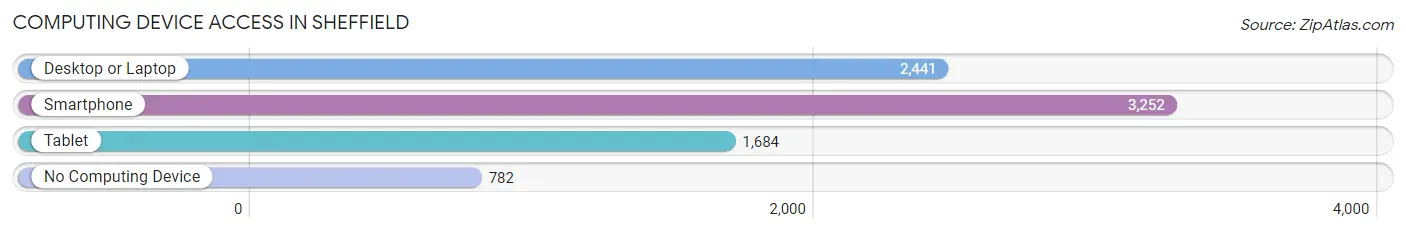
| Device Type | # Households | % Households |
| Desktop or Laptop | 2,441 | 56.7% |
| Smartphone | 3,252 | 75.5% |
| Tablet | 1,684 | 39.1% |
| No Computing Device | 782 | 18.1% |
| Total | 4,309 | 100.0% |
Internet Access in Sheffield
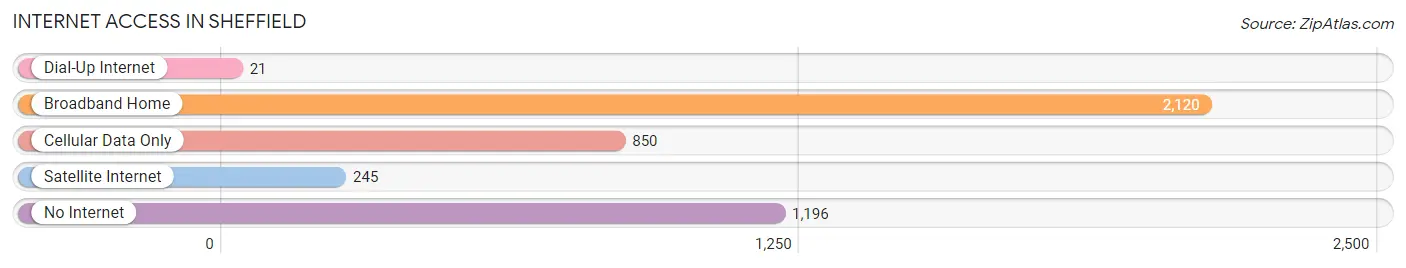
| Internet Type | # Households | % Households |
| Dial-Up Internet | 21 | 0.5% |
| Broadband Home | 2,120 | 49.2% |
| Cellular Data Only | 850 | 19.7% |
| Satellite Internet | 245 | 5.7% |
| No Internet | 1,196 | 27.8% |
| Total | 4,309 | 100.0% |
Sheffield Summary
Sheffield is a city located in Colbert County, Alabama, United States. It is part of the Florence-Muscle Shoals Metropolitan Statistical Area known as "The Shoals". As of the 2010 census, the population of Sheffield was 9,039.
History
The area that is now Sheffield was originally inhabited by the Chickasaw Indians. The first settlers arrived in the area in the early 1800s. The city was founded in 1885 and was named after Sheffield, England. The city was incorporated in 1889.
The city was an important industrial center during the early 20th century. The Sheffield Iron Company was founded in 1883 and was the first iron and steel mill in the area. The company was later renamed the Tennessee Coal, Iron and Railroad Company (TCI). The company was a major employer in the area and was responsible for the growth of the city.
The city was also home to the Sheffield Steel Works, which was founded in 1901. The steel works was the largest steel mill in the South and was responsible for the production of steel for the U.S. Navy during World War II.
The city was also home to the Sheffield School of Technology, which was founded in 1909. The school was the first technical school in the state and was responsible for training many of the engineers and technicians who worked in the steel and iron industries in the area.
The city was also home to the Sheffield Music Festival, which was held annually from the 1920s to the 1950s. The festival was one of the largest music festivals in the South and featured some of the biggest names in music, including Elvis Presley, Johnny Cash, and Hank Williams.
Geography
Sheffield is located in northwestern Alabama, in Colbert County. It is situated on the banks of the Tennessee River, about 20 miles east of the Mississippi River. The city is located at the intersection of U.S. Route 72 and Alabama State Route 20.
The city has a total area of 16.2 square miles, of which 16.1 square miles is land and 0.1 square miles is water. The city is located in the foothills of the Appalachian Mountains and is surrounded by rolling hills and forests.
Economy
The economy of Sheffield is largely based on manufacturing and industry. The city is home to several large manufacturing companies, including the Tennessee Coal, Iron and Railroad Company (TCI), the Sheffield Steel Works, and the Sheffield School of Technology.
The city is also home to several retail stores, restaurants, and other businesses. The city is served by the Sheffield-Florence Regional Airport, which provides air service to the area.
Demographics
As of the 2010 census, there were 9,039 people, 3,845 households, and 2,541 families residing in the city. The population density was 562.2 people per square mile. The racial makeup of the city was 79.2% White, 17.3% African American, 0.3% Native American, 0.7% Asian, 0.1% Pacific Islander, 1.2% from other races, and 1.3% from two or more races. Hispanic or Latino of any race were 2.7% of the population.
The median income for a household in the city was $33,917, and the median income for a family was $41,945. The per capita income for the city was $18,945. About 17.2% of families and 20.3% of the population were below the poverty line, including 28.2% of those under age 18 and 14.2% of those age 65 or over.
Common Questions
What is Per Capita Income in Sheffield?
Per Capita income in Sheffield is $26,627.
What is the Median Family Income in Sheffield?
Median Family Income in Sheffield is $61,923.
What is the Median Household income in Sheffield?
Median Household Income in Sheffield is $39,666.
What is Income or Wage Gap in Sheffield?
Income or Wage Gap in Sheffield is 14.7%.
Women in Sheffield earn 85.3 cents for every dollar earned by a man.
What is Family Income Deficit in Sheffield?
Family Income Deficit in Sheffield is $11,709.
Families that are below poverty line in Sheffield earn $11,709 less on average than the poverty threshold level.
What is Inequality or Gini Index in Sheffield?
Inequality or Gini Index in Sheffield is 0.49.
What is the Total Population of Sheffield?
Total Population of Sheffield is 9,330.
What is the Total Male Population of Sheffield?
Total Male Population of Sheffield is 4,712.
What is the Total Female Population of Sheffield?
Total Female Population of Sheffield is 4,618.
What is the Ratio of Males per 100 Females in Sheffield?
There are 102.04 Males per 100 Females in Sheffield.
What is the Ratio of Females per 100 Males in Sheffield?
There are 98.01 Females per 100 Males in Sheffield.
What is the Median Population Age in Sheffield?
Median Population Age in Sheffield is 42.0 Years.
What is the Average Family Size in Sheffield
Average Family Size in Sheffield is 3.1 People.
What is the Average Household Size in Sheffield
Average Household Size in Sheffield is 2.1 People.
How Large is the Labor Force in Sheffield?
There are 4,169 People in the Labor Forcein in Sheffield.
What is the Percentage of People in the Labor Force in Sheffield?
54.3% of People are in the Labor Force in Sheffield.
What is the Unemployment Rate in Sheffield?
Unemployment Rate in Sheffield is 3.8%.