Kinston, AL Map & Demographics
Kinston Map
Kinston Overview
$16,766
PER CAPITA INCOME
$55,625
AVG FAMILY INCOME
$39,167
AVG HOUSEHOLD INCOME
25.8%
WAGE / INCOME GAP [ % ]
74.2¢/ $1
WAGE / INCOME GAP [ $ ]
0.33
INEQUALITY / GINI INDEX
797
TOTAL POPULATION
429
MALE POPULATION
368
FEMALE POPULATION
116.58
MALES / 100 FEMALES
85.78
FEMALES / 100 MALES
44.3
MEDIAN AGE
3.8
AVG FAMILY SIZE
3.0
AVG HOUSEHOLD SIZE
375
LABOR FORCE [ PEOPLE ]
57.2%
PERCENT IN LABOR FORCE
20.5%
UNEMPLOYMENT RATE
Kinston Zip Codes
Kinston Area Codes
Income in Kinston
Income Overview in Kinston
Per Capita Income in Kinston is $16,766, while median incomes of families and households are $55,625 and $39,167 respectively.
| Characteristic | Number | Measure |
| Per Capita Income | 797 | $16,766 |
| Median Family Income | 143 | $55,625 |
| Mean Family Income | 143 | $55,541 |
| Median Household Income | 264 | $39,167 |
| Mean Household Income | 264 | $45,951 |
| Income Deficit | 143 | $0 |
| Wage / Income Gap (%) | 797 | 25.79% |
| Wage / Income Gap ($) | 797 | 74.21¢ per $1 |
| Gini / Inequality Index | 797 | 0.33 |
Earnings by Sex in Kinston
Average Earnings in Kinston are $17,486, $16,929 for men and $22,813 for women, a difference of 25.8%.
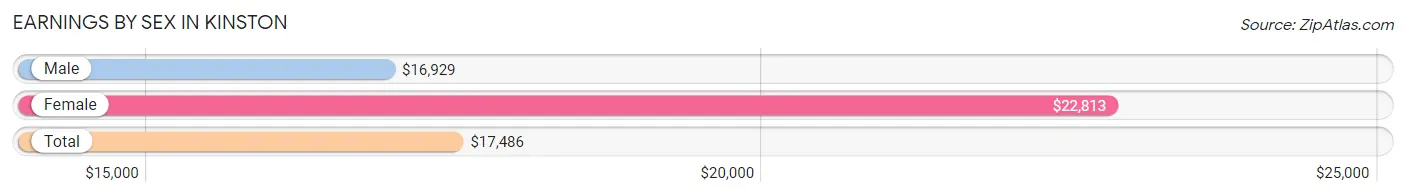
| Sex | Number | Average Earnings |
| Male | 227 (58.7%) | $16,929 |
| Female | 160 (41.3%) | $22,813 |
| Total | 387 (100.0%) | $17,486 |
Earnings by Sex by Income Bracket in Kinston
The most common earnings brackets in Kinston are $12,500 to $14,999 for men (62 | 27.3%) and $15,000 to $17,499 for women (44 | 27.5%).
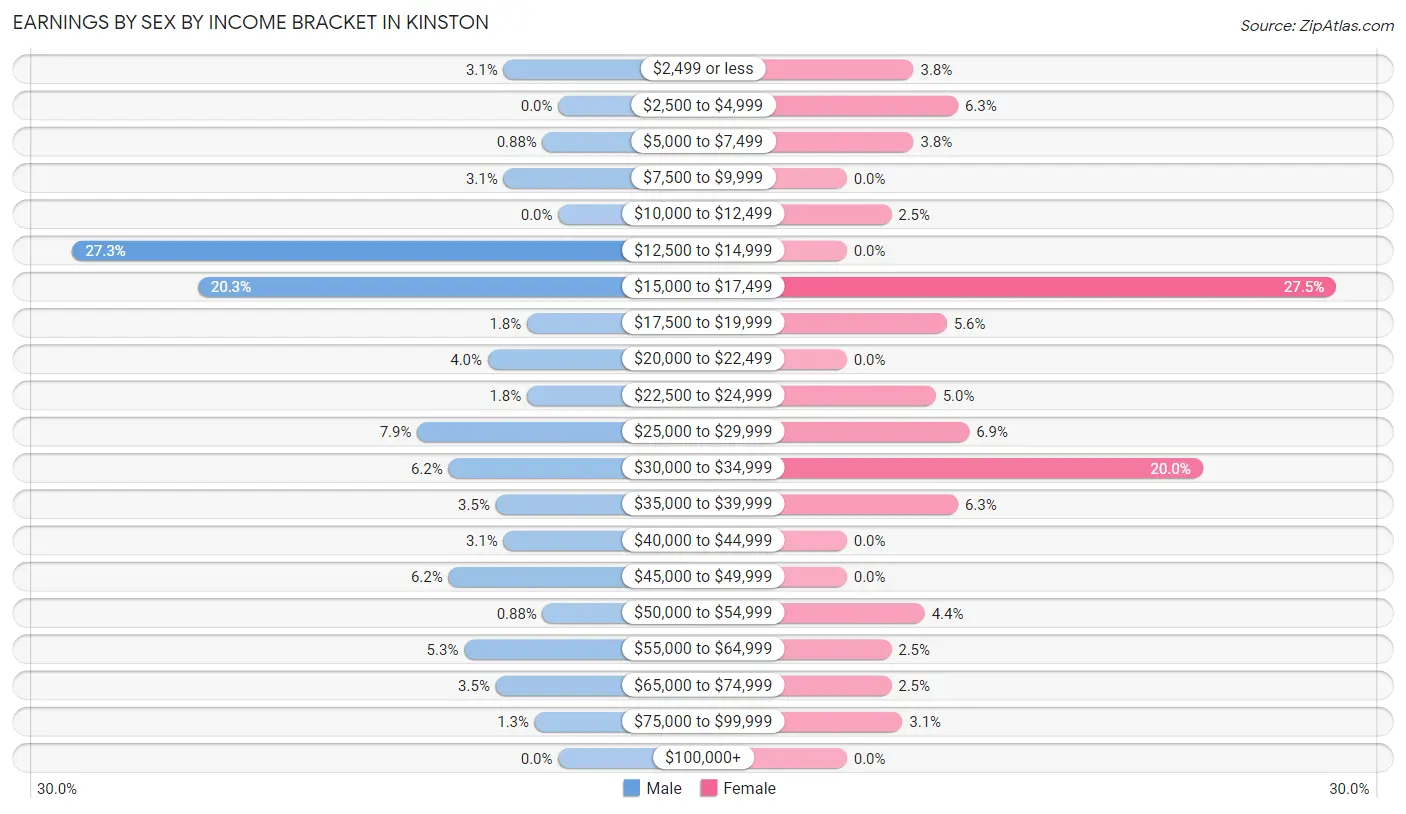
| Income | Male | Female |
| $2,499 or less | 7 (3.1%) | 6 (3.7%) |
| $2,500 to $4,999 | 0 (0.0%) | 10 (6.2%) |
| $5,000 to $7,499 | 2 (0.9%) | 6 (3.7%) |
| $7,500 to $9,999 | 7 (3.1%) | 0 (0.0%) |
| $10,000 to $12,499 | 0 (0.0%) | 4 (2.5%) |
| $12,500 to $14,999 | 62 (27.3%) | 0 (0.0%) |
| $15,000 to $17,499 | 46 (20.3%) | 44 (27.5%) |
| $17,500 to $19,999 | 4 (1.8%) | 9 (5.6%) |
| $20,000 to $22,499 | 9 (4.0%) | 0 (0.0%) |
| $22,500 to $24,999 | 4 (1.8%) | 8 (5.0%) |
| $25,000 to $29,999 | 18 (7.9%) | 11 (6.9%) |
| $30,000 to $34,999 | 14 (6.2%) | 32 (20.0%) |
| $35,000 to $39,999 | 8 (3.5%) | 10 (6.2%) |
| $40,000 to $44,999 | 7 (3.1%) | 0 (0.0%) |
| $45,000 to $49,999 | 14 (6.2%) | 0 (0.0%) |
| $50,000 to $54,999 | 2 (0.9%) | 7 (4.4%) |
| $55,000 to $64,999 | 12 (5.3%) | 4 (2.5%) |
| $65,000 to $74,999 | 8 (3.5%) | 4 (2.5%) |
| $75,000 to $99,999 | 3 (1.3%) | 5 (3.1%) |
| $100,000+ | 0 (0.0%) | 0 (0.0%) |
| Total | 227 (100.0%) | 160 (100.0%) |
Earnings by Sex by Educational Attainment in Kinston
Average earnings in Kinston are $21,667 for men and $25,278 for women, a difference of 14.3%. Men with an educational attainment of college or associate's degree enjoy the highest average annual earnings of $41,250, while those with high school diploma education earn the least with $14,496. Women with an educational attainment of bachelor's degree earn the most with the average annual earnings of $35,893, while those with college or associate's degree education have the smallest earnings of $32,708.
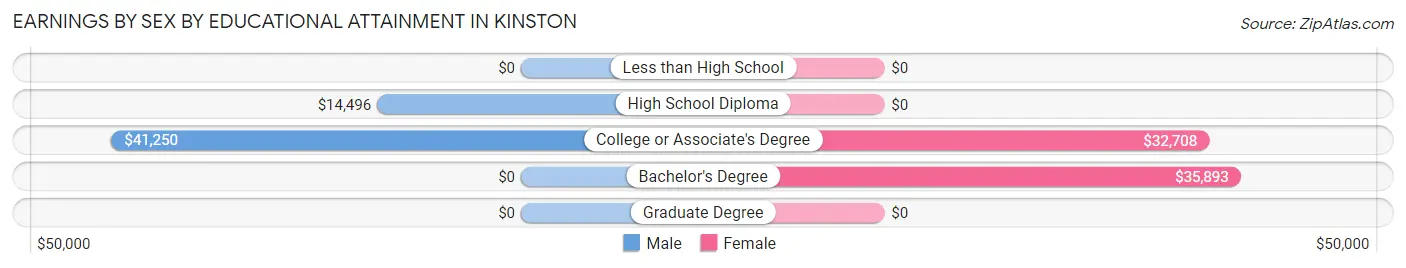
| Educational Attainment | Male Income | Female Income |
| Less than High School | - | - |
| High School Diploma | $14,496 | $0 |
| College or Associate's Degree | $41,250 | $32,708 |
| Bachelor's Degree | - | - |
| Graduate Degree | - | - |
| Total | $21,667 | $25,278 |
Family Income in Kinston
Family Income Brackets in Kinston
According to the Kinston family income data, there are 56 families falling into the $50,000 to $74,999 income range, which is the most common income bracket and makes up 39.2% of all families.
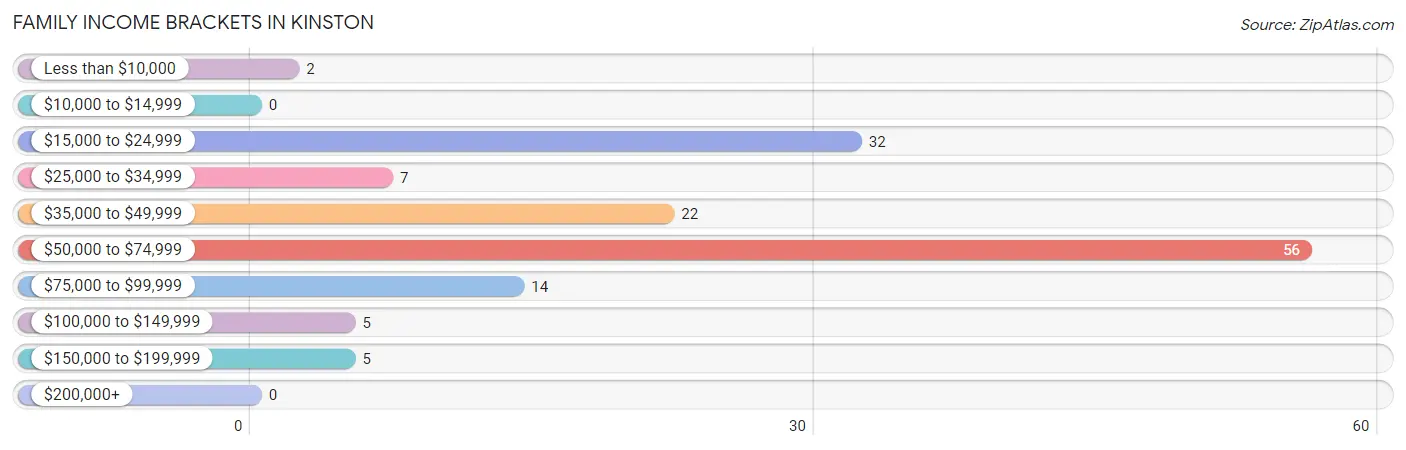
| Income Bracket | # Families | % Families |
| Less than $10,000 | 2 | 1.4% |
| $10,000 to $14,999 | 0 | 0.0% |
| $15,000 to $24,999 | 32 | 22.4% |
| $25,000 to $34,999 | 7 | 4.9% |
| $35,000 to $49,999 | 22 | 15.4% |
| $50,000 to $74,999 | 56 | 39.2% |
| $75,000 to $99,999 | 14 | 9.8% |
| $100,000 to $149,999 | 5 | 3.5% |
| $150,000 to $199,999 | 5 | 3.5% |
| $200,000+ | 0 | 0.0% |
Family Income by Famaliy Size in Kinston
4-person families (43 | 30.1%) account for the highest median family income in Kinston with $61,125 per family, while 2-person families (52 | 36.4%) have the highest median income of $23,125 per family member.
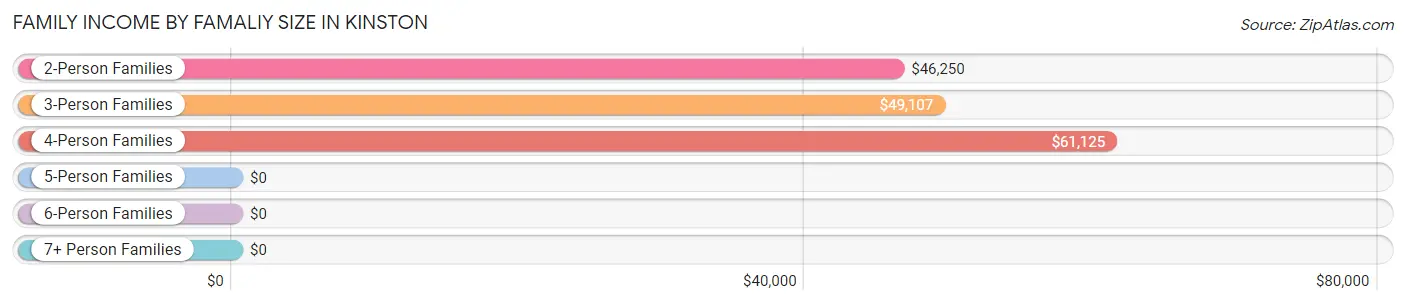
| Income Bracket | # Families | Median Income |
| 2-Person Families | 52 (36.4%) | $46,250 |
| 3-Person Families | 35 (24.5%) | $49,107 |
| 4-Person Families | 43 (30.1%) | $61,125 |
| 5-Person Families | 13 (9.1%) | $0 |
| 6-Person Families | 0 (0.0%) | $0 |
| 7+ Person Families | 0 (0.0%) | $0 |
| Total | 143 (100.0%) | $55,625 |
Family Income by Number of Earners in Kinston
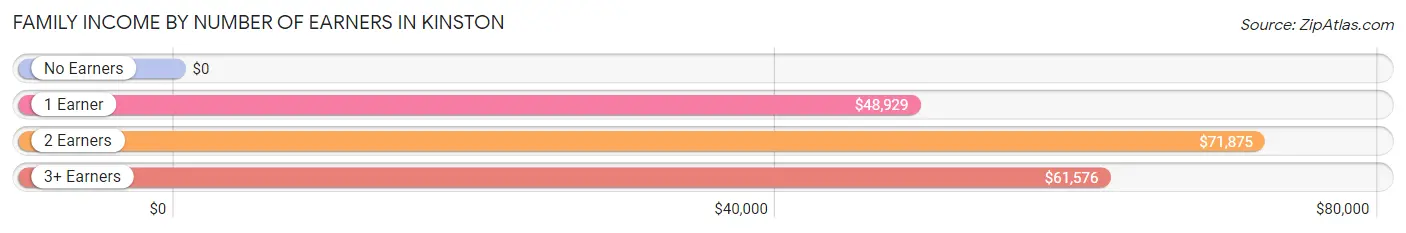
| Number of Earners | # Families | Median Income |
| No Earners | 37 (25.9%) | $0 |
| 1 Earner | 44 (30.8%) | $48,929 |
| 2 Earners | 33 (23.1%) | $71,875 |
| 3+ Earners | 29 (20.3%) | $61,576 |
| Total | 143 (100.0%) | $55,625 |
Household Income in Kinston
Household Income Brackets in Kinston
With 73 households falling in the category, the $50,000 to $74,999 income range is the most frequent in Kinston, accounting for 27.7% of all households.
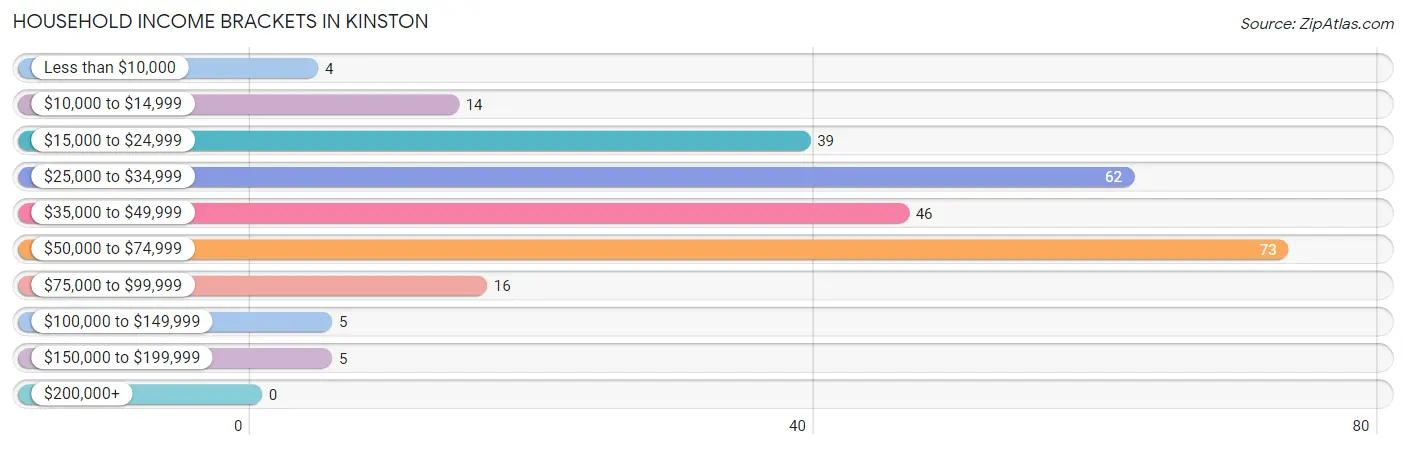
| Income Bracket | # Households | % Households |
| Less than $10,000 | 4 | 1.5% |
| $10,000 to $14,999 | 14 | 5.3% |
| $15,000 to $24,999 | 39 | 14.8% |
| $25,000 to $34,999 | 62 | 23.5% |
| $35,000 to $49,999 | 46 | 17.4% |
| $50,000 to $74,999 | 73 | 27.7% |
| $75,000 to $99,999 | 16 | 6.1% |
| $100,000 to $149,999 | 5 | 1.9% |
| $150,000 to $199,999 | 5 | 1.9% |
| $200,000+ | 0 | 0.0% |
Household Income by Householder Age in Kinston
The median household income in Kinston is $39,167, with the highest median household income of $48,750 found in the 25 to 44 years age bracket for the primary householder. A total of 75 households (28.4%) fall into this category. Meanwhile, the 45 to 64 years age bracket for the primary householder has the lowest median household income of $27,064, with 139 households (52.6%) in this group.
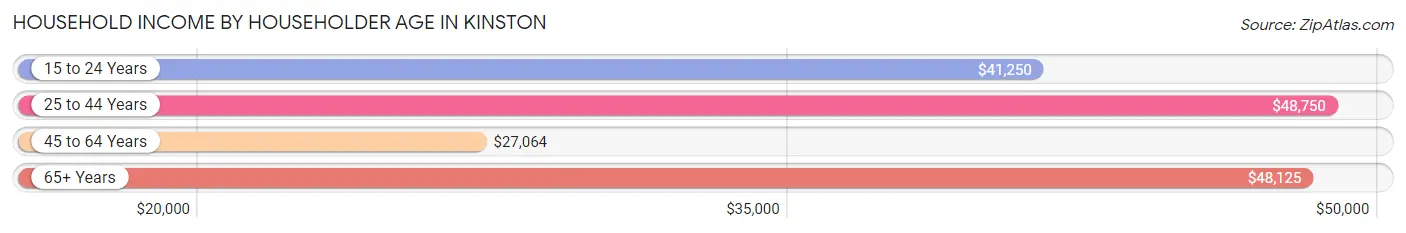
| Income Bracket | # Households | Median Income |
| 15 to 24 Years | 8 (3.0%) | $41,250 |
| 25 to 44 Years | 75 (28.4%) | $48,750 |
| 45 to 64 Years | 139 (52.6%) | $27,064 |
| 65+ Years | 42 (15.9%) | $48,125 |
| Total | 264 (100.0%) | $39,167 |
Poverty in Kinston
Income Below Poverty by Sex and Age in Kinston
With 15.7% poverty level for males and 34.8% for females among the residents of Kinston, 5 year old males and 45 to 54 year old females are the most vulnerable to poverty, with 7 males (77.8%) and 73 females (82.0%) in their respective age groups living below the poverty level.
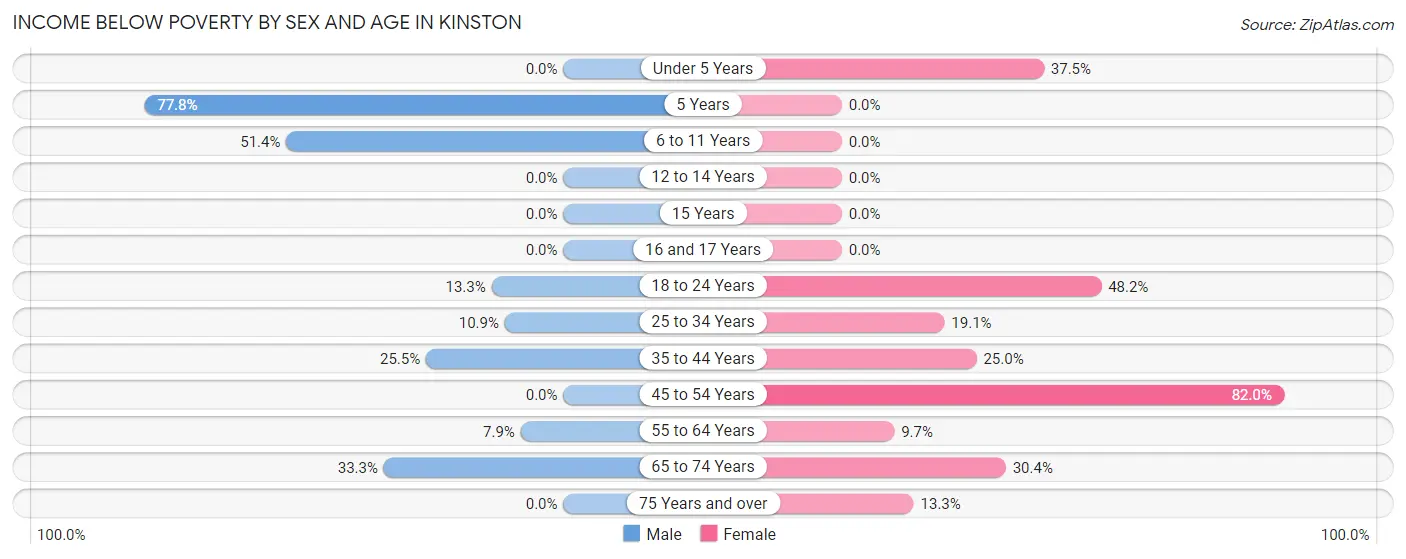
| Age Bracket | Male | Female |
| Under 5 Years | 0 (0.0%) | 6 (37.5%) |
| 5 Years | 7 (77.8%) | 0 (0.0%) |
| 6 to 11 Years | 18 (51.4%) | 0 (0.0%) |
| 12 to 14 Years | 0 (0.0%) | 0 (0.0%) |
| 15 Years | 0 (0.0%) | 0 (0.0%) |
| 16 and 17 Years | 0 (0.0%) | 0 (0.0%) |
| 18 to 24 Years | 10 (13.3%) | 13 (48.1%) |
| 25 to 34 Years | 5 (10.9%) | 8 (19.1%) |
| 35 to 44 Years | 13 (25.5%) | 5 (25.0%) |
| 45 to 54 Years | 0 (0.0%) | 73 (82.0%) |
| 55 to 64 Years | 8 (7.9%) | 11 (9.7%) |
| 65 to 74 Years | 5 (33.3%) | 7 (30.4%) |
| 75 Years and over | 0 (0.0%) | 2 (13.3%) |
| Total | 66 (15.7%) | 125 (34.8%) |
Income Above Poverty by Sex and Age in Kinston
According to the poverty statistics in Kinston, males aged under 5 years and females aged 6 to 11 years are the age groups that are most secure financially, with 100.0% of males and 100.0% of females in these age groups living above the poverty line.
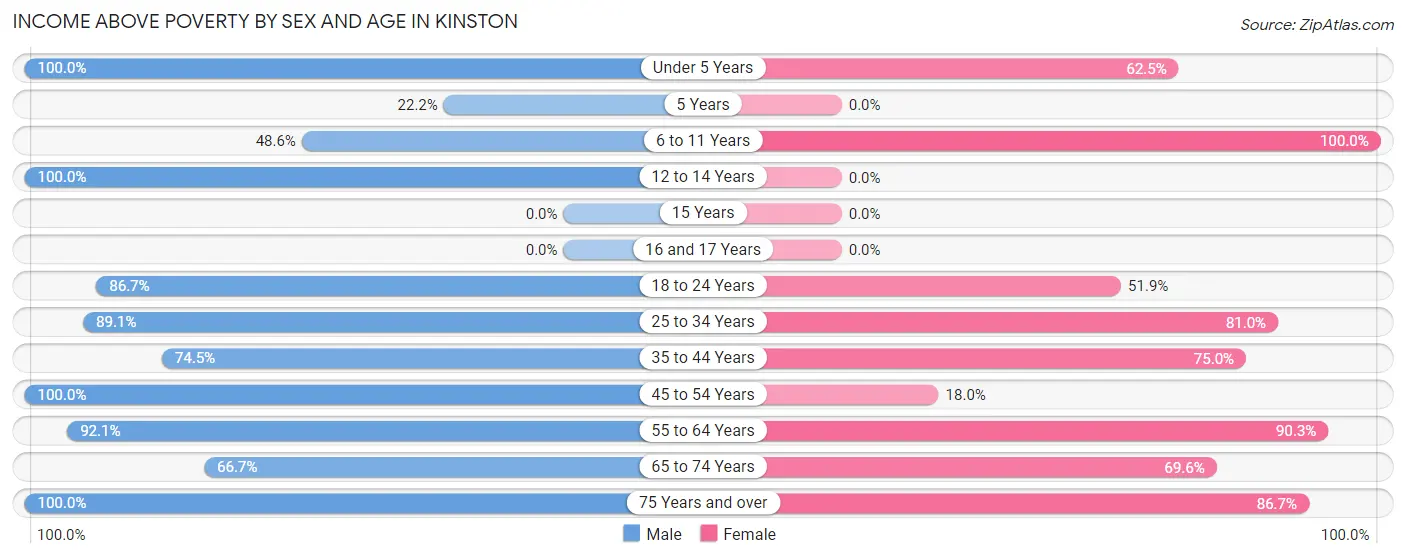
| Age Bracket | Male | Female |
| Under 5 Years | 16 (100.0%) | 10 (62.5%) |
| 5 Years | 2 (22.2%) | 0 (0.0%) |
| 6 to 11 Years | 17 (48.6%) | 14 (100.0%) |
| 12 to 14 Years | 34 (100.0%) | 0 (0.0%) |
| 15 Years | 0 (0.0%) | 0 (0.0%) |
| 16 and 17 Years | 0 (0.0%) | 0 (0.0%) |
| 18 to 24 Years | 65 (86.7%) | 14 (51.8%) |
| 25 to 34 Years | 41 (89.1%) | 34 (80.9%) |
| 35 to 44 Years | 38 (74.5%) | 15 (75.0%) |
| 45 to 54 Years | 24 (100.0%) | 16 (18.0%) |
| 55 to 64 Years | 93 (92.1%) | 102 (90.3%) |
| 65 to 74 Years | 10 (66.7%) | 16 (69.6%) |
| 75 Years and over | 15 (100.0%) | 13 (86.7%) |
| Total | 355 (84.3%) | 234 (65.2%) |
Income Below Poverty Among Married-Couple Families in Kinston
The poverty statistics for married-couple families in Kinston show that 13.6% or 12 of the total 88 families live below the poverty line. Families with 1 or 2 children have the highest poverty rate of 18.5%, comprising of 5 families. On the other hand, families with no children have the lowest poverty rate of 11.5%, which includes 7 families.
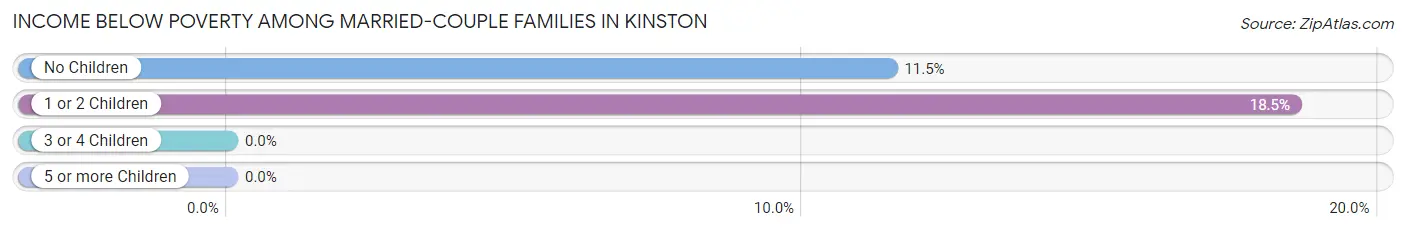
| Children | Above Poverty | Below Poverty |
| No Children | 54 (88.5%) | 7 (11.5%) |
| 1 or 2 Children | 22 (81.5%) | 5 (18.5%) |
| 3 or 4 Children | 0 (0.0%) | 0 (0.0%) |
| 5 or more Children | 0 (0.0%) | 0 (0.0%) |
| Total | 76 (86.4%) | 12 (13.6%) |
Income Below Poverty Among Single-Parent Households in Kinston
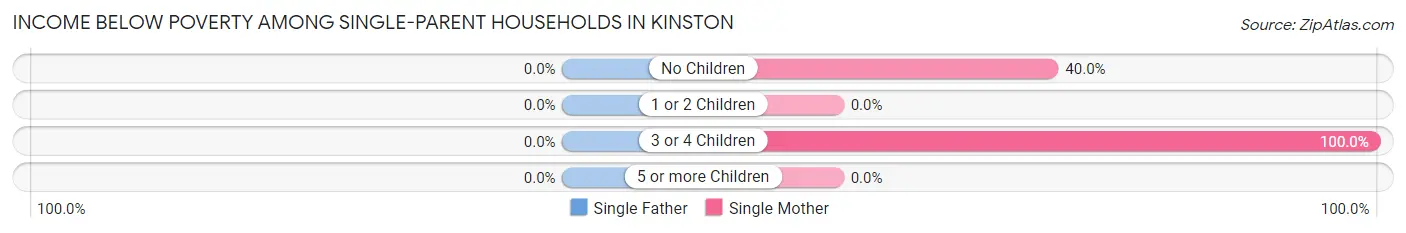
| Children | Single Father | Single Mother |
| No Children | 0 (0.0%) | 2 (40.0%) |
| 1 or 2 Children | 0 (0.0%) | 0 (0.0%) |
| 3 or 4 Children | 0 (0.0%) | 8 (100.0%) |
| 5 or more Children | 0 (0.0%) | 0 (0.0%) |
| Total | 0 (0.0%) | 10 (24.4%) |
Income Below Poverty Among Married-Couple vs Single-Parent Households in Kinston
The poverty data for Kinston shows that 12 of the married-couple family households (13.6%) and 10 of the single-parent households (18.2%) are living below the poverty level. Within the married-couple family households, those with 1 or 2 children have the highest poverty rate, with 5 households (18.5%) falling below the poverty line. Among the single-parent households, those with 3 or 4 children have the highest poverty rate, with 8 household (100.0%) living below poverty.
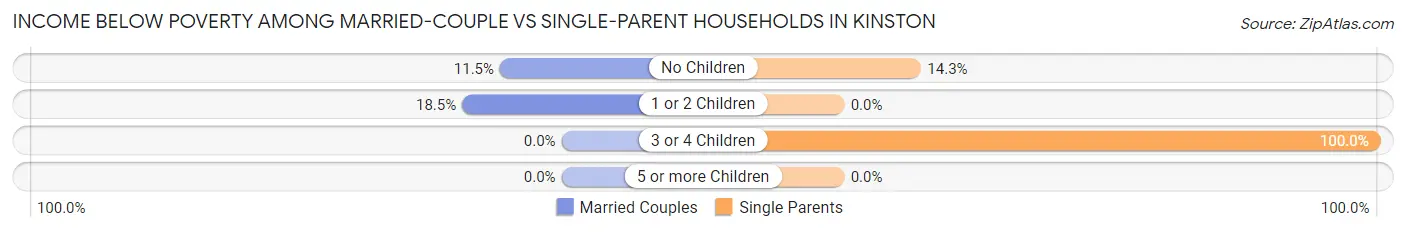
| Children | Married-Couple Families | Single-Parent Households |
| No Children | 7 (11.5%) | 2 (14.3%) |
| 1 or 2 Children | 5 (18.5%) | 0 (0.0%) |
| 3 or 4 Children | 0 (0.0%) | 8 (100.0%) |
| 5 or more Children | 0 (0.0%) | 0 (0.0%) |
| Total | 12 (13.6%) | 10 (18.2%) |
Race in Kinston
The most populous races in Kinston are White / Caucasian (761 | 95.5%), Hispanic or Latino (27 | 3.4%), and Asian (17 | 2.1%).
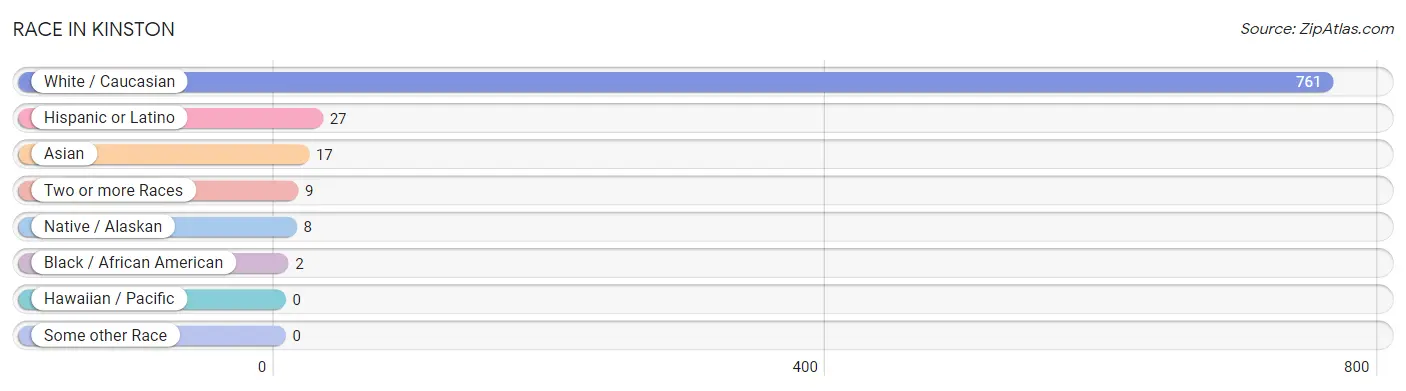
| Race | # Population | % Population |
| Asian | 17 | 2.1% |
| Black / African American | 2 | 0.3% |
| Hawaiian / Pacific | 0 | 0.0% |
| Hispanic or Latino | 27 | 3.4% |
| Native / Alaskan | 8 | 1.0% |
| White / Caucasian | 761 | 95.5% |
| Two or more Races | 9 | 1.1% |
| Some other Race | 0 | 0.0% |
| Total | 797 | 100.0% |
Ancestry in Kinston
The most populous ancestries reported in Kinston are English (287 | 36.0%), Irish (123 | 15.4%), American (76 | 9.5%), Italian (40 | 5.0%), and German (18 | 2.3%), together accounting for 68.3% of all Kinston residents.
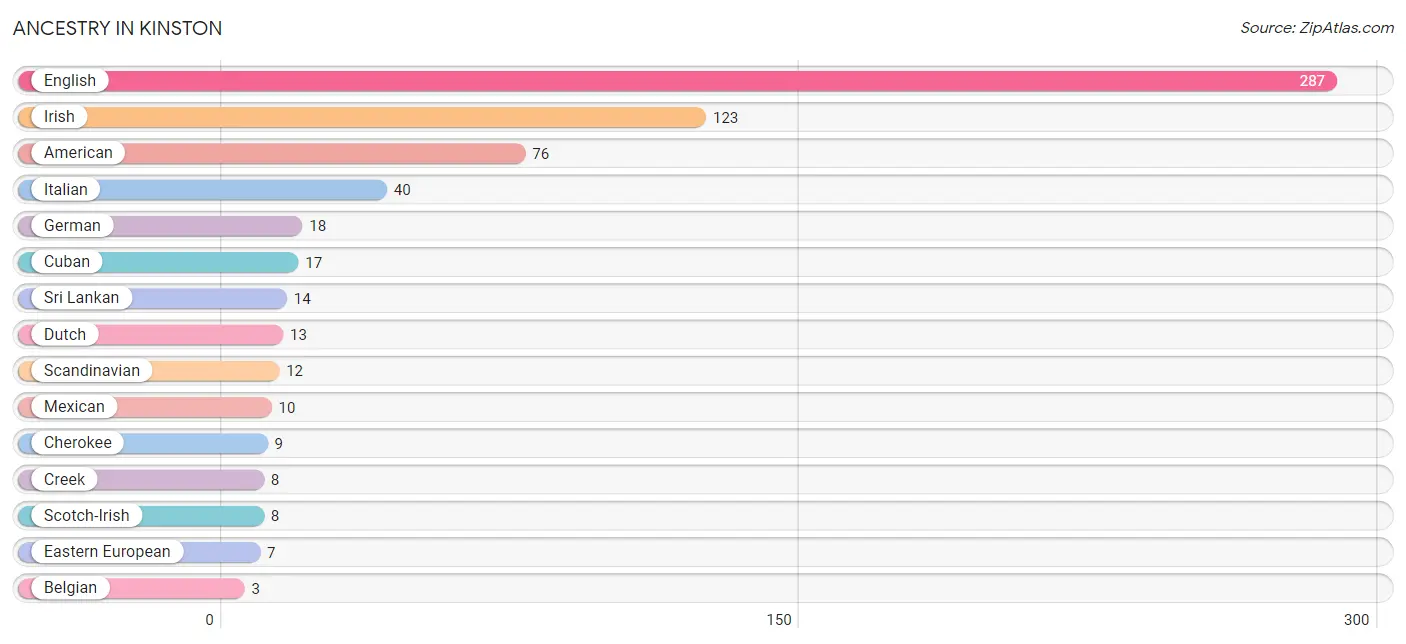
| Ancestry | # Population | % Population |
| American | 76 | 9.5% |
| Belgian | 3 | 0.4% |
| British | 2 | 0.3% |
| Cherokee | 9 | 1.1% |
| Creek | 8 | 1.0% |
| Cuban | 17 | 2.1% |
| Dutch | 13 | 1.6% |
| Eastern European | 7 | 0.9% |
| English | 287 | 36.0% |
| European | 3 | 0.4% |
| German | 18 | 2.3% |
| Indian (Asian) | 3 | 0.4% |
| Irish | 123 | 15.4% |
| Italian | 40 | 5.0% |
| Mexican | 10 | 1.3% |
| Scandinavian | 12 | 1.5% |
| Scotch-Irish | 8 | 1.0% |
| Scottish | 2 | 0.3% |
| Sri Lankan | 14 | 1.8% | View All 19 Rows |
Immigrants in Kinston
The most numerous immigrant groups reported in Kinston came from Asia (8 | 1.0%), South Eastern Asia (5 | 0.6%), Vietnam (5 | 0.6%), China (3 | 0.4%), and Eastern Asia (3 | 0.4%), together accounting for 3.0% of all Kinston residents.
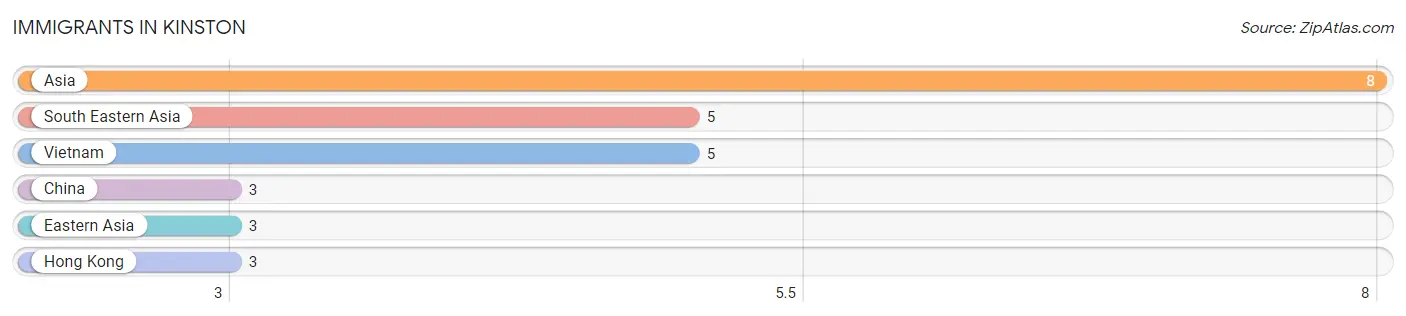
| Immigration Origin | # Population | % Population |
| Asia | 8 | 1.0% |
| China | 3 | 0.4% |
| Eastern Asia | 3 | 0.4% |
| Hong Kong | 3 | 0.4% |
| South Eastern Asia | 5 | 0.6% |
| Vietnam | 5 | 0.6% | View All 6 Rows |
Sex and Age in Kinston
Sex and Age in Kinston
The most populous age groups in Kinston are 55 to 59 Years (70 | 16.3%) for men and 60 to 64 Years (89 | 24.2%) for women.
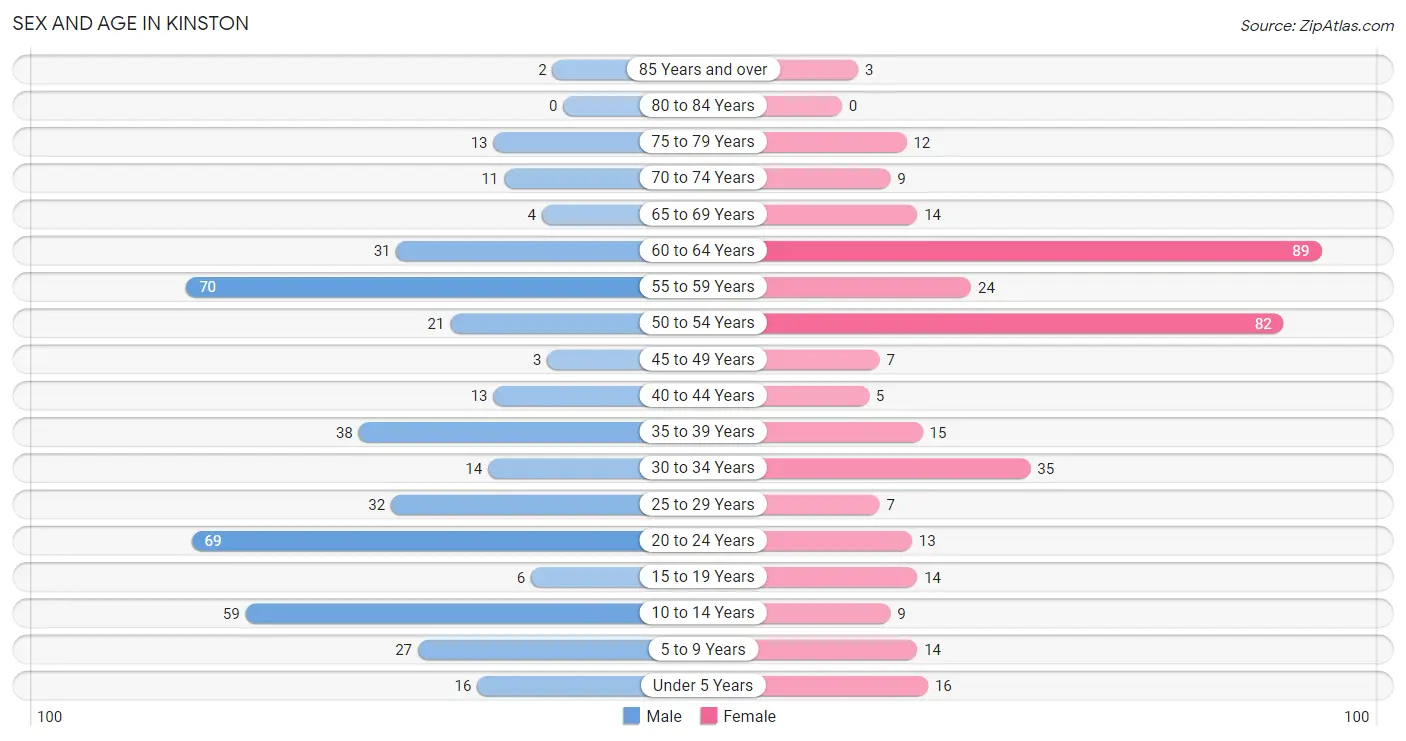
| Age Bracket | Male | Female |
| Under 5 Years | 16 (3.7%) | 16 (4.3%) |
| 5 to 9 Years | 27 (6.3%) | 14 (3.8%) |
| 10 to 14 Years | 59 (13.8%) | 9 (2.5%) |
| 15 to 19 Years | 6 (1.4%) | 14 (3.8%) |
| 20 to 24 Years | 69 (16.1%) | 13 (3.5%) |
| 25 to 29 Years | 32 (7.5%) | 7 (1.9%) |
| 30 to 34 Years | 14 (3.3%) | 35 (9.5%) |
| 35 to 39 Years | 38 (8.9%) | 15 (4.1%) |
| 40 to 44 Years | 13 (3.0%) | 5 (1.4%) |
| 45 to 49 Years | 3 (0.7%) | 7 (1.9%) |
| 50 to 54 Years | 21 (4.9%) | 82 (22.3%) |
| 55 to 59 Years | 70 (16.3%) | 24 (6.5%) |
| 60 to 64 Years | 31 (7.2%) | 89 (24.2%) |
| 65 to 69 Years | 4 (0.9%) | 14 (3.8%) |
| 70 to 74 Years | 11 (2.6%) | 9 (2.5%) |
| 75 to 79 Years | 13 (3.0%) | 12 (3.3%) |
| 80 to 84 Years | 0 (0.0%) | 0 (0.0%) |
| 85 Years and over | 2 (0.5%) | 3 (0.8%) |
| Total | 429 (100.0%) | 368 (100.0%) |
Families and Households in Kinston
Median Family Size in Kinston
The median family size in Kinston is 3.80 persons per family, with single female/mother families (41 | 28.7%) accounting for the largest median family size of 5.54 persons per family. On the other hand, married-couple families (88 | 61.5%) represent the smallest median family size with 3.06 persons per family.
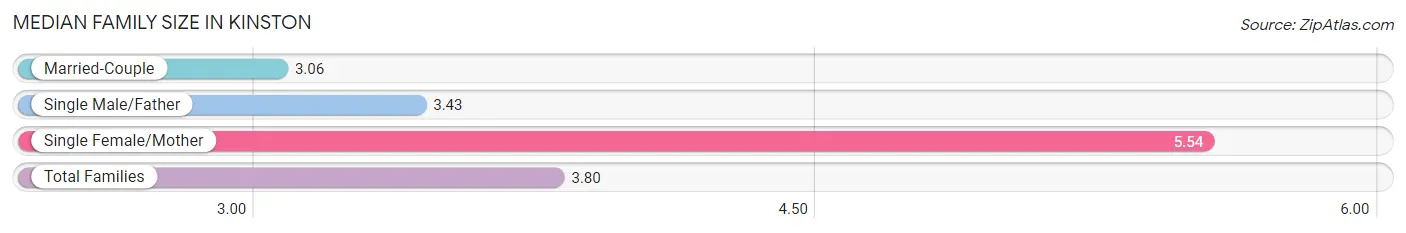
| Family Type | # Families | Family Size |
| Married-Couple | 88 (61.5%) | 3.06 |
| Single Male/Father | 14 (9.8%) | 3.43 |
| Single Female/Mother | 41 (28.7%) | 5.54 |
| Total Families | 143 (100.0%) | 3.80 |
Median Household Size in Kinston
The median household size in Kinston is 3.02 persons per household, with single female/mother households (41 | 15.5%) accounting for the largest median household size of 7.49 persons per household. non-family households (121 | 45.8%) represent the smallest median household size with 1.13 persons per household.
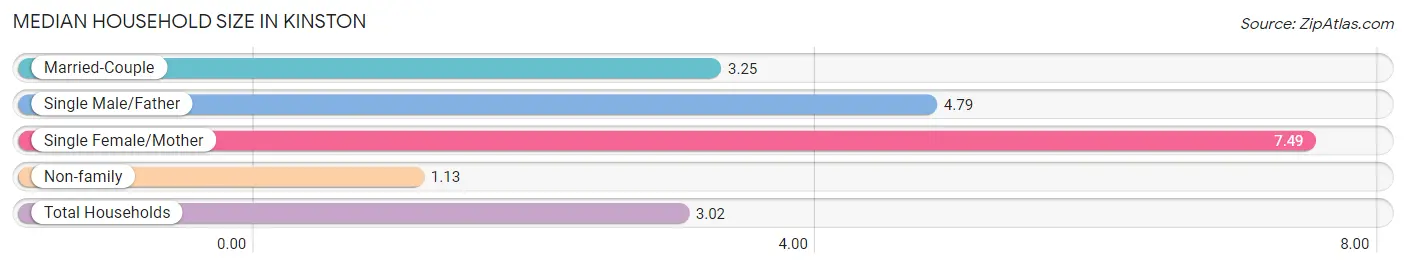
| Household Type | # Households | Household Size |
| Married-Couple | 88 (33.3%) | 3.25 |
| Single Male/Father | 14 (5.3%) | 4.79 |
| Single Female/Mother | 41 (15.5%) | 7.49 |
| Non-family | 121 (45.8%) | 1.13 |
| Total Households | 264 (100.0%) | 3.02 |
Household Size by Marriage Status in Kinston
Out of a total of 264 households in Kinston, 143 (54.2%) are family households, while 121 (45.8%) are nonfamily households. The most numerous type of family households are 2-person households, comprising 46, and the most common type of nonfamily households are 1-person households, comprising 110.
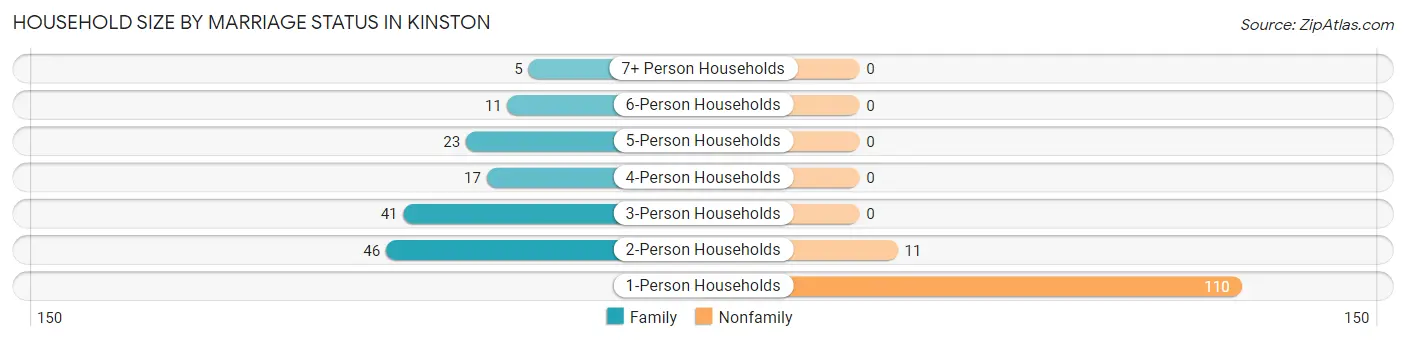
| Household Size | Family Households | Nonfamily Households |
| 1-Person Households | - | 110 (41.7%) |
| 2-Person Households | 46 (17.4%) | 11 (4.2%) |
| 3-Person Households | 41 (15.5%) | 0 (0.0%) |
| 4-Person Households | 17 (6.4%) | 0 (0.0%) |
| 5-Person Households | 23 (8.7%) | 0 (0.0%) |
| 6-Person Households | 11 (4.2%) | 0 (0.0%) |
| 7+ Person Households | 5 (1.9%) | 0 (0.0%) |
| Total | 143 (54.2%) | 121 (45.8%) |
Female Fertility in Kinston
Fertility by Age in Kinston
| Age Bracket | Women with Births | Births / 1,000 Women |
| 15 to 19 years | 0 (0.0%) | 0.0 |
| 20 to 34 years | 0 (0.0%) | 0.0 |
| 35 to 50 years | 0 (0.0%) | 0.0 |
| Total | 0 (0.0%) | 0.0 |
Fertility by Age by Marriage Status in Kinston
| Age Bracket | Married | Unmarried |
| 15 to 19 years | 0 (0.0%) | 0 (0.0%) |
| 20 to 34 years | 0 (0.0%) | 0 (0.0%) |
| 35 to 50 years | 0 (0.0%) | 0 (0.0%) |
| Total | 0 (0.0%) | 0 (0.0%) |
Fertility by Education in Kinston
| Educational Attainment | Women with Births | Births / 1,000 Women |
| Less than High School | 0 (0.0%) | 0.0 |
| High School Diploma | 0 (0.0%) | 0.0 |
| College or Associate's Degree | 0 (0.0%) | 0.0 |
| Bachelor's Degree | 0 (0.0%) | 0.0 |
| Graduate Degree | 0 (0.0%) | 0.0 |
| Total | 0 (0.0%) | 0.0 |
Fertility by Education by Marriage Status in Kinston
| Educational Attainment | Married | Unmarried |
| Less than High School | 0 (0.0%) | 0 (0.0%) |
| High School Diploma | 0 (0.0%) | 0 (0.0%) |
| College or Associate's Degree | 0 (0.0%) | 0 (0.0%) |
| Bachelor's Degree | 0 (0.0%) | 0 (0.0%) |
| Graduate Degree | 0 (0.0%) | 0 (0.0%) |
| Total | 0 (0.0%) | 0 (0.0%) |
Employment Characteristics in Kinston
Employment by Class of Employer in Kinston
Among the 289 employed individuals in Kinston, private company employees (201 | 69.6%), federal government employees (45 | 15.6%), and local government employees (16 | 5.5%) make up the most common classes of employment.
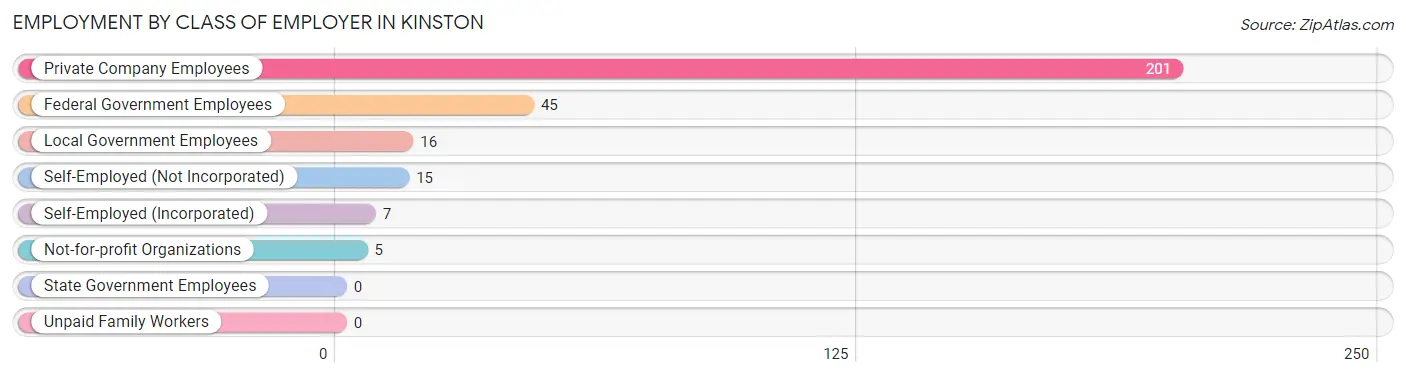
| Employer Class | # Employees | % Employees |
| Private Company Employees | 201 | 69.6% |
| Self-Employed (Incorporated) | 7 | 2.4% |
| Self-Employed (Not Incorporated) | 15 | 5.2% |
| Not-for-profit Organizations | 5 | 1.7% |
| Local Government Employees | 16 | 5.5% |
| State Government Employees | 0 | 0.0% |
| Federal Government Employees | 45 | 15.6% |
| Unpaid Family Workers | 0 | 0.0% |
| Total | 289 | 100.0% |
Employment Status by Age in Kinston
According to the labor force statistics for Kinston, out of the total population over 16 years of age (656), 57.2% or 375 individuals are in the labor force, with 20.5% or 77 of them unemployed. The age group with the highest labor force participation rate is 25 to 29 years, with 92.3% or 36 individuals in the labor force. Within the labor force, the 16 to 19 years age range has the highest percentage of unemployed individuals, with 100.0% or 13 of them being unemployed.
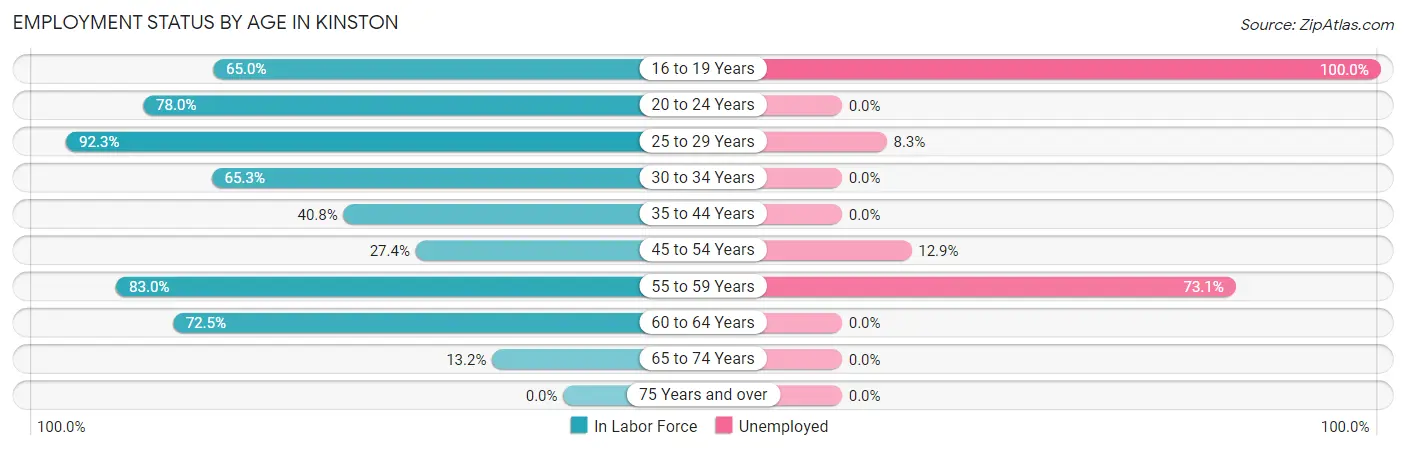
| Age Bracket | In Labor Force | Unemployed |
| 16 to 19 Years | 13 (65.0%) | 13 (100.0%) |
| 20 to 24 Years | 64 (78.0%) | 0 (0.0%) |
| 25 to 29 Years | 36 (92.3%) | 3 (8.3%) |
| 30 to 34 Years | 32 (65.3%) | 0 (0.0%) |
| 35 to 44 Years | 29 (40.8%) | 0 (0.0%) |
| 45 to 54 Years | 31 (27.4%) | 4 (12.9%) |
| 55 to 59 Years | 78 (83.0%) | 57 (73.1%) |
| 60 to 64 Years | 87 (72.5%) | 0 (0.0%) |
| 65 to 74 Years | 5 (13.2%) | 0 (0.0%) |
| 75 Years and over | 0 (0.0%) | 0 (0.0%) |
| Total | 375 (57.2%) | 77 (20.5%) |
Employment Status by Educational Attainment in Kinston
According to labor force statistics for Kinston, 60.3% of individuals (293) out of the total population between 25 and 64 years of age (486) are in the labor force, with 21.8% or 64 of them being unemployed. The group with the highest labor force participation rate are those with the educational attainment of bachelor's degree or higher, with 91.5% or 43 individuals in the labor force. Within the labor force, individuals with high school diploma education have the highest percentage of unemployment, with 51.7% or 60 of them being unemployed.
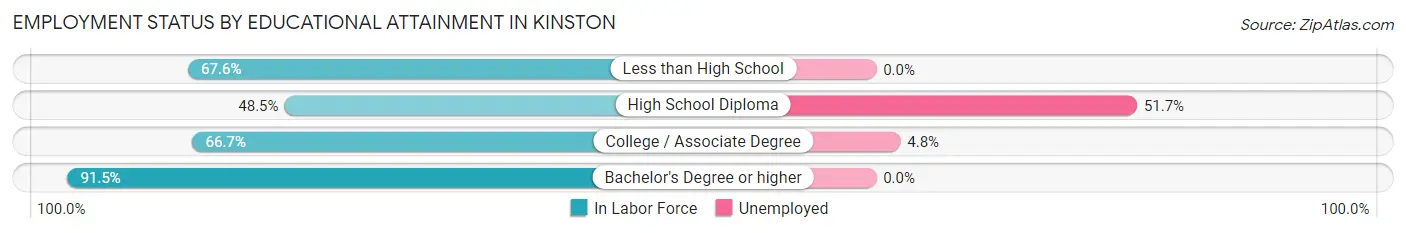
| Educational Attainment | In Labor Force | Unemployed |
| Less than High School | 50 (67.6%) | 0 (0.0%) |
| High School Diploma | 116 (48.5%) | 124 (51.7%) |
| College / Associate Degree | 84 (66.7%) | 6 (4.8%) |
| Bachelor's Degree or higher | 43 (91.5%) | 0 (0.0%) |
| Total | 293 (60.3%) | 106 (21.8%) |
Employment Occupations by Sex in Kinston
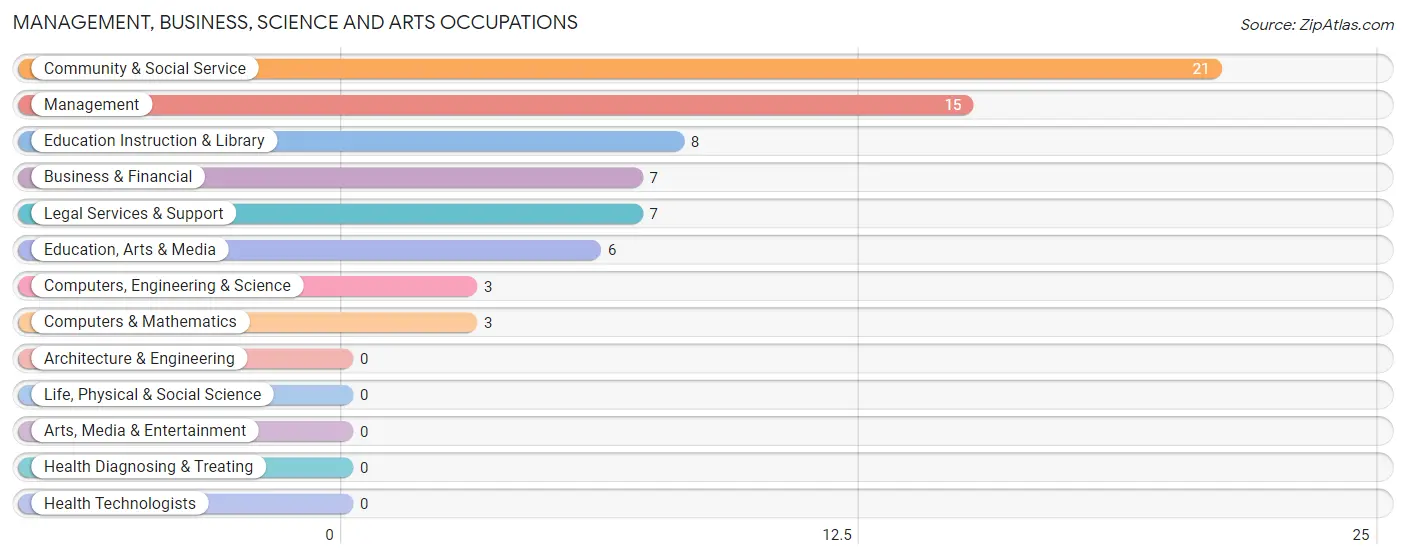
Management, Business, Science and Arts Occupations
The most common Management, Business, Science and Arts occupations in Kinston are Community & Social Service (21 | 7.0%), Management (15 | 5.0%), Education Instruction & Library (8 | 2.7%), Business & Financial (7 | 2.4%), and Legal Services & Support (7 | 2.4%).
Management, Business, Science and Arts Occupations by Sex
Within the Management, Business, Science and Arts occupations in Kinston, the most male-oriented occupations are Computers, Engineering & Science (100.0%), Computers & Mathematics (100.0%), and Education, Arts & Media (100.0%), while the most female-oriented occupations are Business & Financial (100.0%), Legal Services & Support (100.0%), and Management (66.7%).
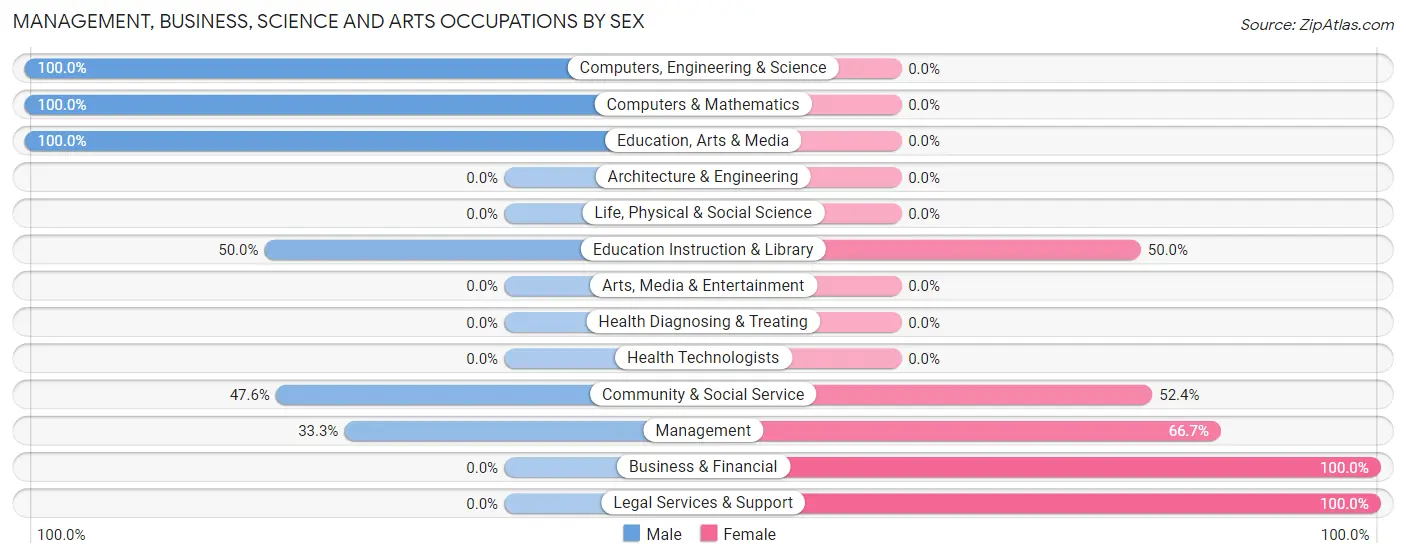
| Occupation | Male | Female |
| Management | 5 (33.3%) | 10 (66.7%) |
| Business & Financial | 0 (0.0%) | 7 (100.0%) |
| Computers, Engineering & Science | 3 (100.0%) | 0 (0.0%) |
| Computers & Mathematics | 3 (100.0%) | 0 (0.0%) |
| Architecture & Engineering | 0 (0.0%) | 0 (0.0%) |
| Life, Physical & Social Science | 0 (0.0%) | 0 (0.0%) |
| Community & Social Service | 10 (47.6%) | 11 (52.4%) |
| Education, Arts & Media | 6 (100.0%) | 0 (0.0%) |
| Legal Services & Support | 0 (0.0%) | 7 (100.0%) |
| Education Instruction & Library | 4 (50.0%) | 4 (50.0%) |
| Arts, Media & Entertainment | 0 (0.0%) | 0 (0.0%) |
| Health Diagnosing & Treating | 0 (0.0%) | 0 (0.0%) |
| Health Technologists | 0 (0.0%) | 0 (0.0%) |
| Total (Category) | 18 (39.1%) | 28 (60.9%) |
| Total (Overall) | 156 (52.3%) | 142 (47.6%) |
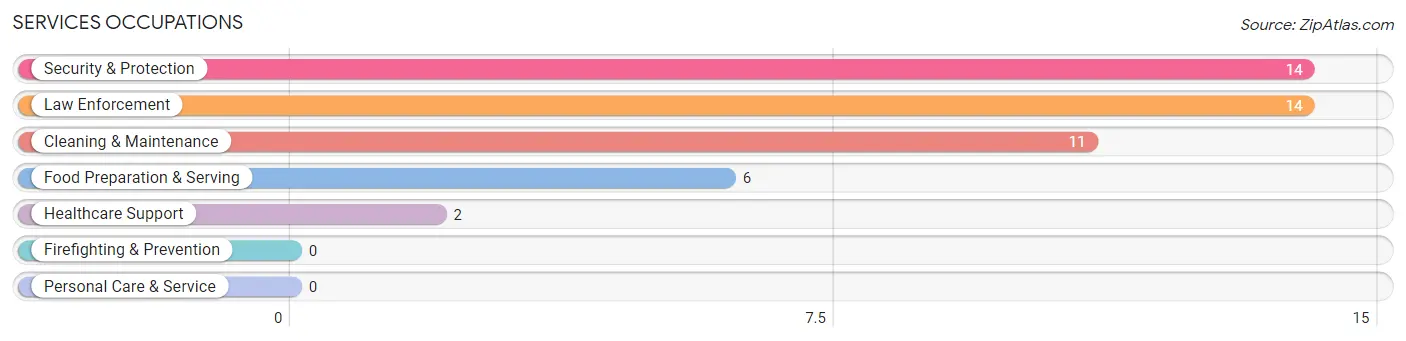
Services Occupations
The most common Services occupations in Kinston are Security & Protection (14 | 4.7%), Law Enforcement (14 | 4.7%), Cleaning & Maintenance (11 | 3.7%), Food Preparation & Serving (6 | 2.0%), and Healthcare Support (2 | 0.7%).
Services Occupations by Sex
Within the Services occupations in Kinston, the most male-oriented occupations are Security & Protection (100.0%), Law Enforcement (100.0%), and Cleaning & Maintenance (54.5%), while the most female-oriented occupations are Healthcare Support (100.0%), Food Preparation & Serving (100.0%), and Cleaning & Maintenance (45.5%).
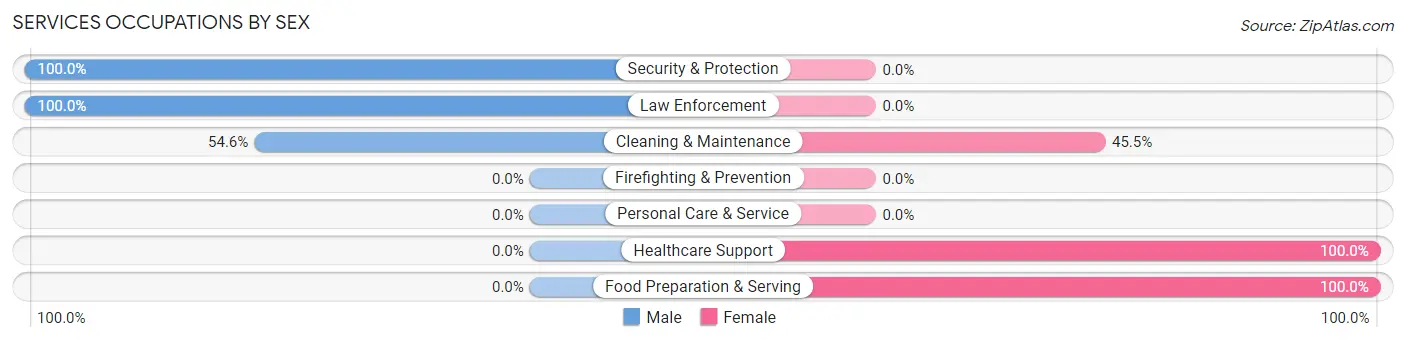
| Occupation | Male | Female |
| Healthcare Support | 0 (0.0%) | 2 (100.0%) |
| Security & Protection | 14 (100.0%) | 0 (0.0%) |
| Firefighting & Prevention | 0 (0.0%) | 0 (0.0%) |
| Law Enforcement | 14 (100.0%) | 0 (0.0%) |
| Food Preparation & Serving | 0 (0.0%) | 6 (100.0%) |
| Cleaning & Maintenance | 6 (54.5%) | 5 (45.5%) |
| Personal Care & Service | 0 (0.0%) | 0 (0.0%) |
| Total (Category) | 20 (60.6%) | 13 (39.4%) |
| Total (Overall) | 156 (52.3%) | 142 (47.6%) |
Sales and Office Occupations
The most common Sales and Office occupations in Kinston are Sales & Related (30 | 10.1%), and Office & Administration (17 | 5.7%).
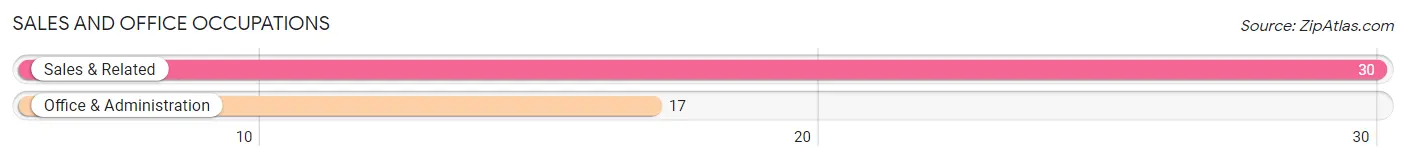
Sales and Office Occupations by Sex
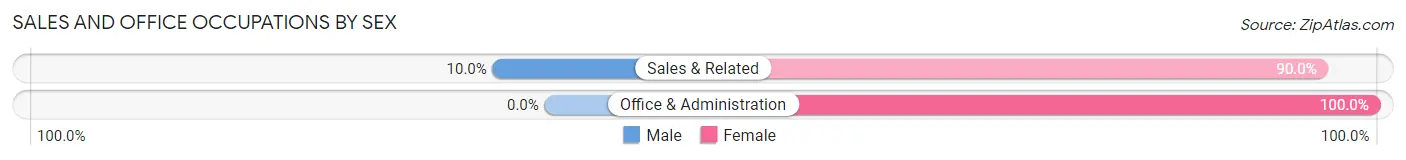
| Occupation | Male | Female |
| Sales & Related | 3 (10.0%) | 27 (90.0%) |
| Office & Administration | 0 (0.0%) | 17 (100.0%) |
| Total (Category) | 3 (6.4%) | 44 (93.6%) |
| Total (Overall) | 156 (52.3%) | 142 (47.6%) |
Natural Resources, Construction and Maintenance Occupations
The most common Natural Resources, Construction and Maintenance occupations in Kinston are Farming, Fishing & Forestry (45 | 15.1%), Installation, Maintenance & Repair (29 | 9.7%), and Construction & Extraction (19 | 6.4%).
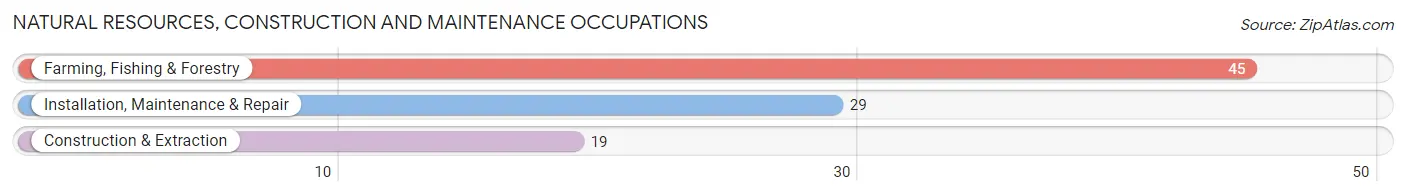
Natural Resources, Construction and Maintenance Occupations by Sex
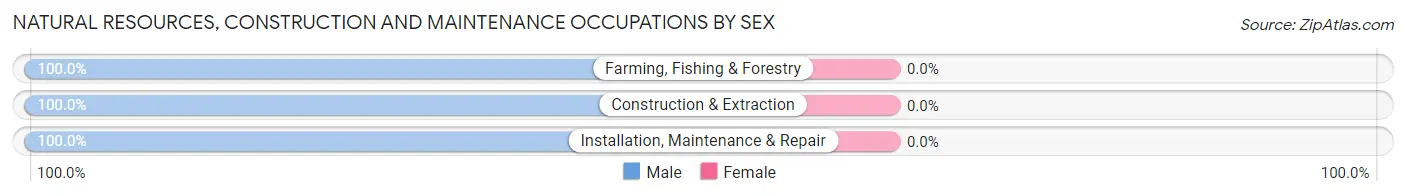
| Occupation | Male | Female |
| Farming, Fishing & Forestry | 45 (100.0%) | 0 (0.0%) |
| Construction & Extraction | 19 (100.0%) | 0 (0.0%) |
| Installation, Maintenance & Repair | 29 (100.0%) | 0 (0.0%) |
| Total (Category) | 93 (100.0%) | 0 (0.0%) |
| Total (Overall) | 156 (52.3%) | 142 (47.6%) |
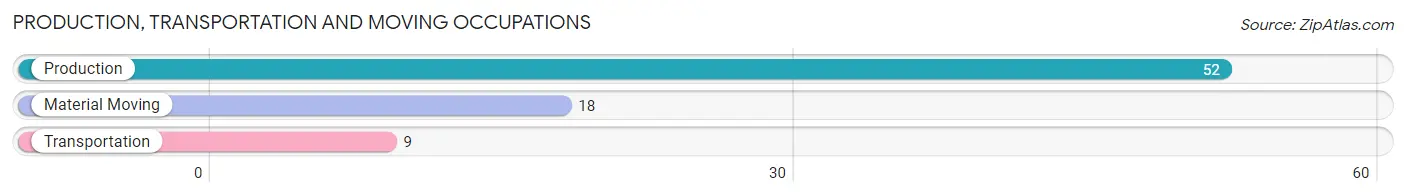
Production, Transportation and Moving Occupations
The most common Production, Transportation and Moving occupations in Kinston are Production (52 | 17.4%), Material Moving (18 | 6.0%), and Transportation (9 | 3.0%).
Production, Transportation and Moving Occupations by Sex
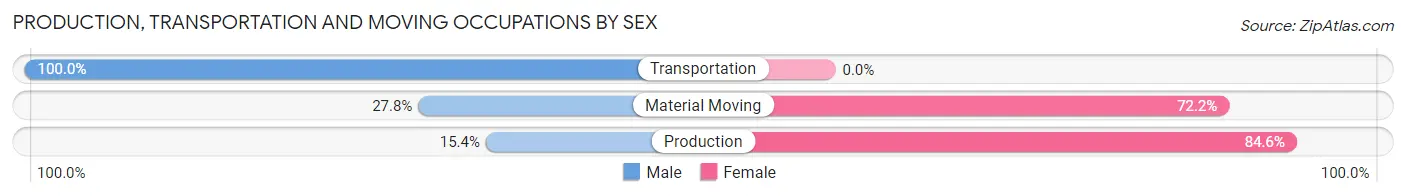
| Occupation | Male | Female |
| Production | 8 (15.4%) | 44 (84.6%) |
| Transportation | 9 (100.0%) | 0 (0.0%) |
| Material Moving | 5 (27.8%) | 13 (72.2%) |
| Total (Category) | 22 (27.9%) | 57 (72.2%) |
| Total (Overall) | 156 (52.3%) | 142 (47.6%) |
Employment Industries by Sex in Kinston
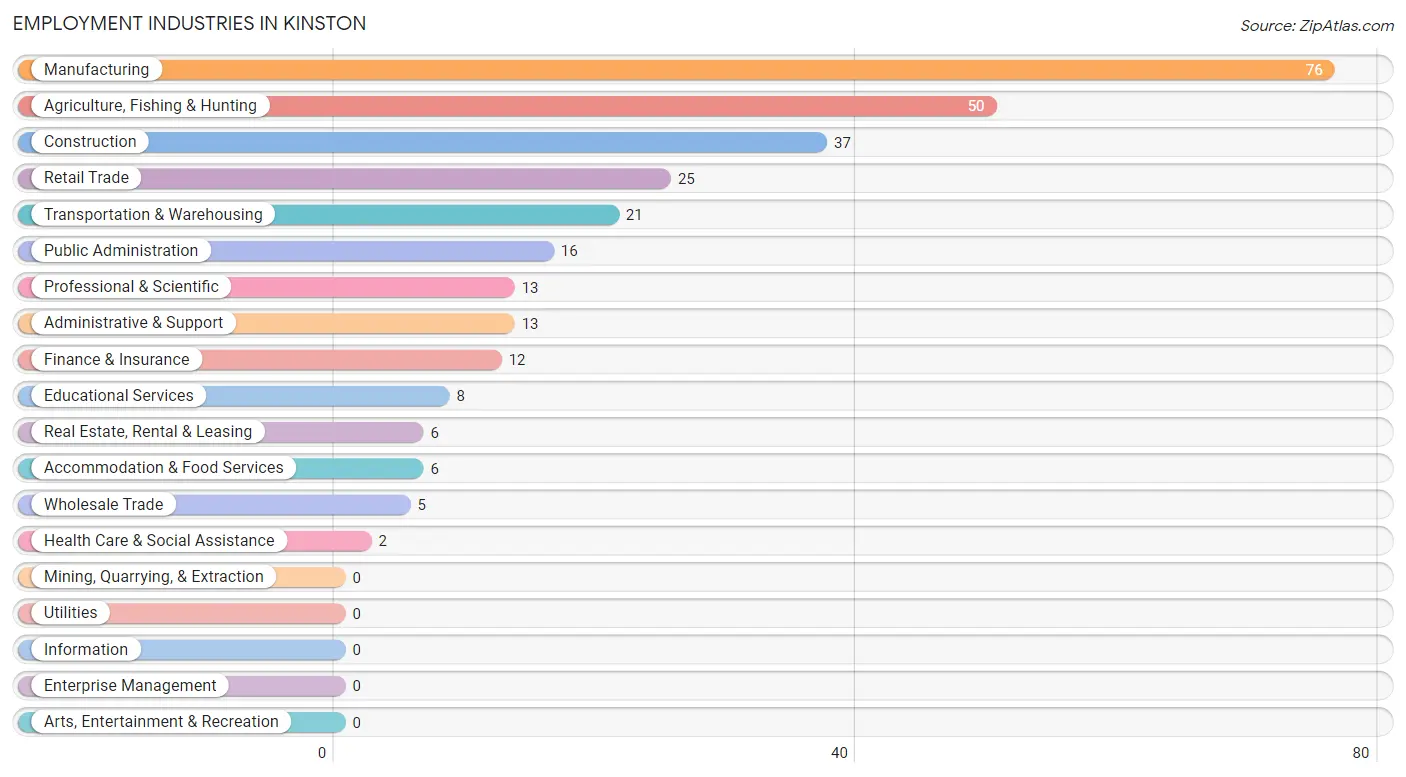
Employment Industries in Kinston
The major employment industries in Kinston include Manufacturing (76 | 25.5%), Agriculture, Fishing & Hunting (50 | 16.8%), Construction (37 | 12.4%), Retail Trade (25 | 8.4%), and Transportation & Warehousing (21 | 7.0%).
Employment Industries by Sex in Kinston
The Kinston industries that see more men than women are Construction (100.0%), Wholesale Trade (100.0%), and Agriculture, Fishing & Hunting (94.0%), whereas the industries that tend to have a higher number of women are Finance & Insurance (100.0%), Real Estate, Rental & Leasing (100.0%), and Health Care & Social Assistance (100.0%).
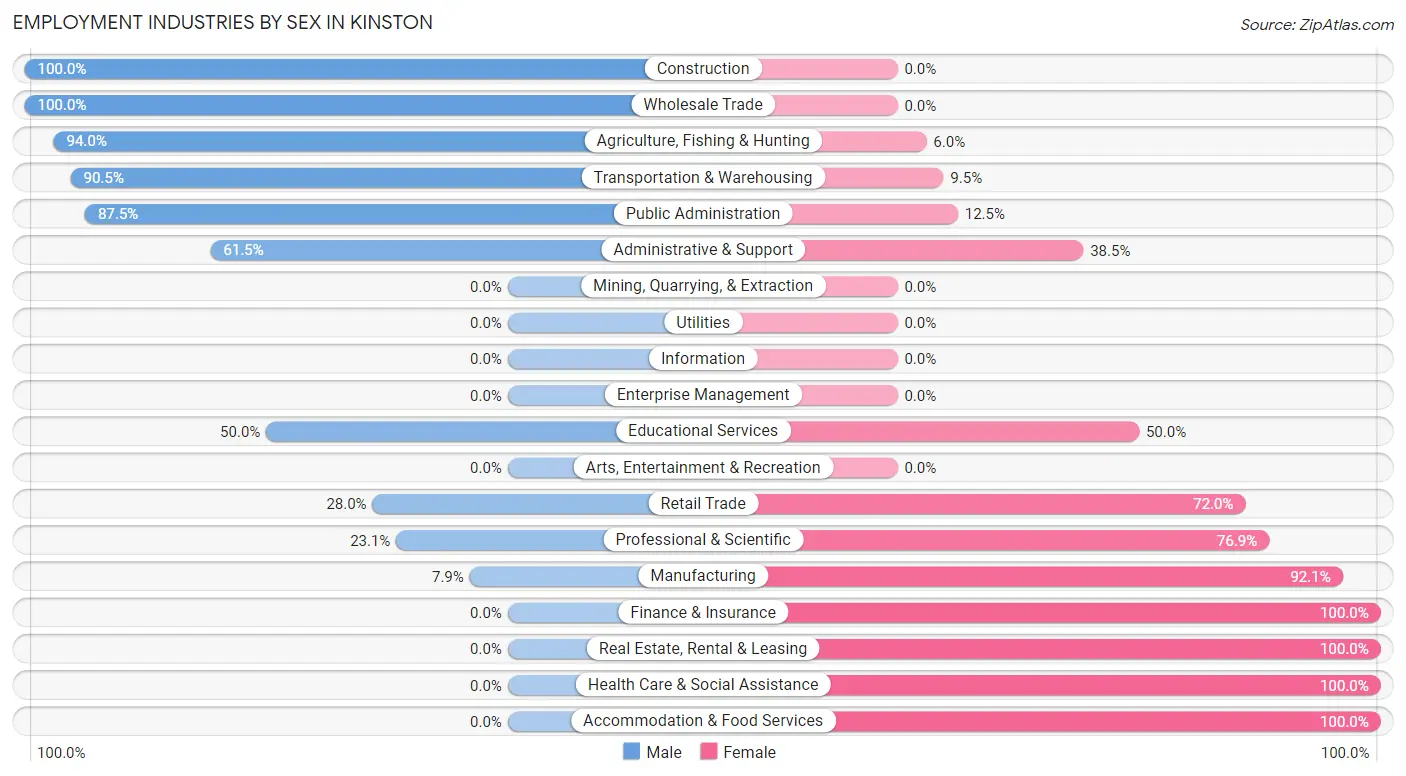
| Industry | Male | Female |
| Agriculture, Fishing & Hunting | 47 (94.0%) | 3 (6.0%) |
| Mining, Quarrying, & Extraction | 0 (0.0%) | 0 (0.0%) |
| Construction | 37 (100.0%) | 0 (0.0%) |
| Manufacturing | 6 (7.9%) | 70 (92.1%) |
| Wholesale Trade | 5 (100.0%) | 0 (0.0%) |
| Retail Trade | 7 (28.0%) | 18 (72.0%) |
| Transportation & Warehousing | 19 (90.5%) | 2 (9.5%) |
| Utilities | 0 (0.0%) | 0 (0.0%) |
| Information | 0 (0.0%) | 0 (0.0%) |
| Finance & Insurance | 0 (0.0%) | 12 (100.0%) |
| Real Estate, Rental & Leasing | 0 (0.0%) | 6 (100.0%) |
| Professional & Scientific | 3 (23.1%) | 10 (76.9%) |
| Enterprise Management | 0 (0.0%) | 0 (0.0%) |
| Administrative & Support | 8 (61.5%) | 5 (38.5%) |
| Educational Services | 4 (50.0%) | 4 (50.0%) |
| Health Care & Social Assistance | 0 (0.0%) | 2 (100.0%) |
| Arts, Entertainment & Recreation | 0 (0.0%) | 0 (0.0%) |
| Accommodation & Food Services | 0 (0.0%) | 6 (100.0%) |
| Public Administration | 14 (87.5%) | 2 (12.5%) |
| Total | 156 (52.3%) | 142 (47.6%) |
Education in Kinston
School Enrollment in Kinston
The most common levels of schooling among the 156 students in Kinston are elementary school (49 | 31.4%), college / undergraduate (39 | 25.0%), and middle school (28 | 17.9%).
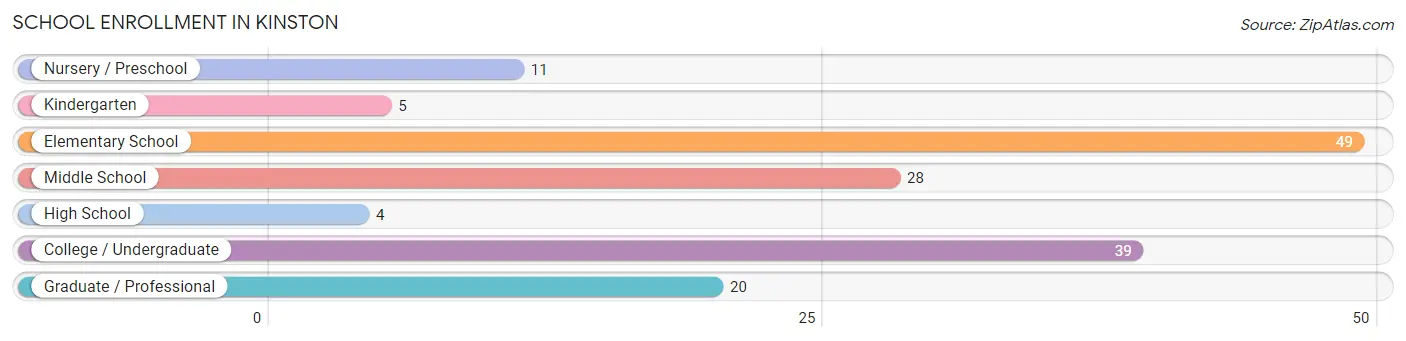
| School Level | # Students | % Students |
| Nursery / Preschool | 11 | 7.0% |
| Kindergarten | 5 | 3.2% |
| Elementary School | 49 | 31.4% |
| Middle School | 28 | 17.9% |
| High School | 4 | 2.6% |
| College / Undergraduate | 39 | 25.0% |
| Graduate / Professional | 20 | 12.8% |
| Total | 156 | 100.0% |
School Enrollment by Age by Funding Source in Kinston
Out of a total of 156 students who are enrolled in schools in Kinston, 5 (3.2%) attend a private institution, while the remaining 151 (96.8%) are enrolled in public schools. The age group of 35 years and over has the highest likelihood of being enrolled in private schools, with 3 (14.3% in the age bracket) enrolled. Conversely, the age group of 3 to 4 year olds has the lowest likelihood of being enrolled in a private school, with 9 (100.0% in the age bracket) attending a public institution.
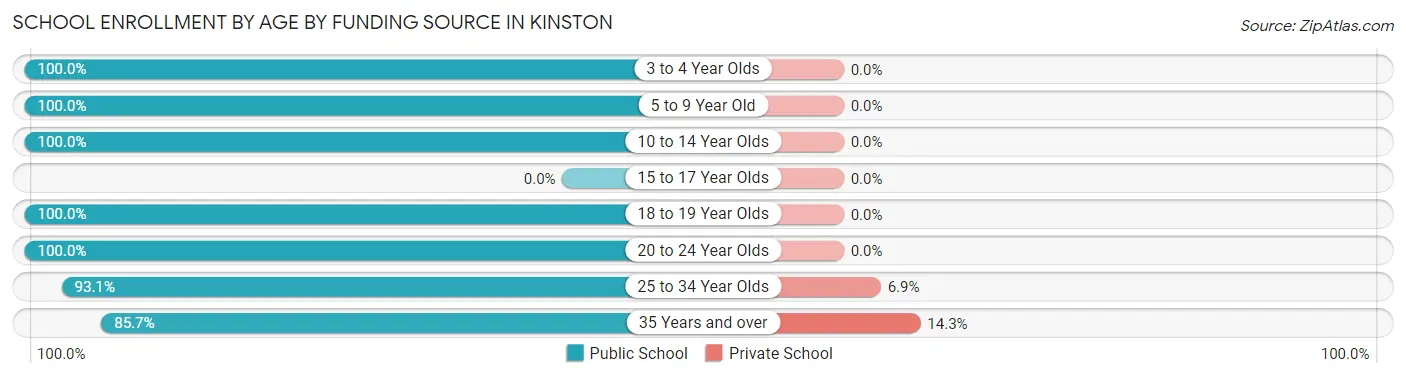
| Age Bracket | Public School | Private School |
| 3 to 4 Year Olds | 9 (100.0%) | 0 (0.0%) |
| 5 to 9 Year Old | 22 (100.0%) | 0 (0.0%) |
| 10 to 14 Year Olds | 62 (100.0%) | 0 (0.0%) |
| 15 to 17 Year Olds | 0 (0.0%) | 0 (0.0%) |
| 18 to 19 Year Olds | 7 (100.0%) | 0 (0.0%) |
| 20 to 24 Year Olds | 6 (100.0%) | 0 (0.0%) |
| 25 to 34 Year Olds | 27 (93.1%) | 2 (6.9%) |
| 35 Years and over | 18 (85.7%) | 3 (14.3%) |
| Total | 151 (96.8%) | 5 (3.2%) |
Educational Attainment by Field of Study in Kinston
Business (17 | 26.2%), liberal arts & history (12 | 18.5%), education (8 | 12.3%), psychology (7 | 10.8%), and visual & performing arts (6 | 9.2%) are the most common fields of study among 65 individuals in Kinston who have obtained a bachelor's degree or higher.
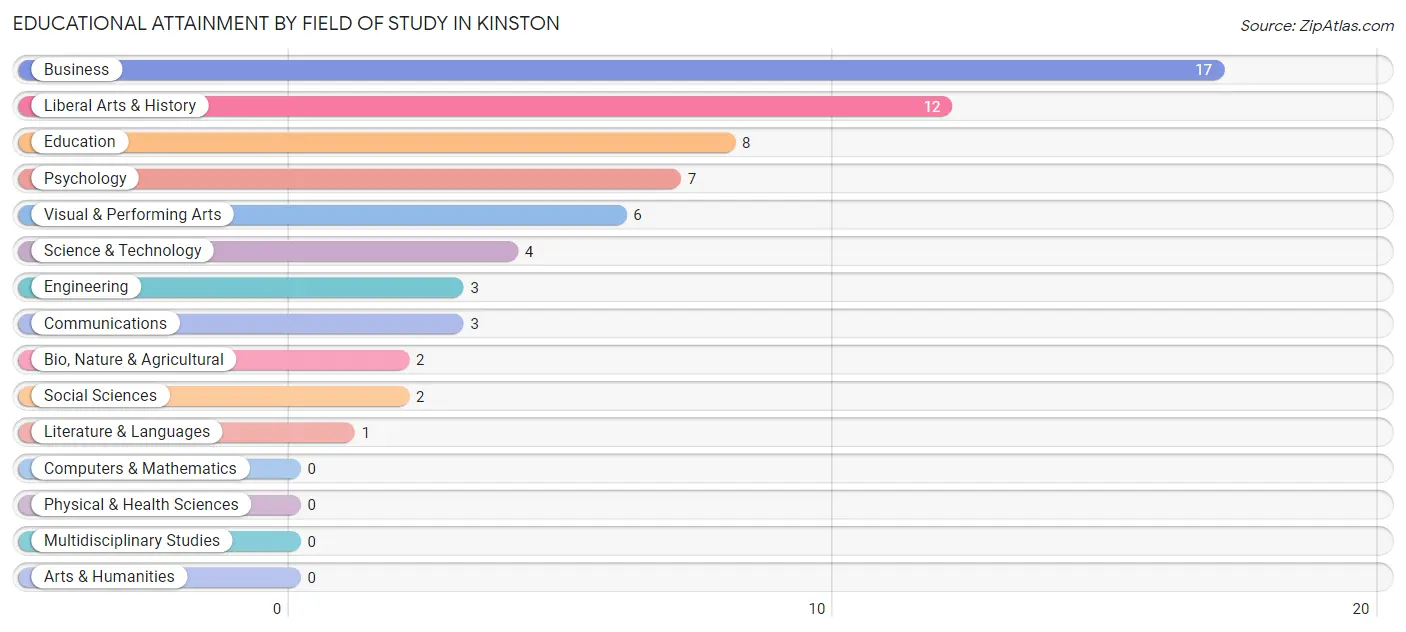
| Field of Study | # Graduates | % Graduates |
| Computers & Mathematics | 0 | 0.0% |
| Bio, Nature & Agricultural | 2 | 3.1% |
| Physical & Health Sciences | 0 | 0.0% |
| Psychology | 7 | 10.8% |
| Social Sciences | 2 | 3.1% |
| Engineering | 3 | 4.6% |
| Multidisciplinary Studies | 0 | 0.0% |
| Science & Technology | 4 | 6.1% |
| Business | 17 | 26.2% |
| Education | 8 | 12.3% |
| Literature & Languages | 1 | 1.5% |
| Liberal Arts & History | 12 | 18.5% |
| Visual & Performing Arts | 6 | 9.2% |
| Communications | 3 | 4.6% |
| Arts & Humanities | 0 | 0.0% |
| Total | 65 | 100.0% |
Transportation & Commute in Kinston
Vehicle Availability by Sex in Kinston
The most prevalent vehicle ownership categories in Kinston are males with 2 vehicles (55, accounting for 37.4%) and females with 2 vehicles (83, making up 38.7%).
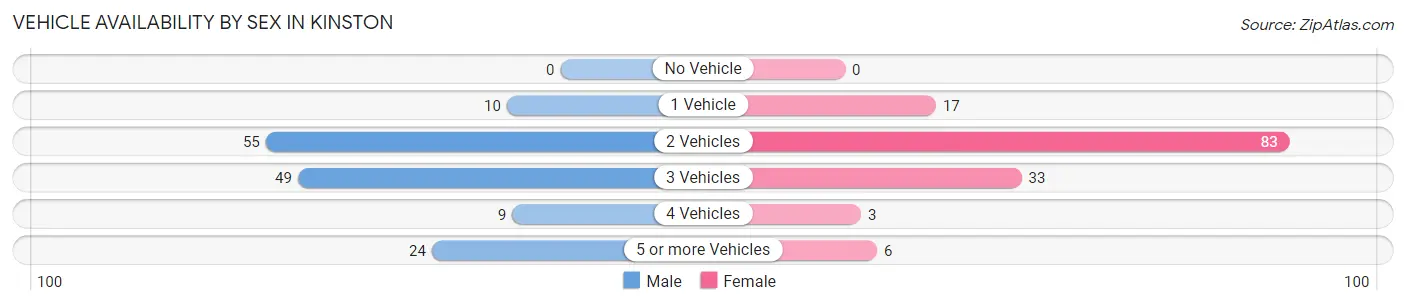
| Vehicles Available | Male | Female |
| No Vehicle | 0 (0.0%) | 0 (0.0%) |
| 1 Vehicle | 10 (6.8%) | 17 (12.0%) |
| 2 Vehicles | 55 (37.4%) | 83 (58.5%) |
| 3 Vehicles | 49 (33.3%) | 33 (23.2%) |
| 4 Vehicles | 9 (6.1%) | 3 (2.1%) |
| 5 or more Vehicles | 24 (16.3%) | 6 (4.2%) |
| Total | 147 (100.0%) | 142 (100.0%) |
Commute Time in Kinston
The most frequently occuring commute durations in Kinston are 15 to 19 minutes (75 commuters, 26.5%), 10 to 14 minutes (65 commuters, 23.0%), and 45 to 59 minutes (50 commuters, 17.7%).
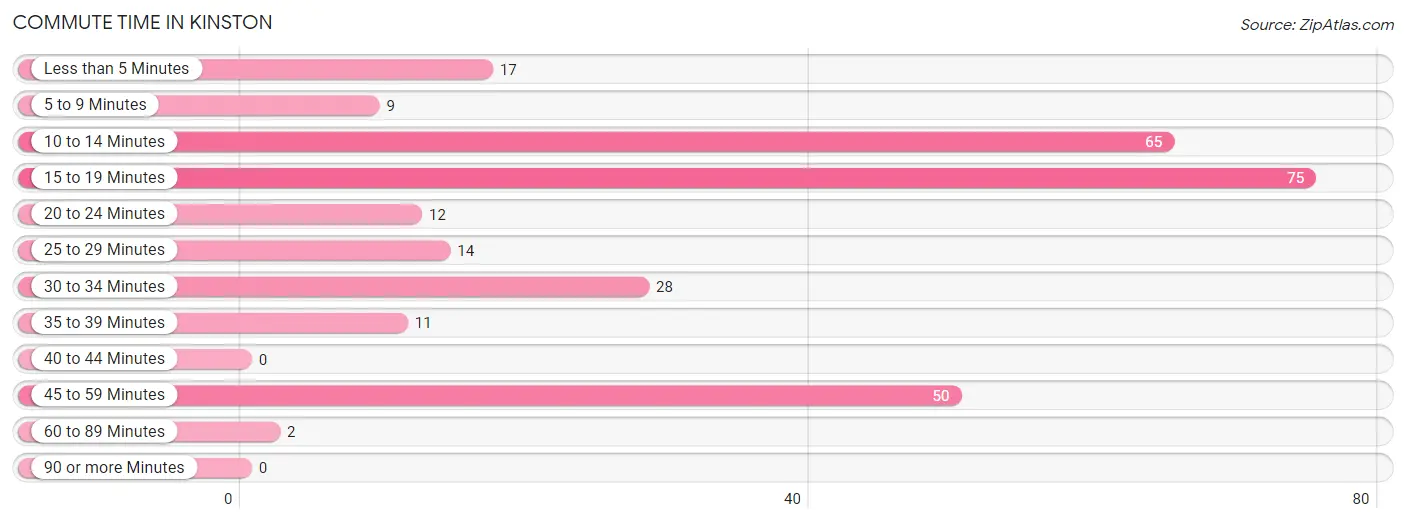
| Commute Time | # Commuters | % Commuters |
| Less than 5 Minutes | 17 | 6.0% |
| 5 to 9 Minutes | 9 | 3.2% |
| 10 to 14 Minutes | 65 | 23.0% |
| 15 to 19 Minutes | 75 | 26.5% |
| 20 to 24 Minutes | 12 | 4.2% |
| 25 to 29 Minutes | 14 | 5.0% |
| 30 to 34 Minutes | 28 | 9.9% |
| 35 to 39 Minutes | 11 | 3.9% |
| 40 to 44 Minutes | 0 | 0.0% |
| 45 to 59 Minutes | 50 | 17.7% |
| 60 to 89 Minutes | 2 | 0.7% |
| 90 or more Minutes | 0 | 0.0% |
Commute Time by Sex in Kinston
The most common commute times in Kinston are 10 to 14 minutes (65 commuters, 45.1%) for males and 15 to 19 minutes (68 commuters, 48.9%) for females.
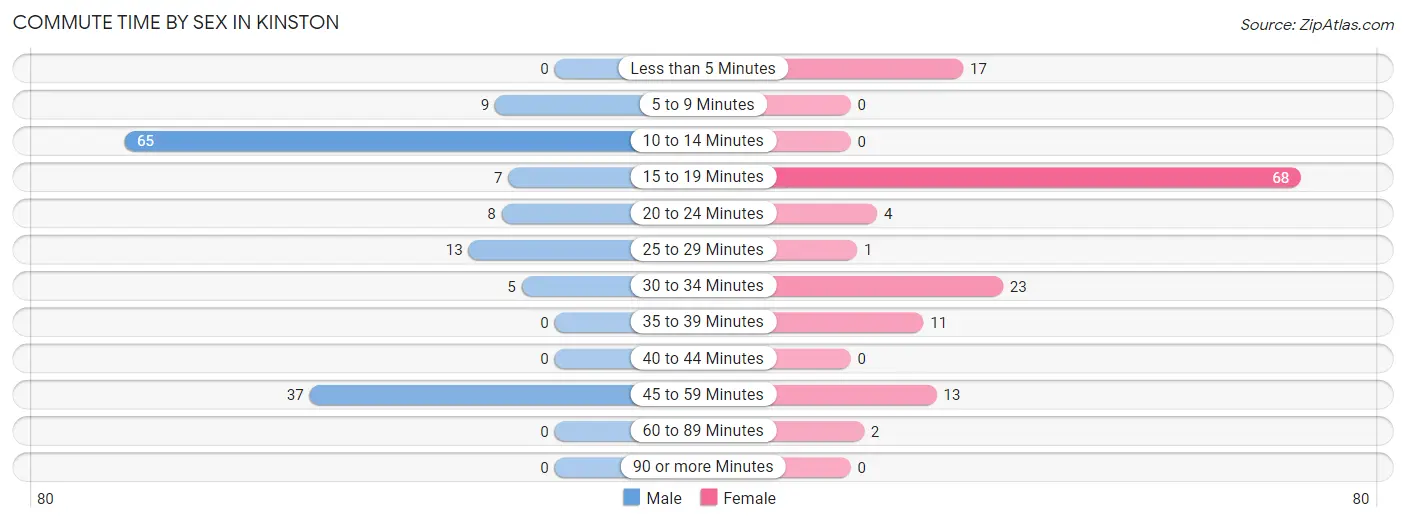
| Commute Time | Male | Female |
| Less than 5 Minutes | 0 (0.0%) | 17 (12.2%) |
| 5 to 9 Minutes | 9 (6.2%) | 0 (0.0%) |
| 10 to 14 Minutes | 65 (45.1%) | 0 (0.0%) |
| 15 to 19 Minutes | 7 (4.9%) | 68 (48.9%) |
| 20 to 24 Minutes | 8 (5.6%) | 4 (2.9%) |
| 25 to 29 Minutes | 13 (9.0%) | 1 (0.7%) |
| 30 to 34 Minutes | 5 (3.5%) | 23 (16.6%) |
| 35 to 39 Minutes | 0 (0.0%) | 11 (7.9%) |
| 40 to 44 Minutes | 0 (0.0%) | 0 (0.0%) |
| 45 to 59 Minutes | 37 (25.7%) | 13 (9.3%) |
| 60 to 89 Minutes | 0 (0.0%) | 2 (1.4%) |
| 90 or more Minutes | 0 (0.0%) | 0 (0.0%) |
Time of Departure to Work by Sex in Kinston
The most frequent times of departure to work in Kinston are 7:00 AM to 7:29 AM (71, 49.3%) for males and 6:30 AM to 6:59 AM (50, 36.0%) for females.
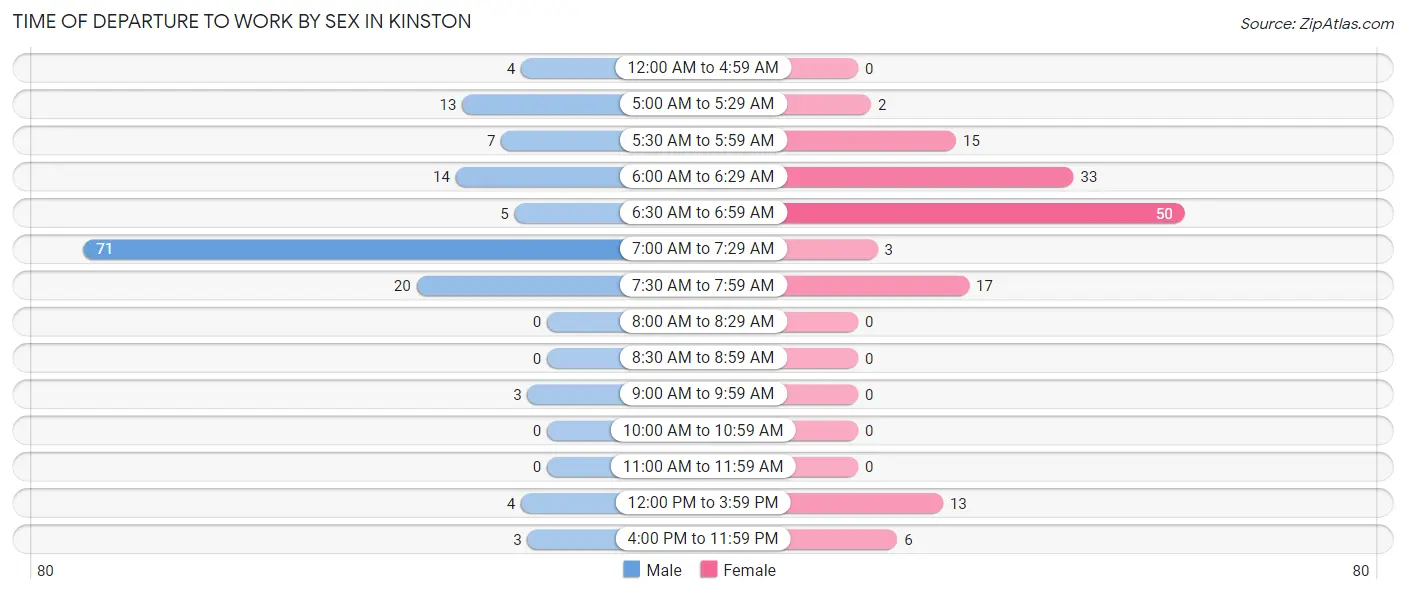
| Time of Departure | Male | Female |
| 12:00 AM to 4:59 AM | 4 (2.8%) | 0 (0.0%) |
| 5:00 AM to 5:29 AM | 13 (9.0%) | 2 (1.4%) |
| 5:30 AM to 5:59 AM | 7 (4.9%) | 15 (10.8%) |
| 6:00 AM to 6:29 AM | 14 (9.7%) | 33 (23.7%) |
| 6:30 AM to 6:59 AM | 5 (3.5%) | 50 (36.0%) |
| 7:00 AM to 7:29 AM | 71 (49.3%) | 3 (2.2%) |
| 7:30 AM to 7:59 AM | 20 (13.9%) | 17 (12.2%) |
| 8:00 AM to 8:29 AM | 0 (0.0%) | 0 (0.0%) |
| 8:30 AM to 8:59 AM | 0 (0.0%) | 0 (0.0%) |
| 9:00 AM to 9:59 AM | 3 (2.1%) | 0 (0.0%) |
| 10:00 AM to 10:59 AM | 0 (0.0%) | 0 (0.0%) |
| 11:00 AM to 11:59 AM | 0 (0.0%) | 0 (0.0%) |
| 12:00 PM to 3:59 PM | 4 (2.8%) | 13 (9.3%) |
| 4:00 PM to 11:59 PM | 3 (2.1%) | 6 (4.3%) |
| Total | 144 (100.0%) | 139 (100.0%) |
Housing Occupancy in Kinston
Occupancy by Ownership in Kinston
Of the total 264 dwellings in Kinston, owner-occupied units account for 185 (70.1%), while renter-occupied units make up 79 (29.9%).
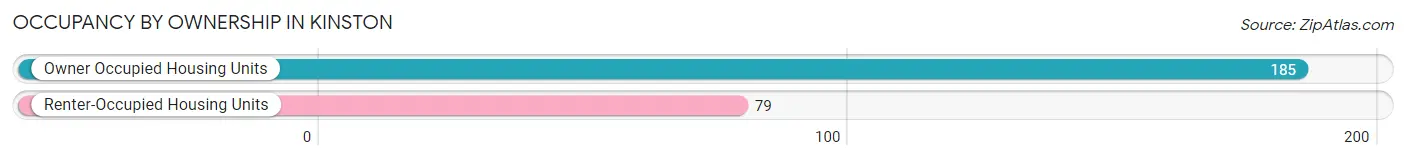
| Occupancy | # Housing Units | % Housing Units |
| Owner Occupied Housing Units | 185 | 70.1% |
| Renter-Occupied Housing Units | 79 | 29.9% |
| Total Occupied Housing Units | 264 | 100.0% |
Occupancy by Household Size in Kinston
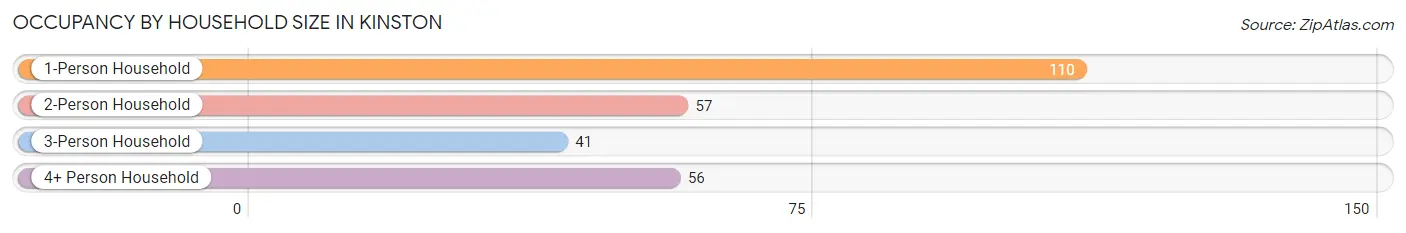
| Household Size | # Housing Units | % Housing Units |
| 1-Person Household | 110 | 41.7% |
| 2-Person Household | 57 | 21.6% |
| 3-Person Household | 41 | 15.5% |
| 4+ Person Household | 56 | 21.2% |
| Total Housing Units | 264 | 100.0% |
Occupancy by Ownership by Household Size in Kinston
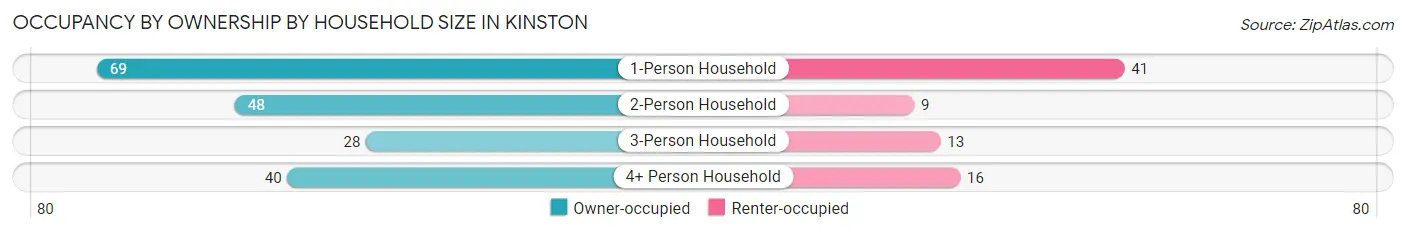
| Household Size | Owner-occupied | Renter-occupied |
| 1-Person Household | 69 (62.7%) | 41 (37.3%) |
| 2-Person Household | 48 (84.2%) | 9 (15.8%) |
| 3-Person Household | 28 (68.3%) | 13 (31.7%) |
| 4+ Person Household | 40 (71.4%) | 16 (28.6%) |
| Total Housing Units | 185 (70.1%) | 79 (29.9%) |
Occupancy by Educational Attainment in Kinston
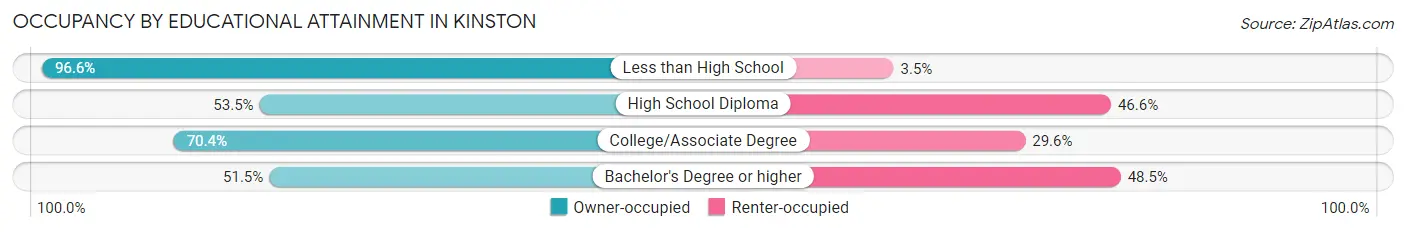
| Household Size | Owner-occupied | Renter-occupied |
| Less than High School | 56 (96.6%) | 2 (3.5%) |
| High School Diploma | 31 (53.4%) | 27 (46.6%) |
| College/Associate Degree | 81 (70.4%) | 34 (29.6%) |
| Bachelor's Degree or higher | 17 (51.5%) | 16 (48.5%) |
Occupancy by Age of Householder in Kinston
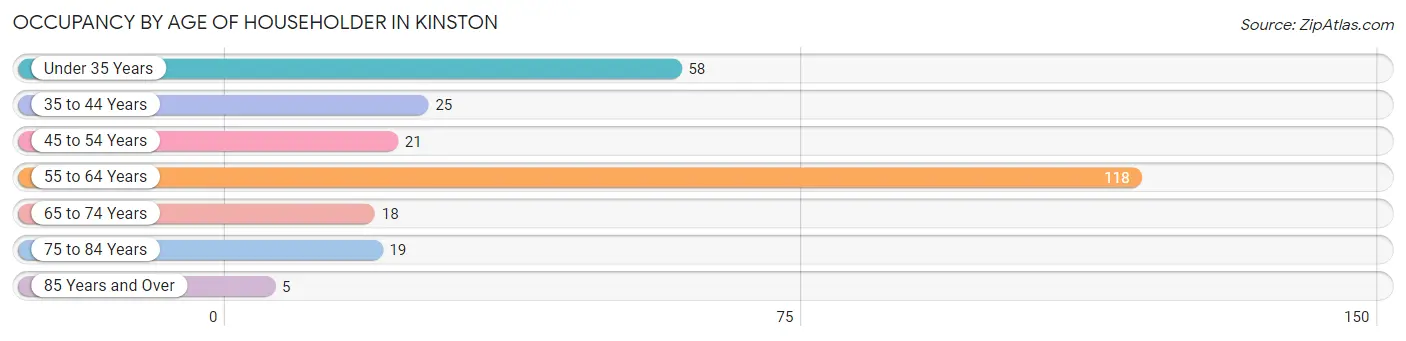
| Age Bracket | # Households | % Households |
| Under 35 Years | 58 | 22.0% |
| 35 to 44 Years | 25 | 9.5% |
| 45 to 54 Years | 21 | 8.0% |
| 55 to 64 Years | 118 | 44.7% |
| 65 to 74 Years | 18 | 6.8% |
| 75 to 84 Years | 19 | 7.2% |
| 85 Years and Over | 5 | 1.9% |
| Total | 264 | 100.0% |
Housing Finances in Kinston
Median Income by Occupancy in Kinston
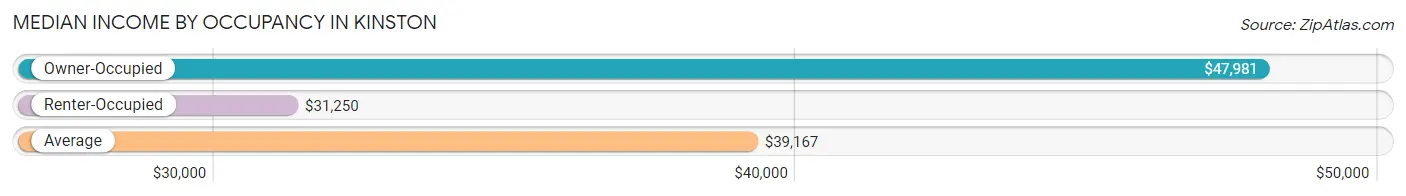
| Occupancy Type | # Households | Median Income |
| Owner-Occupied | 185 (70.1%) | $47,981 |
| Renter-Occupied | 79 (29.9%) | $31,250 |
| Average | 264 (100.0%) | $39,167 |
Occupancy by Householder Income Bracket in Kinston
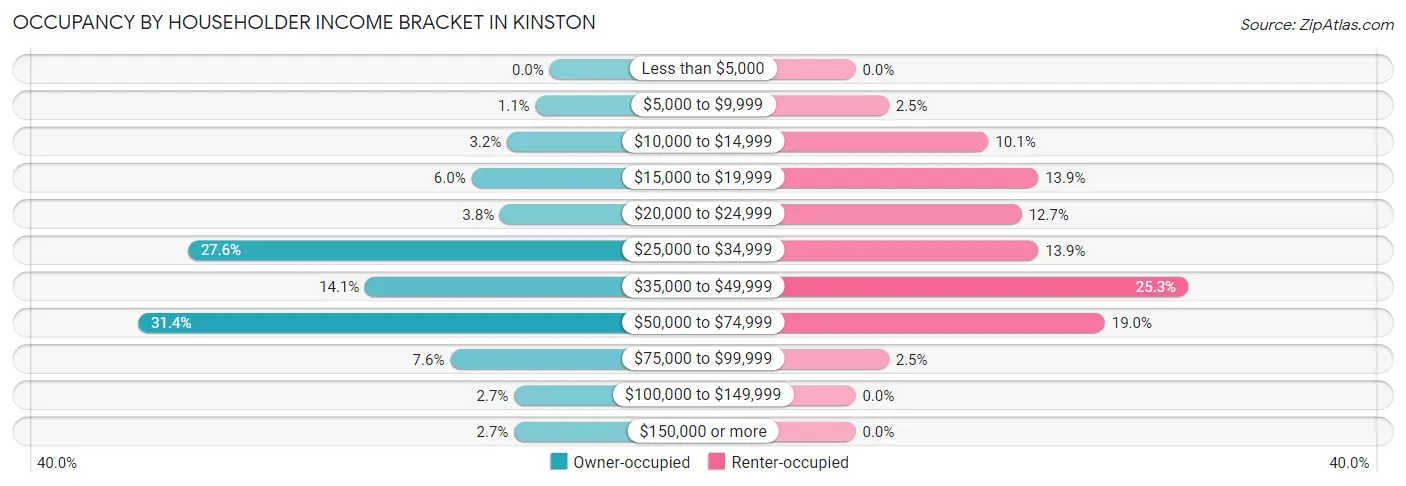
| Income Bracket | Owner-occupied | Renter-occupied |
| Less than $5,000 | 0 (0.0%) | 0 (0.0%) |
| $5,000 to $9,999 | 2 (1.1%) | 2 (2.5%) |
| $10,000 to $14,999 | 6 (3.2%) | 8 (10.1%) |
| $15,000 to $19,999 | 11 (5.9%) | 11 (13.9%) |
| $20,000 to $24,999 | 7 (3.8%) | 10 (12.7%) |
| $25,000 to $34,999 | 51 (27.6%) | 11 (13.9%) |
| $35,000 to $49,999 | 26 (14.1%) | 20 (25.3%) |
| $50,000 to $74,999 | 58 (31.4%) | 15 (19.0%) |
| $75,000 to $99,999 | 14 (7.6%) | 2 (2.5%) |
| $100,000 to $149,999 | 5 (2.7%) | 0 (0.0%) |
| $150,000 or more | 5 (2.7%) | 0 (0.0%) |
| Total | 185 (100.0%) | 79 (100.0%) |
Monthly Housing Cost Tiers in Kinston
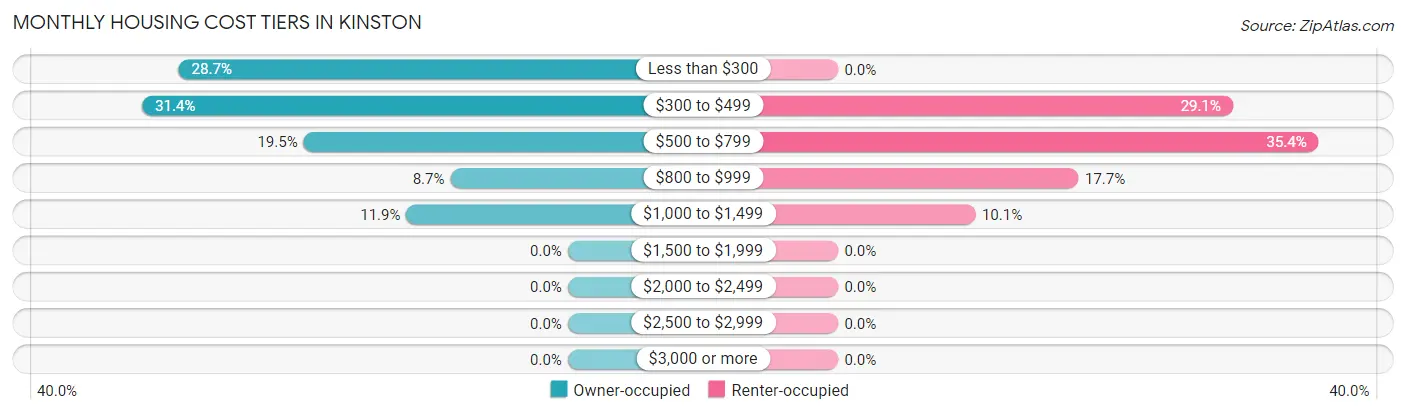
| Monthly Cost | Owner-occupied | Renter-occupied |
| Less than $300 | 53 (28.6%) | 0 (0.0%) |
| $300 to $499 | 58 (31.4%) | 23 (29.1%) |
| $500 to $799 | 36 (19.5%) | 28 (35.4%) |
| $800 to $999 | 16 (8.6%) | 14 (17.7%) |
| $1,000 to $1,499 | 22 (11.9%) | 8 (10.1%) |
| $1,500 to $1,999 | 0 (0.0%) | 0 (0.0%) |
| $2,000 to $2,499 | 0 (0.0%) | 0 (0.0%) |
| $2,500 to $2,999 | 0 (0.0%) | 0 (0.0%) |
| $3,000 or more | 0 (0.0%) | 0 (0.0%) |
| Total | 185 (100.0%) | 79 (100.0%) |
Physical Housing Characteristics in Kinston
Housing Structures in Kinston
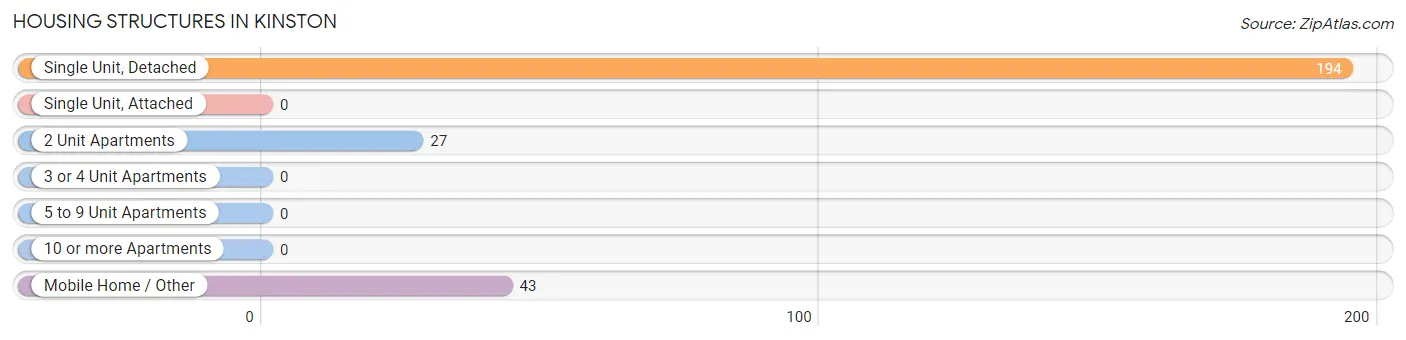
| Structure Type | # Housing Units | % Housing Units |
| Single Unit, Detached | 194 | 73.5% |
| Single Unit, Attached | 0 | 0.0% |
| 2 Unit Apartments | 27 | 10.2% |
| 3 or 4 Unit Apartments | 0 | 0.0% |
| 5 to 9 Unit Apartments | 0 | 0.0% |
| 10 or more Apartments | 0 | 0.0% |
| Mobile Home / Other | 43 | 16.3% |
| Total | 264 | 100.0% |
Housing Structures by Occupancy in Kinston
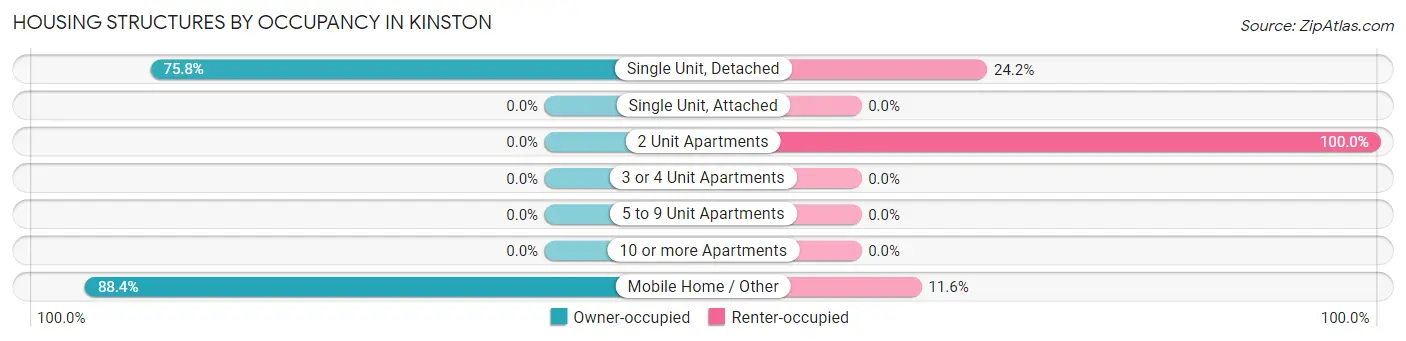
| Structure Type | Owner-occupied | Renter-occupied |
| Single Unit, Detached | 147 (75.8%) | 47 (24.2%) |
| Single Unit, Attached | 0 (0.0%) | 0 (0.0%) |
| 2 Unit Apartments | 0 (0.0%) | 27 (100.0%) |
| 3 or 4 Unit Apartments | 0 (0.0%) | 0 (0.0%) |
| 5 to 9 Unit Apartments | 0 (0.0%) | 0 (0.0%) |
| 10 or more Apartments | 0 (0.0%) | 0 (0.0%) |
| Mobile Home / Other | 38 (88.4%) | 5 (11.6%) |
| Total | 185 (70.1%) | 79 (29.9%) |
Housing Structures by Number of Rooms in Kinston
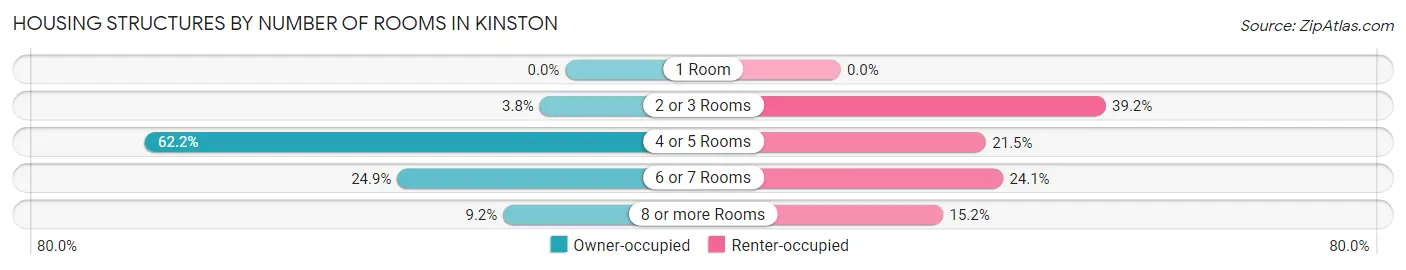
| Number of Rooms | Owner-occupied | Renter-occupied |
| 1 Room | 0 (0.0%) | 0 (0.0%) |
| 2 or 3 Rooms | 7 (3.8%) | 31 (39.2%) |
| 4 or 5 Rooms | 115 (62.2%) | 17 (21.5%) |
| 6 or 7 Rooms | 46 (24.9%) | 19 (24.0%) |
| 8 or more Rooms | 17 (9.2%) | 12 (15.2%) |
| Total | 185 (100.0%) | 79 (100.0%) |
Housing Structure by Heating Type in Kinston
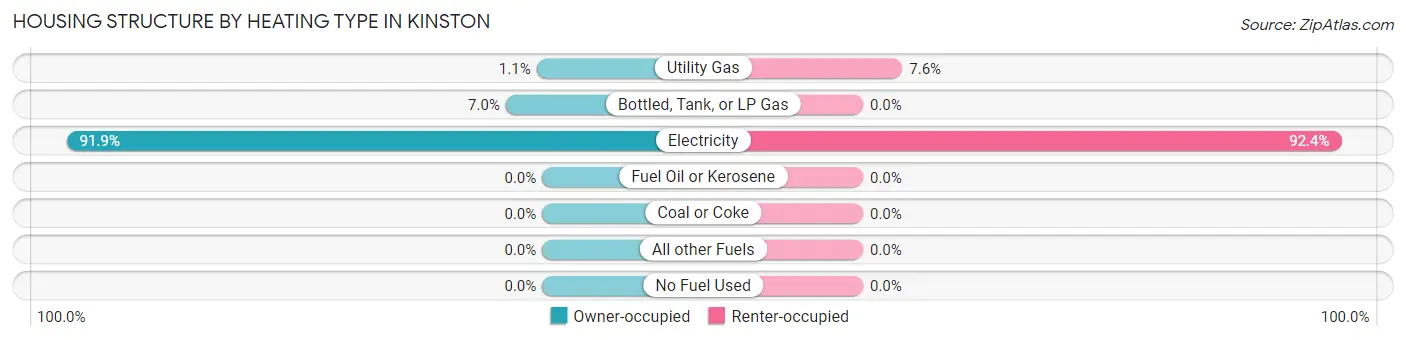
| Heating Type | Owner-occupied | Renter-occupied |
| Utility Gas | 2 (1.1%) | 6 (7.6%) |
| Bottled, Tank, or LP Gas | 13 (7.0%) | 0 (0.0%) |
| Electricity | 170 (91.9%) | 73 (92.4%) |
| Fuel Oil or Kerosene | 0 (0.0%) | 0 (0.0%) |
| Coal or Coke | 0 (0.0%) | 0 (0.0%) |
| All other Fuels | 0 (0.0%) | 0 (0.0%) |
| No Fuel Used | 0 (0.0%) | 0 (0.0%) |
| Total | 185 (100.0%) | 79 (100.0%) |
Household Vehicle Usage in Kinston
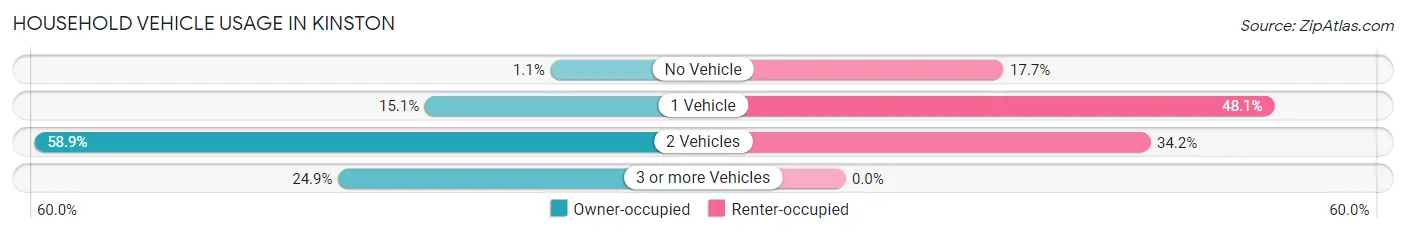
| Vehicles per Household | Owner-occupied | Renter-occupied |
| No Vehicle | 2 (1.1%) | 14 (17.7%) |
| 1 Vehicle | 28 (15.1%) | 38 (48.1%) |
| 2 Vehicles | 109 (58.9%) | 27 (34.2%) |
| 3 or more Vehicles | 46 (24.9%) | 0 (0.0%) |
| Total | 185 (100.0%) | 79 (100.0%) |
Real Estate & Mortgages in Kinston
Real Estate and Mortgage Overview in Kinston
| Characteristic | Without Mortgage | With Mortgage |
| Housing Units | 121 | 64 |
| Median Property Value | $54,700 | $82,000 |
| Median Household Income | $27,297 | $3 |
| Monthly Housing Costs | $308 | $0 |
| Real Estate Taxes | $199 | $6 |
Property Value by Mortgage Status in Kinston
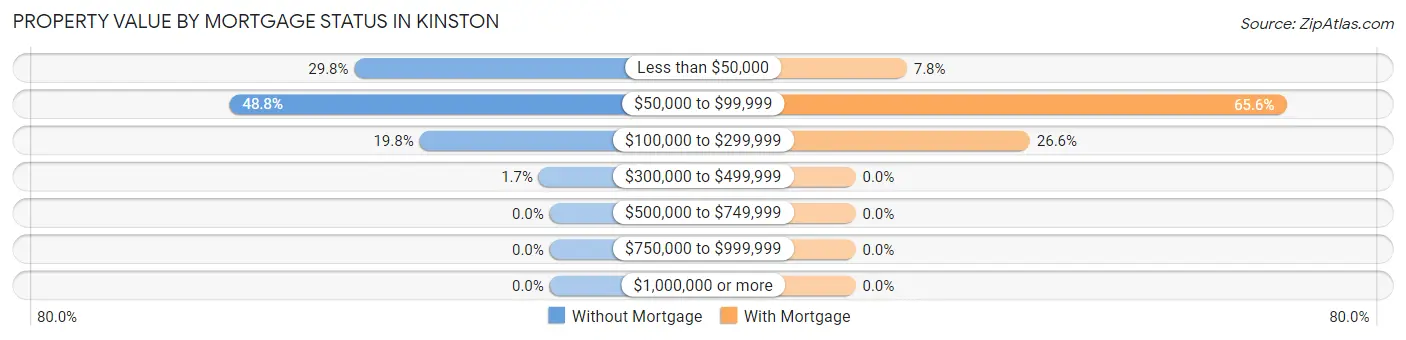
| Property Value | Without Mortgage | With Mortgage |
| Less than $50,000 | 36 (29.7%) | 5 (7.8%) |
| $50,000 to $99,999 | 59 (48.8%) | 42 (65.6%) |
| $100,000 to $299,999 | 24 (19.8%) | 17 (26.6%) |
| $300,000 to $499,999 | 2 (1.7%) | 0 (0.0%) |
| $500,000 to $749,999 | 0 (0.0%) | 0 (0.0%) |
| $750,000 to $999,999 | 0 (0.0%) | 0 (0.0%) |
| $1,000,000 or more | 0 (0.0%) | 0 (0.0%) |
| Total | 121 (100.0%) | 64 (100.0%) |
Household Income by Mortgage Status in Kinston
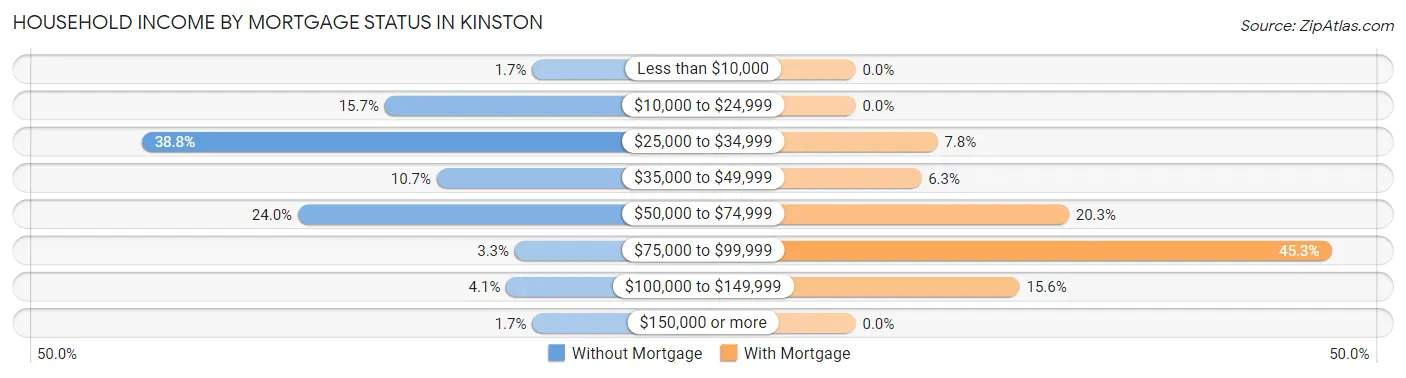
| Household Income | Without Mortgage | With Mortgage |
| Less than $10,000 | 2 (1.7%) | 0 (0.0%) |
| $10,000 to $24,999 | 19 (15.7%) | 0 (0.0%) |
| $25,000 to $34,999 | 47 (38.8%) | 5 (7.8%) |
| $35,000 to $49,999 | 13 (10.7%) | 4 (6.2%) |
| $50,000 to $74,999 | 29 (24.0%) | 13 (20.3%) |
| $75,000 to $99,999 | 4 (3.3%) | 29 (45.3%) |
| $100,000 to $149,999 | 5 (4.1%) | 10 (15.6%) |
| $150,000 or more | 2 (1.7%) | 0 (0.0%) |
| Total | 121 (100.0%) | 64 (100.0%) |
Property Value to Household Income Ratio in Kinston
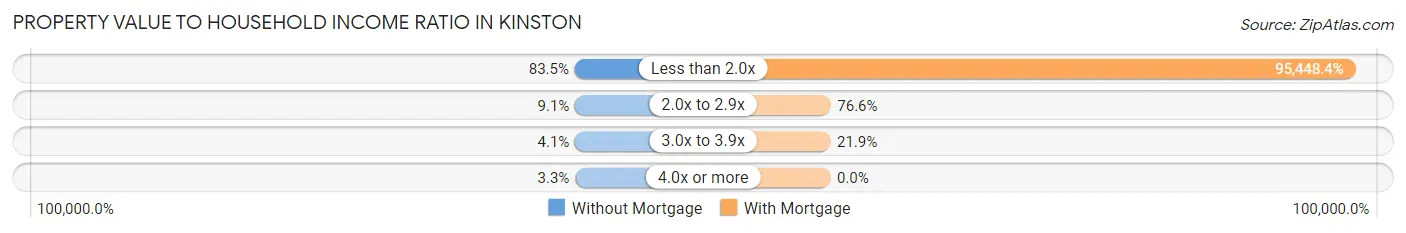
| Value-to-Income Ratio | Without Mortgage | With Mortgage |
| Less than 2.0x | 101 (83.5%) | 61,087 (95,448.4%) |
| 2.0x to 2.9x | 11 (9.1%) | 49 (76.6%) |
| 3.0x to 3.9x | 5 (4.1%) | 14 (21.9%) |
| 4.0x or more | 4 (3.3%) | 0 (0.0%) |
| Total | 121 (100.0%) | 64 (100.0%) |
Real Estate Taxes by Mortgage Status in Kinston
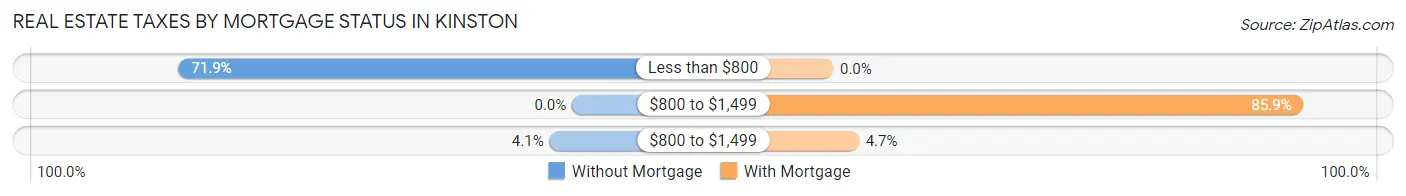
| Property Taxes | Without Mortgage | With Mortgage |
| Less than $800 | 87 (71.9%) | 0 (0.0%) |
| $800 to $1,499 | 0 (0.0%) | 55 (85.9%) |
| $800 to $1,499 | 5 (4.1%) | 3 (4.7%) |
| Total | 121 (100.0%) | 64 (100.0%) |
Health & Disability in Kinston
Health Insurance Coverage by Age in Kinston
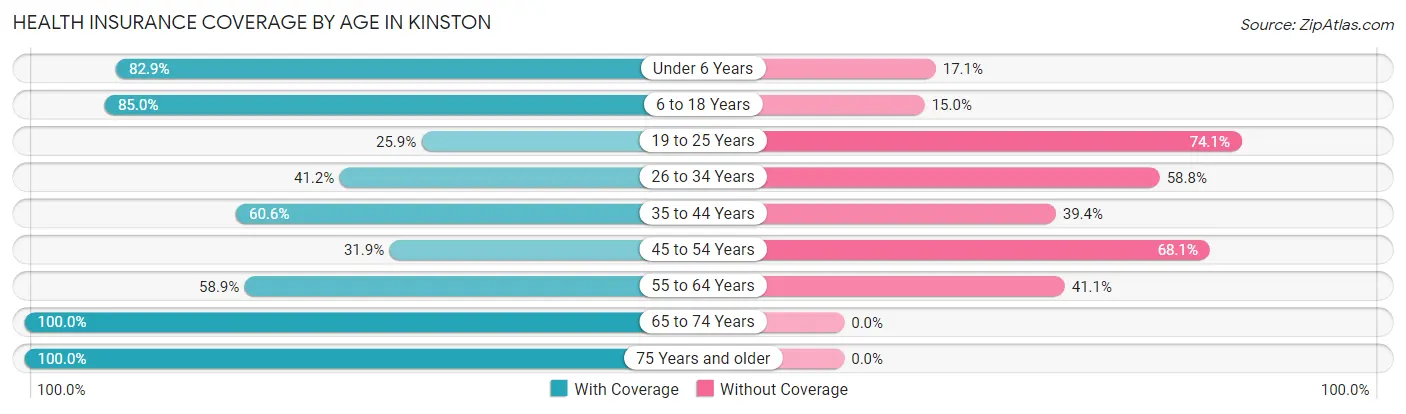
| Age Bracket | With Coverage | Without Coverage |
| Under 6 Years | 34 (82.9%) | 7 (17.1%) |
| 6 to 18 Years | 102 (85.0%) | 18 (15.0%) |
| 19 to 25 Years | 22 (25.9%) | 63 (74.1%) |
| 26 to 34 Years | 35 (41.2%) | 50 (58.8%) |
| 35 to 44 Years | 43 (60.6%) | 28 (39.4%) |
| 45 to 54 Years | 36 (31.9%) | 77 (68.1%) |
| 55 to 64 Years | 126 (58.9%) | 88 (41.1%) |
| 65 to 74 Years | 38 (100.0%) | 0 (0.0%) |
| 75 Years and older | 30 (100.0%) | 0 (0.0%) |
| Total | 466 (58.5%) | 331 (41.5%) |
Health Insurance Coverage by Citizenship Status in Kinston
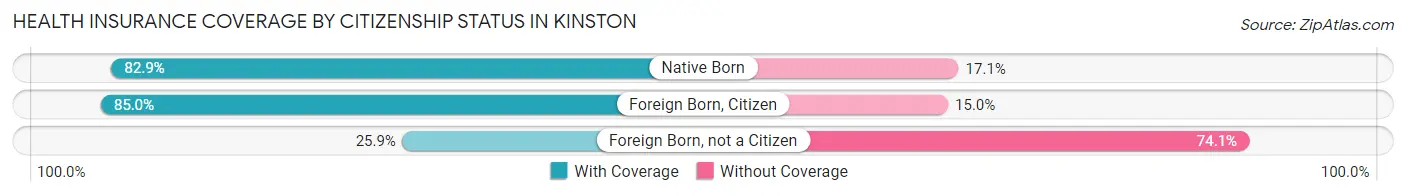
| Citizenship Status | With Coverage | Without Coverage |
| Native Born | 34 (82.9%) | 7 (17.1%) |
| Foreign Born, Citizen | 102 (85.0%) | 18 (15.0%) |
| Foreign Born, not a Citizen | 22 (25.9%) | 63 (74.1%) |
Health Insurance Coverage by Household Income in Kinston
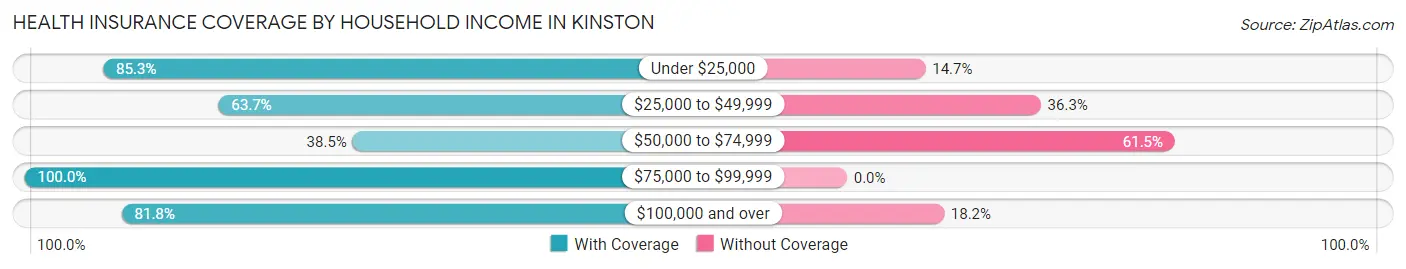
| Household Income | With Coverage | Without Coverage |
| Under $25,000 | 116 (85.3%) | 20 (14.7%) |
| $25,000 to $49,999 | 128 (63.7%) | 73 (36.3%) |
| $50,000 to $74,999 | 143 (38.5%) | 228 (61.5%) |
| $75,000 to $99,999 | 34 (100.0%) | 0 (0.0%) |
| $100,000 and over | 45 (81.8%) | 10 (18.2%) |
Public vs Private Health Insurance Coverage by Age in Kinston
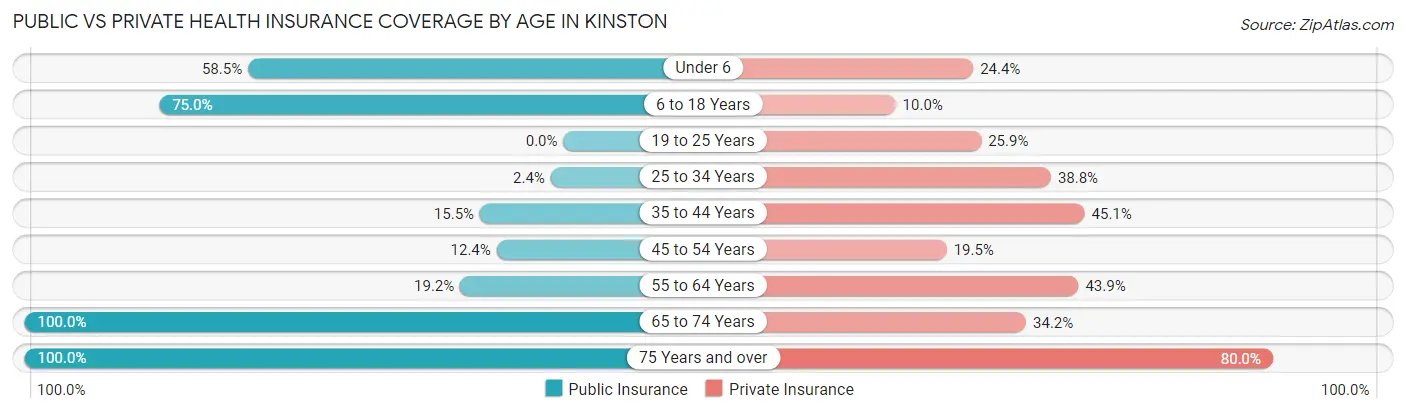
| Age Bracket | Public Insurance | Private Insurance |
| Under 6 | 24 (58.5%) | 10 (24.4%) |
| 6 to 18 Years | 90 (75.0%) | 12 (10.0%) |
| 19 to 25 Years | 0 (0.0%) | 22 (25.9%) |
| 25 to 34 Years | 2 (2.4%) | 33 (38.8%) |
| 35 to 44 Years | 11 (15.5%) | 32 (45.1%) |
| 45 to 54 Years | 14 (12.4%) | 22 (19.5%) |
| 55 to 64 Years | 41 (19.2%) | 94 (43.9%) |
| 65 to 74 Years | 38 (100.0%) | 13 (34.2%) |
| 75 Years and over | 30 (100.0%) | 24 (80.0%) |
| Total | 250 (31.4%) | 262 (32.9%) |
Disability Status by Sex by Age in Kinston
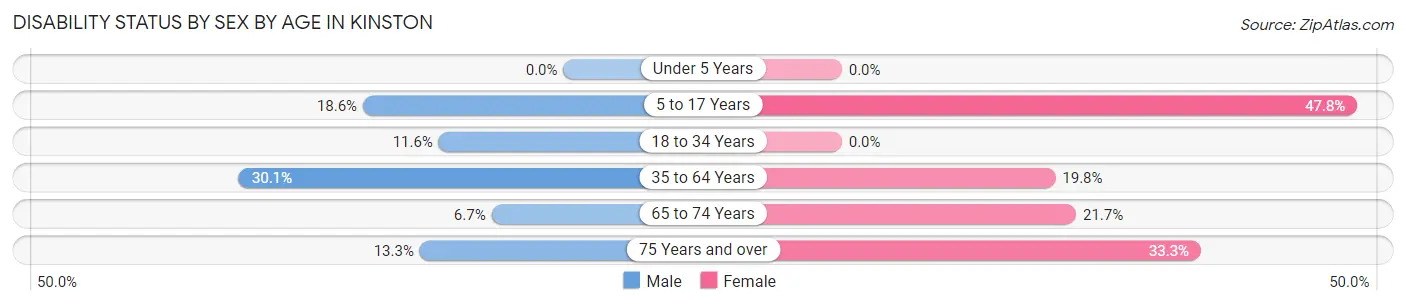
| Age Bracket | Male | Female |
| Under 5 Years | 0 (0.0%) | 0 (0.0%) |
| 5 to 17 Years | 16 (18.6%) | 11 (47.8%) |
| 18 to 34 Years | 14 (11.6%) | 0 (0.0%) |
| 35 to 64 Years | 53 (30.1%) | 44 (19.8%) |
| 65 to 74 Years | 1 (6.7%) | 5 (21.7%) |
| 75 Years and over | 2 (13.3%) | 5 (33.3%) |
Disability Class by Sex by Age in Kinston
Disability Class: Hearing Difficulty
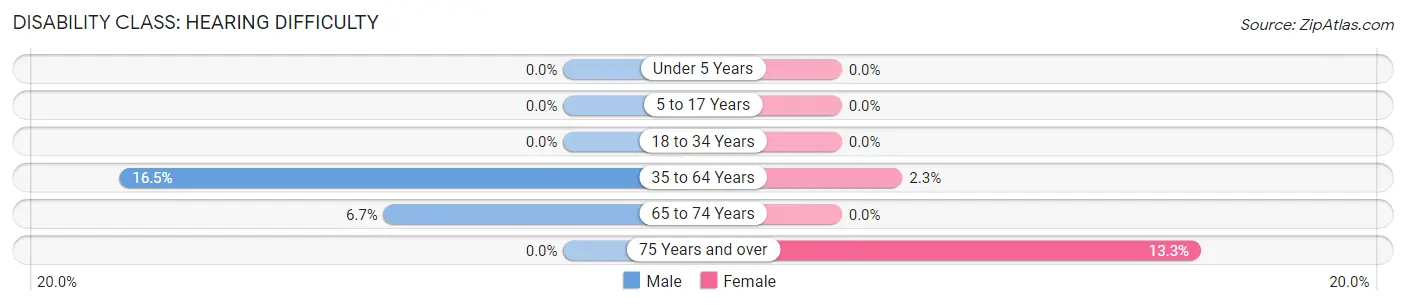
| Age Bracket | Male | Female |
| Under 5 Years | 0 (0.0%) | 0 (0.0%) |
| 5 to 17 Years | 0 (0.0%) | 0 (0.0%) |
| 18 to 34 Years | 0 (0.0%) | 0 (0.0%) |
| 35 to 64 Years | 29 (16.5%) | 5 (2.2%) |
| 65 to 74 Years | 1 (6.7%) | 0 (0.0%) |
| 75 Years and over | 0 (0.0%) | 2 (13.3%) |
Disability Class: Vision Difficulty
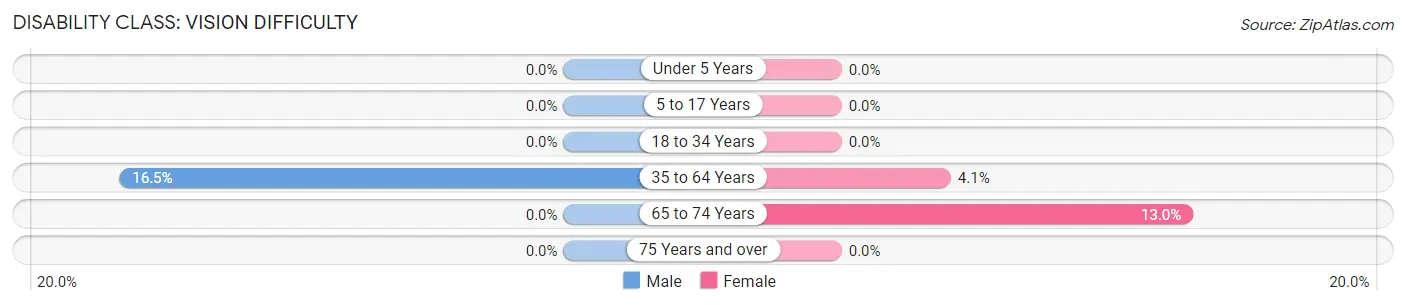
| Age Bracket | Male | Female |
| Under 5 Years | 0 (0.0%) | 0 (0.0%) |
| 5 to 17 Years | 0 (0.0%) | 0 (0.0%) |
| 18 to 34 Years | 0 (0.0%) | 0 (0.0%) |
| 35 to 64 Years | 29 (16.5%) | 9 (4.1%) |
| 65 to 74 Years | 0 (0.0%) | 3 (13.0%) |
| 75 Years and over | 0 (0.0%) | 0 (0.0%) |
Disability Class: Cognitive Difficulty
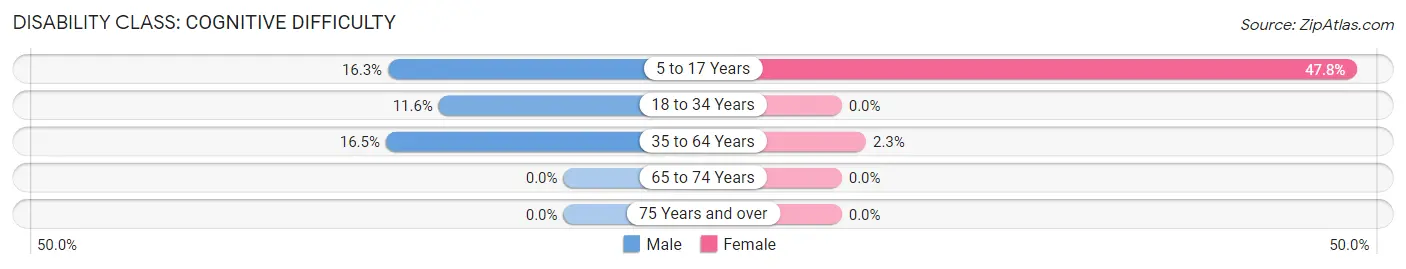
| Age Bracket | Male | Female |
| 5 to 17 Years | 14 (16.3%) | 11 (47.8%) |
| 18 to 34 Years | 14 (11.6%) | 0 (0.0%) |
| 35 to 64 Years | 29 (16.5%) | 5 (2.2%) |
| 65 to 74 Years | 0 (0.0%) | 0 (0.0%) |
| 75 Years and over | 0 (0.0%) | 0 (0.0%) |
Disability Class: Ambulatory Difficulty
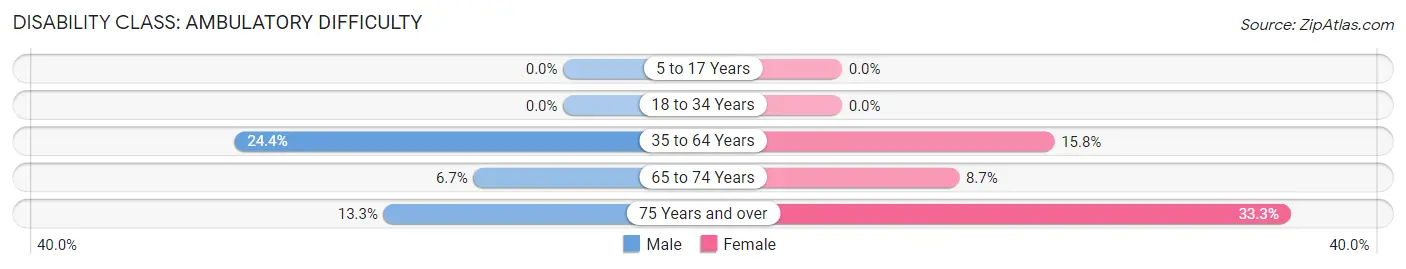
| Age Bracket | Male | Female |
| 5 to 17 Years | 0 (0.0%) | 0 (0.0%) |
| 18 to 34 Years | 0 (0.0%) | 0 (0.0%) |
| 35 to 64 Years | 43 (24.4%) | 35 (15.8%) |
| 65 to 74 Years | 1 (6.7%) | 2 (8.7%) |
| 75 Years and over | 2 (13.3%) | 5 (33.3%) |
Disability Class: Self-Care Difficulty
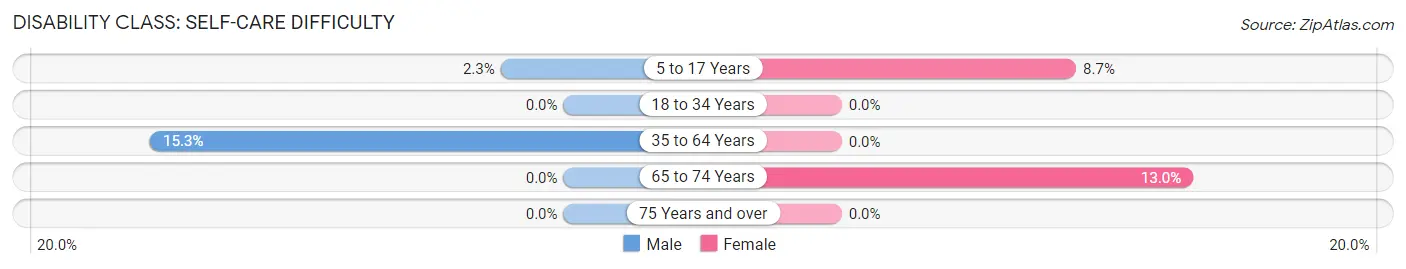
| Age Bracket | Male | Female |
| 5 to 17 Years | 2 (2.3%) | 2 (8.7%) |
| 18 to 34 Years | 0 (0.0%) | 0 (0.0%) |
| 35 to 64 Years | 27 (15.3%) | 0 (0.0%) |
| 65 to 74 Years | 0 (0.0%) | 3 (13.0%) |
| 75 Years and over | 0 (0.0%) | 0 (0.0%) |
Technology Access in Kinston
Computing Device Access in Kinston
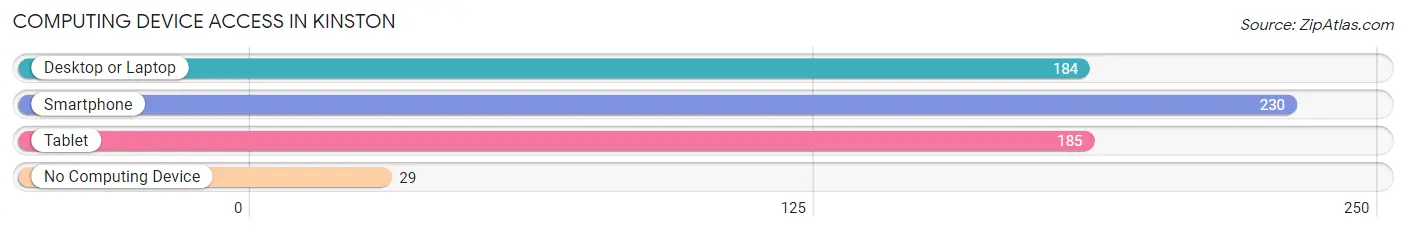
| Device Type | # Households | % Households |
| Desktop or Laptop | 184 | 69.7% |
| Smartphone | 230 | 87.1% |
| Tablet | 185 | 70.1% |
| No Computing Device | 29 | 11.0% |
| Total | 264 | 100.0% |
Internet Access in Kinston
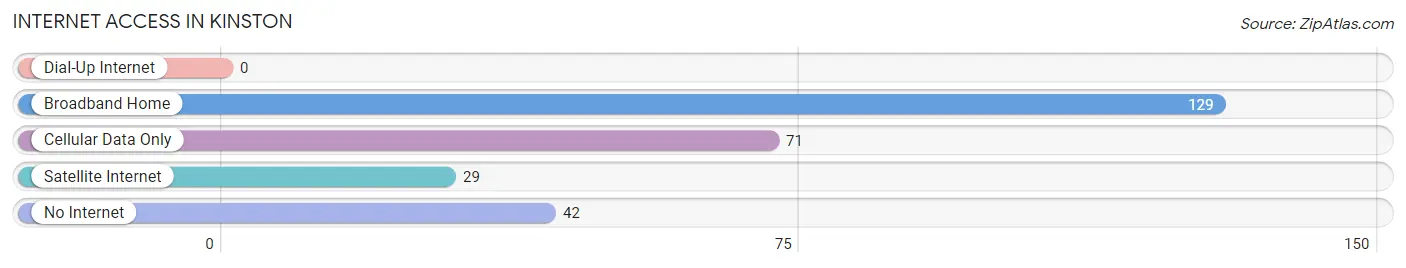
| Internet Type | # Households | % Households |
| Dial-Up Internet | 0 | 0.0% |
| Broadband Home | 129 | 48.9% |
| Cellular Data Only | 71 | 26.9% |
| Satellite Internet | 29 | 11.0% |
| No Internet | 42 | 15.9% |
| Total | 264 | 100.0% |
Kinston Summary
Kinston is a small town located in the state of Alabama, in the United States. It is situated in the southeastern corner of the state, in the Black Belt region. The town is located in the county of Lowndes, and is part of the Montgomery metropolitan area. The population of Kinston was estimated to be 1,845 in the year 2000.
History
Kinston was founded in 1820 by a group of settlers from Georgia. The town was named after the Kinston family, who were among the first settlers. The town was originally a farming community, and the main crops grown were cotton and corn. The town was also known for its timber industry, and the lumber was used to build homes and other structures.
In the late 19th century, Kinston became a major railroad hub, with the Mobile and Ohio Railroad running through the town. This allowed the town to become a major shipping center for the region. The town also became a center for manufacturing, with several factories being built in the area.
Geography
Kinston is located in the southeastern corner of Alabama, in the Black Belt region. The town is situated in the county of Lowndes, and is part of the Montgomery metropolitan area. The town is located at an elevation of about 300 feet above sea level. The town is located near the Alabama River, and is about 30 miles from the state capital of Montgomery.
The climate in Kinston is humid subtropical, with hot summers and mild winters. The average annual temperature is around 70 degrees Fahrenheit, and the average annual precipitation is around 50 inches.
Economy
The economy of Kinston is largely based on agriculture and manufacturing. The town is home to several factories, including a paper mill, a furniture factory, and a textile mill. The town is also home to several farms, which produce cotton, corn, and other crops.
The town is also home to several small businesses, including restaurants, shops, and other services. The town is also home to several churches, and is a popular destination for tourists.
Demographics
The population of Kinston was estimated to be 1,845 in the year 2000. The population is mostly white, with a small African American population. The median household income in the town is around $30,000, and the median home value is around $90,000. The town has a low unemployment rate, and the poverty rate is below the national average.
Conclusion
Kinston is a small town located in the southeastern corner of Alabama. The town was founded in 1820, and has a long history of agriculture and manufacturing. The town is home to several factories, farms, and small businesses, and is a popular destination for tourists. The population of Kinston was estimated to be 1,845 in the year 2000, and the median household income is around $30,000. The town has a low unemployment rate, and the poverty rate is below the national average.
Common Questions
What is Per Capita Income in Kinston?
Per Capita income in Kinston is $16,766.
What is the Median Family Income in Kinston?
Median Family Income in Kinston is $55,625.
What is the Median Household income in Kinston?
Median Household Income in Kinston is $39,167.
What is Income or Wage Gap in Kinston?
Income or Wage Gap in Kinston is 25.8%.
Women in Kinston earn 74.2 cents for every dollar earned by a man.
What is Inequality or Gini Index in Kinston?
Inequality or Gini Index in Kinston is 0.33.
What is the Total Population of Kinston?
Total Population of Kinston is 797.
What is the Total Male Population of Kinston?
Total Male Population of Kinston is 429.
What is the Total Female Population of Kinston?
Total Female Population of Kinston is 368.
What is the Ratio of Males per 100 Females in Kinston?
There are 116.58 Males per 100 Females in Kinston.
What is the Ratio of Females per 100 Males in Kinston?
There are 85.78 Females per 100 Males in Kinston.
What is the Median Population Age in Kinston?
Median Population Age in Kinston is 44.3 Years.
What is the Average Family Size in Kinston
Average Family Size in Kinston is 3.8 People.
What is the Average Household Size in Kinston
Average Household Size in Kinston is 3.0 People.
How Large is the Labor Force in Kinston?
There are 375 People in the Labor Forcein in Kinston.
What is the Percentage of People in the Labor Force in Kinston?
57.2% of People are in the Labor Force in Kinston.
What is the Unemployment Rate in Kinston?
Unemployment Rate in Kinston is 20.5%.