Broomtown, AL Map & Demographics
Broomtown Map
Broomtown Overview
$10,673
PER CAPITA INCOME
87.2%
WAGE / INCOME GAP [ % ]
12.8¢/ $1
WAGE / INCOME GAP [ $ ]
0.58
INEQUALITY / GINI INDEX
211
TOTAL POPULATION
67
MALE POPULATION
144
FEMALE POPULATION
46.53
MALES / 100 FEMALES
214.93
FEMALES / 100 MALES
39.6
MEDIAN AGE
2.9
AVG FAMILY SIZE
2.4
AVG HOUSEHOLD SIZE
97
LABOR FORCE [ PEOPLE ]
48.7%
PERCENT IN LABOR FORCE
27.8%
UNEMPLOYMENT RATE
Income in Broomtown
Income Overview in Broomtown
| Characteristic | Number | Measure |
| Per Capita Income | 211 | $10,673 |
| Median Family Income | 63 | $0 |
| Mean Family Income | 63 | $30,814 |
| Median Household Income | 89 | $0 |
| Mean Household Income | 89 | $25,343 |
| Income Deficit | 63 | $0 |
| Wage / Income Gap (%) | 211 | 87.24% |
| Wage / Income Gap ($) | 211 | 12.76¢ per $1 |
| Gini / Inequality Index | 211 | 0.58 |
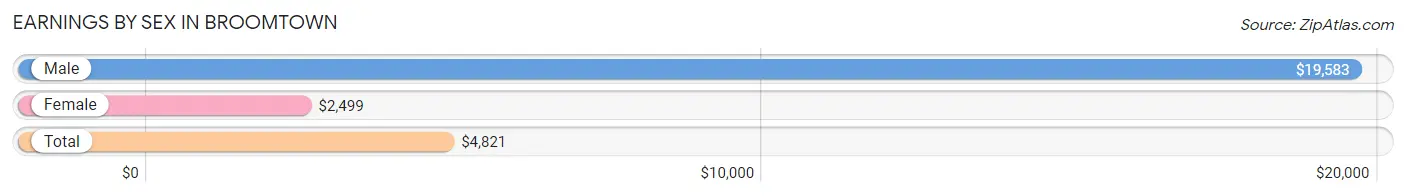
Earnings by Sex in Broomtown
Average Earnings in Broomtown are $4,821, $19,583 for men and $2,499 for women, a difference of 87.2%.
| Sex | Number | Average Earnings |
| Male | 29 (29.9%) | $19,583 |
| Female | 68 (70.1%) | $2,499 |
| Total | 97 (100.0%) | $4,821 |
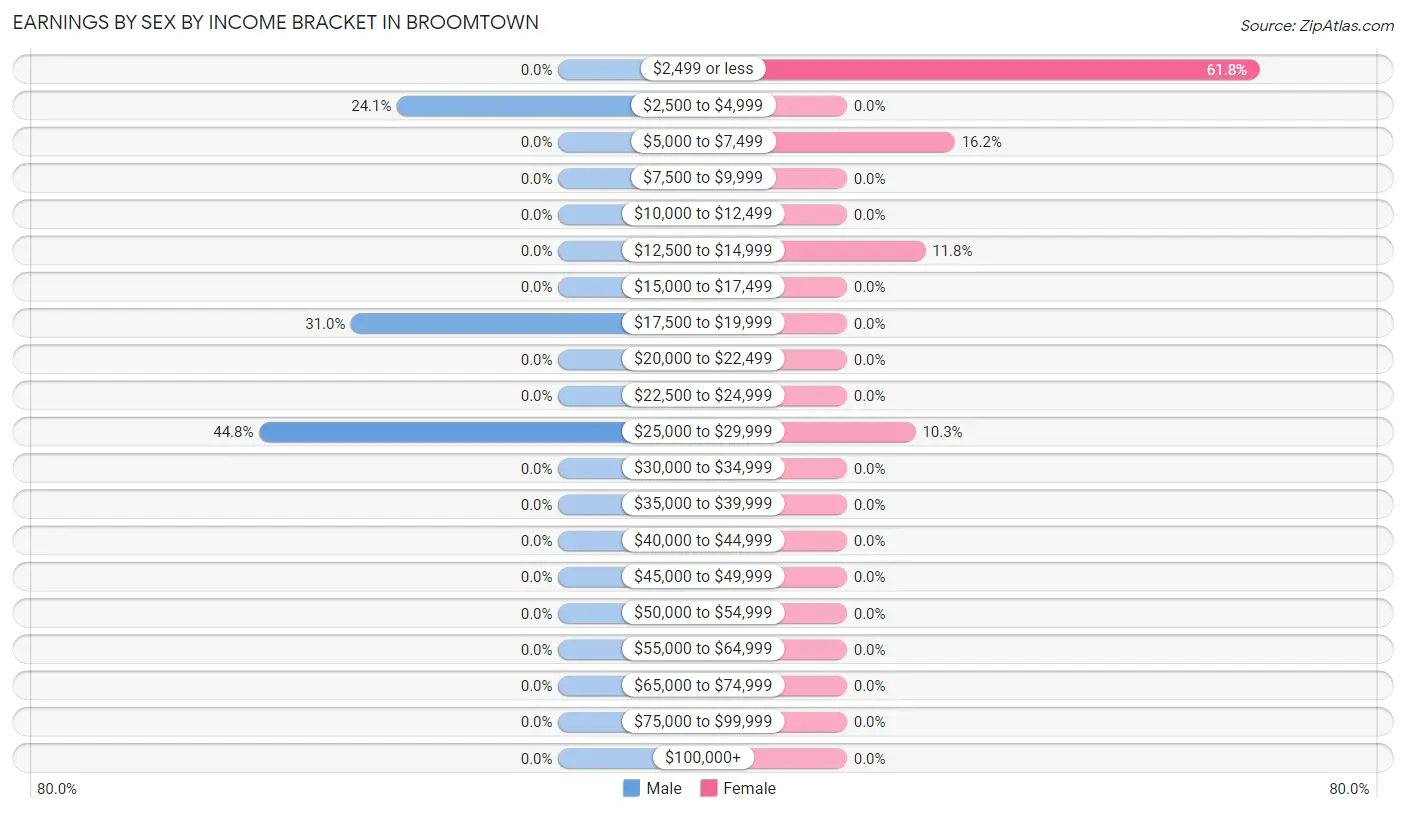
Earnings by Sex by Income Bracket in Broomtown
The most common earnings brackets in Broomtown are $25,000 to $29,999 for men (13 | 44.8%) and $2,499 or less for women (42 | 61.8%).
| Income | Male | Female |
| $2,499 or less | 0 (0.0%) | 42 (61.8%) |
| $2,500 to $4,999 | 7 (24.1%) | 0 (0.0%) |
| $5,000 to $7,499 | 0 (0.0%) | 11 (16.2%) |
| $7,500 to $9,999 | 0 (0.0%) | 0 (0.0%) |
| $10,000 to $12,499 | 0 (0.0%) | 0 (0.0%) |
| $12,500 to $14,999 | 0 (0.0%) | 8 (11.8%) |
| $15,000 to $17,499 | 0 (0.0%) | 0 (0.0%) |
| $17,500 to $19,999 | 9 (31.0%) | 0 (0.0%) |
| $20,000 to $22,499 | 0 (0.0%) | 0 (0.0%) |
| $22,500 to $24,999 | 0 (0.0%) | 0 (0.0%) |
| $25,000 to $29,999 | 13 (44.8%) | 7 (10.3%) |
| $30,000 to $34,999 | 0 (0.0%) | 0 (0.0%) |
| $35,000 to $39,999 | 0 (0.0%) | 0 (0.0%) |
| $40,000 to $44,999 | 0 (0.0%) | 0 (0.0%) |
| $45,000 to $49,999 | 0 (0.0%) | 0 (0.0%) |
| $50,000 to $54,999 | 0 (0.0%) | 0 (0.0%) |
| $55,000 to $64,999 | 0 (0.0%) | 0 (0.0%) |
| $65,000 to $74,999 | 0 (0.0%) | 0 (0.0%) |
| $75,000 to $99,999 | 0 (0.0%) | 0 (0.0%) |
| $100,000+ | 0 (0.0%) | 0 (0.0%) |
| Total | 29 (100.0%) | 68 (100.0%) |
Earnings by Sex by Educational Attainment in Broomtown
| Educational Attainment | Male Income | Female Income |
| Less than High School | - | - |
| High School Diploma | - | - |
| College or Associate's Degree | - | - |
| Bachelor's Degree | - | - |
| Graduate Degree | - | - |
| Total | $19,583 | $2,499 |
Family Income in Broomtown
Family Income Brackets in Broomtown
According to the Broomtown family income data, there are 27 families falling into the less than $10,000 income range, which is the most common income bracket and makes up 42.9% of all families.
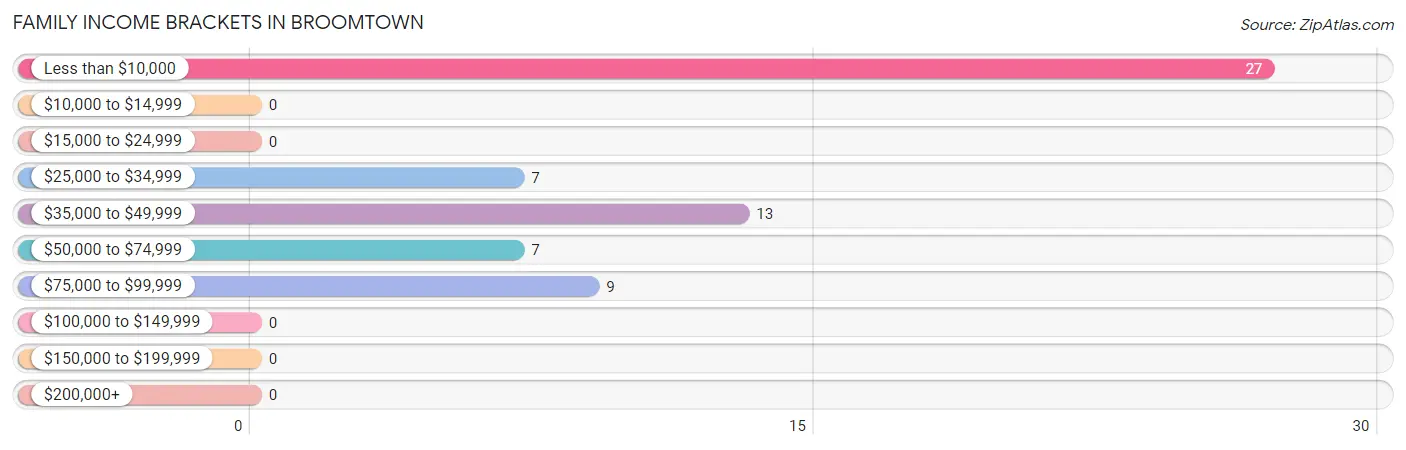
| Income Bracket | # Families | % Families |
| Less than $10,000 | 27 | 42.9% |
| $10,000 to $14,999 | 0 | 0.0% |
| $15,000 to $24,999 | 0 | 0.0% |
| $25,000 to $34,999 | 7 | 11.1% |
| $35,000 to $49,999 | 13 | 20.6% |
| $50,000 to $74,999 | 7 | 11.1% |
| $75,000 to $99,999 | 9 | 14.3% |
| $100,000 to $149,999 | 0 | 0.0% |
| $150,000 to $199,999 | 0 | 0.0% |
| $200,000+ | 0 | 0.0% |
Family Income by Famaliy Size in Broomtown
| Income Bracket | # Families | Median Income |
| 2-Person Families | 34 (54.0%) | $0 |
| 3-Person Families | 7 (11.1%) | $0 |
| 4-Person Families | 9 (14.3%) | $0 |
| 5-Person Families | 13 (20.6%) | $0 |
| 6-Person Families | 0 (0.0%) | $0 |
| 7+ Person Families | 0 (0.0%) | $0 |
| Total | 63 (100.0%) | $0 |
Family Income by Number of Earners in Broomtown
| Number of Earners | # Families | Median Income |
| No Earners | 27 (42.9%) | $0 |
| 1 Earner | 14 (22.2%) | $0 |
| 2 Earners | 0 (0.0%) | $0 |
| 3+ Earners | 22 (34.9%) | $0 |
| Total | 63 (100.0%) | $0 |
Household Income in Broomtown
Household Income Brackets in Broomtown
With 27 households falling in the category, the less than $10,000 income range is the most frequent in Broomtown, accounting for 30.3% of all households.
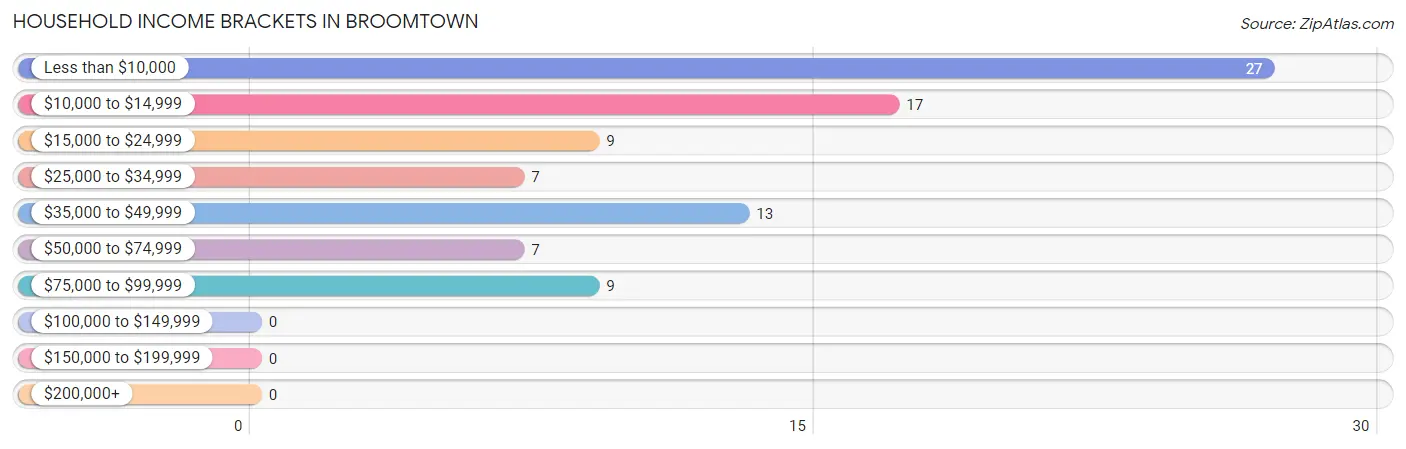
| Income Bracket | # Households | % Households |
| Less than $10,000 | 27 | 30.3% |
| $10,000 to $14,999 | 17 | 19.1% |
| $15,000 to $24,999 | 9 | 10.1% |
| $25,000 to $34,999 | 7 | 7.9% |
| $35,000 to $49,999 | 13 | 14.6% |
| $50,000 to $74,999 | 7 | 7.9% |
| $75,000 to $99,999 | 9 | 10.1% |
| $100,000 to $149,999 | 0 | 0.0% |
| $150,000 to $199,999 | 0 | 0.0% |
| $200,000+ | 0 | 0.0% |
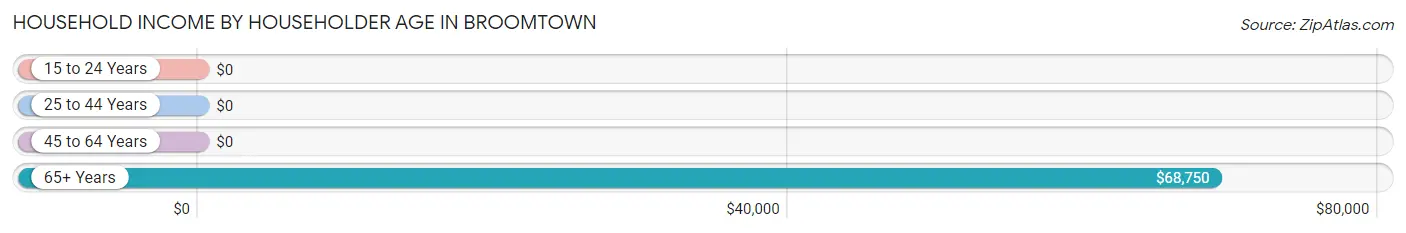
Household Income by Householder Age in Broomtown
The median household income in Broomtown is $0, with the highest median household income of $68,750 found in the 65+ years age bracket for the primary householder. A total of 25 households (28.1%) fall into this category.
| Income Bracket | # Households | Median Income |
| 15 to 24 Years | 0 (0.0%) | $0 |
| 25 to 44 Years | 34 (38.2%) | $0 |
| 45 to 64 Years | 30 (33.7%) | $0 |
| 65+ Years | 25 (28.1%) | $68,750 |
| Total | 89 (100.0%) | $0 |
Poverty in Broomtown
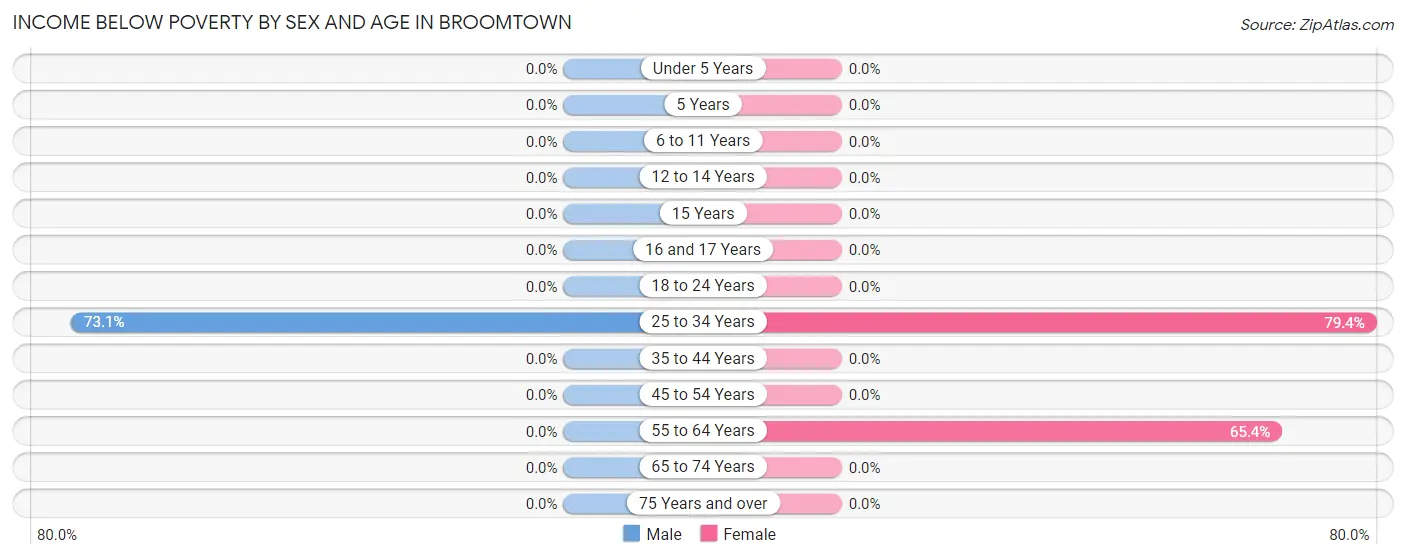
Income Below Poverty by Sex and Age in Broomtown
With 28.4% poverty level for males and 30.6% for females among the residents of Broomtown, 25 to 34 year old males and 25 to 34 year old females are the most vulnerable to poverty, with 19 males (73.1%) and 27 females (79.4%) in their respective age groups living below the poverty level.
| Age Bracket | Male | Female |
| Under 5 Years | 0 (0.0%) | 0 (0.0%) |
| 5 Years | 0 (0.0%) | 0 (0.0%) |
| 6 to 11 Years | 0 (0.0%) | 0 (0.0%) |
| 12 to 14 Years | 0 (0.0%) | 0 (0.0%) |
| 15 Years | 0 (0.0%) | 0 (0.0%) |
| 16 and 17 Years | 0 (0.0%) | 0 (0.0%) |
| 18 to 24 Years | 0 (0.0%) | 0 (0.0%) |
| 25 to 34 Years | 19 (73.1%) | 27 (79.4%) |
| 35 to 44 Years | 0 (0.0%) | 0 (0.0%) |
| 45 to 54 Years | 0 (0.0%) | 0 (0.0%) |
| 55 to 64 Years | 0 (0.0%) | 17 (65.4%) |
| 65 to 74 Years | 0 (0.0%) | 0 (0.0%) |
| 75 Years and over | 0 (0.0%) | 0 (0.0%) |
| Total | 19 (28.4%) | 44 (30.6%) |
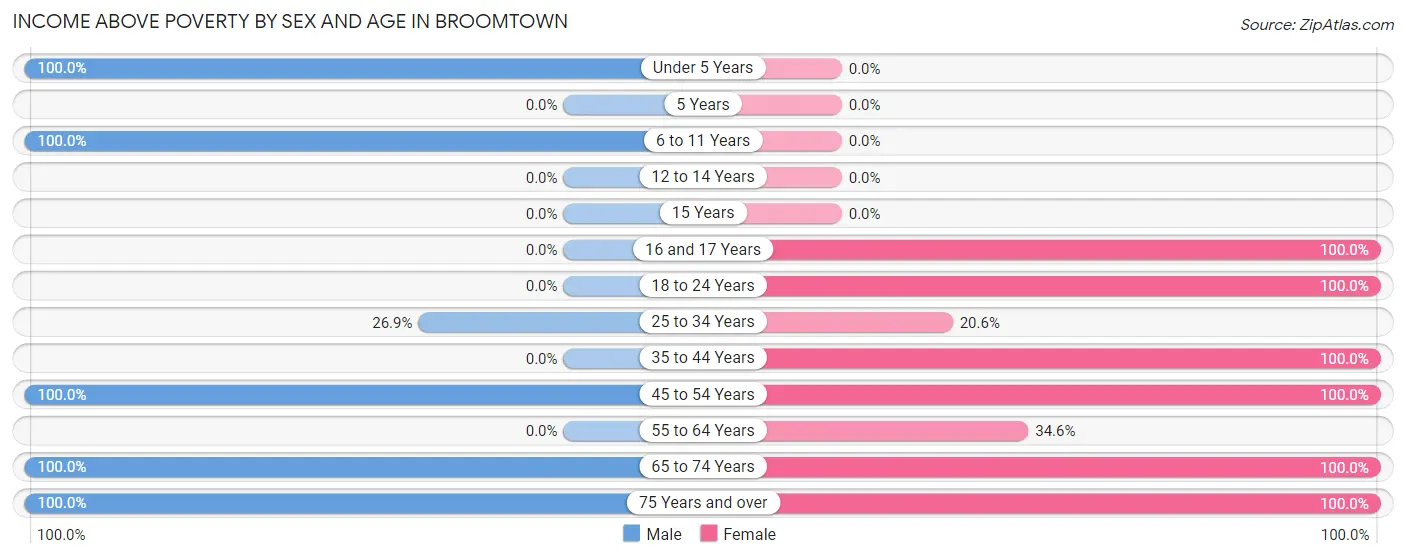
Income Above Poverty by Sex and Age in Broomtown
According to the poverty statistics in Broomtown, males aged under 5 years and females aged 16 and 17 years are the age groups that are most secure financially, with 100.0% of males and 100.0% of females in these age groups living above the poverty line.
| Age Bracket | Male | Female |
| Under 5 Years | 5 (100.0%) | 0 (0.0%) |
| 5 Years | 0 (0.0%) | 0 (0.0%) |
| 6 to 11 Years | 7 (100.0%) | 0 (0.0%) |
| 12 to 14 Years | 0 (0.0%) | 0 (0.0%) |
| 15 Years | 0 (0.0%) | 0 (0.0%) |
| 16 and 17 Years | 0 (0.0%) | 6 (100.0%) |
| 18 to 24 Years | 0 (0.0%) | 19 (100.0%) |
| 25 to 34 Years | 7 (26.9%) | 7 (20.6%) |
| 35 to 44 Years | 0 (0.0%) | 15 (100.0%) |
| 45 to 54 Years | 13 (100.0%) | 27 (100.0%) |
| 55 to 64 Years | 0 (0.0%) | 9 (34.6%) |
| 65 to 74 Years | 9 (100.0%) | 8 (100.0%) |
| 75 Years and over | 7 (100.0%) | 9 (100.0%) |
| Total | 48 (71.6%) | 100 (69.4%) |
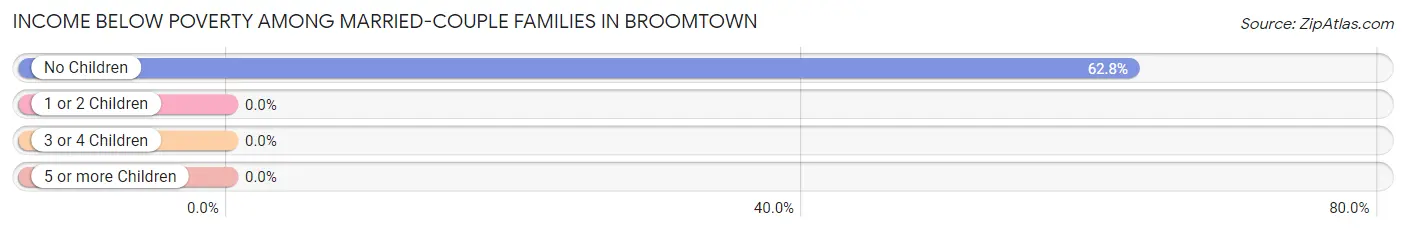
Income Below Poverty Among Married-Couple Families in Broomtown
The poverty statistics for married-couple families in Broomtown show that 42.9% or 27 of the total 63 families live below the poverty line. Families with no children have the highest poverty rate of 62.8%, comprising of 27 families. On the other hand, families with 1 or 2 children have the lowest poverty rate of 0.0%, which includes 0 families.
| Children | Above Poverty | Below Poverty |
| No Children | 16 (37.2%) | 27 (62.8%) |
| 1 or 2 Children | 20 (100.0%) | 0 (0.0%) |
| 3 or 4 Children | 0 (0.0%) | 0 (0.0%) |
| 5 or more Children | 0 (0.0%) | 0 (0.0%) |
| Total | 36 (57.1%) | 27 (42.9%) |
Income Below Poverty Among Single-Parent Households in Broomtown
| Children | Single Father | Single Mother |
| No Children | 0 (0.0%) | 0 (0.0%) |
| 1 or 2 Children | 0 (0.0%) | 0 (0.0%) |
| 3 or 4 Children | 0 (0.0%) | 0 (0.0%) |
| 5 or more Children | 0 (0.0%) | 0 (0.0%) |
| Total | 0 (0.0%) | 0 (0.0%) |
Income Below Poverty Among Married-Couple vs Single-Parent Households in Broomtown
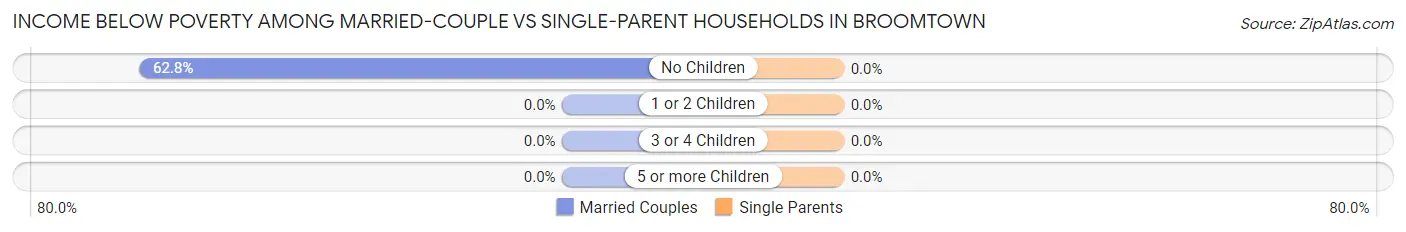
| Children | Married-Couple Families | Single-Parent Households |
| No Children | 27 (62.8%) | 0 (0.0%) |
| 1 or 2 Children | 0 (0.0%) | 0 (0.0%) |
| 3 or 4 Children | 0 (0.0%) | 0 (0.0%) |
| 5 or more Children | 0 (0.0%) | 0 (0.0%) |
| Total | 27 (42.9%) | 0 (0.0%) |
Race in Broomtown
The most populous races in Broomtown are White / Caucasian (189 | 89.6%), Hispanic or Latino (24 | 11.4%), and Two or more Races (15 | 7.1%).
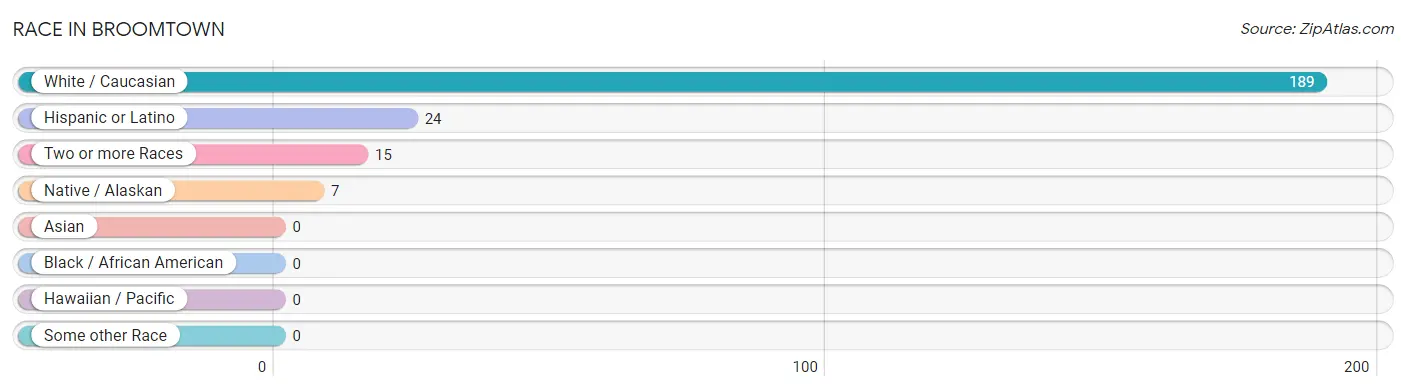
| Race | # Population | % Population |
| Asian | 0 | 0.0% |
| Black / African American | 0 | 0.0% |
| Hawaiian / Pacific | 0 | 0.0% |
| Hispanic or Latino | 24 | 11.4% |
| Native / Alaskan | 7 | 3.3% |
| White / Caucasian | 189 | 89.6% |
| Two or more Races | 15 | 7.1% |
| Some other Race | 0 | 0.0% |
| Total | 211 | 100.0% |
Ancestry in Broomtown
The most populous ancestries reported in Broomtown are American (27 | 12.8%), Mexican (24 | 11.4%), Irish (14 | 6.6%), and English (9 | 4.3%), together accounting for 35.1% of all Broomtown residents.
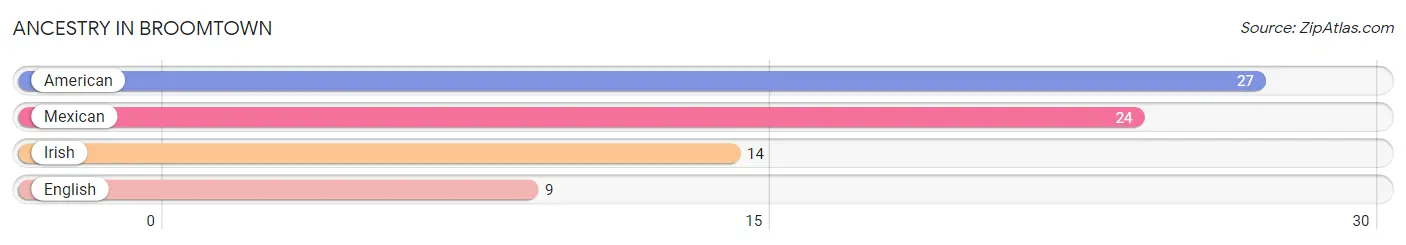
| Ancestry | # Population | % Population |
| American | 27 | 12.8% |
| English | 9 | 4.3% |
| Irish | 14 | 6.6% |
| Mexican | 24 | 11.4% | View All 4 Rows |
Immigrants in Broomtown

| Immigration Origin | # Population | % Population | View All 0 Rows |
Sex and Age in Broomtown
Sex and Age in Broomtown
The most populous age groups in Broomtown are 25 to 29 Years (26 | 38.8%) for men and 25 to 29 Years (34 | 23.6%) for women.
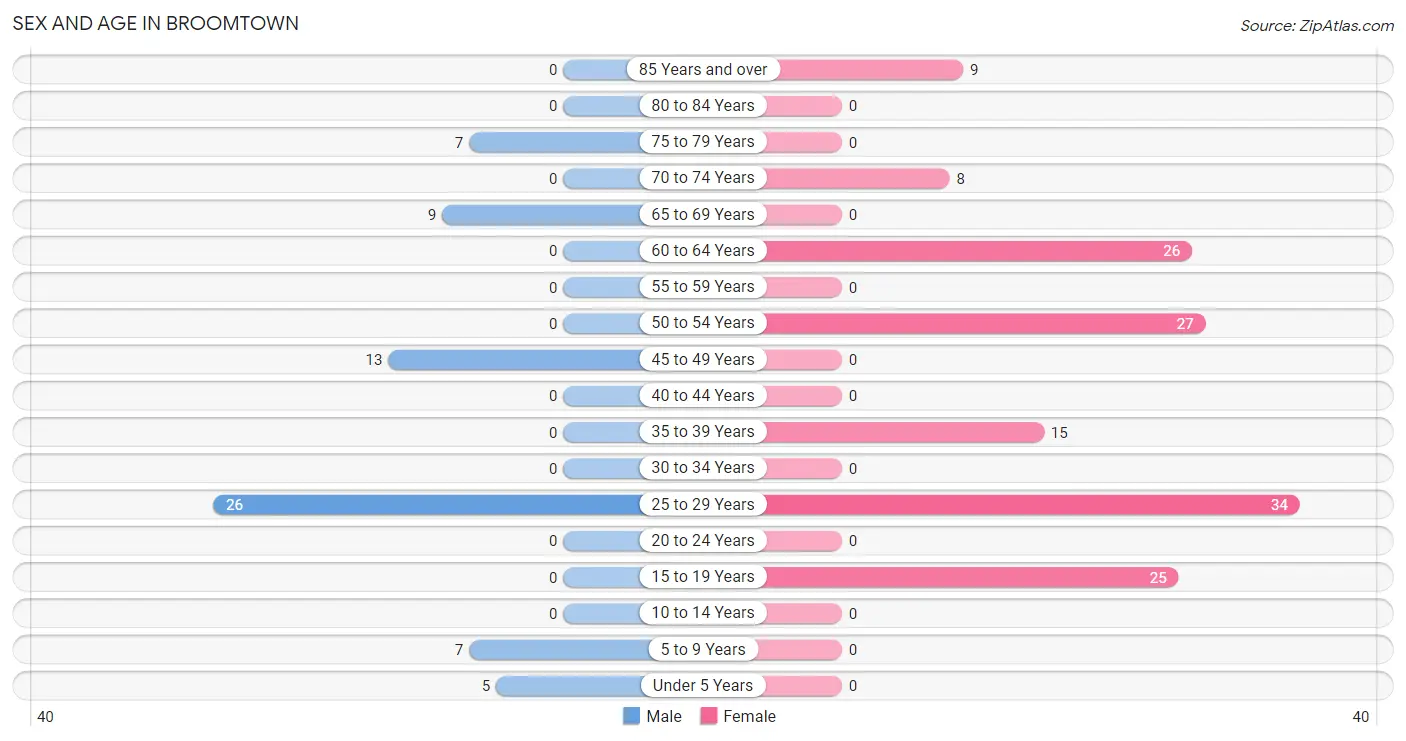
| Age Bracket | Male | Female |
| Under 5 Years | 5 (7.5%) | 0 (0.0%) |
| 5 to 9 Years | 7 (10.4%) | 0 (0.0%) |
| 10 to 14 Years | 0 (0.0%) | 0 (0.0%) |
| 15 to 19 Years | 0 (0.0%) | 25 (17.4%) |
| 20 to 24 Years | 0 (0.0%) | 0 (0.0%) |
| 25 to 29 Years | 26 (38.8%) | 34 (23.6%) |
| 30 to 34 Years | 0 (0.0%) | 0 (0.0%) |
| 35 to 39 Years | 0 (0.0%) | 15 (10.4%) |
| 40 to 44 Years | 0 (0.0%) | 0 (0.0%) |
| 45 to 49 Years | 13 (19.4%) | 0 (0.0%) |
| 50 to 54 Years | 0 (0.0%) | 27 (18.8%) |
| 55 to 59 Years | 0 (0.0%) | 0 (0.0%) |
| 60 to 64 Years | 0 (0.0%) | 26 (18.1%) |
| 65 to 69 Years | 9 (13.4%) | 0 (0.0%) |
| 70 to 74 Years | 0 (0.0%) | 8 (5.6%) |
| 75 to 79 Years | 7 (10.4%) | 0 (0.0%) |
| 80 to 84 Years | 0 (0.0%) | 0 (0.0%) |
| 85 Years and over | 0 (0.0%) | 9 (6.2%) |
| Total | 67 (100.0%) | 144 (100.0%) |
Families and Households in Broomtown
Median Family Size in Broomtown
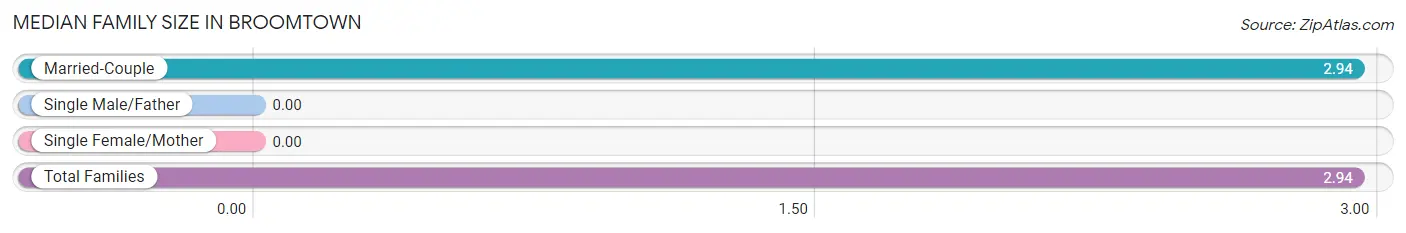
| Family Type | # Families | Family Size |
| Married-Couple | 63 (100.0%) | 2.94 |
| Single Male/Father | 0 (0.0%) | - |
| Single Female/Mother | 0 (0.0%) | - |
| Total Families | 63 (100.0%) | 2.94 |
Median Household Size in Broomtown
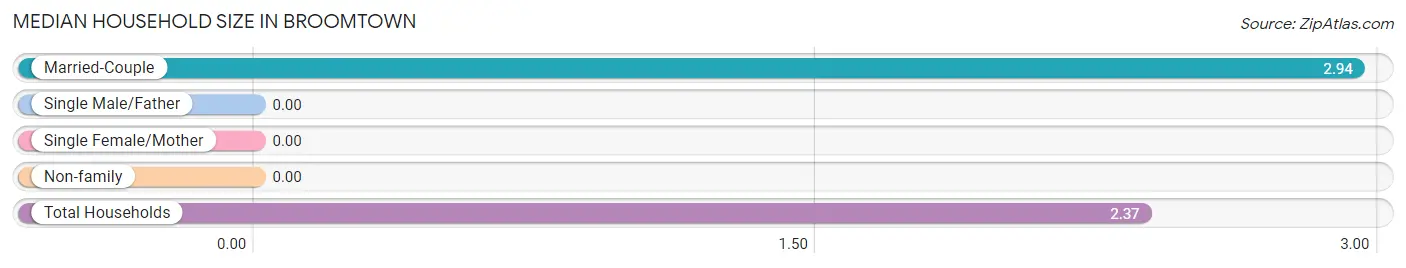
| Household Type | # Households | Household Size |
| Married-Couple | 63 (70.8%) | 2.94 |
| Single Male/Father | 0 (0.0%) | - |
| Single Female/Mother | 0 (0.0%) | - |
| Non-family | 26 (29.2%) | - |
| Total Households | 89 (100.0%) | 2.37 |
Household Size by Marriage Status in Broomtown
Out of a total of 89 households in Broomtown, 63 (70.8%) are family households, while 26 (29.2%) are nonfamily households. The most numerous type of family households are 2-person households, comprising 34, and the most common type of nonfamily households are 1-person households, comprising 26.
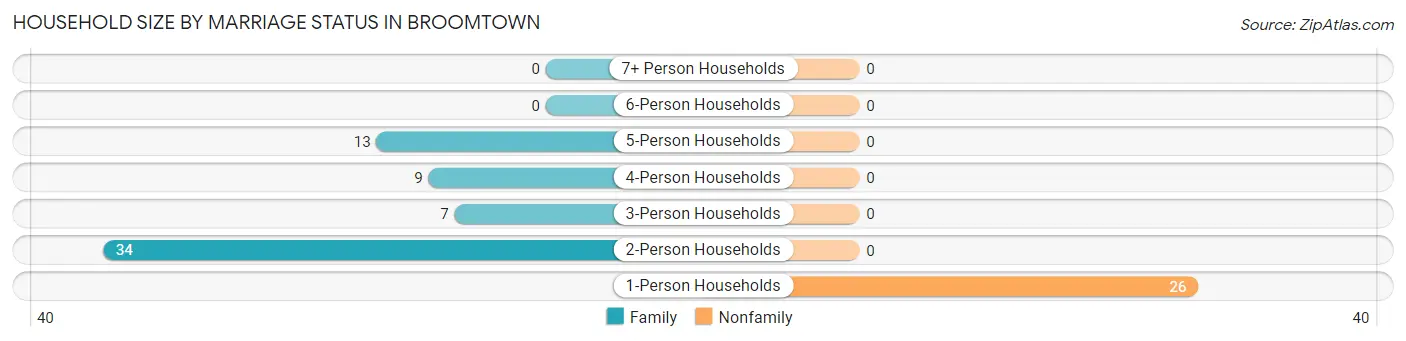
| Household Size | Family Households | Nonfamily Households |
| 1-Person Households | - | 26 (29.2%) |
| 2-Person Households | 34 (38.2%) | 0 (0.0%) |
| 3-Person Households | 7 (7.9%) | 0 (0.0%) |
| 4-Person Households | 9 (10.1%) | 0 (0.0%) |
| 5-Person Households | 13 (14.6%) | 0 (0.0%) |
| 6-Person Households | 0 (0.0%) | 0 (0.0%) |
| 7+ Person Households | 0 (0.0%) | 0 (0.0%) |
| Total | 63 (70.8%) | 26 (29.2%) |
Female Fertility in Broomtown
Fertility by Age in Broomtown
| Age Bracket | Women with Births | Births / 1,000 Women |
| 15 to 19 years | 0 (0.0%) | 0.0 |
| 20 to 34 years | 0 (0.0%) | 0.0 |
| 35 to 50 years | 0 (0.0%) | 0.0 |
| Total | 0 (0.0%) | 0.0 |
Fertility by Age by Marriage Status in Broomtown
| Age Bracket | Married | Unmarried |
| 15 to 19 years | 0 (0.0%) | 0 (0.0%) |
| 20 to 34 years | 0 (0.0%) | 0 (0.0%) |
| 35 to 50 years | 0 (0.0%) | 0 (0.0%) |
| Total | 0 (0.0%) | 0 (0.0%) |
Fertility by Education in Broomtown
| Educational Attainment | Women with Births | Births / 1,000 Women |
| Less than High School | 0 (0.0%) | 0.0 |
| High School Diploma | 0 (0.0%) | 0.0 |
| College or Associate's Degree | 0 (0.0%) | 0.0 |
| Bachelor's Degree | 0 (0.0%) | 0.0 |
| Graduate Degree | 0 (0.0%) | 0.0 |
| Total | 0 (0.0%) | 0.0 |
Fertility by Education by Marriage Status in Broomtown
| Educational Attainment | Married | Unmarried |
| Less than High School | 0 (0.0%) | 0 (0.0%) |
| High School Diploma | 0 (0.0%) | 0 (0.0%) |
| College or Associate's Degree | 0 (0.0%) | 0 (0.0%) |
| Bachelor's Degree | 0 (0.0%) | 0 (0.0%) |
| Graduate Degree | 0 (0.0%) | 0 (0.0%) |
| Total | 0 (0.0%) | 0 (0.0%) |
Employment Characteristics in Broomtown
Employment by Class of Employer in Broomtown
Among the 70 employed individuals in Broomtown, private company employees (46 | 65.7%), state government employees (9 | 12.9%), and self-employed (incorporated) (8 | 11.4%) make up the most common classes of employment.
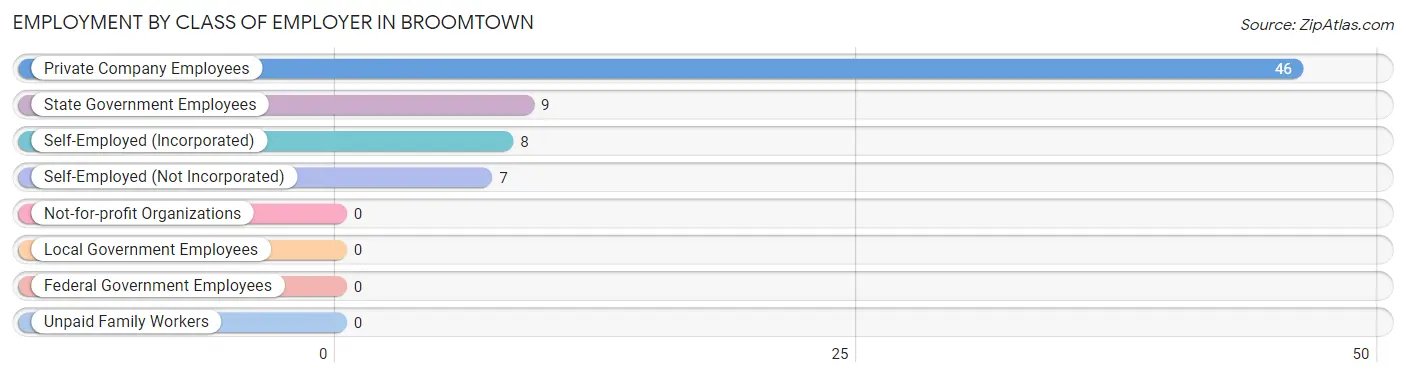
| Employer Class | # Employees | % Employees |
| Private Company Employees | 46 | 65.7% |
| Self-Employed (Incorporated) | 8 | 11.4% |
| Self-Employed (Not Incorporated) | 7 | 10.0% |
| Not-for-profit Organizations | 0 | 0.0% |
| Local Government Employees | 0 | 0.0% |
| State Government Employees | 9 | 12.9% |
| Federal Government Employees | 0 | 0.0% |
| Unpaid Family Workers | 0 | 0.0% |
| Total | 70 | 100.0% |
Employment Status by Age in Broomtown
According to the labor force statistics for Broomtown, out of the total population over 16 years of age (199), 48.7% or 97 individuals are in the labor force, with 27.8% or 27 of them unemployed. The age group with the highest labor force participation rate is 35 to 44 years, with 100.0% or 15 individuals in the labor force. Within the labor force, the 25 to 29 years age range has the highest percentage of unemployed individuals, with 79.4% or 27 of them being unemployed.
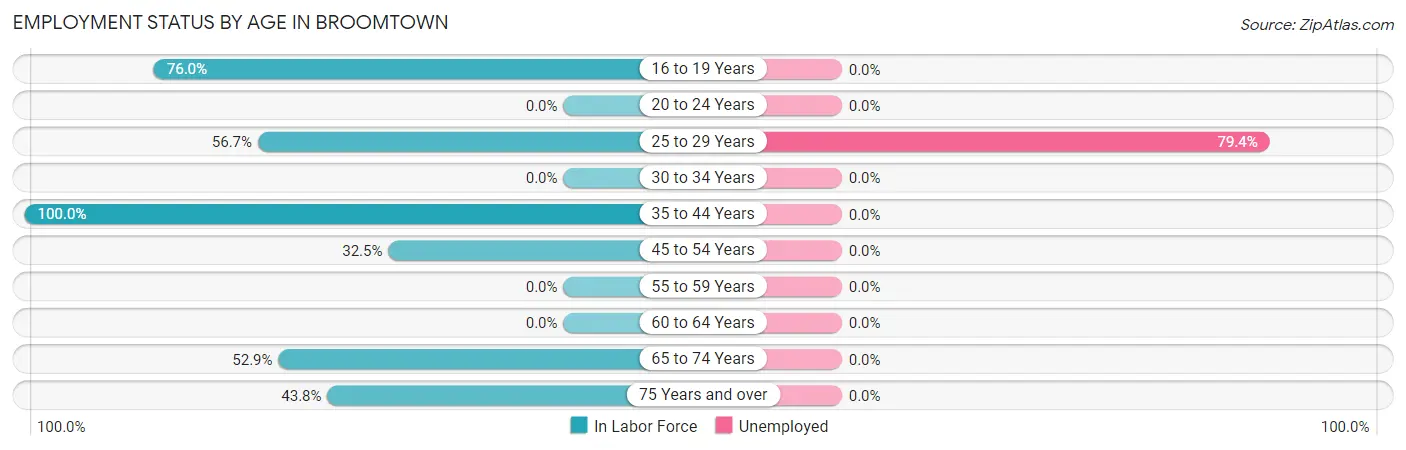
| Age Bracket | In Labor Force | Unemployed |
| 16 to 19 Years | 19 (76.0%) | 0 (0.0%) |
| 20 to 24 Years | 0 (0.0%) | 0 (0.0%) |
| 25 to 29 Years | 34 (56.7%) | 27 (79.4%) |
| 30 to 34 Years | 0 (0.0%) | 0 (0.0%) |
| 35 to 44 Years | 15 (100.0%) | 0 (0.0%) |
| 45 to 54 Years | 13 (32.5%) | 0 (0.0%) |
| 55 to 59 Years | 0 (0.0%) | 0 (0.0%) |
| 60 to 64 Years | 0 (0.0%) | 0 (0.0%) |
| 65 to 74 Years | 9 (52.9%) | 0 (0.0%) |
| 75 Years and over | 7 (43.8%) | 0 (0.0%) |
| Total | 97 (48.7%) | 27 (27.8%) |
Employment Status by Educational Attainment in Broomtown
According to labor force statistics for Broomtown, 44.0% of individuals (62) out of the total population between 25 and 64 years of age (141) are in the labor force, with 43.5% or 27 of them being unemployed. The group with the highest labor force participation rate are those with the educational attainment of bachelor's degree or higher, with 100.0% or 27 individuals in the labor force. Within the labor force, individuals with bachelor's degree or higher education have the highest percentage of unemployment, with 100.0% or 27 of them being unemployed.
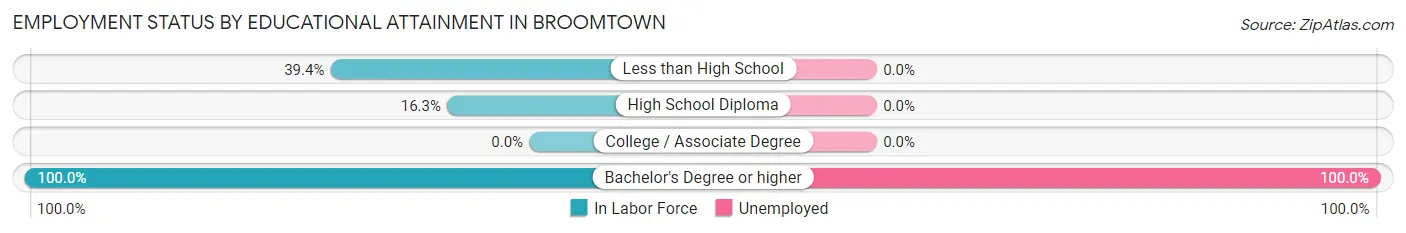
| Educational Attainment | In Labor Force | Unemployed |
| Less than High School | 28 (39.4%) | 0 (0.0%) |
| High School Diploma | 7 (16.3%) | 0 (0.0%) |
| College / Associate Degree | 0 (0.0%) | 0 (0.0%) |
| Bachelor's Degree or higher | 27 (100.0%) | 27 (100.0%) |
| Total | 62 (44.0%) | 61 (43.5%) |
Employment Occupations by Sex in Broomtown
Management, Business, Science and Arts Occupations
The most common Management, Business, Science and Arts occupations in Broomtown are , and Management (7 | 10.0%).
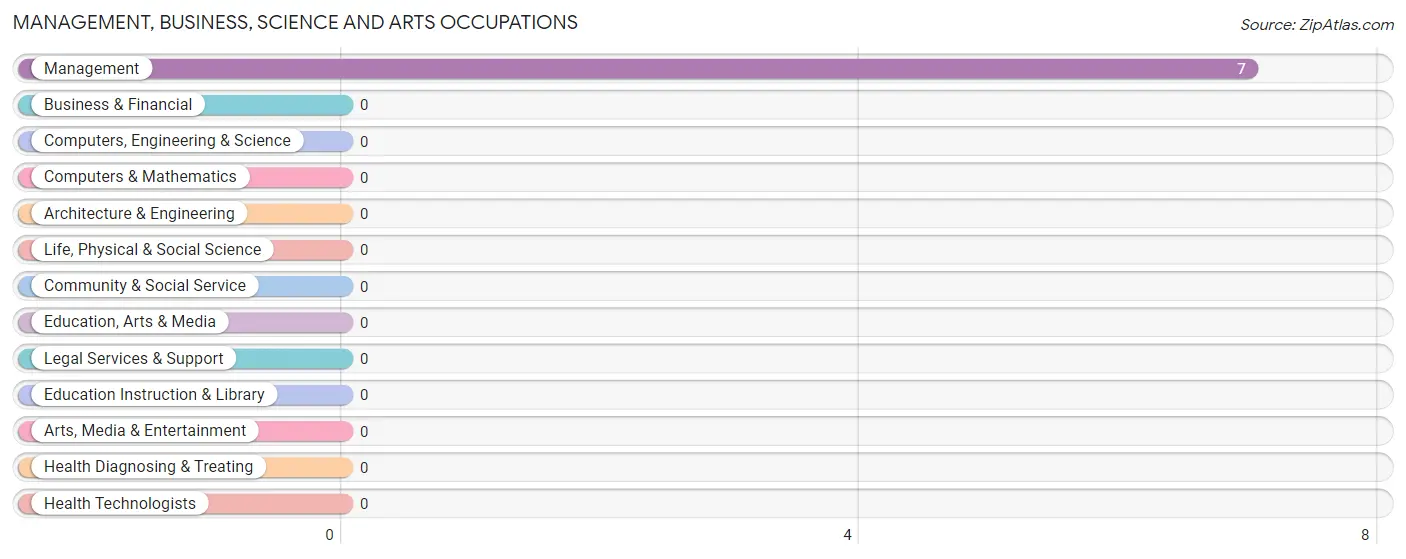
Management, Business, Science and Arts Occupations by Sex
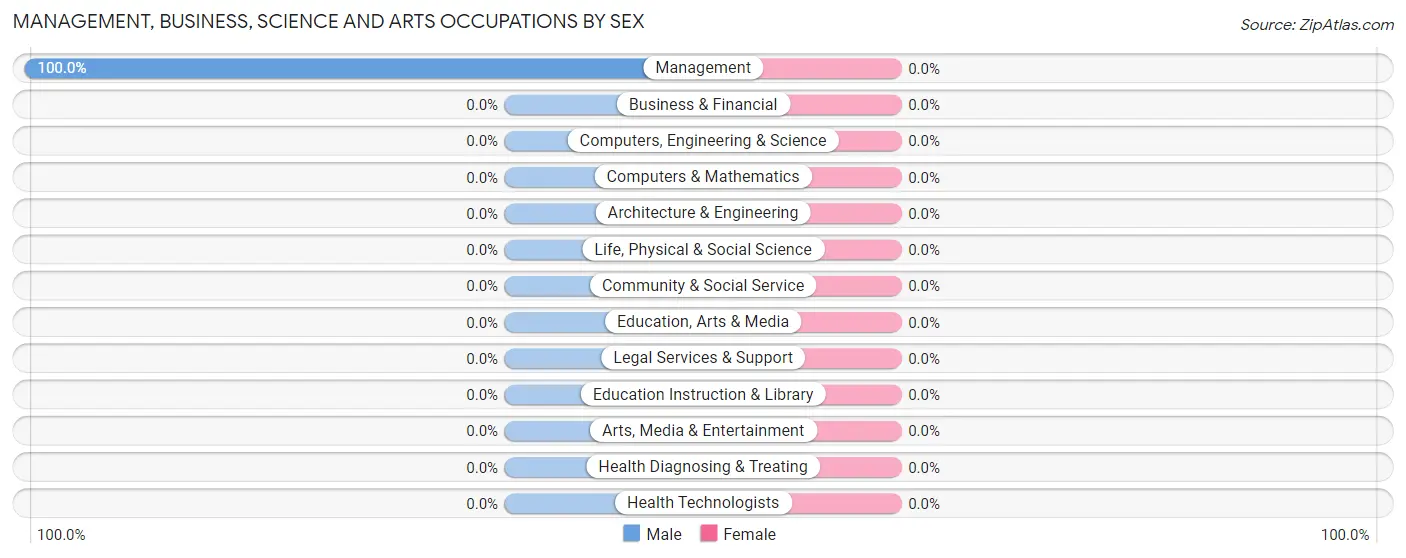
| Occupation | Male | Female |
| Management | 7 (100.0%) | 0 (0.0%) |
| Business & Financial | 0 (0.0%) | 0 (0.0%) |
| Computers, Engineering & Science | 0 (0.0%) | 0 (0.0%) |
| Computers & Mathematics | 0 (0.0%) | 0 (0.0%) |
| Architecture & Engineering | 0 (0.0%) | 0 (0.0%) |
| Life, Physical & Social Science | 0 (0.0%) | 0 (0.0%) |
| Community & Social Service | 0 (0.0%) | 0 (0.0%) |
| Education, Arts & Media | 0 (0.0%) | 0 (0.0%) |
| Legal Services & Support | 0 (0.0%) | 0 (0.0%) |
| Education Instruction & Library | 0 (0.0%) | 0 (0.0%) |
| Arts, Media & Entertainment | 0 (0.0%) | 0 (0.0%) |
| Health Diagnosing & Treating | 0 (0.0%) | 0 (0.0%) |
| Health Technologists | 0 (0.0%) | 0 (0.0%) |
| Total (Category) | 7 (100.0%) | 0 (0.0%) |
| Total (Overall) | 29 (41.4%) | 41 (58.6%) |
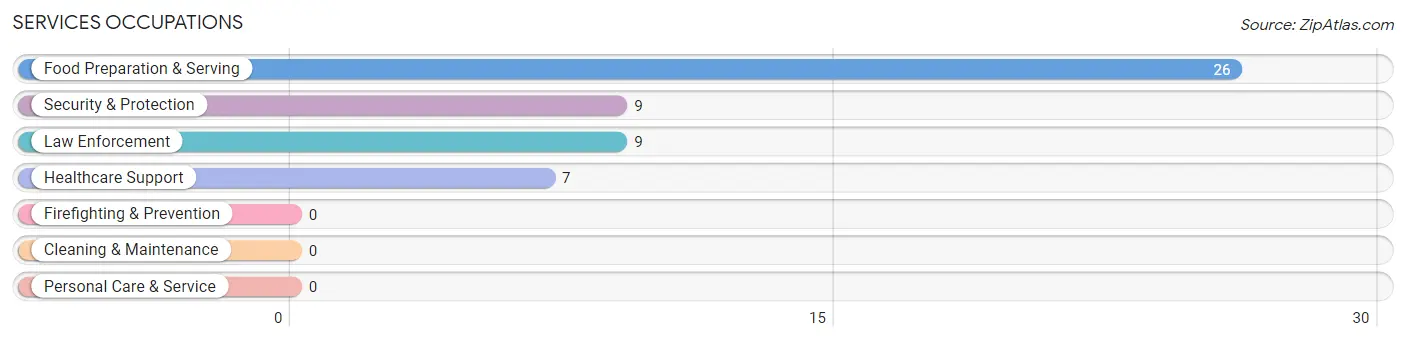
Services Occupations
The most common Services occupations in Broomtown are Food Preparation & Serving (26 | 37.1%), Security & Protection (9 | 12.9%), Law Enforcement (9 | 12.9%), and Healthcare Support (7 | 10.0%).
Services Occupations by Sex
Within the Services occupations in Broomtown, the most male-oriented occupations are Security & Protection (100.0%), and Law Enforcement (100.0%), while the most female-oriented occupations are Healthcare Support (100.0%), and Food Preparation & Serving (100.0%).
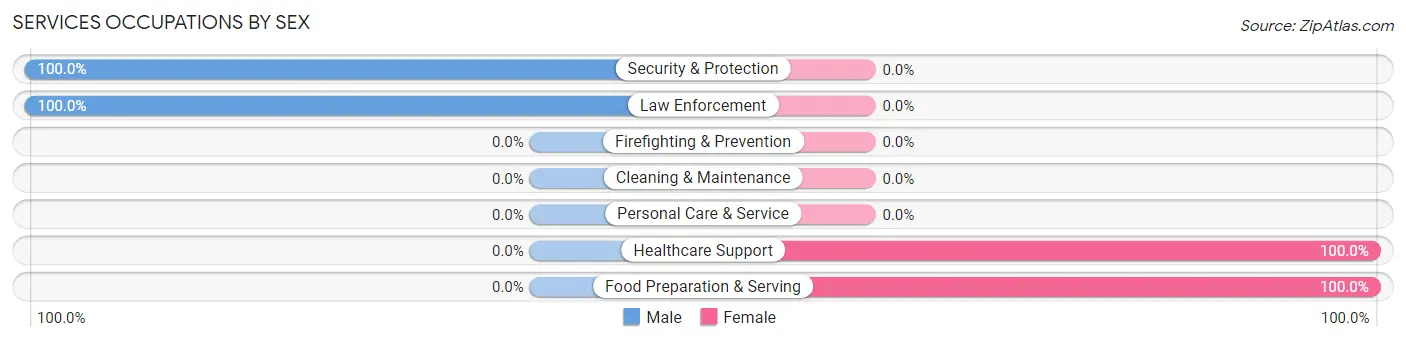
| Occupation | Male | Female |
| Healthcare Support | 0 (0.0%) | 7 (100.0%) |
| Security & Protection | 9 (100.0%) | 0 (0.0%) |
| Firefighting & Prevention | 0 (0.0%) | 0 (0.0%) |
| Law Enforcement | 9 (100.0%) | 0 (0.0%) |
| Food Preparation & Serving | 0 (0.0%) | 26 (100.0%) |
| Cleaning & Maintenance | 0 (0.0%) | 0 (0.0%) |
| Personal Care & Service | 0 (0.0%) | 0 (0.0%) |
| Total (Category) | 9 (21.4%) | 33 (78.6%) |
| Total (Overall) | 29 (41.4%) | 41 (58.6%) |
Sales and Office Occupations
Sales and Office Occupations by Sex
| Occupation | Male | Female |
| Sales & Related | 0 (0.0%) | 0 (0.0%) |
| Office & Administration | 0 (0.0%) | 0 (0.0%) |
| Total (Category) | 0 (0.0%) | 0 (0.0%) |
| Total (Overall) | 29 (41.4%) | 41 (58.6%) |
Natural Resources, Construction and Maintenance Occupations
Natural Resources, Construction and Maintenance Occupations by Sex
| Occupation | Male | Female |
| Farming, Fishing & Forestry | 0 (0.0%) | 0 (0.0%) |
| Construction & Extraction | 0 (0.0%) | 0 (0.0%) |
| Installation, Maintenance & Repair | 0 (0.0%) | 0 (0.0%) |
| Total (Category) | 0 (0.0%) | 0 (0.0%) |
| Total (Overall) | 29 (41.4%) | 41 (58.6%) |
Production, Transportation and Moving Occupations
The most common Production, Transportation and Moving occupations in Broomtown are Production (13 | 18.6%), and Material Moving (8 | 11.4%).
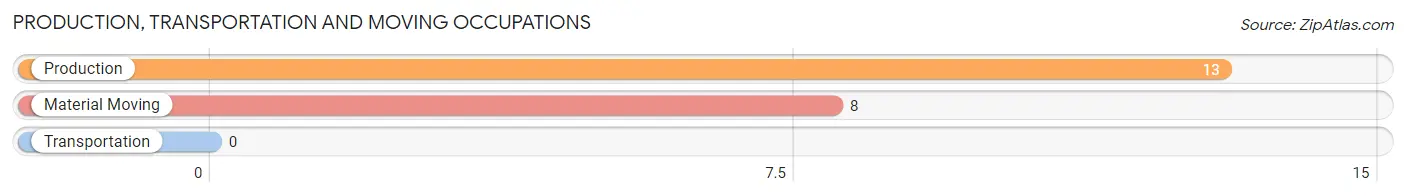
Production, Transportation and Moving Occupations by Sex
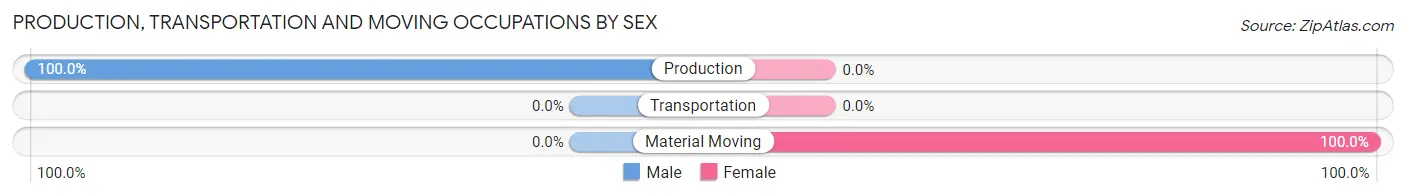
| Occupation | Male | Female |
| Production | 13 (100.0%) | 0 (0.0%) |
| Transportation | 0 (0.0%) | 0 (0.0%) |
| Material Moving | 0 (0.0%) | 8 (100.0%) |
| Total (Category) | 13 (61.9%) | 8 (38.1%) |
| Total (Overall) | 29 (41.4%) | 41 (58.6%) |
Employment Industries by Sex in Broomtown
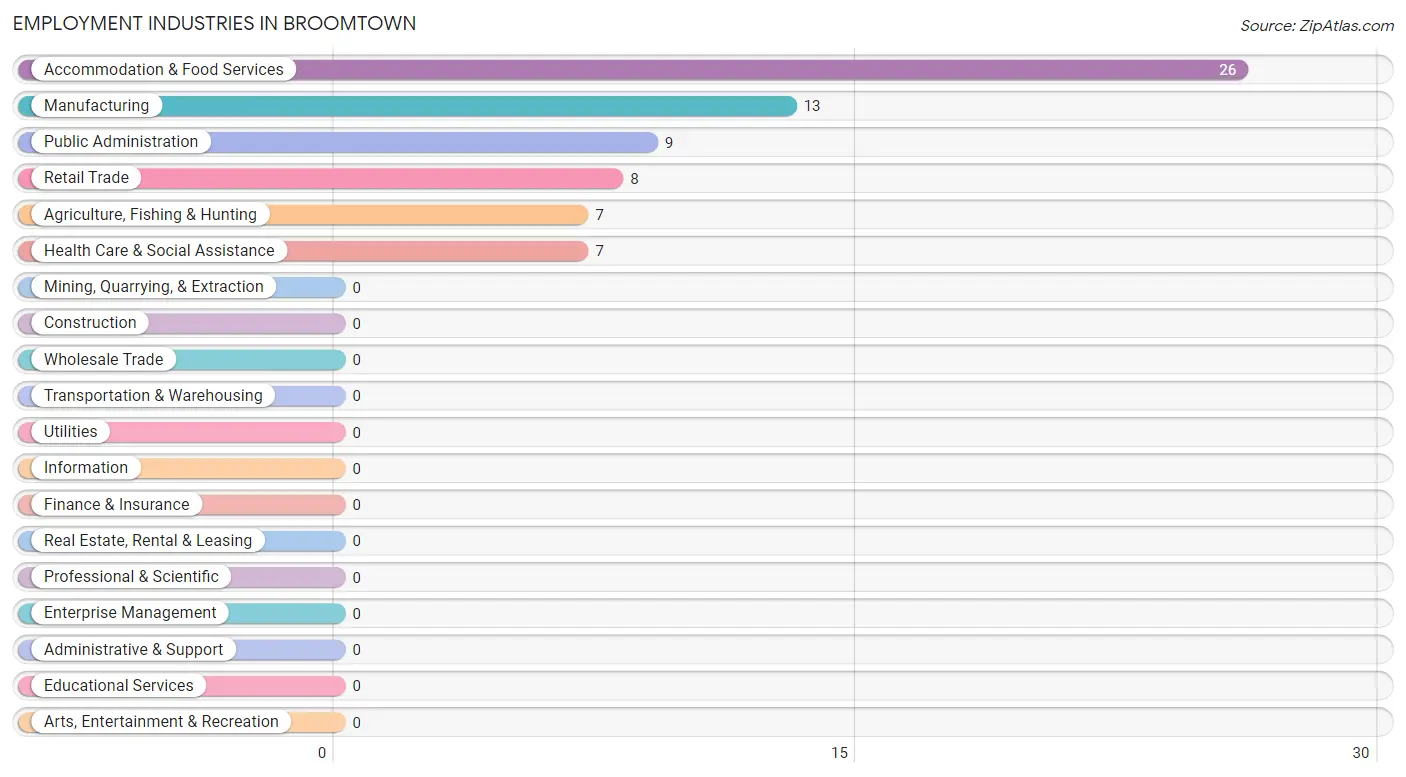
Employment Industries in Broomtown
The major employment industries in Broomtown include Accommodation & Food Services (26 | 37.1%), Manufacturing (13 | 18.6%), Public Administration (9 | 12.9%), Retail Trade (8 | 11.4%), and Agriculture, Fishing & Hunting (7 | 10.0%).
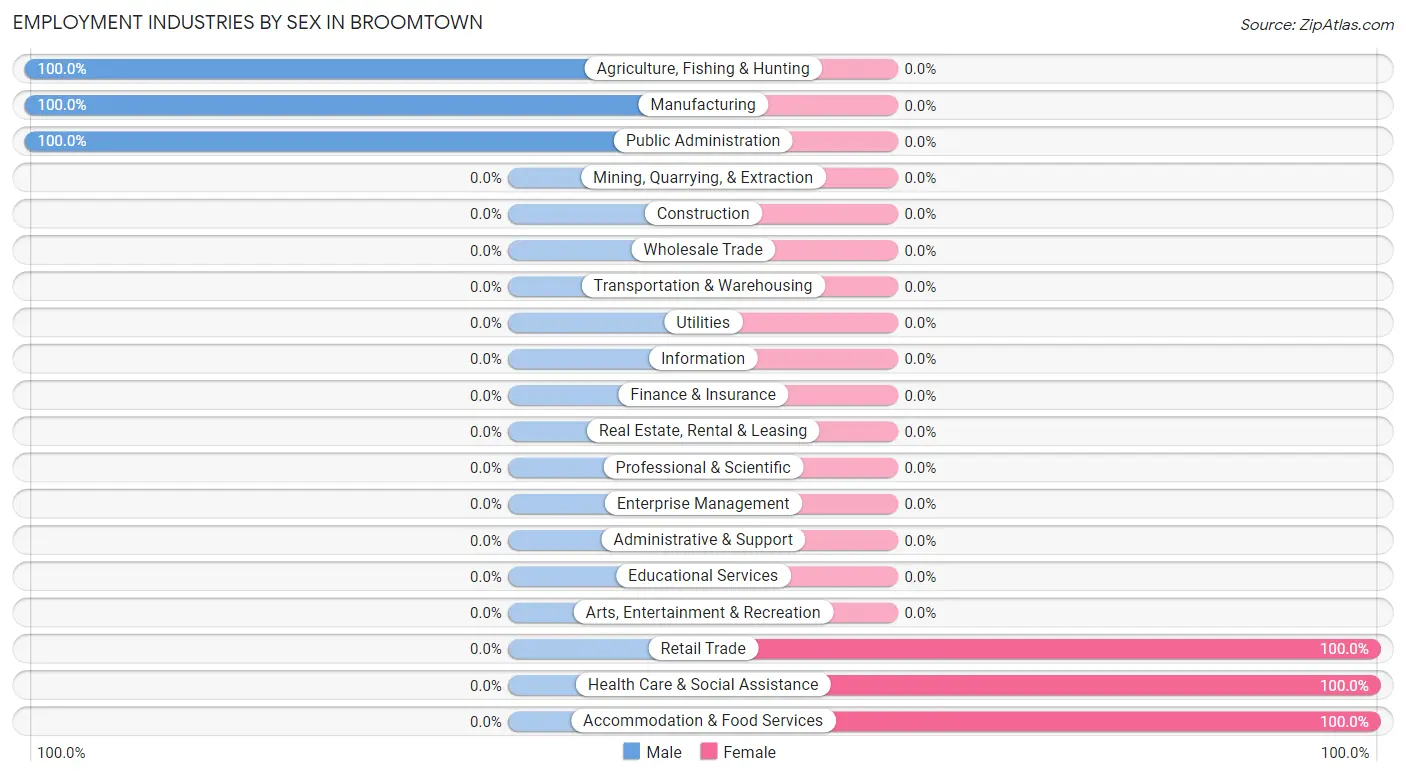
Employment Industries by Sex in Broomtown
The Broomtown industries that see more men than women are Agriculture, Fishing & Hunting (100.0%), Manufacturing (100.0%), and Public Administration (100.0%), whereas the industries that tend to have a higher number of women are Retail Trade (100.0%), Health Care & Social Assistance (100.0%), and Accommodation & Food Services (100.0%).
| Industry | Male | Female |
| Agriculture, Fishing & Hunting | 7 (100.0%) | 0 (0.0%) |
| Mining, Quarrying, & Extraction | 0 (0.0%) | 0 (0.0%) |
| Construction | 0 (0.0%) | 0 (0.0%) |
| Manufacturing | 13 (100.0%) | 0 (0.0%) |
| Wholesale Trade | 0 (0.0%) | 0 (0.0%) |
| Retail Trade | 0 (0.0%) | 8 (100.0%) |
| Transportation & Warehousing | 0 (0.0%) | 0 (0.0%) |
| Utilities | 0 (0.0%) | 0 (0.0%) |
| Information | 0 (0.0%) | 0 (0.0%) |
| Finance & Insurance | 0 (0.0%) | 0 (0.0%) |
| Real Estate, Rental & Leasing | 0 (0.0%) | 0 (0.0%) |
| Professional & Scientific | 0 (0.0%) | 0 (0.0%) |
| Enterprise Management | 0 (0.0%) | 0 (0.0%) |
| Administrative & Support | 0 (0.0%) | 0 (0.0%) |
| Educational Services | 0 (0.0%) | 0 (0.0%) |
| Health Care & Social Assistance | 0 (0.0%) | 7 (100.0%) |
| Arts, Entertainment & Recreation | 0 (0.0%) | 0 (0.0%) |
| Accommodation & Food Services | 0 (0.0%) | 26 (100.0%) |
| Public Administration | 9 (100.0%) | 0 (0.0%) |
| Total | 29 (41.4%) | 41 (58.6%) |
Education in Broomtown
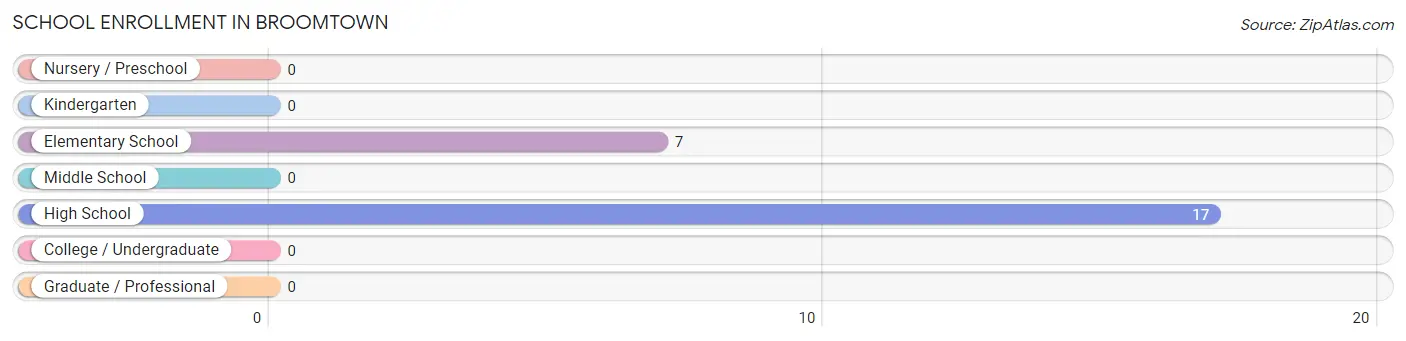
School Enrollment in Broomtown
The most common levels of schooling among the 24 students in Broomtown are high school (17 | 70.8%), and elementary school (7 | 29.2%).
| School Level | # Students | % Students |
| Nursery / Preschool | 0 | 0.0% |
| Kindergarten | 0 | 0.0% |
| Elementary School | 7 | 29.2% |
| Middle School | 0 | 0.0% |
| High School | 17 | 70.8% |
| College / Undergraduate | 0 | 0.0% |
| Graduate / Professional | 0 | 0.0% |
| Total | 24 | 100.0% |
School Enrollment by Age by Funding Source in Broomtown
Out of a total of 24 students who are enrolled in schools in Broomtown, 7 (29.2%) attend a private institution, while the remaining 17 (70.8%) are enrolled in public schools. The age group of 5 to 9 year old has the highest likelihood of being enrolled in private schools, with 7 (100.0% in the age bracket) enrolled. Conversely, the age group of 15 to 17 year olds has the lowest likelihood of being enrolled in a private school, with 6 (100.0% in the age bracket) attending a public institution.
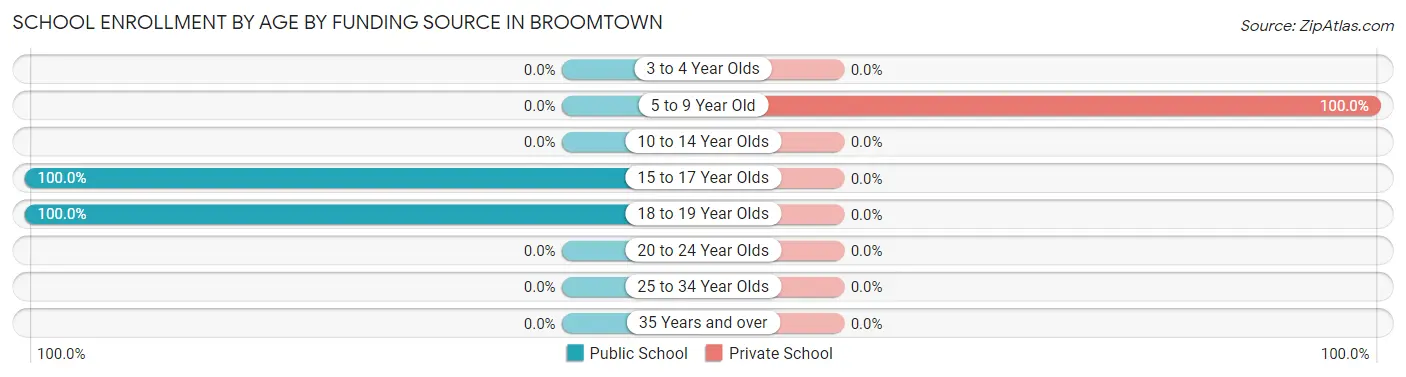
| Age Bracket | Public School | Private School |
| 3 to 4 Year Olds | 0 (0.0%) | 0 (0.0%) |
| 5 to 9 Year Old | 0 (0.0%) | 7 (100.0%) |
| 10 to 14 Year Olds | 0 (0.0%) | 0 (0.0%) |
| 15 to 17 Year Olds | 6 (100.0%) | 0 (0.0%) |
| 18 to 19 Year Olds | 11 (100.0%) | 0 (0.0%) |
| 20 to 24 Year Olds | 0 (0.0%) | 0 (0.0%) |
| 25 to 34 Year Olds | 0 (0.0%) | 0 (0.0%) |
| 35 Years and over | 0 (0.0%) | 0 (0.0%) |
| Total | 17 (70.8%) | 7 (29.2%) |
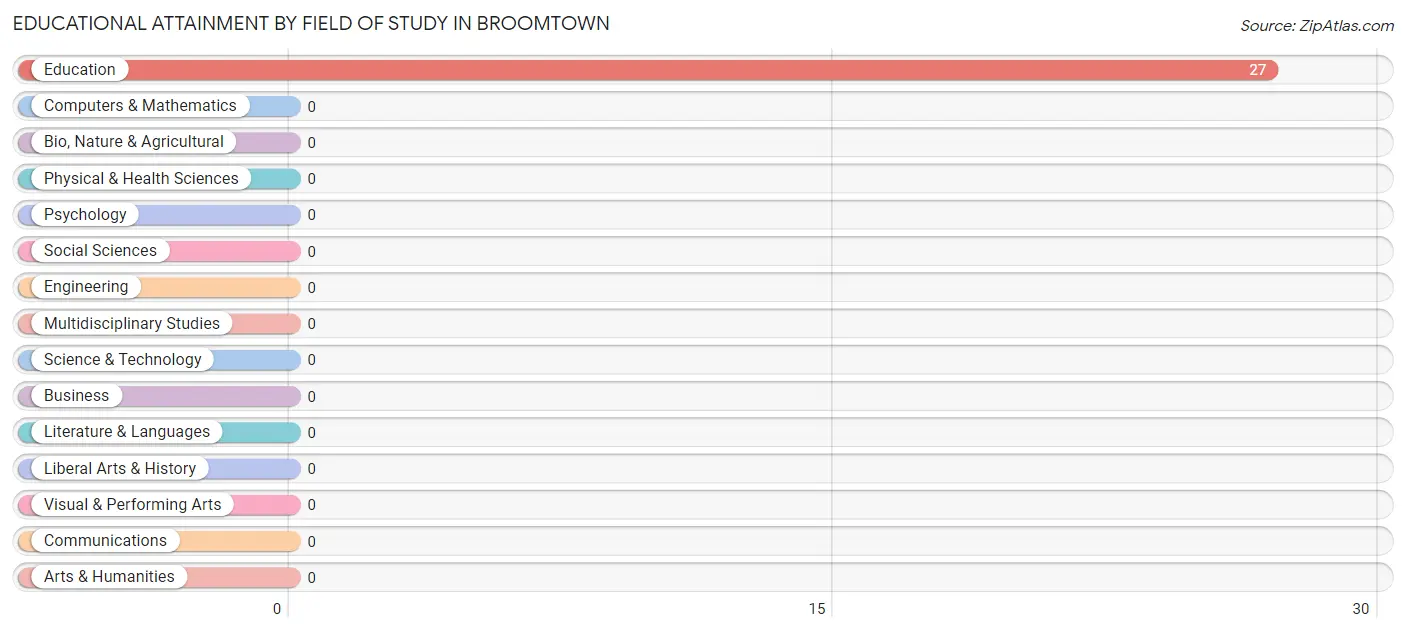
Educational Attainment by Field of Study in Broomtown
, and education (27 | 100.0%) are the most common fields of study among 27 individuals in Broomtown who have obtained a bachelor's degree or higher.
| Field of Study | # Graduates | % Graduates |
| Computers & Mathematics | 0 | 0.0% |
| Bio, Nature & Agricultural | 0 | 0.0% |
| Physical & Health Sciences | 0 | 0.0% |
| Psychology | 0 | 0.0% |
| Social Sciences | 0 | 0.0% |
| Engineering | 0 | 0.0% |
| Multidisciplinary Studies | 0 | 0.0% |
| Science & Technology | 0 | 0.0% |
| Business | 0 | 0.0% |
| Education | 27 | 100.0% |
| Literature & Languages | 0 | 0.0% |
| Liberal Arts & History | 0 | 0.0% |
| Visual & Performing Arts | 0 | 0.0% |
| Communications | 0 | 0.0% |
| Arts & Humanities | 0 | 0.0% |
| Total | 27 | 100.0% |
Transportation & Commute in Broomtown
Vehicle Availability by Sex in Broomtown
The most prevalent vehicle ownership categories in Broomtown are males with 4 vehicles (13, accounting for 44.8%) and females with 4 vehicles (26, making up 31.7%).
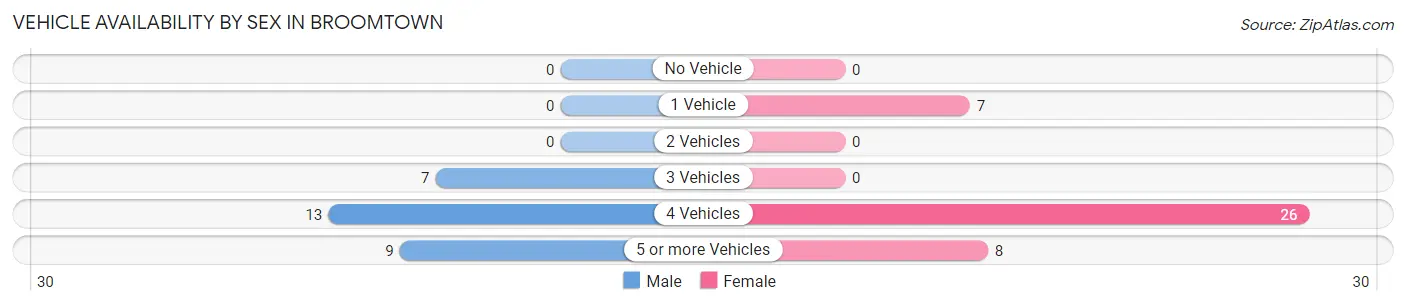
| Vehicles Available | Male | Female |
| No Vehicle | 0 (0.0%) | 0 (0.0%) |
| 1 Vehicle | 0 (0.0%) | 7 (17.1%) |
| 2 Vehicles | 0 (0.0%) | 0 (0.0%) |
| 3 Vehicles | 7 (24.1%) | 0 (0.0%) |
| 4 Vehicles | 13 (44.8%) | 26 (63.4%) |
| 5 or more Vehicles | 9 (31.0%) | 8 (19.5%) |
| Total | 29 (100.0%) | 41 (100.0%) |
Commute Time in Broomtown
The most frequently occuring commute durations in Broomtown are 60 to 89 minutes (26 commuters, 37.1%), 30 to 34 minutes (22 commuters, 31.4%), and 25 to 29 minutes (13 commuters, 18.6%).
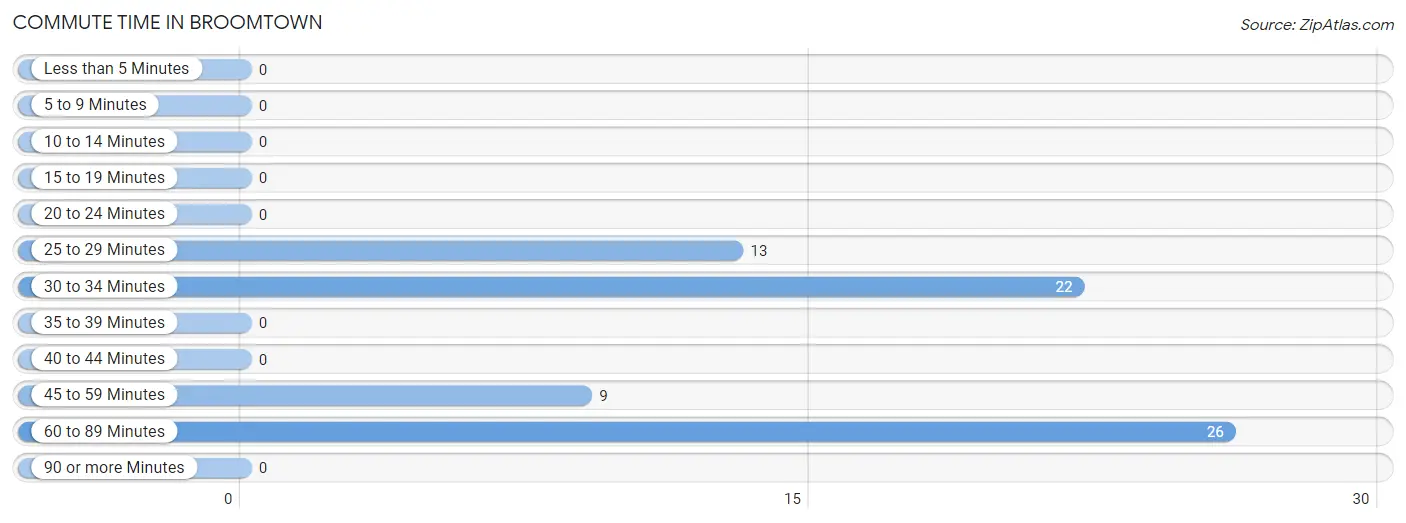
| Commute Time | # Commuters | % Commuters |
| Less than 5 Minutes | 0 | 0.0% |
| 5 to 9 Minutes | 0 | 0.0% |
| 10 to 14 Minutes | 0 | 0.0% |
| 15 to 19 Minutes | 0 | 0.0% |
| 20 to 24 Minutes | 0 | 0.0% |
| 25 to 29 Minutes | 13 | 18.6% |
| 30 to 34 Minutes | 22 | 31.4% |
| 35 to 39 Minutes | 0 | 0.0% |
| 40 to 44 Minutes | 0 | 0.0% |
| 45 to 59 Minutes | 9 | 12.9% |
| 60 to 89 Minutes | 26 | 37.1% |
| 90 or more Minutes | 0 | 0.0% |
Commute Time by Sex in Broomtown
The most common commute times in Broomtown are 25 to 29 minutes (13 commuters, 44.8%) for males and 60 to 89 minutes (26 commuters, 63.4%) for females.
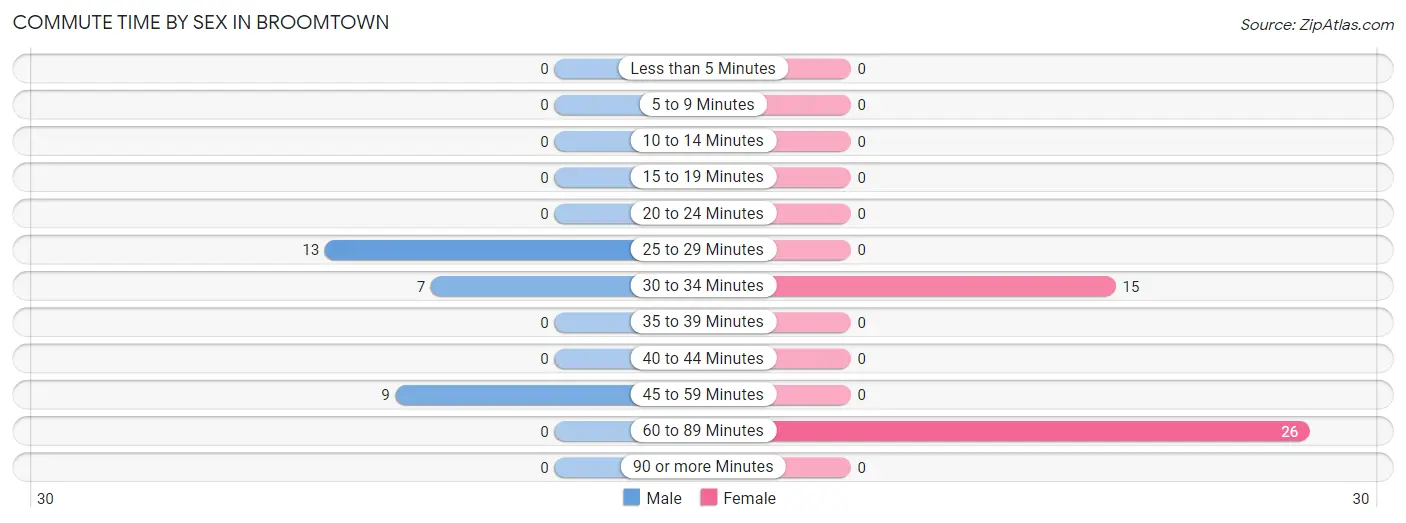
| Commute Time | Male | Female |
| Less than 5 Minutes | 0 (0.0%) | 0 (0.0%) |
| 5 to 9 Minutes | 0 (0.0%) | 0 (0.0%) |
| 10 to 14 Minutes | 0 (0.0%) | 0 (0.0%) |
| 15 to 19 Minutes | 0 (0.0%) | 0 (0.0%) |
| 20 to 24 Minutes | 0 (0.0%) | 0 (0.0%) |
| 25 to 29 Minutes | 13 (44.8%) | 0 (0.0%) |
| 30 to 34 Minutes | 7 (24.1%) | 15 (36.6%) |
| 35 to 39 Minutes | 0 (0.0%) | 0 (0.0%) |
| 40 to 44 Minutes | 0 (0.0%) | 0 (0.0%) |
| 45 to 59 Minutes | 9 (31.0%) | 0 (0.0%) |
| 60 to 89 Minutes | 0 (0.0%) | 26 (63.4%) |
| 90 or more Minutes | 0 (0.0%) | 0 (0.0%) |
Time of Departure to Work by Sex in Broomtown
The most frequent times of departure to work in Broomtown are 4:00 PM to 11:59 PM (13, 44.8%) for males and 4:00 PM to 11:59 PM (18, 43.9%) for females.
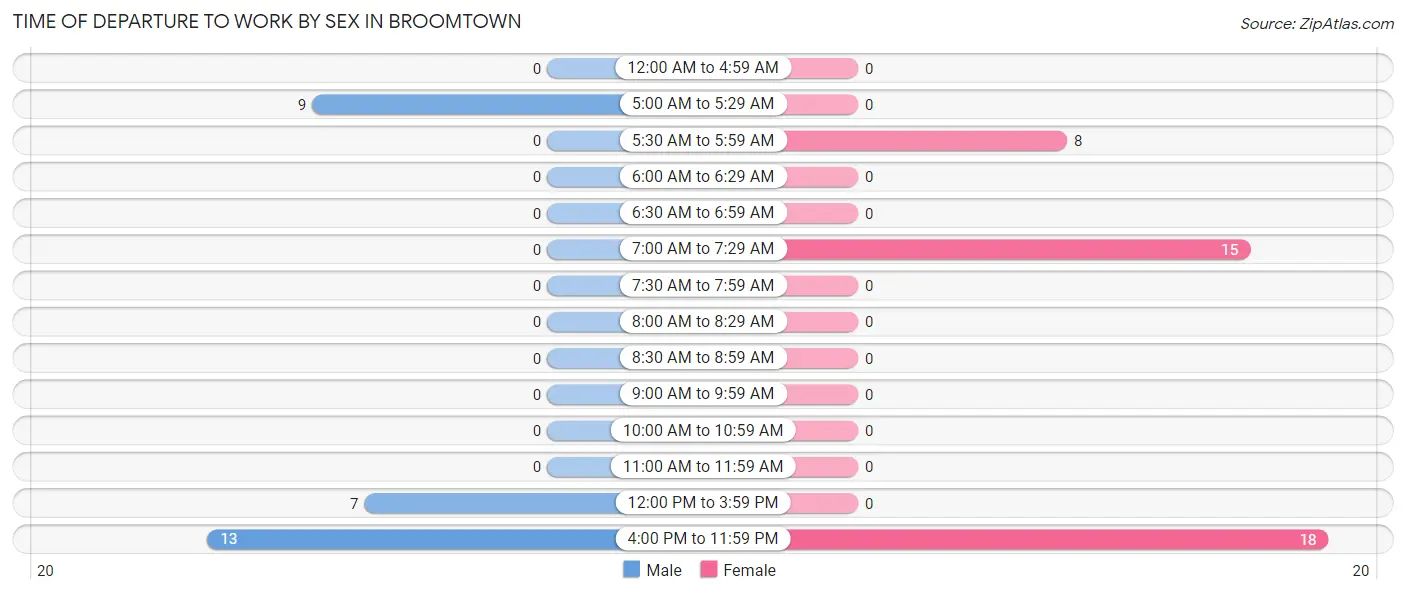
| Time of Departure | Male | Female |
| 12:00 AM to 4:59 AM | 0 (0.0%) | 0 (0.0%) |
| 5:00 AM to 5:29 AM | 9 (31.0%) | 0 (0.0%) |
| 5:30 AM to 5:59 AM | 0 (0.0%) | 8 (19.5%) |
| 6:00 AM to 6:29 AM | 0 (0.0%) | 0 (0.0%) |
| 6:30 AM to 6:59 AM | 0 (0.0%) | 0 (0.0%) |
| 7:00 AM to 7:29 AM | 0 (0.0%) | 15 (36.6%) |
| 7:30 AM to 7:59 AM | 0 (0.0%) | 0 (0.0%) |
| 8:00 AM to 8:29 AM | 0 (0.0%) | 0 (0.0%) |
| 8:30 AM to 8:59 AM | 0 (0.0%) | 0 (0.0%) |
| 9:00 AM to 9:59 AM | 0 (0.0%) | 0 (0.0%) |
| 10:00 AM to 10:59 AM | 0 (0.0%) | 0 (0.0%) |
| 11:00 AM to 11:59 AM | 0 (0.0%) | 0 (0.0%) |
| 12:00 PM to 3:59 PM | 7 (24.1%) | 0 (0.0%) |
| 4:00 PM to 11:59 PM | 13 (44.8%) | 18 (43.9%) |
| Total | 29 (100.0%) | 41 (100.0%) |
Housing Occupancy in Broomtown
Occupancy by Ownership in Broomtown
Of the total 89 dwellings in Broomtown, owner-occupied units account for 76 (85.4%), while renter-occupied units make up 13 (14.6%).
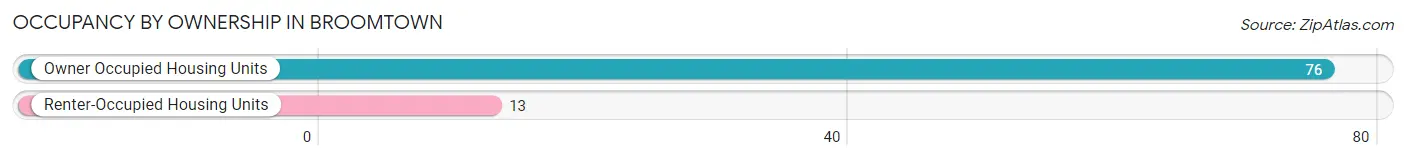
| Occupancy | # Housing Units | % Housing Units |
| Owner Occupied Housing Units | 76 | 85.4% |
| Renter-Occupied Housing Units | 13 | 14.6% |
| Total Occupied Housing Units | 89 | 100.0% |
Occupancy by Household Size in Broomtown
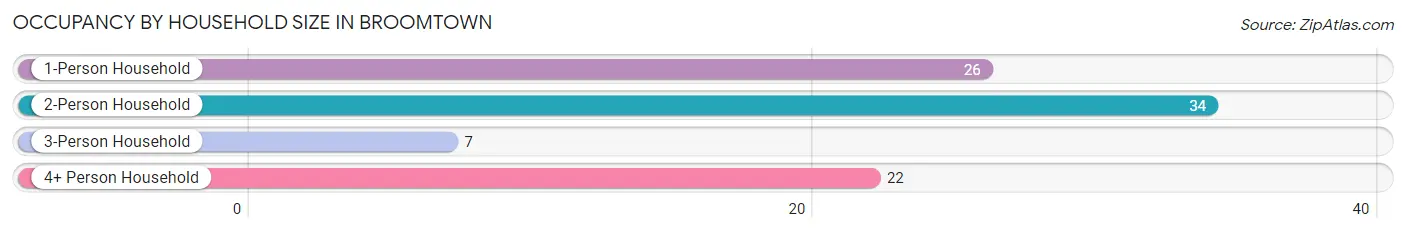
| Household Size | # Housing Units | % Housing Units |
| 1-Person Household | 26 | 29.2% |
| 2-Person Household | 34 | 38.2% |
| 3-Person Household | 7 | 7.9% |
| 4+ Person Household | 22 | 24.7% |
| Total Housing Units | 89 | 100.0% |
Occupancy by Ownership by Household Size in Broomtown
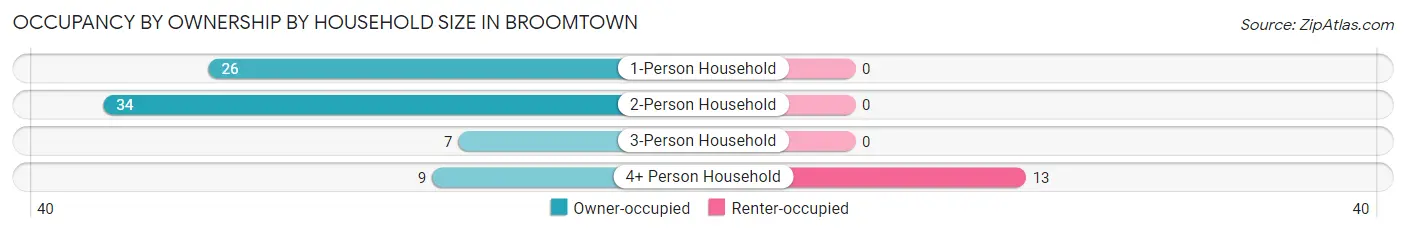
| Household Size | Owner-occupied | Renter-occupied |
| 1-Person Household | 26 (100.0%) | 0 (0.0%) |
| 2-Person Household | 34 (100.0%) | 0 (0.0%) |
| 3-Person Household | 7 (100.0%) | 0 (0.0%) |
| 4+ Person Household | 9 (40.9%) | 13 (59.1%) |
| Total Housing Units | 76 (85.4%) | 13 (14.6%) |
Occupancy by Educational Attainment in Broomtown
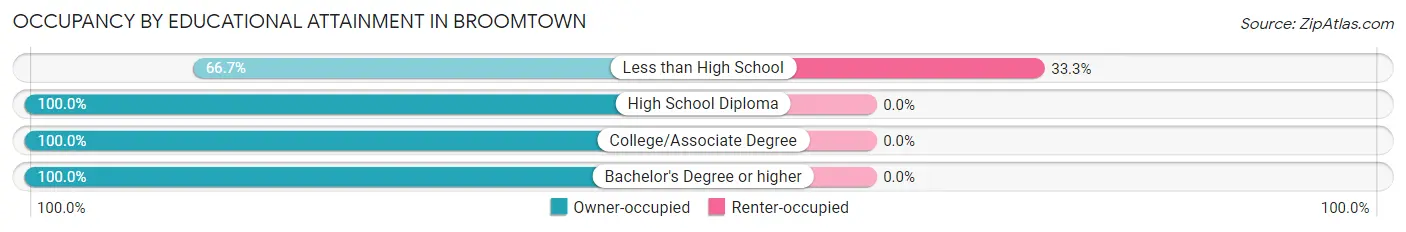
| Household Size | Owner-occupied | Renter-occupied |
| Less than High School | 26 (66.7%) | 13 (33.3%) |
| High School Diploma | 16 (100.0%) | 0 (0.0%) |
| College/Associate Degree | 7 (100.0%) | 0 (0.0%) |
| Bachelor's Degree or higher | 27 (100.0%) | 0 (0.0%) |
Occupancy by Age of Householder in Broomtown
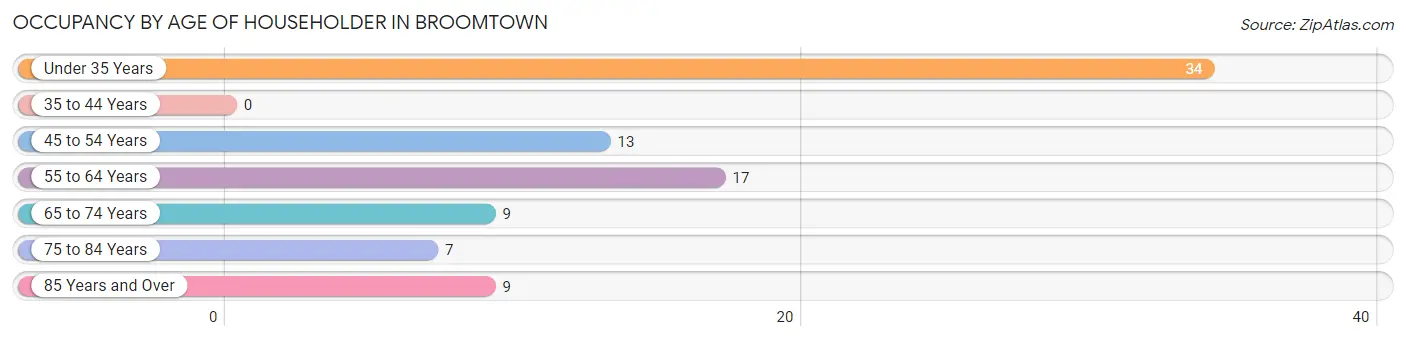
| Age Bracket | # Households | % Households |
| Under 35 Years | 34 | 38.2% |
| 35 to 44 Years | 0 | 0.0% |
| 45 to 54 Years | 13 | 14.6% |
| 55 to 64 Years | 17 | 19.1% |
| 65 to 74 Years | 9 | 10.1% |
| 75 to 84 Years | 7 | 7.9% |
| 85 Years and Over | 9 | 10.1% |
| Total | 89 | 100.0% |
Housing Finances in Broomtown
Median Income by Occupancy in Broomtown
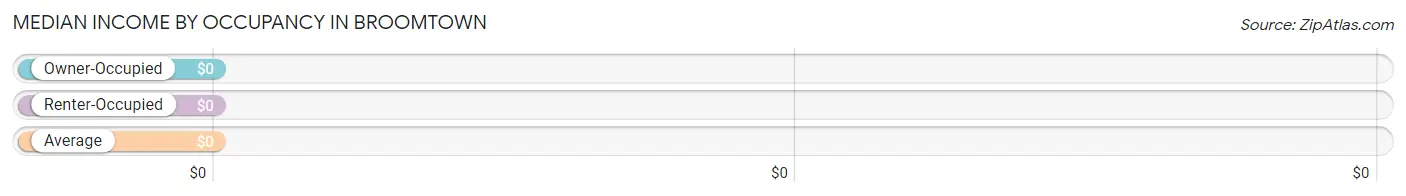
| Occupancy Type | # Households | Median Income |
| Owner-Occupied | 76 (85.4%) | $0 |
| Renter-Occupied | 13 (14.6%) | $0 |
| Average | 89 (100.0%) | $0 |
Occupancy by Householder Income Bracket in Broomtown
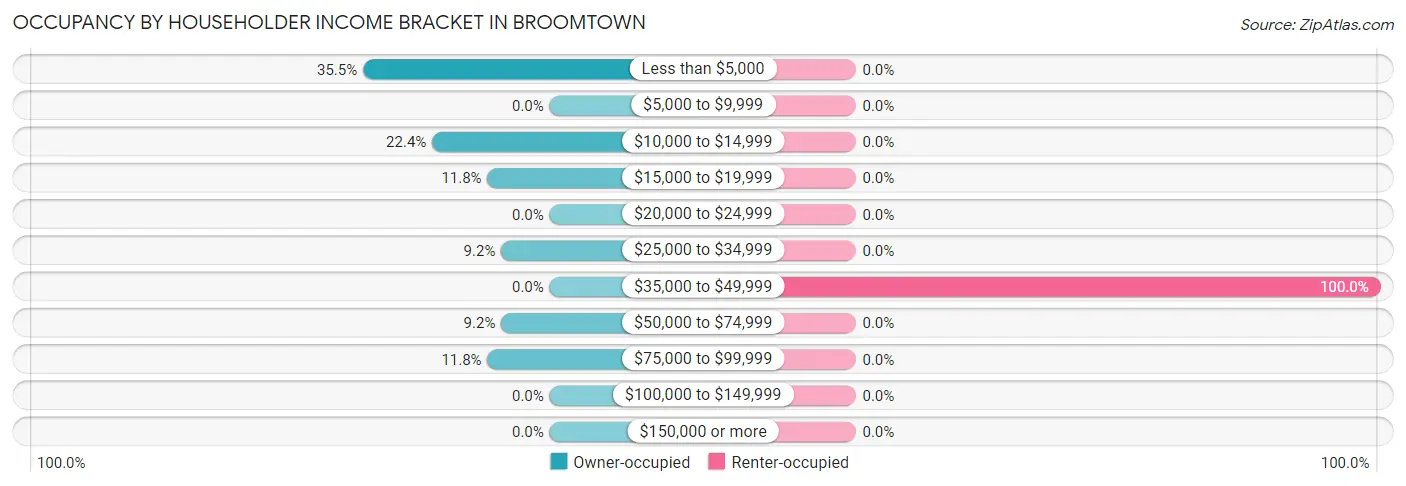
| Income Bracket | Owner-occupied | Renter-occupied |
| Less than $5,000 | 27 (35.5%) | 0 (0.0%) |
| $5,000 to $9,999 | 0 (0.0%) | 0 (0.0%) |
| $10,000 to $14,999 | 17 (22.4%) | 0 (0.0%) |
| $15,000 to $19,999 | 9 (11.8%) | 0 (0.0%) |
| $20,000 to $24,999 | 0 (0.0%) | 0 (0.0%) |
| $25,000 to $34,999 | 7 (9.2%) | 0 (0.0%) |
| $35,000 to $49,999 | 0 (0.0%) | 13 (100.0%) |
| $50,000 to $74,999 | 7 (9.2%) | 0 (0.0%) |
| $75,000 to $99,999 | 9 (11.8%) | 0 (0.0%) |
| $100,000 to $149,999 | 0 (0.0%) | 0 (0.0%) |
| $150,000 or more | 0 (0.0%) | 0 (0.0%) |
| Total | 76 (100.0%) | 13 (100.0%) |
Monthly Housing Cost Tiers in Broomtown
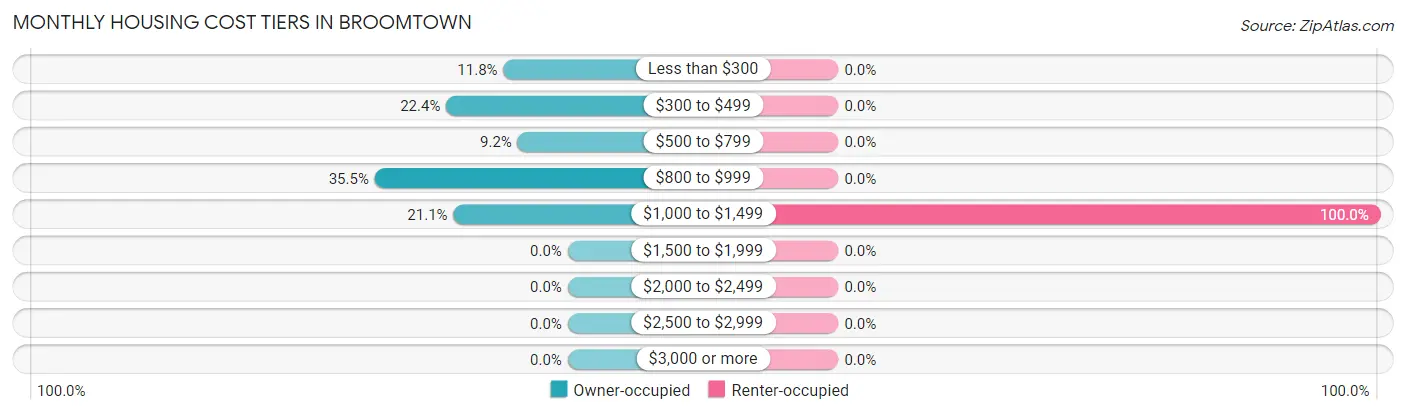
| Monthly Cost | Owner-occupied | Renter-occupied |
| Less than $300 | 9 (11.8%) | 0 (0.0%) |
| $300 to $499 | 17 (22.4%) | 0 (0.0%) |
| $500 to $799 | 7 (9.2%) | 0 (0.0%) |
| $800 to $999 | 27 (35.5%) | 0 (0.0%) |
| $1,000 to $1,499 | 16 (21.0%) | 13 (100.0%) |
| $1,500 to $1,999 | 0 (0.0%) | 0 (0.0%) |
| $2,000 to $2,499 | 0 (0.0%) | 0 (0.0%) |
| $2,500 to $2,999 | 0 (0.0%) | 0 (0.0%) |
| $3,000 or more | 0 (0.0%) | 0 (0.0%) |
| Total | 76 (100.0%) | 13 (100.0%) |
Physical Housing Characteristics in Broomtown
Housing Structures in Broomtown
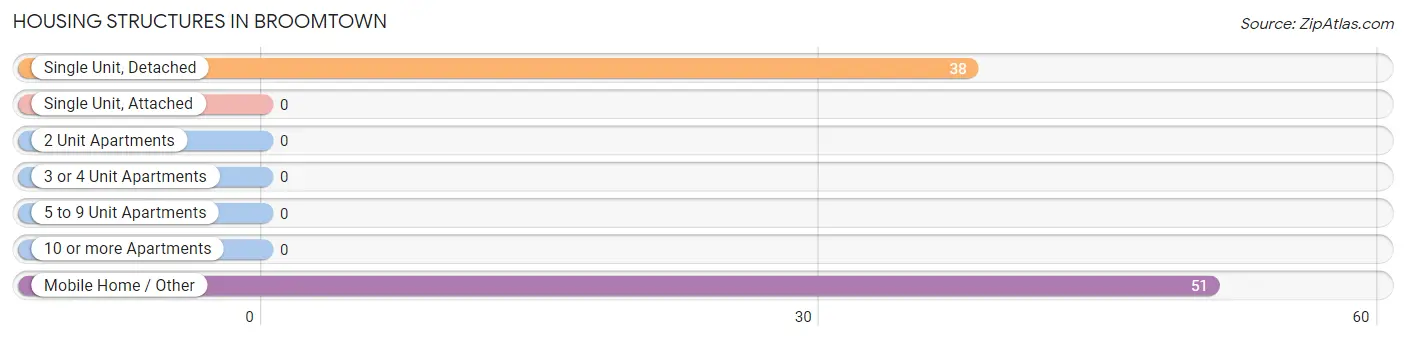
| Structure Type | # Housing Units | % Housing Units |
| Single Unit, Detached | 38 | 42.7% |
| Single Unit, Attached | 0 | 0.0% |
| 2 Unit Apartments | 0 | 0.0% |
| 3 or 4 Unit Apartments | 0 | 0.0% |
| 5 to 9 Unit Apartments | 0 | 0.0% |
| 10 or more Apartments | 0 | 0.0% |
| Mobile Home / Other | 51 | 57.3% |
| Total | 89 | 100.0% |
Housing Structures by Occupancy in Broomtown
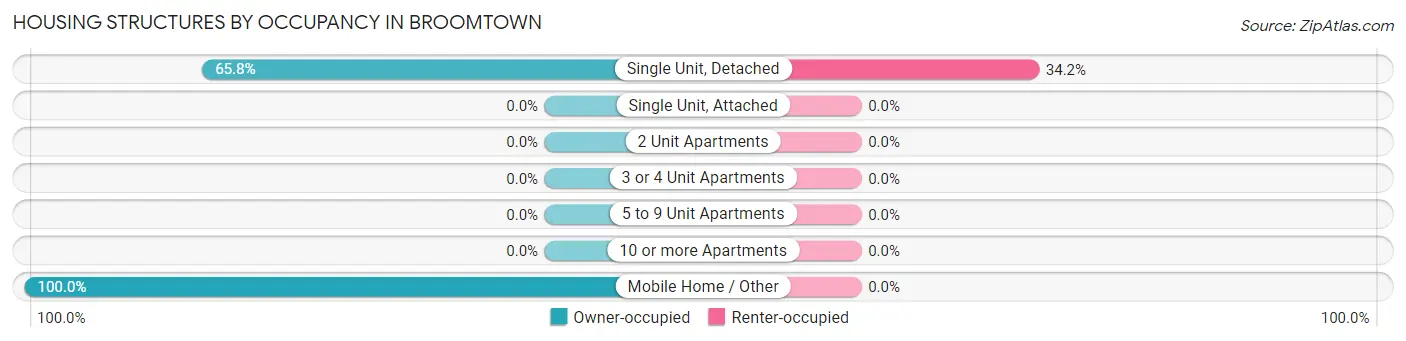
| Structure Type | Owner-occupied | Renter-occupied |
| Single Unit, Detached | 25 (65.8%) | 13 (34.2%) |
| Single Unit, Attached | 0 (0.0%) | 0 (0.0%) |
| 2 Unit Apartments | 0 (0.0%) | 0 (0.0%) |
| 3 or 4 Unit Apartments | 0 (0.0%) | 0 (0.0%) |
| 5 to 9 Unit Apartments | 0 (0.0%) | 0 (0.0%) |
| 10 or more Apartments | 0 (0.0%) | 0 (0.0%) |
| Mobile Home / Other | 51 (100.0%) | 0 (0.0%) |
| Total | 76 (85.4%) | 13 (14.6%) |
Housing Structures by Number of Rooms in Broomtown
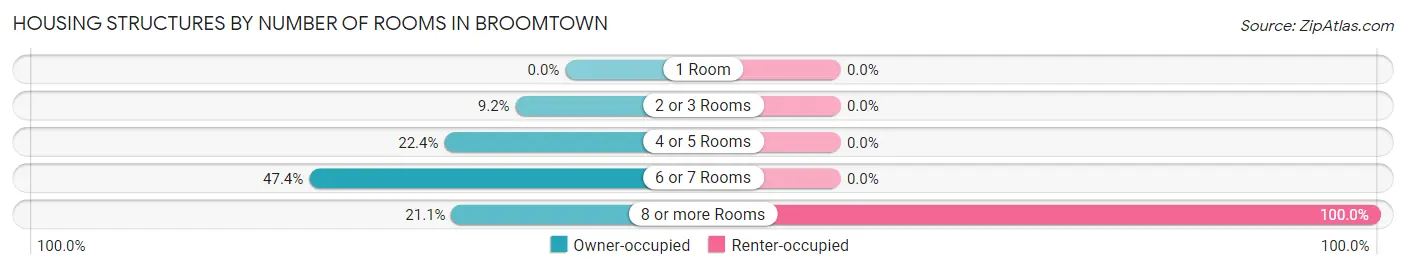
| Number of Rooms | Owner-occupied | Renter-occupied |
| 1 Room | 0 (0.0%) | 0 (0.0%) |
| 2 or 3 Rooms | 7 (9.2%) | 0 (0.0%) |
| 4 or 5 Rooms | 17 (22.4%) | 0 (0.0%) |
| 6 or 7 Rooms | 36 (47.4%) | 0 (0.0%) |
| 8 or more Rooms | 16 (21.0%) | 13 (100.0%) |
| Total | 76 (100.0%) | 13 (100.0%) |
Housing Structure by Heating Type in Broomtown
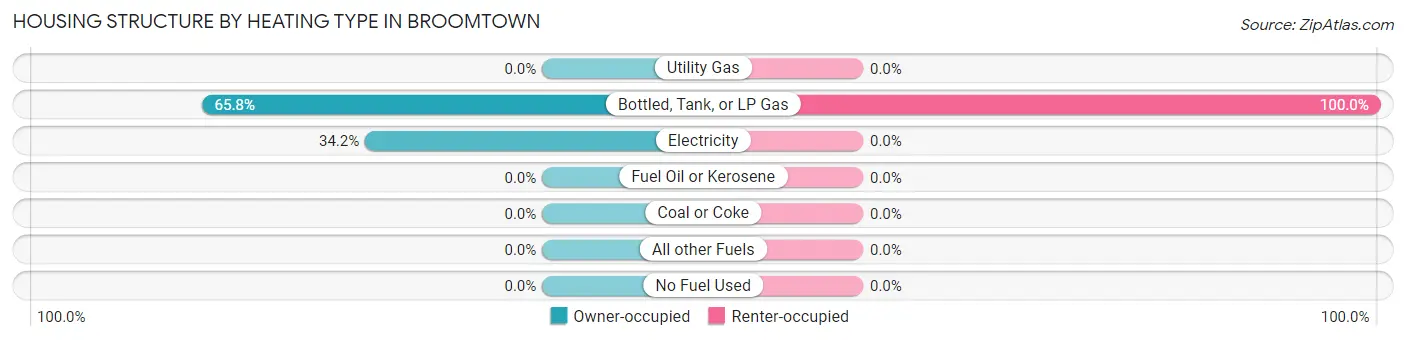
| Heating Type | Owner-occupied | Renter-occupied |
| Utility Gas | 0 (0.0%) | 0 (0.0%) |
| Bottled, Tank, or LP Gas | 50 (65.8%) | 13 (100.0%) |
| Electricity | 26 (34.2%) | 0 (0.0%) |
| Fuel Oil or Kerosene | 0 (0.0%) | 0 (0.0%) |
| Coal or Coke | 0 (0.0%) | 0 (0.0%) |
| All other Fuels | 0 (0.0%) | 0 (0.0%) |
| No Fuel Used | 0 (0.0%) | 0 (0.0%) |
| Total | 76 (100.0%) | 13 (100.0%) |
Household Vehicle Usage in Broomtown
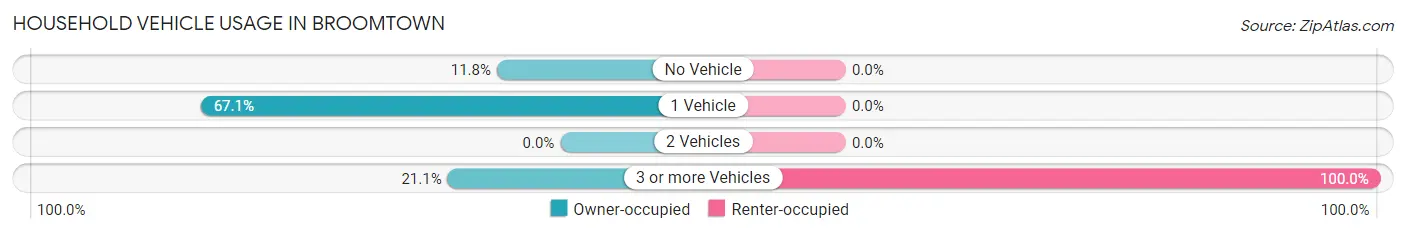
| Vehicles per Household | Owner-occupied | Renter-occupied |
| No Vehicle | 9 (11.8%) | 0 (0.0%) |
| 1 Vehicle | 51 (67.1%) | 0 (0.0%) |
| 2 Vehicles | 0 (0.0%) | 0 (0.0%) |
| 3 or more Vehicles | 16 (21.0%) | 13 (100.0%) |
| Total | 76 (100.0%) | 13 (100.0%) |
Real Estate & Mortgages in Broomtown
Real Estate and Mortgage Overview in Broomtown
| Characteristic | Without Mortgage | With Mortgage |
| Housing Units | 67 | 9 |
| Median Property Value | - | - |
| Median Household Income | - | - |
| Monthly Housing Costs | $802 | $0 |
| Real Estate Taxes | $199 | $0 |
Property Value by Mortgage Status in Broomtown
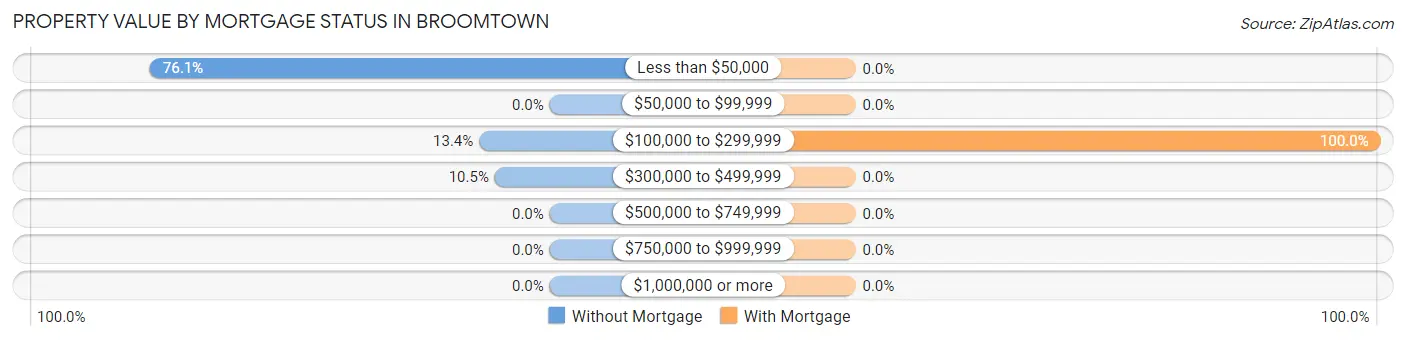
| Property Value | Without Mortgage | With Mortgage |
| Less than $50,000 | 51 (76.1%) | 0 (0.0%) |
| $50,000 to $99,999 | 0 (0.0%) | 0 (0.0%) |
| $100,000 to $299,999 | 9 (13.4%) | 9 (100.0%) |
| $300,000 to $499,999 | 7 (10.4%) | 0 (0.0%) |
| $500,000 to $749,999 | 0 (0.0%) | 0 (0.0%) |
| $750,000 to $999,999 | 0 (0.0%) | 0 (0.0%) |
| $1,000,000 or more | 0 (0.0%) | 0 (0.0%) |
| Total | 67 (100.0%) | 9 (100.0%) |
Household Income by Mortgage Status in Broomtown
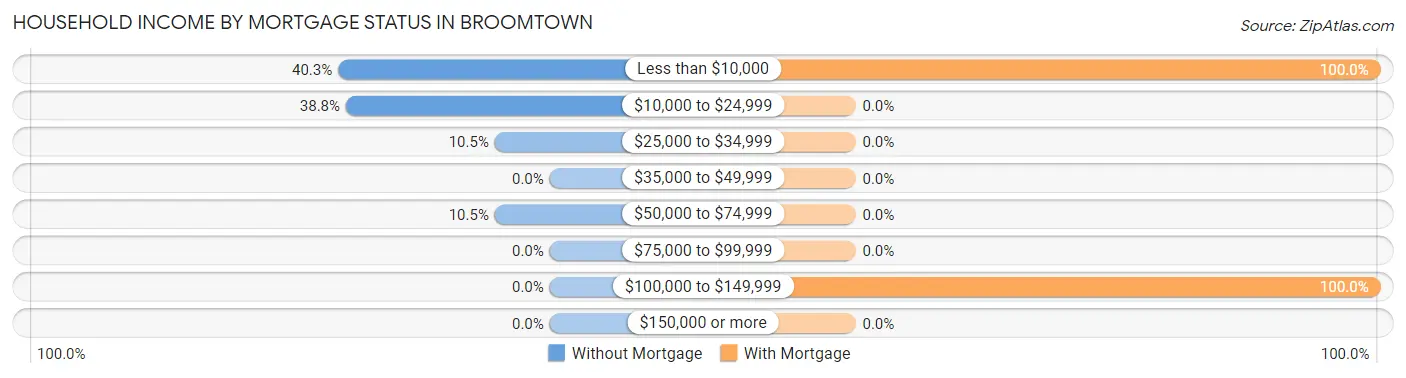
| Household Income | Without Mortgage | With Mortgage |
| Less than $10,000 | 27 (40.3%) | 9 (100.0%) |
| $10,000 to $24,999 | 26 (38.8%) | 0 (0.0%) |
| $25,000 to $34,999 | 7 (10.4%) | 0 (0.0%) |
| $35,000 to $49,999 | 0 (0.0%) | 0 (0.0%) |
| $50,000 to $74,999 | 7 (10.4%) | 0 (0.0%) |
| $75,000 to $99,999 | 0 (0.0%) | 0 (0.0%) |
| $100,000 to $149,999 | 0 (0.0%) | 9 (100.0%) |
| $150,000 or more | 0 (0.0%) | 0 (0.0%) |
| Total | 67 (100.0%) | 9 (100.0%) |
Property Value to Household Income Ratio in Broomtown
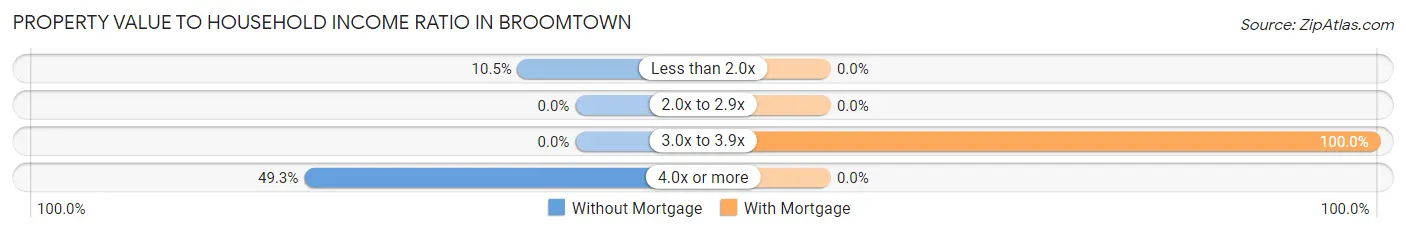
| Value-to-Income Ratio | Without Mortgage | With Mortgage |
| Less than 2.0x | 7 (10.4%) | 0 (0.0%) |
| 2.0x to 2.9x | 0 (0.0%) | 0 (0.0%) |
| 3.0x to 3.9x | 0 (0.0%) | 9 (100.0%) |
| 4.0x or more | 33 (49.2%) | 0 (0.0%) |
| Total | 67 (100.0%) | 9 (100.0%) |
Real Estate Taxes by Mortgage Status in Broomtown
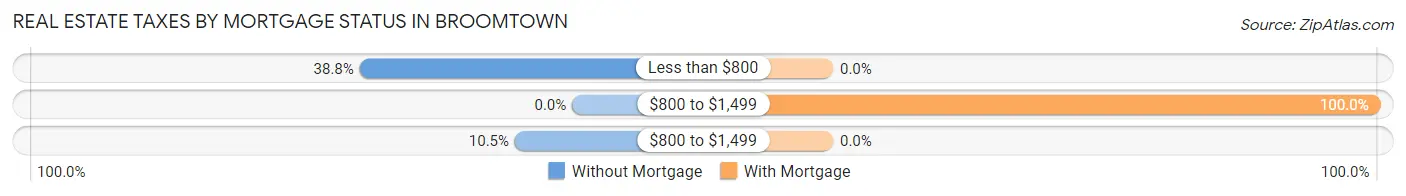
| Property Taxes | Without Mortgage | With Mortgage |
| Less than $800 | 26 (38.8%) | 0 (0.0%) |
| $800 to $1,499 | 0 (0.0%) | 9 (100.0%) |
| $800 to $1,499 | 7 (10.4%) | 0 (0.0%) |
| Total | 67 (100.0%) | 9 (100.0%) |
Health & Disability in Broomtown
Health Insurance Coverage by Age in Broomtown
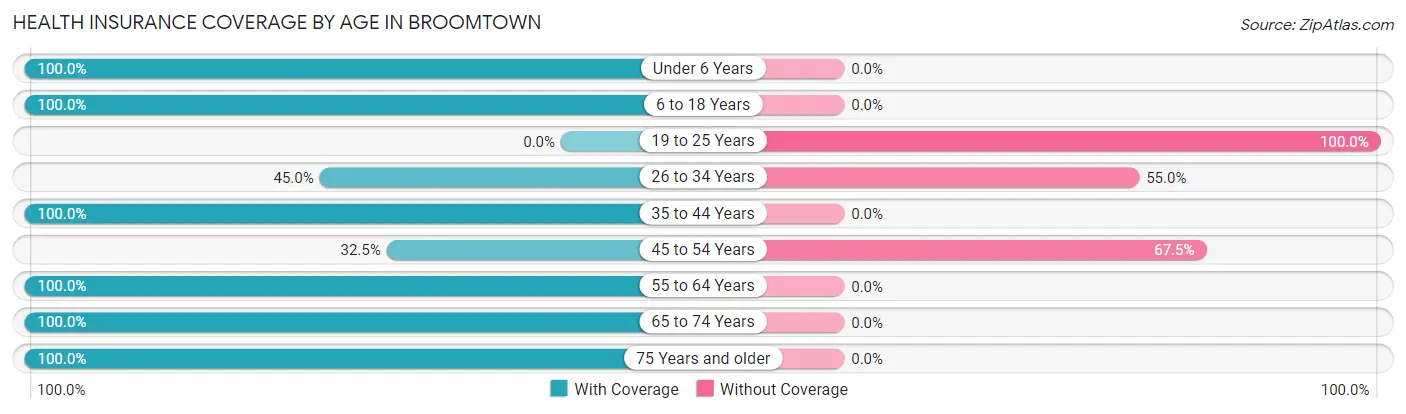
| Age Bracket | With Coverage | Without Coverage |
| Under 6 Years | 5 (100.0%) | 0 (0.0%) |
| 6 to 18 Years | 24 (100.0%) | 0 (0.0%) |
| 19 to 25 Years | 0 (0.0%) | 8 (100.0%) |
| 26 to 34 Years | 27 (45.0%) | 33 (55.0%) |
| 35 to 44 Years | 15 (100.0%) | 0 (0.0%) |
| 45 to 54 Years | 13 (32.5%) | 27 (67.5%) |
| 55 to 64 Years | 26 (100.0%) | 0 (0.0%) |
| 65 to 74 Years | 17 (100.0%) | 0 (0.0%) |
| 75 Years and older | 16 (100.0%) | 0 (0.0%) |
| Total | 143 (67.8%) | 68 (32.2%) |
Health Insurance Coverage by Citizenship Status in Broomtown
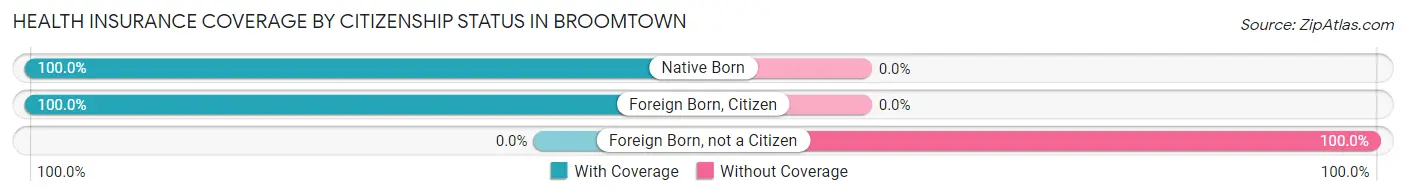
| Citizenship Status | With Coverage | Without Coverage |
| Native Born | 5 (100.0%) | 0 (0.0%) |
| Foreign Born, Citizen | 24 (100.0%) | 0 (0.0%) |
| Foreign Born, not a Citizen | 0 (0.0%) | 8 (100.0%) |
Health Insurance Coverage by Household Income in Broomtown
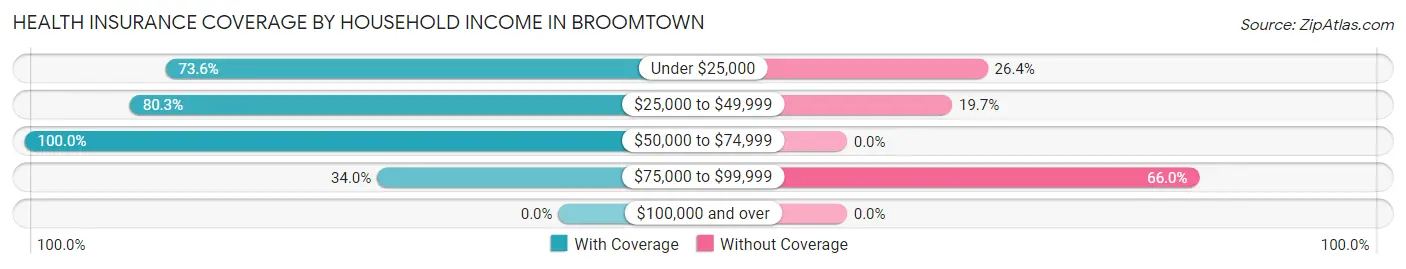
| Household Income | With Coverage | Without Coverage |
| Under $25,000 | 53 (73.6%) | 19 (26.4%) |
| $25,000 to $49,999 | 57 (80.3%) | 14 (19.7%) |
| $50,000 to $74,999 | 15 (100.0%) | 0 (0.0%) |
| $75,000 to $99,999 | 18 (34.0%) | 35 (66.0%) |
| $100,000 and over | 0 (0.0%) | 0 (0.0%) |
Public vs Private Health Insurance Coverage by Age in Broomtown
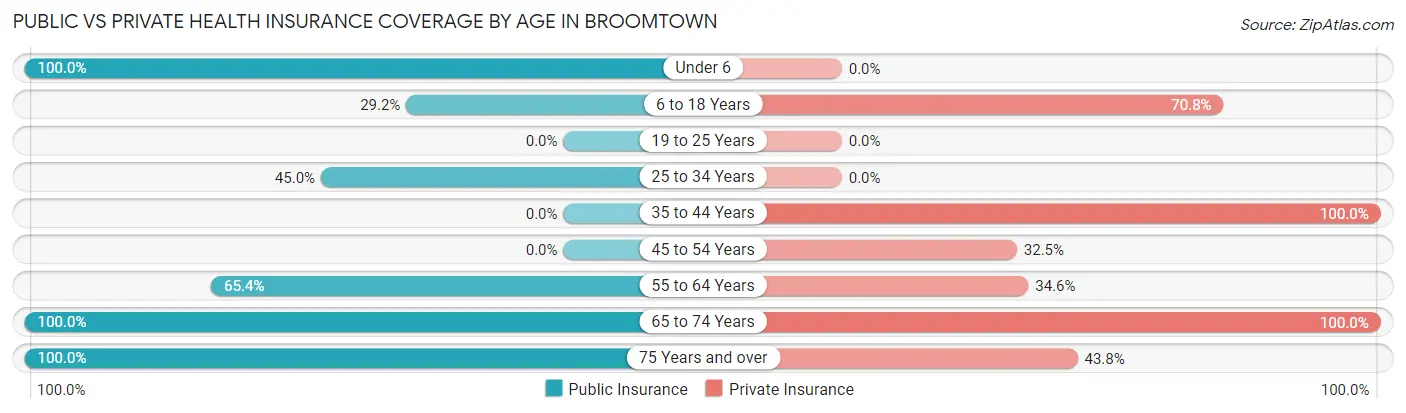
| Age Bracket | Public Insurance | Private Insurance |
| Under 6 | 5 (100.0%) | 0 (0.0%) |
| 6 to 18 Years | 7 (29.2%) | 17 (70.8%) |
| 19 to 25 Years | 0 (0.0%) | 0 (0.0%) |
| 25 to 34 Years | 27 (45.0%) | 0 (0.0%) |
| 35 to 44 Years | 0 (0.0%) | 15 (100.0%) |
| 45 to 54 Years | 0 (0.0%) | 13 (32.5%) |
| 55 to 64 Years | 17 (65.4%) | 9 (34.6%) |
| 65 to 74 Years | 17 (100.0%) | 17 (100.0%) |
| 75 Years and over | 16 (100.0%) | 7 (43.8%) |
| Total | 89 (42.2%) | 78 (37.0%) |
Disability Status by Sex by Age in Broomtown
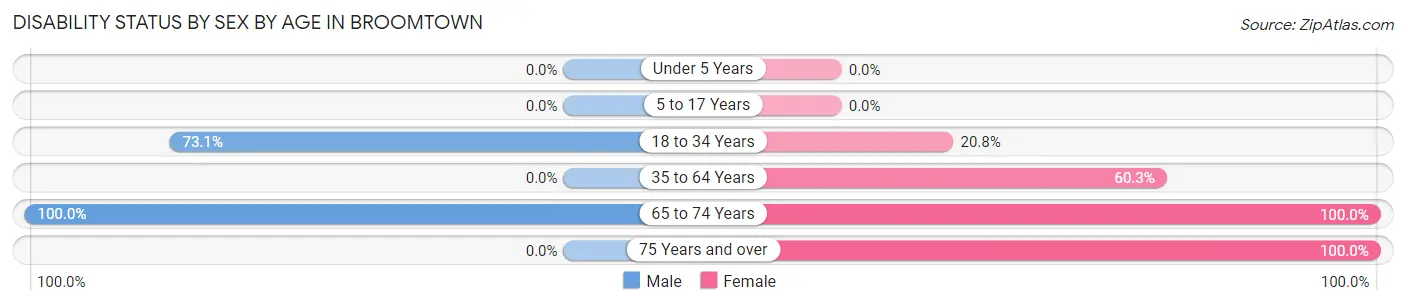
| Age Bracket | Male | Female |
| Under 5 Years | 0 (0.0%) | 0 (0.0%) |
| 5 to 17 Years | 0 (0.0%) | 0 (0.0%) |
| 18 to 34 Years | 19 (73.1%) | 11 (20.7%) |
| 35 to 64 Years | 0 (0.0%) | 41 (60.3%) |
| 65 to 74 Years | 9 (100.0%) | 8 (100.0%) |
| 75 Years and over | 0 (0.0%) | 9 (100.0%) |
Disability Class by Sex by Age in Broomtown
Disability Class: Hearing Difficulty
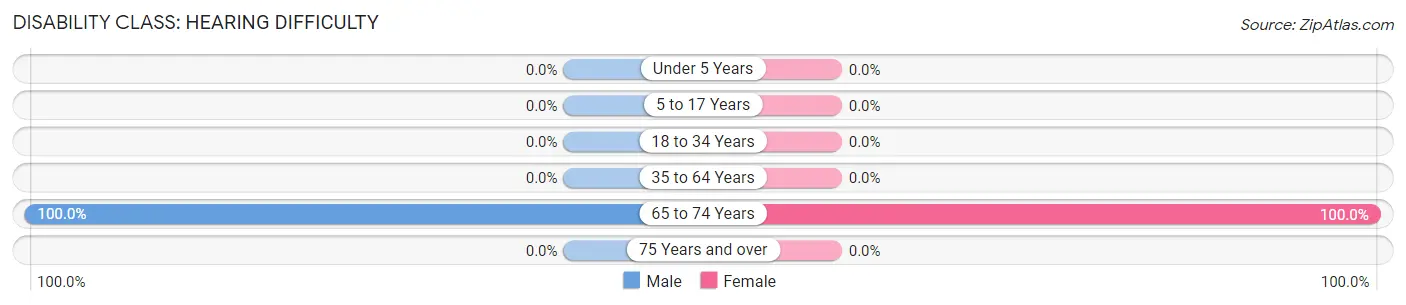
| Age Bracket | Male | Female |
| Under 5 Years | 0 (0.0%) | 0 (0.0%) |
| 5 to 17 Years | 0 (0.0%) | 0 (0.0%) |
| 18 to 34 Years | 0 (0.0%) | 0 (0.0%) |
| 35 to 64 Years | 0 (0.0%) | 0 (0.0%) |
| 65 to 74 Years | 9 (100.0%) | 8 (100.0%) |
| 75 Years and over | 0 (0.0%) | 0 (0.0%) |
Disability Class: Vision Difficulty
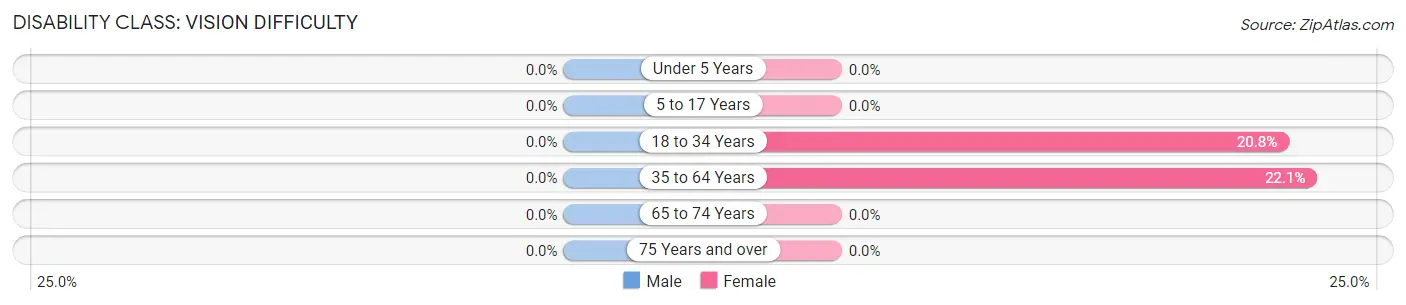
| Age Bracket | Male | Female |
| Under 5 Years | 0 (0.0%) | 0 (0.0%) |
| 5 to 17 Years | 0 (0.0%) | 0 (0.0%) |
| 18 to 34 Years | 0 (0.0%) | 11 (20.7%) |
| 35 to 64 Years | 0 (0.0%) | 15 (22.1%) |
| 65 to 74 Years | 0 (0.0%) | 0 (0.0%) |
| 75 Years and over | 0 (0.0%) | 0 (0.0%) |
Disability Class: Cognitive Difficulty
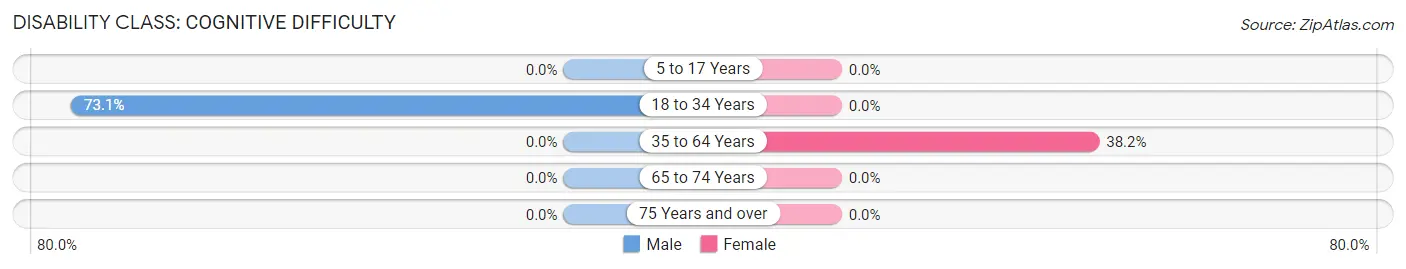
| Age Bracket | Male | Female |
| 5 to 17 Years | 0 (0.0%) | 0 (0.0%) |
| 18 to 34 Years | 19 (73.1%) | 0 (0.0%) |
| 35 to 64 Years | 0 (0.0%) | 26 (38.2%) |
| 65 to 74 Years | 0 (0.0%) | 0 (0.0%) |
| 75 Years and over | 0 (0.0%) | 0 (0.0%) |
Disability Class: Ambulatory Difficulty
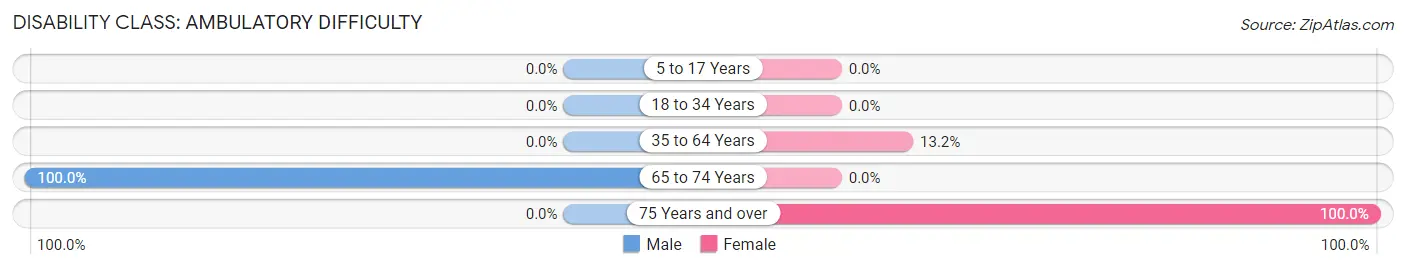
| Age Bracket | Male | Female |
| 5 to 17 Years | 0 (0.0%) | 0 (0.0%) |
| 18 to 34 Years | 0 (0.0%) | 0 (0.0%) |
| 35 to 64 Years | 0 (0.0%) | 9 (13.2%) |
| 65 to 74 Years | 9 (100.0%) | 0 (0.0%) |
| 75 Years and over | 0 (0.0%) | 9 (100.0%) |
Disability Class: Self-Care Difficulty
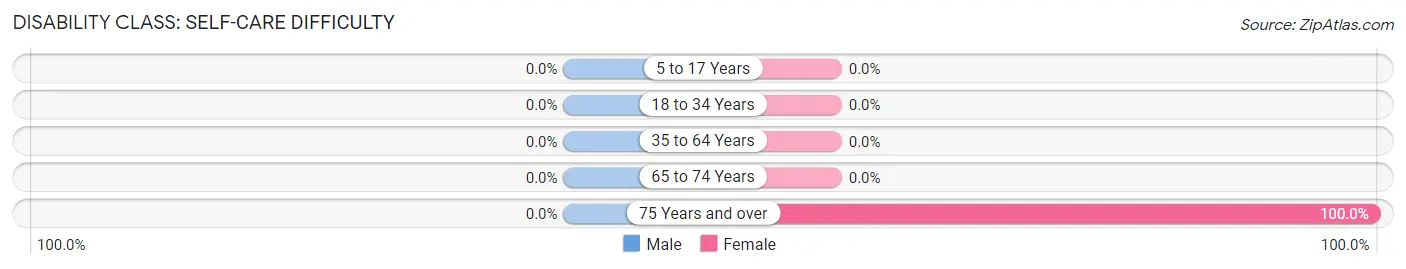
| Age Bracket | Male | Female |
| 5 to 17 Years | 0 (0.0%) | 0 (0.0%) |
| 18 to 34 Years | 0 (0.0%) | 0 (0.0%) |
| 35 to 64 Years | 0 (0.0%) | 0 (0.0%) |
| 65 to 74 Years | 0 (0.0%) | 0 (0.0%) |
| 75 Years and over | 0 (0.0%) | 9 (100.0%) |
Technology Access in Broomtown
Computing Device Access in Broomtown
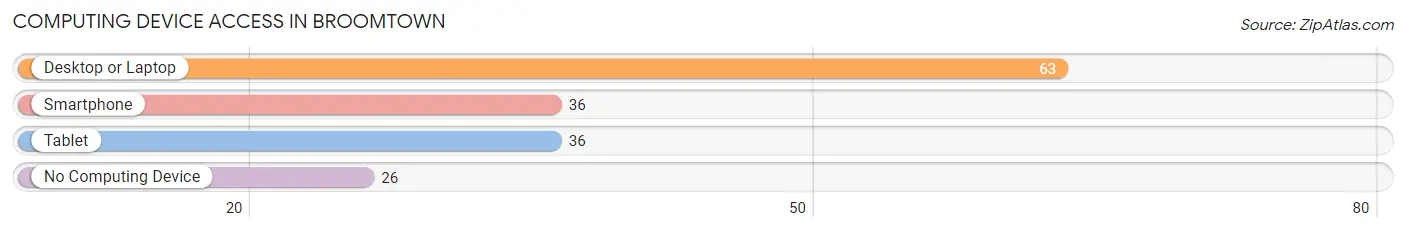
| Device Type | # Households | % Households |
| Desktop or Laptop | 63 | 70.8% |
| Smartphone | 36 | 40.5% |
| Tablet | 36 | 40.5% |
| No Computing Device | 26 | 29.2% |
| Total | 89 | 100.0% |
Internet Access in Broomtown
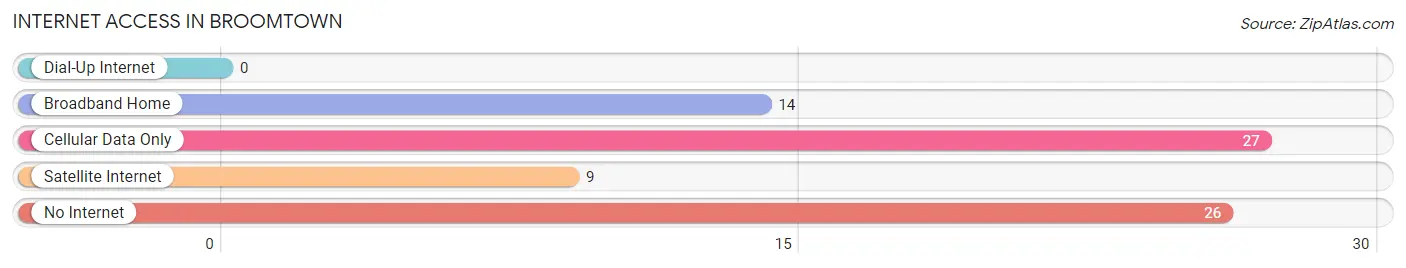
| Internet Type | # Households | % Households |
| Dial-Up Internet | 0 | 0.0% |
| Broadband Home | 14 | 15.7% |
| Cellular Data Only | 27 | 30.3% |
| Satellite Internet | 9 | 10.1% |
| No Internet | 26 | 29.2% |
| Total | 89 | 100.0% |
Broomtown Summary
Broomtown is a small unincorporated community located in Cherokee County, Alabama. It is situated in the foothills of the Appalachian Mountains, approximately 20 miles south of the city of Gadsden. The population of Broomtown was estimated to be around 500 people in 2000.
History
Broomtown was first settled in the early 1800s by a group of settlers from North Carolina. The town was named after a local creek, which was named after a type of broomgrass that grew along its banks. The town was originally a farming community, and the main crops grown were corn, cotton, and tobacco.
In the late 1800s, the town began to grow as a result of the railroad. The railroad brought new businesses and industries to the area, and the town began to prosper. The town was also home to several churches, a school, and a post office.
In the early 1900s, the town began to decline as the railroad moved away and the local economy shifted away from agriculture. The town was largely abandoned by the 1950s, and the population dwindled to just a few hundred people.
Geography
Broomtown is located in the foothills of the Appalachian Mountains, approximately 20 miles south of the city of Gadsden. The town is situated on the banks of the Little River, which flows through the area. The terrain is mostly hilly, with some flat areas. The climate is humid subtropical, with hot summers and mild winters.
Economy
The economy of Broomtown is largely based on agriculture. The main crops grown in the area are corn, cotton, and tobacco. The town also has a few small businesses, such as a general store and a gas station.
Demographics
The population of Broomtown was estimated to be around 500 people in 2000. The racial makeup of the town was 97.6% White, 0.8% African American, 0.4% Native American, and 1.2% from other races. The median household income was $25,000, and the median family income was $30,000. The per capita income was $14,000.
Conclusion
Broomtown is a small unincorporated community located in Cherokee County, Alabama. It is situated in the foothills of the Appalachian Mountains, approximately 20 miles south of the city of Gadsden. The population of Broomtown was estimated to be around 500 people in 2000. The economy of Broomtown is largely based on agriculture, and the main crops grown in the area are corn, cotton, and tobacco. The racial makeup of the town was 97.6% White, 0.8% African American, 0.4% Native American, and 1.2% from other races. The median household income was $25,000, and the median family income was $30,000. The per capita income was $14,000.
Common Questions
What is Per Capita Income in Broomtown?
Per Capita income in Broomtown is $10,673.
What is Income or Wage Gap in Broomtown?
Income or Wage Gap in Broomtown is 87.2%.
Women in Broomtown earn 12.8 cents for every dollar earned by a man.
What is Inequality or Gini Index in Broomtown?
Inequality or Gini Index in Broomtown is 0.58.
What is the Total Population of Broomtown?
Total Population of Broomtown is 211.
What is the Total Male Population of Broomtown?
Total Male Population of Broomtown is 67.
What is the Total Female Population of Broomtown?
Total Female Population of Broomtown is 144.
What is the Ratio of Males per 100 Females in Broomtown?
There are 46.53 Males per 100 Females in Broomtown.
What is the Ratio of Females per 100 Males in Broomtown?
There are 214.93 Females per 100 Males in Broomtown.
What is the Median Population Age in Broomtown?
Median Population Age in Broomtown is 39.6 Years.
What is the Average Family Size in Broomtown
Average Family Size in Broomtown is 2.9 People.
What is the Average Household Size in Broomtown
Average Household Size in Broomtown is 2.4 People.
How Large is the Labor Force in Broomtown?
There are 97 People in the Labor Forcein in Broomtown.
What is the Percentage of People in the Labor Force in Broomtown?
48.7% of People are in the Labor Force in Broomtown.
What is the Unemployment Rate in Broomtown?
Unemployment Rate in Broomtown is 27.8%.