Oakman, AL Map & Demographics
Oakman Map
Oakman Overview
$17,795
PER CAPITA INCOME
$24,578
AVG HOUSEHOLD INCOME
52.2%
WAGE / INCOME GAP [ % ]
47.8¢/ $1
WAGE / INCOME GAP [ $ ]
0.46
INEQUALITY / GINI INDEX
898
TOTAL POPULATION
434
MALE POPULATION
464
FEMALE POPULATION
93.53
MALES / 100 FEMALES
106.91
FEMALES / 100 MALES
38.7
MEDIAN AGE
2.7
AVG FAMILY SIZE
2.4
AVG HOUSEHOLD SIZE
265
LABOR FORCE [ PEOPLE ]
39.6%
PERCENT IN LABOR FORCE
7.9%
UNEMPLOYMENT RATE
Oakman Zip Codes
Oakman Area Codes
Income in Oakman
Income Overview in Oakman
| Characteristic | Number | Measure |
| Per Capita Income | 898 | $17,795 |
| Median Family Income | 281 | $0 |
| Mean Family Income | 281 | $48,907 |
| Median Household Income | 382 | $24,578 |
| Mean Household Income | 382 | $40,955 |
| Income Deficit | 281 | $0 |
| Wage / Income Gap (%) | 898 | 52.23% |
| Wage / Income Gap ($) | 898 | 47.77¢ per $1 |
| Gini / Inequality Index | 898 | 0.46 |
Earnings by Sex in Oakman
Average Earnings in Oakman are $50,481, $56,111 for men and $26,806 for women, a difference of 52.2%.
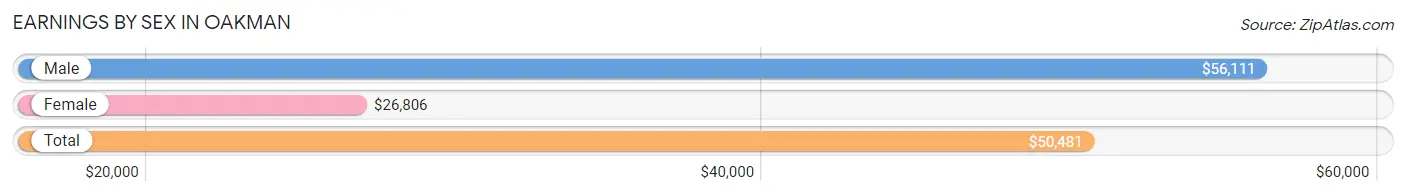
| Sex | Number | Average Earnings |
| Male | 124 (48.6%) | $56,111 |
| Female | 131 (51.4%) | $26,806 |
| Total | 255 (100.0%) | $50,481 |
Earnings by Sex by Income Bracket in Oakman
The most common earnings brackets in Oakman are $65,000 to $74,999 for men (29 | 23.4%) and $55,000 to $64,999 for women (40 | 30.5%).
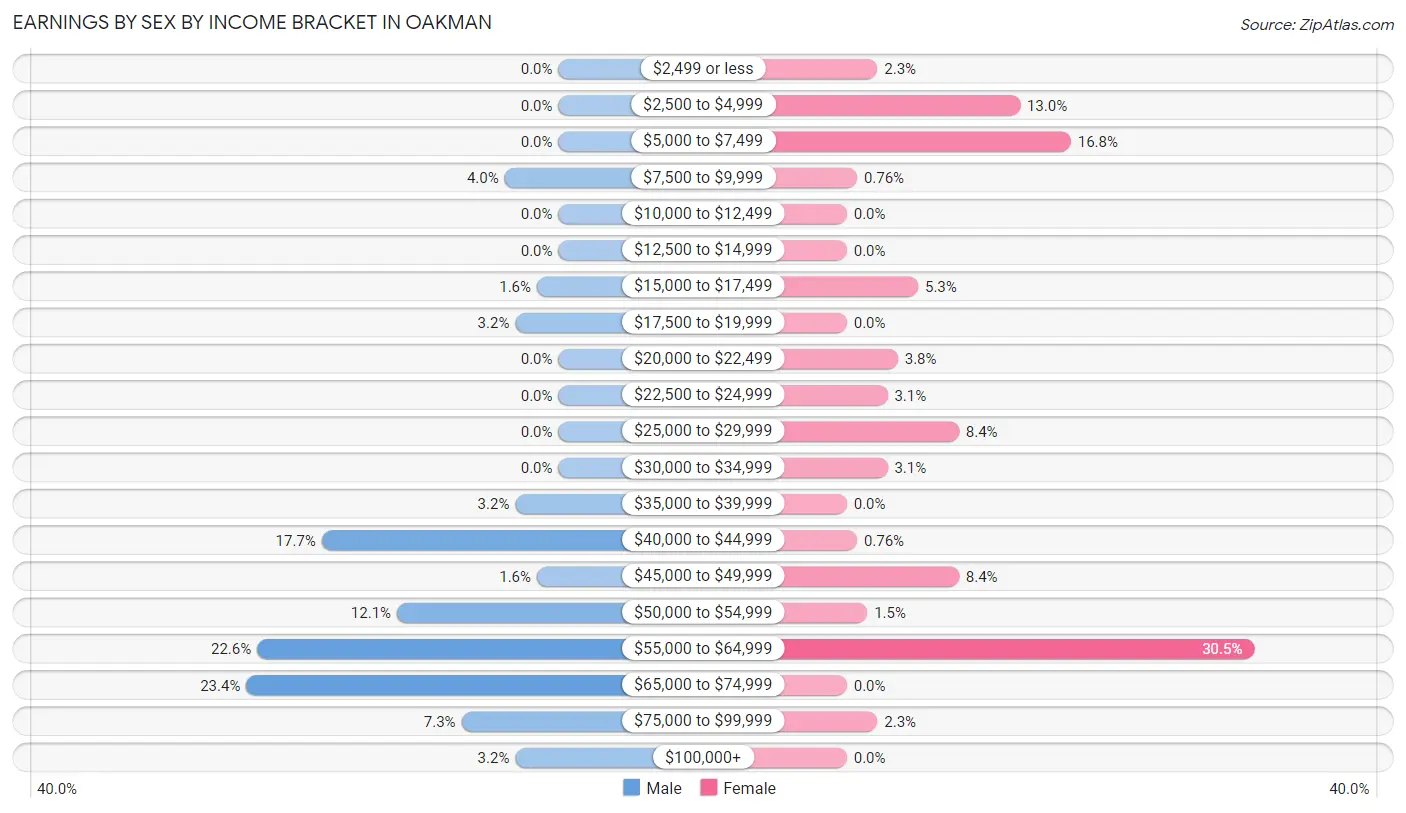
| Income | Male | Female |
| $2,499 or less | 0 (0.0%) | 3 (2.3%) |
| $2,500 to $4,999 | 0 (0.0%) | 17 (13.0%) |
| $5,000 to $7,499 | 0 (0.0%) | 22 (16.8%) |
| $7,500 to $9,999 | 5 (4.0%) | 1 (0.8%) |
| $10,000 to $12,499 | 0 (0.0%) | 0 (0.0%) |
| $12,500 to $14,999 | 0 (0.0%) | 0 (0.0%) |
| $15,000 to $17,499 | 2 (1.6%) | 7 (5.3%) |
| $17,500 to $19,999 | 4 (3.2%) | 0 (0.0%) |
| $20,000 to $22,499 | 0 (0.0%) | 5 (3.8%) |
| $22,500 to $24,999 | 0 (0.0%) | 4 (3.0%) |
| $25,000 to $29,999 | 0 (0.0%) | 11 (8.4%) |
| $30,000 to $34,999 | 0 (0.0%) | 4 (3.0%) |
| $35,000 to $39,999 | 4 (3.2%) | 0 (0.0%) |
| $40,000 to $44,999 | 22 (17.7%) | 1 (0.8%) |
| $45,000 to $49,999 | 2 (1.6%) | 11 (8.4%) |
| $50,000 to $54,999 | 15 (12.1%) | 2 (1.5%) |
| $55,000 to $64,999 | 28 (22.6%) | 40 (30.5%) |
| $65,000 to $74,999 | 29 (23.4%) | 0 (0.0%) |
| $75,000 to $99,999 | 9 (7.3%) | 3 (2.3%) |
| $100,000+ | 4 (3.2%) | 0 (0.0%) |
| Total | 124 (100.0%) | 131 (100.0%) |
Earnings by Sex by Educational Attainment in Oakman
Average earnings in Oakman are $56,528 for men and $48,182 for women, a difference of 14.8%. Men with an educational attainment of high school diploma enjoy the highest average annual earnings of $70,208, while those with less than high school education earn the least with $41,500. Women with an educational attainment of college or associate's degree earn the most with the average annual earnings of $55,588, while those with high school diploma education have the smallest earnings of $23,750.
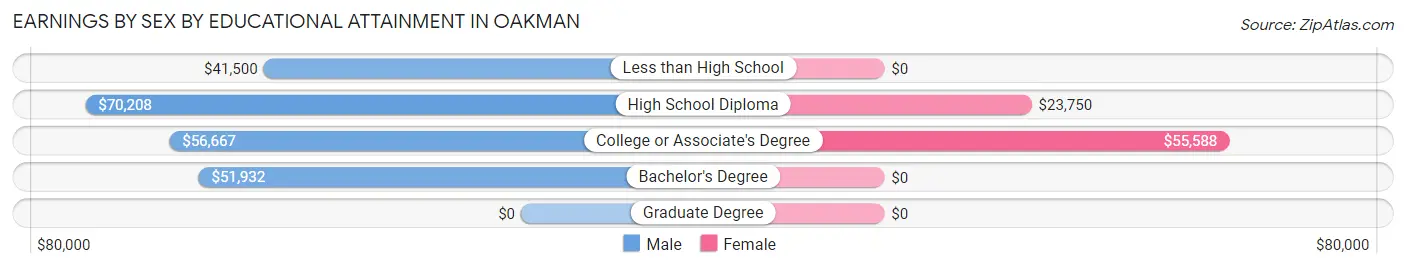
| Educational Attainment | Male Income | Female Income |
| Less than High School | $41,500 | $0 |
| High School Diploma | $70,208 | $23,750 |
| College or Associate's Degree | $56,667 | $55,588 |
| Bachelor's Degree | $51,932 | $0 |
| Graduate Degree | - | - |
| Total | $56,528 | $48,182 |
Family Income in Oakman
Family Income Brackets in Oakman
According to the Oakman family income data, there are 93 families falling into the $15,000 to $24,999 income range, which is the most common income bracket and makes up 33.1% of all families.
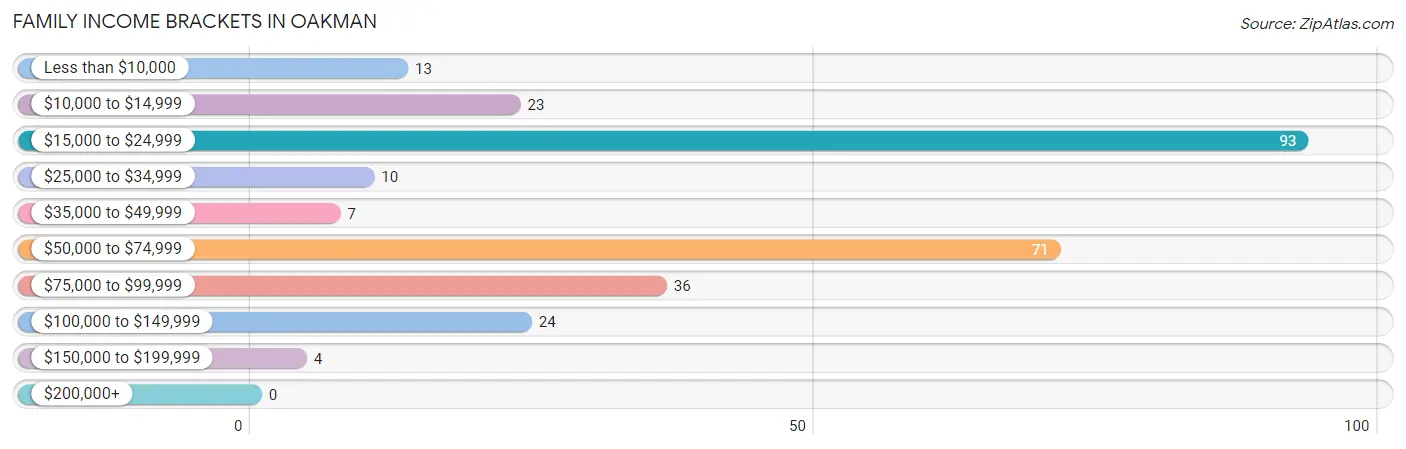
| Income Bracket | # Families | % Families |
| Less than $10,000 | 13 | 4.6% |
| $10,000 to $14,999 | 23 | 8.2% |
| $15,000 to $24,999 | 93 | 33.1% |
| $25,000 to $34,999 | 10 | 3.6% |
| $35,000 to $49,999 | 7 | 2.5% |
| $50,000 to $74,999 | 71 | 25.3% |
| $75,000 to $99,999 | 36 | 12.8% |
| $100,000 to $149,999 | 24 | 8.5% |
| $150,000 to $199,999 | 4 | 1.4% |
| $200,000+ | 0 | 0.0% |
Family Income by Famaliy Size in Oakman
4-person families (32 | 11.4%) account for the highest median family income in Oakman with $100,227 per family, while 4-person families (32 | 11.4%) have the highest median income of $25,057 per family member.
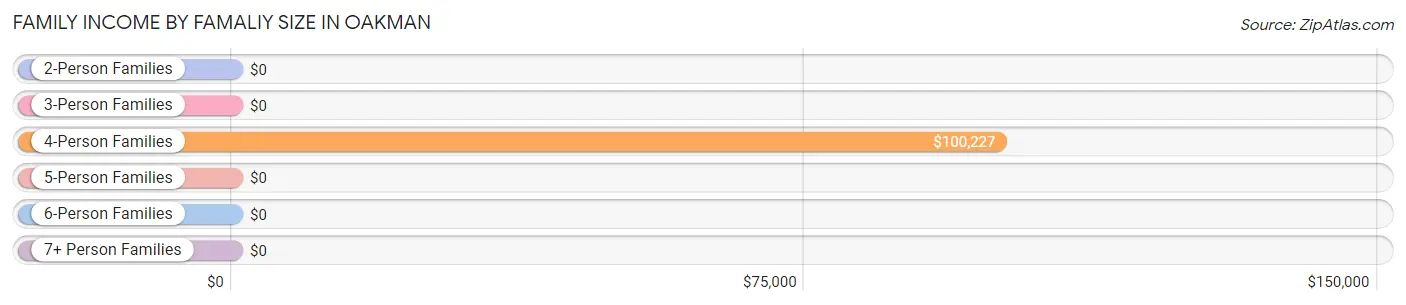
| Income Bracket | # Families | Median Income |
| 2-Person Families | 190 (67.6%) | $0 |
| 3-Person Families | 41 (14.6%) | $0 |
| 4-Person Families | 32 (11.4%) | $100,227 |
| 5-Person Families | 18 (6.4%) | $0 |
| 6-Person Families | 0 (0.0%) | $0 |
| 7+ Person Families | 0 (0.0%) | $0 |
| Total | 281 (100.0%) | $0 |
Family Income by Number of Earners in Oakman
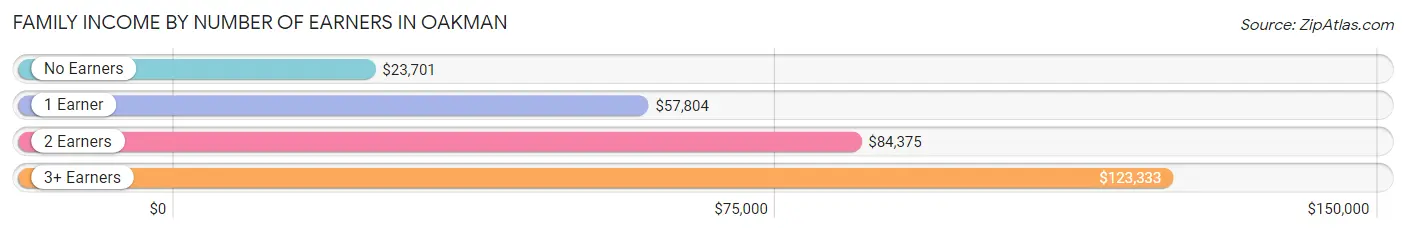
| Number of Earners | # Families | Median Income |
| No Earners | 132 (47.0%) | $23,701 |
| 1 Earner | 87 (31.0%) | $57,804 |
| 2 Earners | 52 (18.5%) | $84,375 |
| 3+ Earners | 10 (3.6%) | $123,333 |
| Total | 281 (100.0%) | $0 |
Household Income in Oakman
Household Income Brackets in Oakman
With 106 households falling in the category, the $15,000 to $24,999 income range is the most frequent in Oakman, accounting for 27.8% of all households.
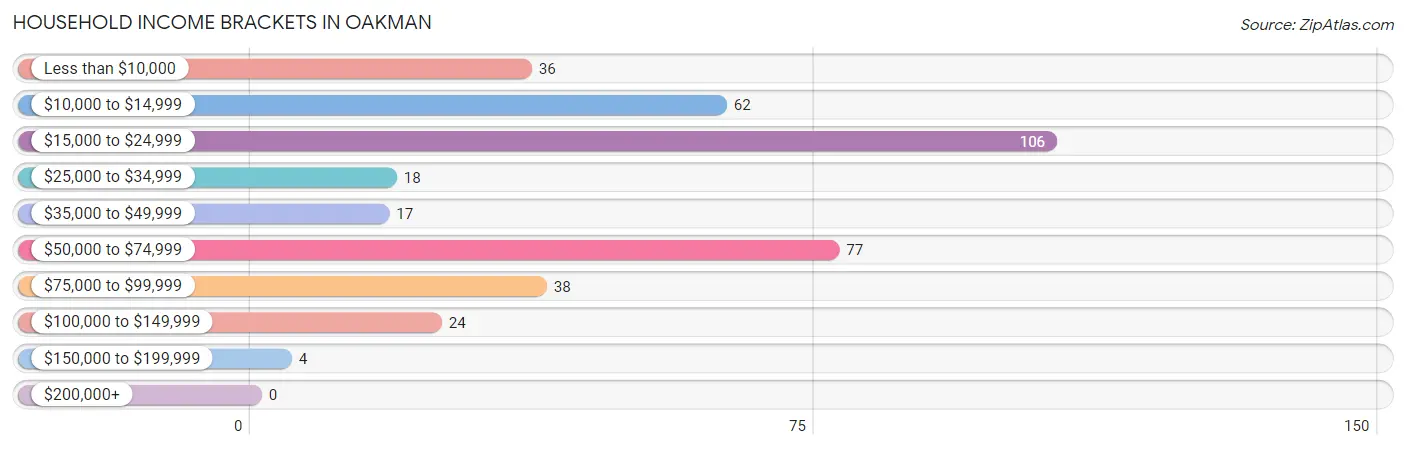
| Income Bracket | # Households | % Households |
| Less than $10,000 | 36 | 9.4% |
| $10,000 to $14,999 | 62 | 16.2% |
| $15,000 to $24,999 | 106 | 27.7% |
| $25,000 to $34,999 | 18 | 4.7% |
| $35,000 to $49,999 | 17 | 4.5% |
| $50,000 to $74,999 | 77 | 20.2% |
| $75,000 to $99,999 | 38 | 9.9% |
| $100,000 to $149,999 | 24 | 6.3% |
| $150,000 to $199,999 | 4 | 1.0% |
| $200,000+ | 0 | 0.0% |
Household Income by Householder Age in Oakman
The median household income in Oakman is $24,578, with the highest median household income of $58,429 found in the 25 to 44 years age bracket for the primary householder. A total of 104 households (27.2%) fall into this category. Meanwhile, the 15 to 24 years age bracket for the primary householder has the lowest median household income of $0, with 11 households (2.9%) in this group.
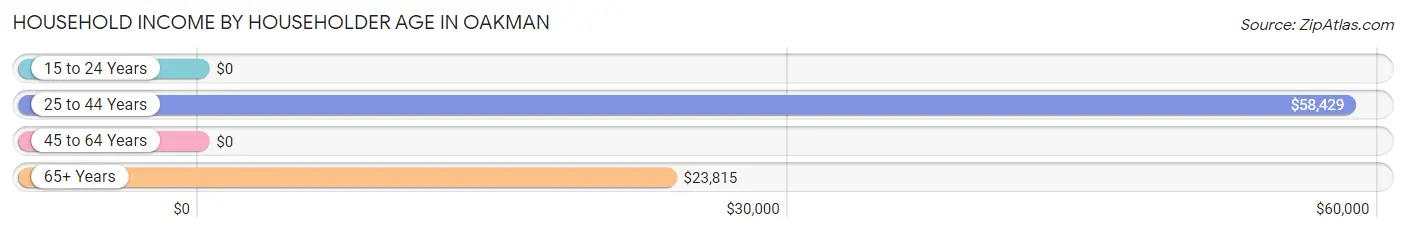
| Income Bracket | # Households | Median Income |
| 15 to 24 Years | 11 (2.9%) | $0 |
| 25 to 44 Years | 104 (27.2%) | $58,429 |
| 45 to 64 Years | 104 (27.2%) | $0 |
| 65+ Years | 163 (42.7%) | $23,815 |
| Total | 382 (100.0%) | $24,578 |
Poverty in Oakman
Income Below Poverty by Sex and Age in Oakman
With 14.7% poverty level for males and 33.6% for females among the residents of Oakman, 16 and 17 year old males and 6 to 11 year old females are the most vulnerable to poverty, with 13 males (86.7%) and 18 females (100.0%) in their respective age groups living below the poverty level.
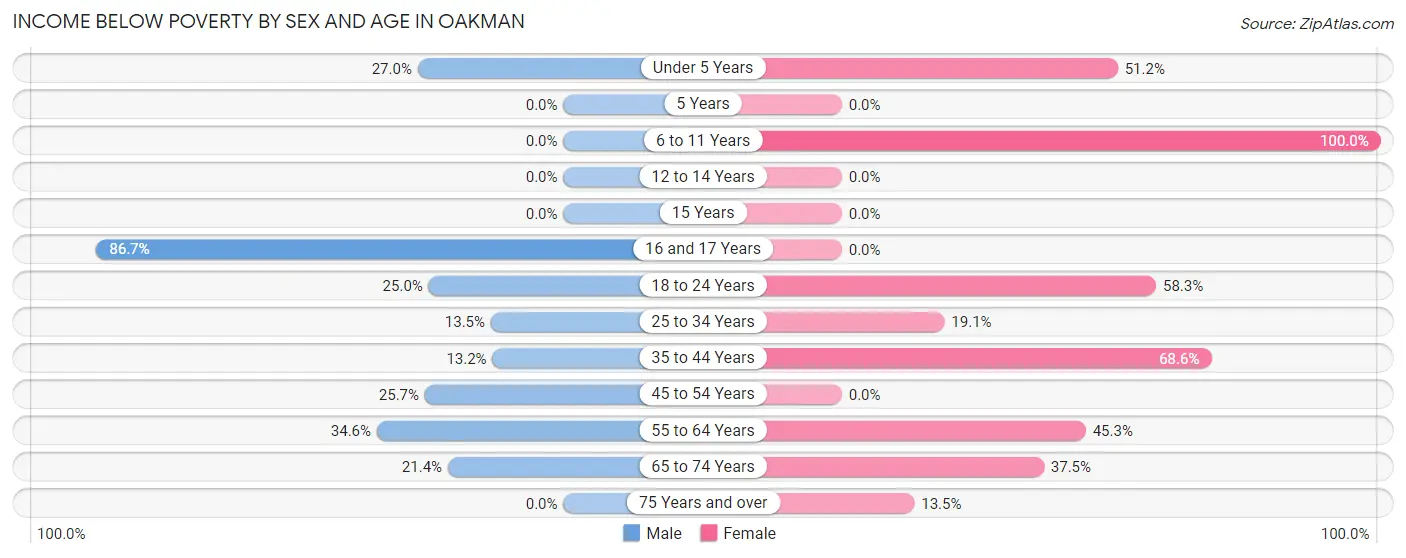
| Age Bracket | Male | Female |
| Under 5 Years | 10 (27.0%) | 21 (51.2%) |
| 5 Years | 0 (0.0%) | 0 (0.0%) |
| 6 to 11 Years | 0 (0.0%) | 18 (100.0%) |
| 12 to 14 Years | 0 (0.0%) | 0 (0.0%) |
| 15 Years | 0 (0.0%) | 0 (0.0%) |
| 16 and 17 Years | 13 (86.7%) | 0 (0.0%) |
| 18 to 24 Years | 2 (25.0%) | 21 (58.3%) |
| 25 to 34 Years | 7 (13.5%) | 16 (19.1%) |
| 35 to 44 Years | 5 (13.2%) | 24 (68.6%) |
| 45 to 54 Years | 9 (25.7%) | 0 (0.0%) |
| 55 to 64 Years | 9 (34.6%) | 24 (45.3%) |
| 65 to 74 Years | 9 (21.4%) | 15 (37.5%) |
| 75 Years and over | 0 (0.0%) | 14 (13.5%) |
| Total | 64 (14.7%) | 153 (33.6%) |
Income Above Poverty by Sex and Age in Oakman
According to the poverty statistics in Oakman, males aged 5 years and females aged 12 to 14 years are the age groups that are most secure financially, with 100.0% of males and 100.0% of females in these age groups living above the poverty line.
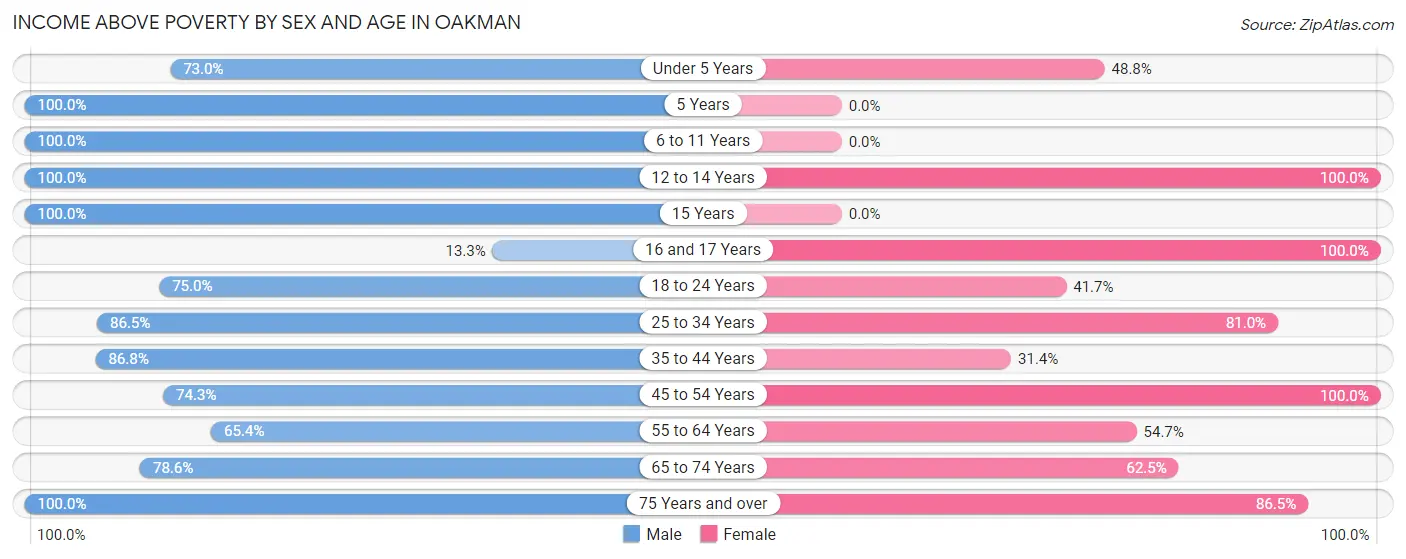
| Age Bracket | Male | Female |
| Under 5 Years | 27 (73.0%) | 20 (48.8%) |
| 5 Years | 3 (100.0%) | 0 (0.0%) |
| 6 to 11 Years | 86 (100.0%) | 0 (0.0%) |
| 12 to 14 Years | 27 (100.0%) | 7 (100.0%) |
| 15 Years | 1 (100.0%) | 0 (0.0%) |
| 16 and 17 Years | 2 (13.3%) | 5 (100.0%) |
| 18 to 24 Years | 6 (75.0%) | 15 (41.7%) |
| 25 to 34 Years | 45 (86.5%) | 68 (80.9%) |
| 35 to 44 Years | 33 (86.8%) | 11 (31.4%) |
| 45 to 54 Years | 26 (74.3%) | 32 (100.0%) |
| 55 to 64 Years | 17 (65.4%) | 29 (54.7%) |
| 65 to 74 Years | 33 (78.6%) | 25 (62.5%) |
| 75 Years and over | 64 (100.0%) | 90 (86.5%) |
| Total | 370 (85.3%) | 302 (66.4%) |
Income Below Poverty Among Married-Couple Families in Oakman
The poverty statistics for married-couple families in Oakman show that 5.9% or 10 of the total 170 families live below the poverty line. Families with 1 or 2 children have the highest poverty rate of 19.4%, comprising of 7 families. On the other hand, families with 3 or 4 children have the lowest poverty rate of 0.0%, which includes 0 families.
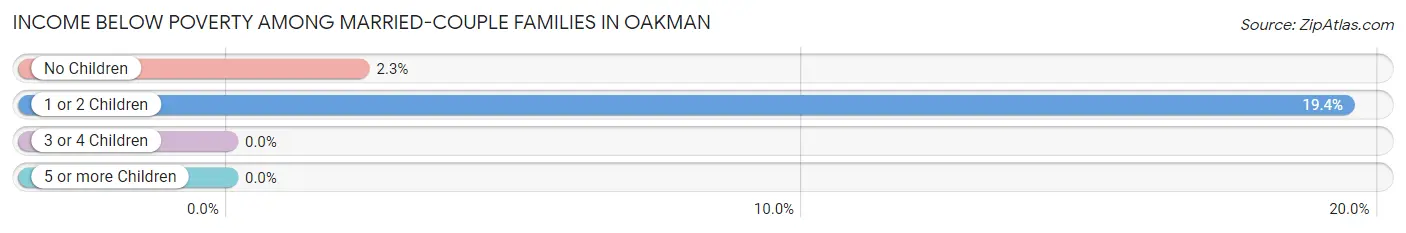
| Children | Above Poverty | Below Poverty |
| No Children | 128 (97.7%) | 3 (2.3%) |
| 1 or 2 Children | 29 (80.6%) | 7 (19.4%) |
| 3 or 4 Children | 3 (100.0%) | 0 (0.0%) |
| 5 or more Children | 0 (0.0%) | 0 (0.0%) |
| Total | 160 (94.1%) | 10 (5.9%) |
Income Below Poverty Among Single-Parent Households in Oakman
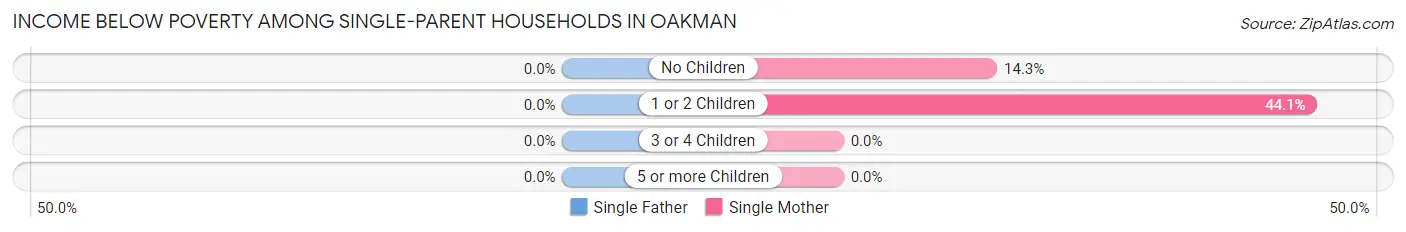
| Children | Single Father | Single Mother |
| No Children | 0 (0.0%) | 3 (14.3%) |
| 1 or 2 Children | 0 (0.0%) | 30 (44.1%) |
| 3 or 4 Children | 0 (0.0%) | 0 (0.0%) |
| 5 or more Children | 0 (0.0%) | 0 (0.0%) |
| Total | 0 (0.0%) | 33 (31.7%) |
Income Below Poverty Among Married-Couple vs Single-Parent Households in Oakman
The poverty data for Oakman shows that 10 of the married-couple family households (5.9%) and 33 of the single-parent households (29.7%) are living below the poverty level. Within the married-couple family households, those with 1 or 2 children have the highest poverty rate, with 7 households (19.4%) falling below the poverty line. Among the single-parent households, those with 1 or 2 children have the highest poverty rate, with 30 household (40.0%) living below poverty.
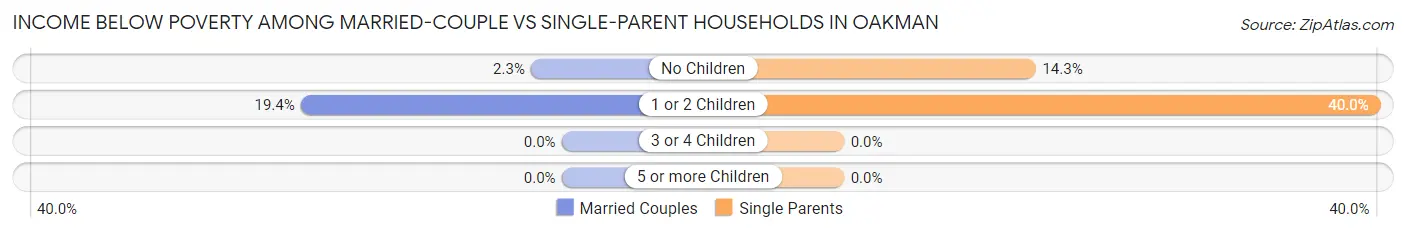
| Children | Married-Couple Families | Single-Parent Households |
| No Children | 3 (2.3%) | 3 (14.3%) |
| 1 or 2 Children | 7 (19.4%) | 30 (40.0%) |
| 3 or 4 Children | 0 (0.0%) | 0 (0.0%) |
| 5 or more Children | 0 (0.0%) | 0 (0.0%) |
| Total | 10 (5.9%) | 33 (29.7%) |
Race in Oakman
The most populous races in Oakman are White / Caucasian (797 | 88.7%), Black / African American (76 | 8.5%), and Two or more Races (25 | 2.8%).
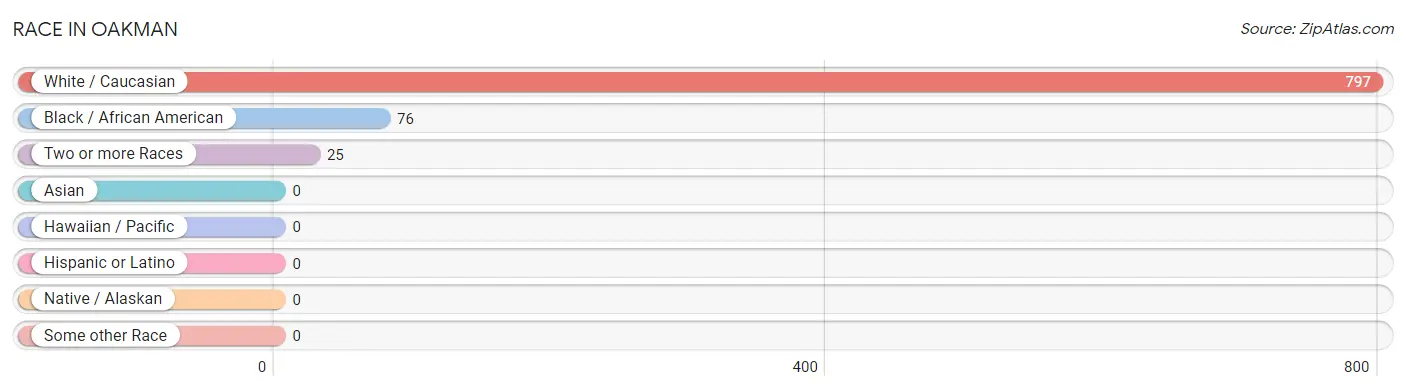
| Race | # Population | % Population |
| Asian | 0 | 0.0% |
| Black / African American | 76 | 8.5% |
| Hawaiian / Pacific | 0 | 0.0% |
| Hispanic or Latino | 0 | 0.0% |
| Native / Alaskan | 0 | 0.0% |
| White / Caucasian | 797 | 88.7% |
| Two or more Races | 25 | 2.8% |
| Some other Race | 0 | 0.0% |
| Total | 898 | 100.0% |
Ancestry in Oakman
The most populous ancestries reported in Oakman are American (359 | 40.0%), Irish (65 | 7.2%), Northern European (51 | 5.7%), German (38 | 4.2%), and English (25 | 2.8%), together accounting for 59.9% of all Oakman residents.
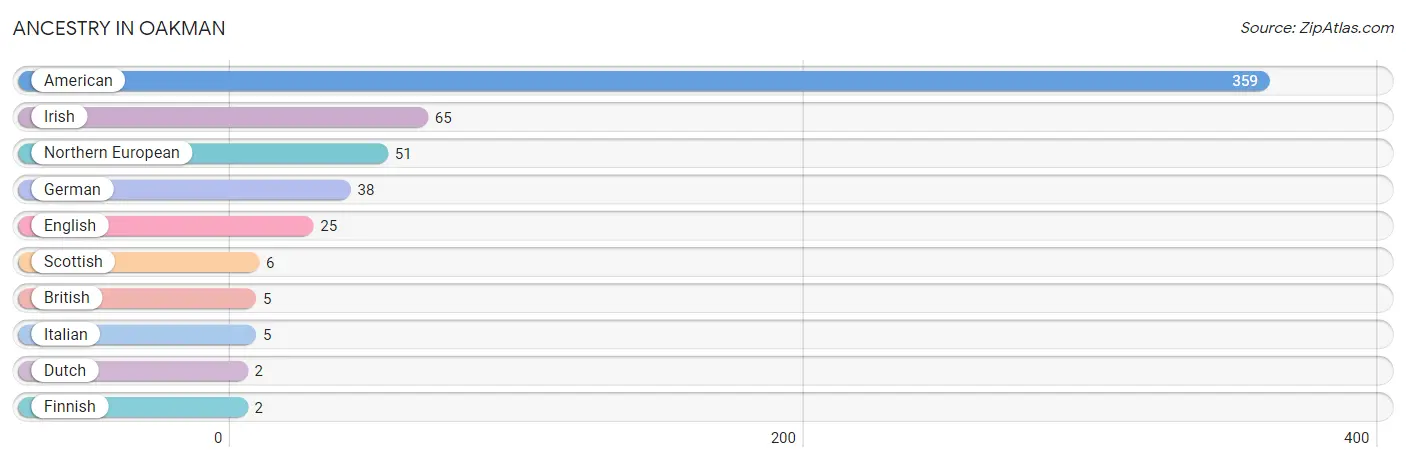
| Ancestry | # Population | % Population |
| American | 359 | 40.0% |
| British | 5 | 0.6% |
| Dutch | 2 | 0.2% |
| English | 25 | 2.8% |
| Finnish | 2 | 0.2% |
| German | 38 | 4.2% |
| Irish | 65 | 7.2% |
| Italian | 5 | 0.6% |
| Northern European | 51 | 5.7% |
| Scottish | 6 | 0.7% | View All 10 Rows |
Immigrants in Oakman

| Immigration Origin | # Population | % Population | View All 0 Rows |
Sex and Age in Oakman
Sex and Age in Oakman
The most populous age groups in Oakman are 10 to 14 Years (88 | 20.3%) for men and 75 to 79 Years (101 | 21.8%) for women.
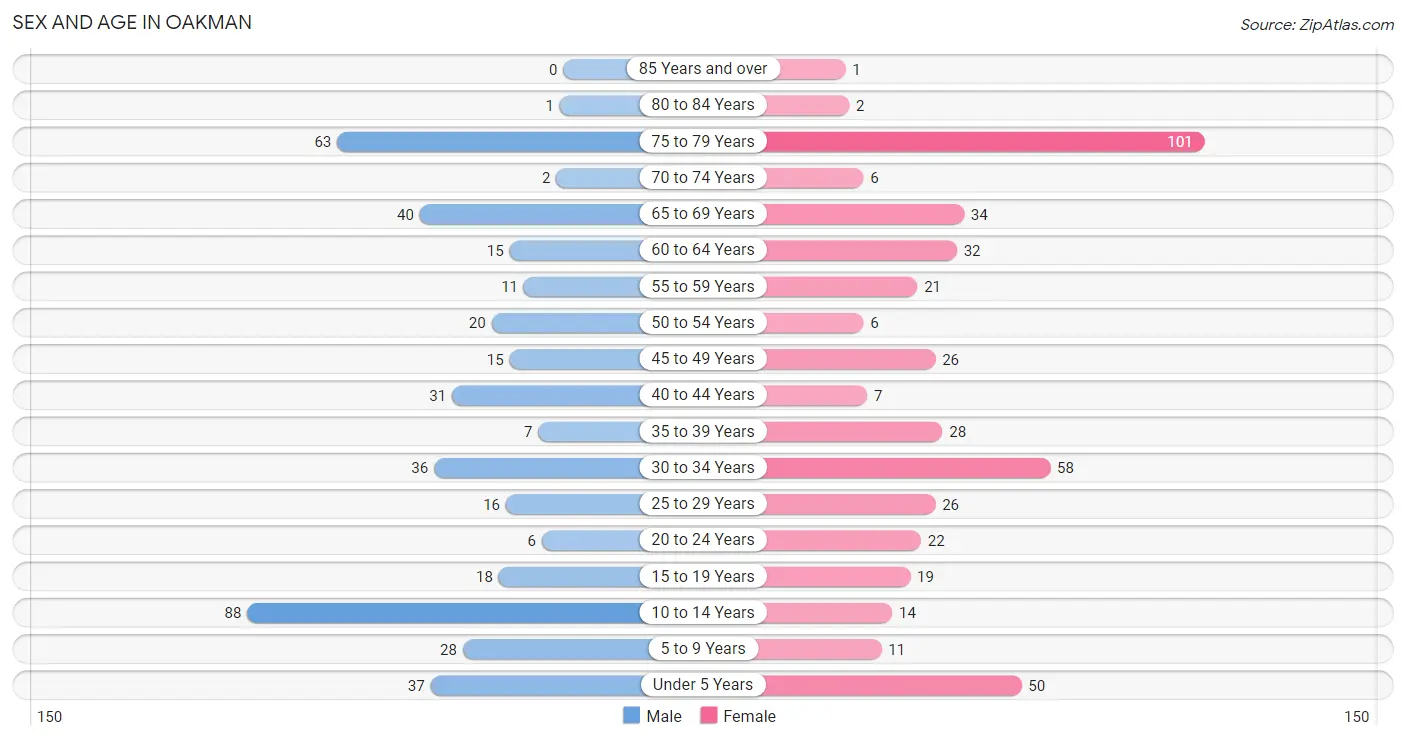
| Age Bracket | Male | Female |
| Under 5 Years | 37 (8.5%) | 50 (10.8%) |
| 5 to 9 Years | 28 (6.5%) | 11 (2.4%) |
| 10 to 14 Years | 88 (20.3%) | 14 (3.0%) |
| 15 to 19 Years | 18 (4.2%) | 19 (4.1%) |
| 20 to 24 Years | 6 (1.4%) | 22 (4.7%) |
| 25 to 29 Years | 16 (3.7%) | 26 (5.6%) |
| 30 to 34 Years | 36 (8.3%) | 58 (12.5%) |
| 35 to 39 Years | 7 (1.6%) | 28 (6.0%) |
| 40 to 44 Years | 31 (7.1%) | 7 (1.5%) |
| 45 to 49 Years | 15 (3.5%) | 26 (5.6%) |
| 50 to 54 Years | 20 (4.6%) | 6 (1.3%) |
| 55 to 59 Years | 11 (2.5%) | 21 (4.5%) |
| 60 to 64 Years | 15 (3.5%) | 32 (6.9%) |
| 65 to 69 Years | 40 (9.2%) | 34 (7.3%) |
| 70 to 74 Years | 2 (0.5%) | 6 (1.3%) |
| 75 to 79 Years | 63 (14.5%) | 101 (21.8%) |
| 80 to 84 Years | 1 (0.2%) | 2 (0.4%) |
| 85 Years and over | 0 (0.0%) | 1 (0.2%) |
| Total | 434 (100.0%) | 464 (100.0%) |
Families and Households in Oakman
Median Family Size in Oakman
The median family size in Oakman is 2.71 persons per family, with single male/father families (7 | 2.5%) accounting for the largest median family size of 3.57 persons per family. On the other hand, married-couple families (170 | 60.5%) represent the smallest median family size with 2.50 persons per family.
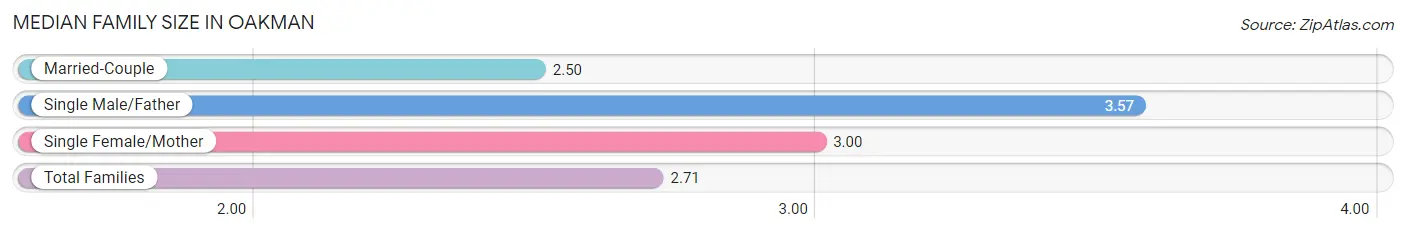
| Family Type | # Families | Family Size |
| Married-Couple | 170 (60.5%) | 2.50 |
| Single Male/Father | 7 (2.5%) | 3.57 |
| Single Female/Mother | 104 (37.0%) | 3.00 |
| Total Families | 281 (100.0%) | 2.71 |
Median Household Size in Oakman
The median household size in Oakman is 2.35 persons per household, with single male/father households (7 | 1.8%) accounting for the largest median household size of 3.57 persons per household. non-family households (101 | 26.4%) represent the smallest median household size with 1.14 persons per household.
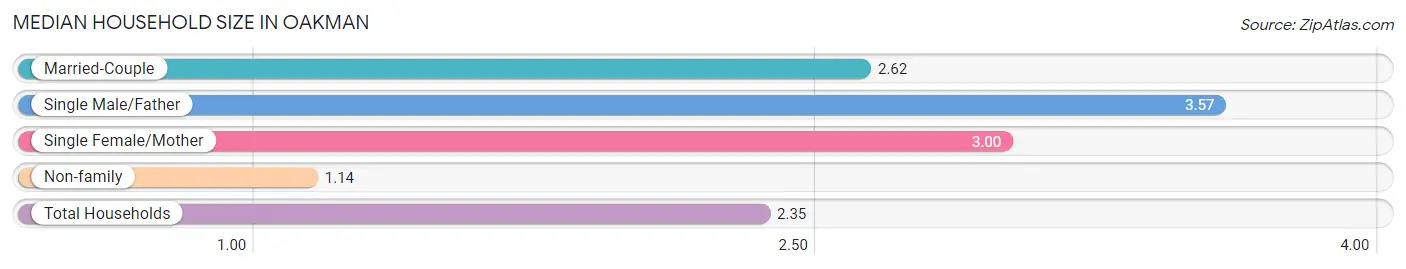
| Household Type | # Households | Household Size |
| Married-Couple | 170 (44.5%) | 2.62 |
| Single Male/Father | 7 (1.8%) | 3.57 |
| Single Female/Mother | 104 (27.2%) | 3.00 |
| Non-family | 101 (26.4%) | 1.14 |
| Total Households | 382 (100.0%) | 2.35 |
Household Size by Marriage Status in Oakman
Out of a total of 382 households in Oakman, 281 (73.6%) are family households, while 101 (26.4%) are nonfamily households. The most numerous type of family households are 2-person households, comprising 190, and the most common type of nonfamily households are 1-person households, comprising 88.
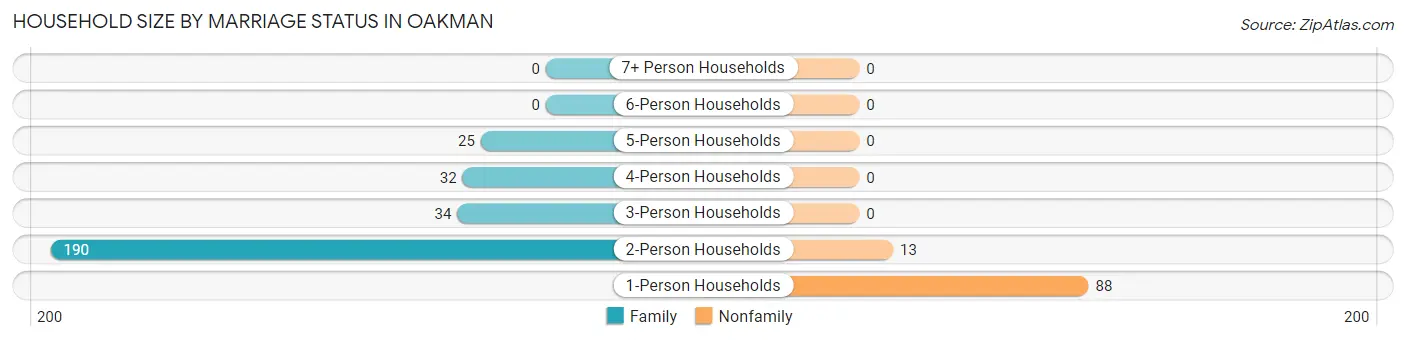
| Household Size | Family Households | Nonfamily Households |
| 1-Person Households | - | 88 (23.0%) |
| 2-Person Households | 190 (49.7%) | 13 (3.4%) |
| 3-Person Households | 34 (8.9%) | 0 (0.0%) |
| 4-Person Households | 32 (8.4%) | 0 (0.0%) |
| 5-Person Households | 25 (6.5%) | 0 (0.0%) |
| 6-Person Households | 0 (0.0%) | 0 (0.0%) |
| 7+ Person Households | 0 (0.0%) | 0 (0.0%) |
| Total | 281 (73.6%) | 101 (26.4%) |
Female Fertility in Oakman
Fertility by Age in Oakman
Average fertility rate in Oakman is 27.0 births per 1,000 women. Women in the age bracket of 15 to 19 years have the highest fertility rate with 53.0 births per 1,000 women. Women in the age bracket of 20 to 34 years acount for 80.0% of all women with births.
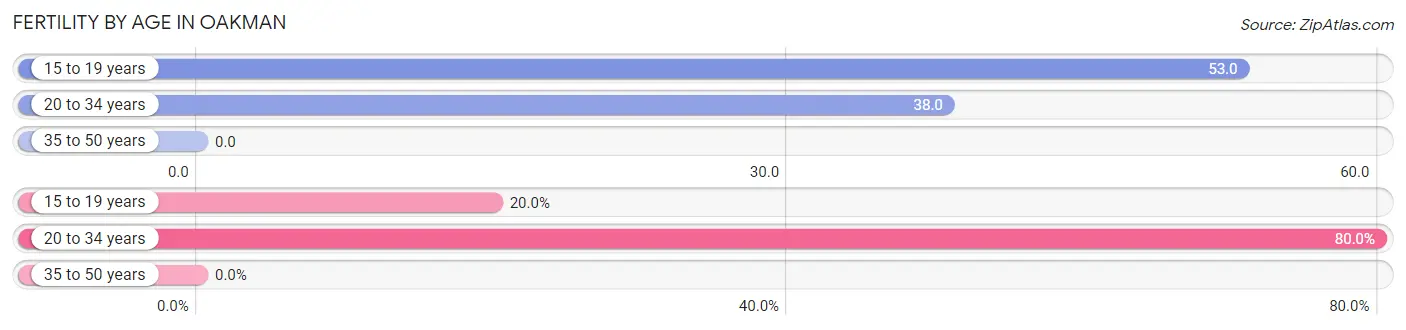
| Age Bracket | Women with Births | Births / 1,000 Women |
| 15 to 19 years | 1 (20.0%) | 53.0 |
| 20 to 34 years | 4 (80.0%) | 38.0 |
| 35 to 50 years | 0 (0.0%) | 0.0 |
| Total | 5 (100.0%) | 27.0 |
Fertility by Age by Marriage Status in Oakman
80.0% of women with births (5) in Oakman are married. The highest percentage of unmarried women with births falls into 15 to 19 years age bracket with 100.0% of them unmarried at the time of birth, while the lowest percentage of unmarried women with births belong to 20 to 34 years age bracket with 0.0% of them unmarried.
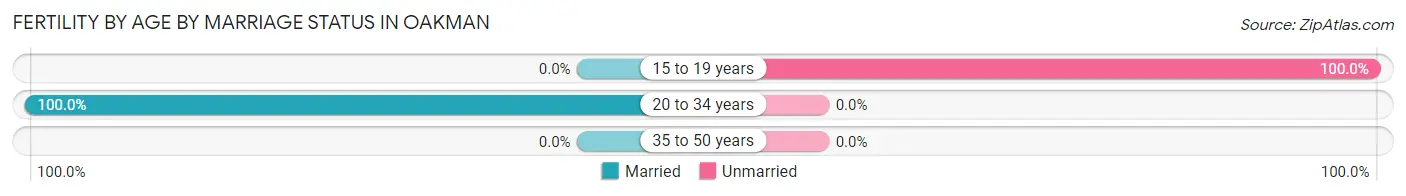
| Age Bracket | Married | Unmarried |
| 15 to 19 years | 0 (0.0%) | 1 (100.0%) |
| 20 to 34 years | 4 (100.0%) | 0 (0.0%) |
| 35 to 50 years | 0 (0.0%) | 0 (0.0%) |
| Total | 4 (80.0%) | 1 (20.0%) |
Fertility by Education in Oakman
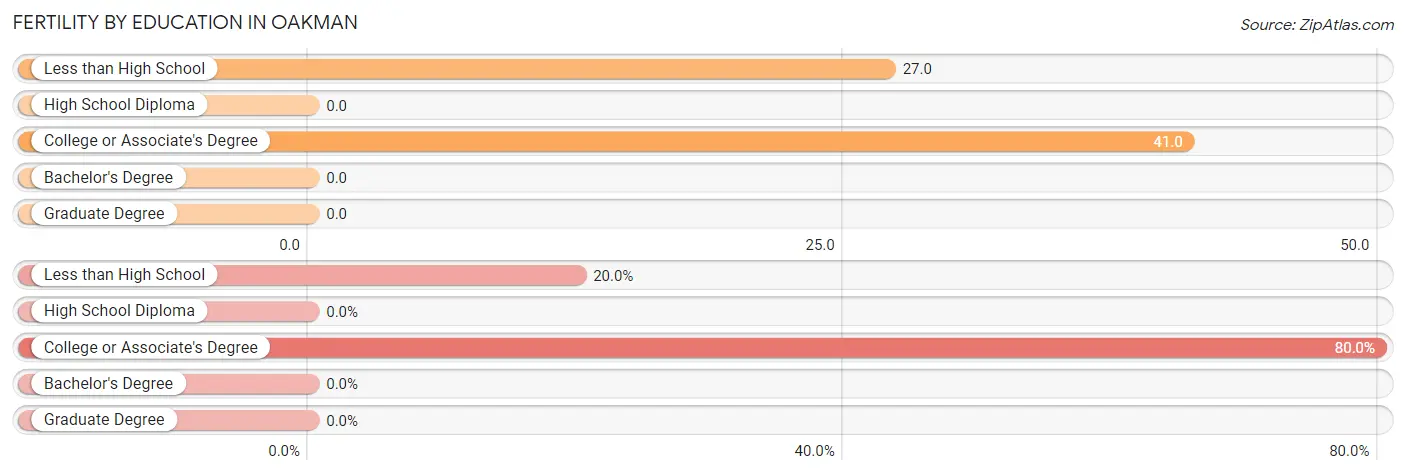
| Educational Attainment | Women with Births | Births / 1,000 Women |
| Less than High School | 1 (20.0%) | 27.0 |
| High School Diploma | 0 (0.0%) | 0.0 |
| College or Associate's Degree | 4 (80.0%) | 41.0 |
| Bachelor's Degree | 0 (0.0%) | 0.0 |
| Graduate Degree | 0 (0.0%) | 0.0 |
| Total | 5 (100.0%) | 27.0 |
Fertility by Education by Marriage Status in Oakman
20.0% of women with births in Oakman are unmarried. Women with the educational attainment of college or associate's degree are most likely to be married with 100.0% of them married at childbirth, while women with the educational attainment of less than high school are least likely to be married with 100.0% of them unmarried at childbirth.
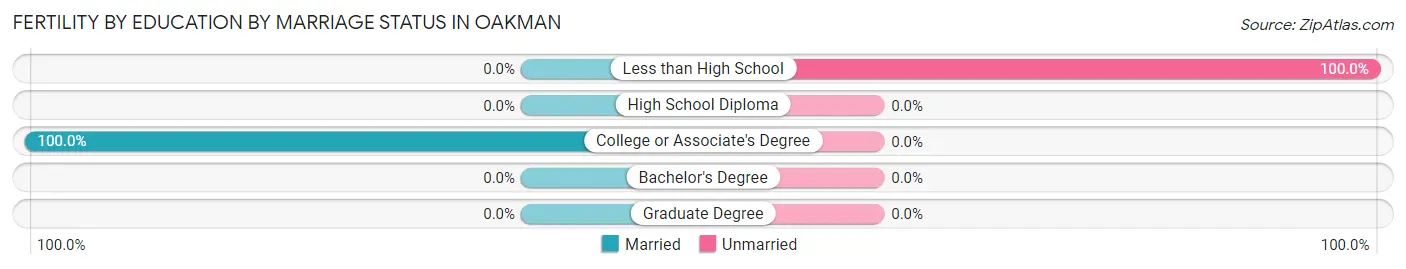
| Educational Attainment | Married | Unmarried |
| Less than High School | 0 (0.0%) | 1 (100.0%) |
| High School Diploma | 0 (0.0%) | 0 (0.0%) |
| College or Associate's Degree | 4 (100.0%) | 0 (0.0%) |
| Bachelor's Degree | 0 (0.0%) | 0 (0.0%) |
| Graduate Degree | 0 (0.0%) | 0 (0.0%) |
| Total | 4 (80.0%) | 1 (20.0%) |
Employment Characteristics in Oakman
Employment by Class of Employer in Oakman
Among the 244 employed individuals in Oakman, private company employees (154 | 63.1%), federal government employees (46 | 18.9%), and local government employees (19 | 7.8%) make up the most common classes of employment.
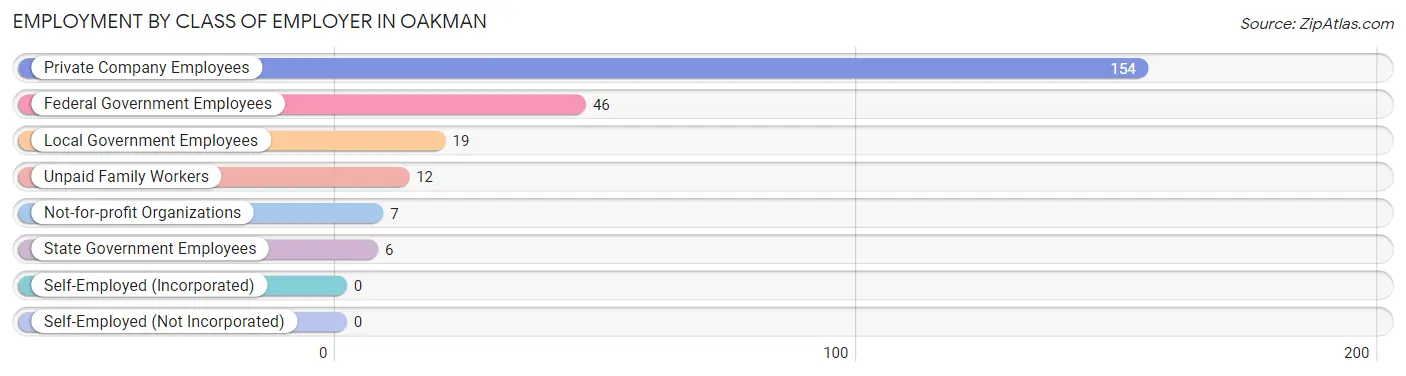
| Employer Class | # Employees | % Employees |
| Private Company Employees | 154 | 63.1% |
| Self-Employed (Incorporated) | 0 | 0.0% |
| Self-Employed (Not Incorporated) | 0 | 0.0% |
| Not-for-profit Organizations | 7 | 2.9% |
| Local Government Employees | 19 | 7.8% |
| State Government Employees | 6 | 2.5% |
| Federal Government Employees | 46 | 18.9% |
| Unpaid Family Workers | 12 | 4.9% |
| Total | 244 | 100.0% |
Employment Status by Age in Oakman
According to the labor force statistics for Oakman, out of the total population over 16 years of age (669), 39.6% or 265 individuals are in the labor force, with 7.9% or 21 of them unemployed. The age group with the highest labor force participation rate is 35 to 44 years, with 90.4% or 66 individuals in the labor force. Within the labor force, the 65 to 74 years age range has the highest percentage of unemployed individuals, with 75.0% or 6 of them being unemployed.
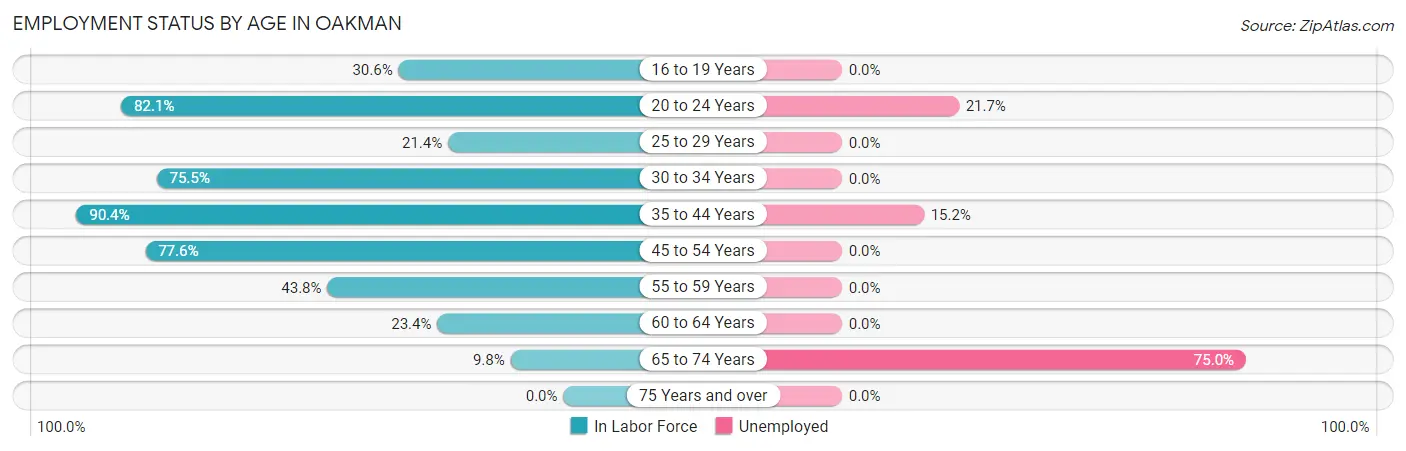
| Age Bracket | In Labor Force | Unemployed |
| 16 to 19 Years | 11 (30.6%) | 0 (0.0%) |
| 20 to 24 Years | 23 (82.1%) | 5 (21.7%) |
| 25 to 29 Years | 9 (21.4%) | 0 (0.0%) |
| 30 to 34 Years | 71 (75.5%) | 0 (0.0%) |
| 35 to 44 Years | 66 (90.4%) | 10 (15.2%) |
| 45 to 54 Years | 52 (77.6%) | 0 (0.0%) |
| 55 to 59 Years | 14 (43.8%) | 0 (0.0%) |
| 60 to 64 Years | 11 (23.4%) | 0 (0.0%) |
| 65 to 74 Years | 8 (9.8%) | 6 (75.0%) |
| 75 Years and over | 0 (0.0%) | 0 (0.0%) |
| Total | 265 (39.6%) | 21 (7.9%) |
Employment Status by Educational Attainment in Oakman
According to labor force statistics for Oakman, 62.8% of individuals (223) out of the total population between 25 and 64 years of age (355) are in the labor force, with 4.5% or 10 of them being unemployed. The group with the highest labor force participation rate are those with the educational attainment of high school diploma, with 70.2% or 85 individuals in the labor force. Within the labor force, individuals with high school diploma education have the highest percentage of unemployment, with 11.8% or 10 of them being unemployed.
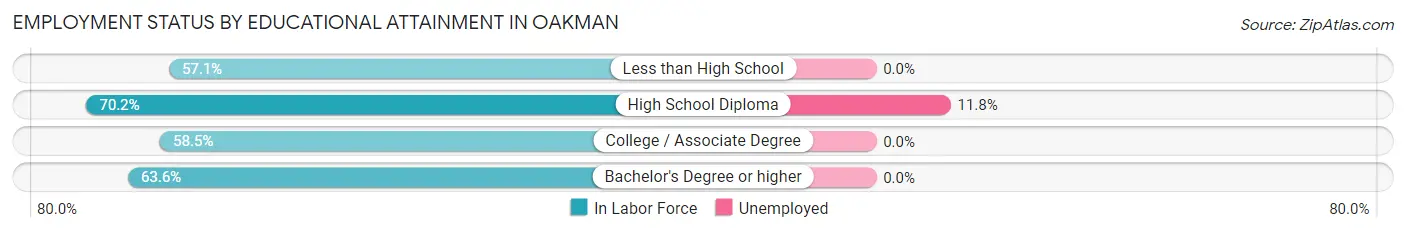
| Educational Attainment | In Labor Force | Unemployed |
| Less than High School | 24 (57.1%) | 0 (0.0%) |
| High School Diploma | 85 (70.2%) | 14 (11.8%) |
| College / Associate Degree | 93 (58.5%) | 0 (0.0%) |
| Bachelor's Degree or higher | 21 (63.6%) | 0 (0.0%) |
| Total | 223 (62.8%) | 16 (4.5%) |
Employment Occupations by Sex in Oakman
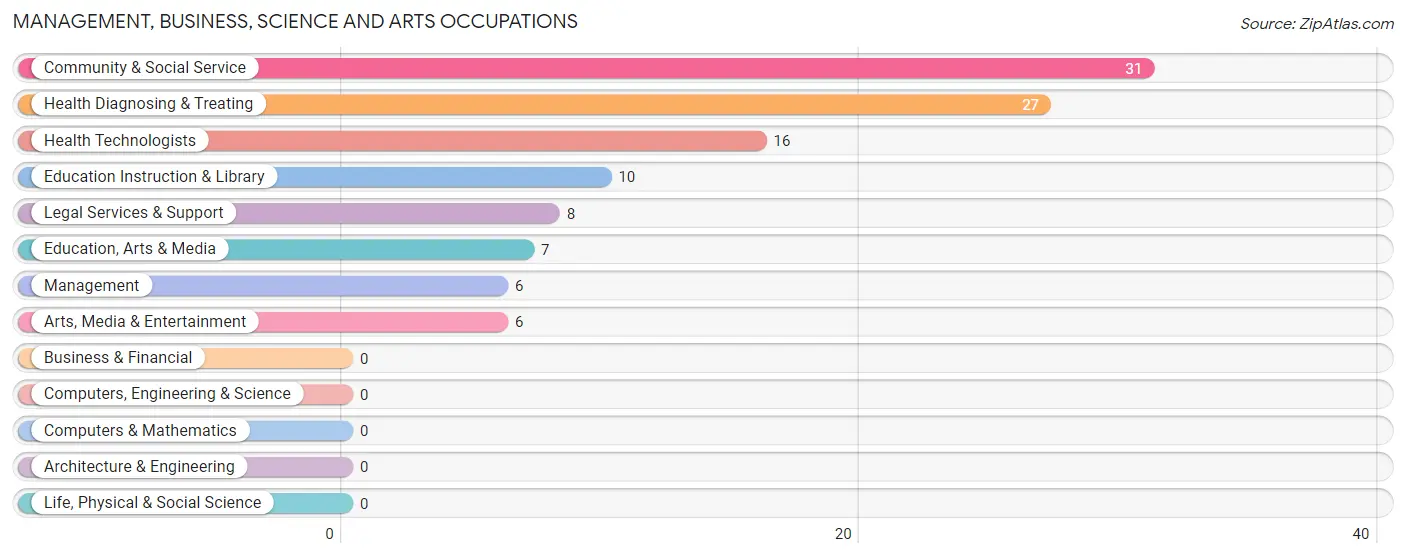
Management, Business, Science and Arts Occupations
The most common Management, Business, Science and Arts occupations in Oakman are Community & Social Service (31 | 12.7%), Health Diagnosing & Treating (27 | 11.1%), Health Technologists (16 | 6.6%), Education Instruction & Library (10 | 4.1%), and Legal Services & Support (8 | 3.3%).
Management, Business, Science and Arts Occupations by Sex
Within the Management, Business, Science and Arts occupations in Oakman, the most male-oriented occupations are Education, Arts & Media (100.0%), Health Diagnosing & Treating (40.7%), and Management (33.3%), while the most female-oriented occupations are Legal Services & Support (100.0%), Arts, Media & Entertainment (100.0%), and Health Technologists (100.0%).
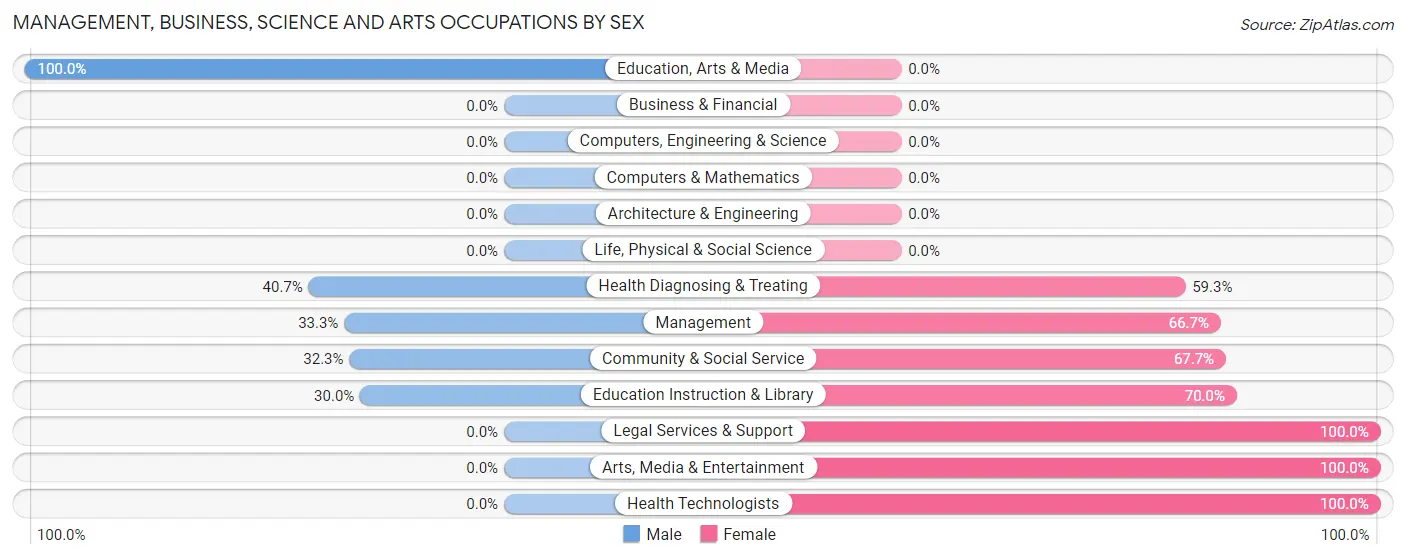
| Occupation | Male | Female |
| Management | 2 (33.3%) | 4 (66.7%) |
| Business & Financial | 0 (0.0%) | 0 (0.0%) |
| Computers, Engineering & Science | 0 (0.0%) | 0 (0.0%) |
| Computers & Mathematics | 0 (0.0%) | 0 (0.0%) |
| Architecture & Engineering | 0 (0.0%) | 0 (0.0%) |
| Life, Physical & Social Science | 0 (0.0%) | 0 (0.0%) |
| Community & Social Service | 10 (32.3%) | 21 (67.7%) |
| Education, Arts & Media | 7 (100.0%) | 0 (0.0%) |
| Legal Services & Support | 0 (0.0%) | 8 (100.0%) |
| Education Instruction & Library | 3 (30.0%) | 7 (70.0%) |
| Arts, Media & Entertainment | 0 (0.0%) | 6 (100.0%) |
| Health Diagnosing & Treating | 11 (40.7%) | 16 (59.3%) |
| Health Technologists | 0 (0.0%) | 16 (100.0%) |
| Total (Category) | 23 (35.9%) | 41 (64.1%) |
| Total (Overall) | 124 (50.8%) | 120 (49.2%) |
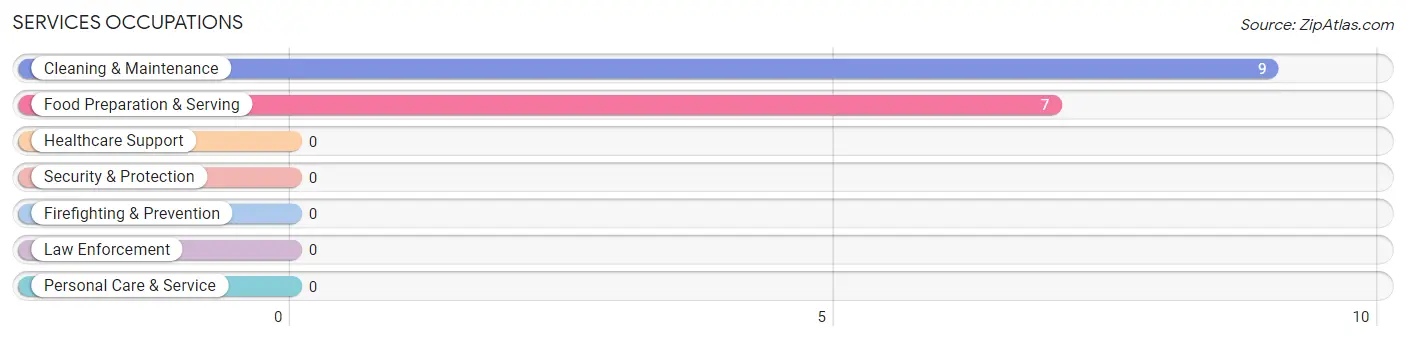
Services Occupations
The most common Services occupations in Oakman are Cleaning & Maintenance (9 | 3.7%), and Food Preparation & Serving (7 | 2.9%).
Services Occupations by Sex
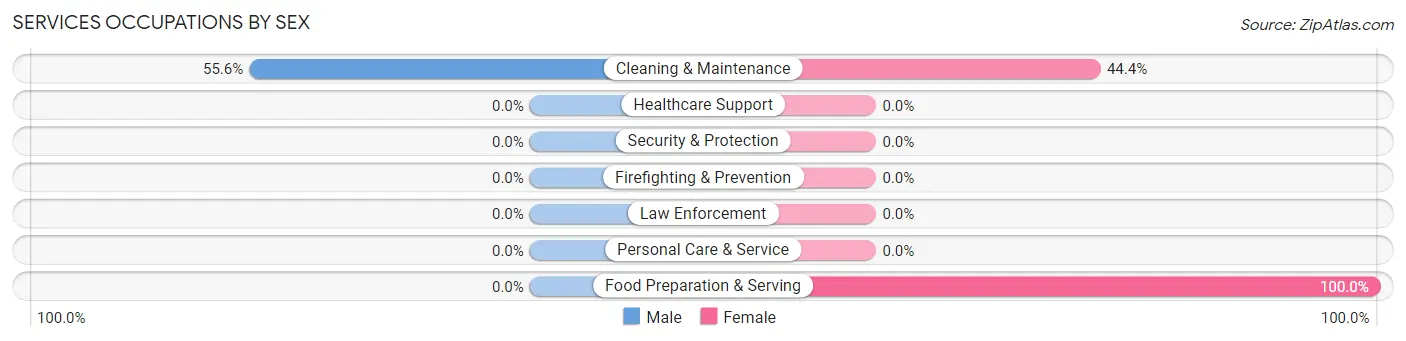
| Occupation | Male | Female |
| Healthcare Support | 0 (0.0%) | 0 (0.0%) |
| Security & Protection | 0 (0.0%) | 0 (0.0%) |
| Firefighting & Prevention | 0 (0.0%) | 0 (0.0%) |
| Law Enforcement | 0 (0.0%) | 0 (0.0%) |
| Food Preparation & Serving | 0 (0.0%) | 7 (100.0%) |
| Cleaning & Maintenance | 5 (55.6%) | 4 (44.4%) |
| Personal Care & Service | 0 (0.0%) | 0 (0.0%) |
| Total (Category) | 5 (31.2%) | 11 (68.8%) |
| Total (Overall) | 124 (50.8%) | 120 (49.2%) |
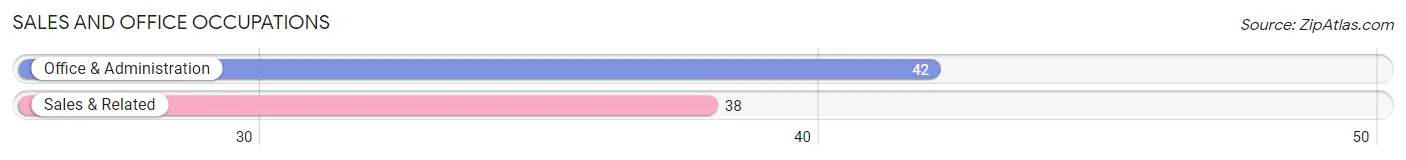
Sales and Office Occupations
The most common Sales and Office occupations in Oakman are Office & Administration (42 | 17.2%), and Sales & Related (38 | 15.6%).
Sales and Office Occupations by Sex
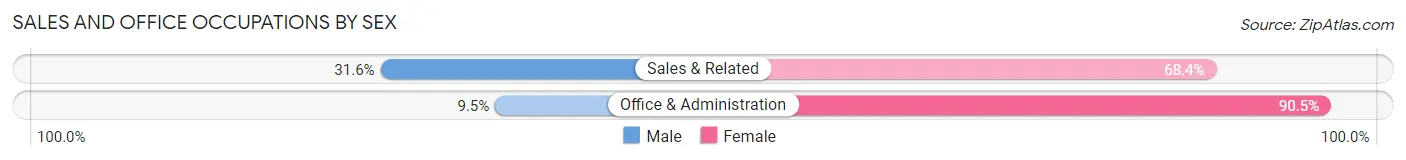
| Occupation | Male | Female |
| Sales & Related | 12 (31.6%) | 26 (68.4%) |
| Office & Administration | 4 (9.5%) | 38 (90.5%) |
| Total (Category) | 16 (20.0%) | 64 (80.0%) |
| Total (Overall) | 124 (50.8%) | 120 (49.2%) |
Natural Resources, Construction and Maintenance Occupations
The most common Natural Resources, Construction and Maintenance occupations in Oakman are Installation, Maintenance & Repair (15 | 6.1%), Construction & Extraction (11 | 4.5%), and Farming, Fishing & Forestry (3 | 1.2%).
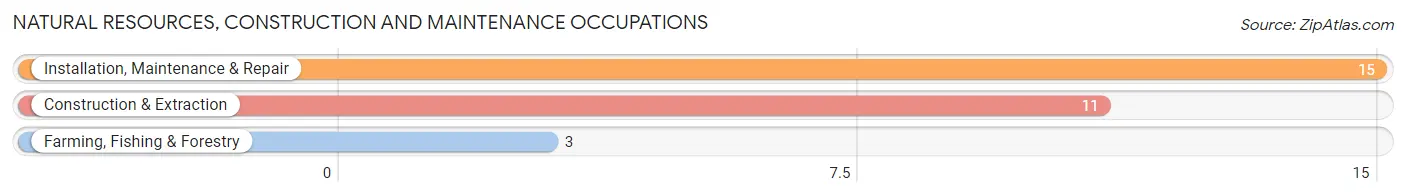
Natural Resources, Construction and Maintenance Occupations by Sex
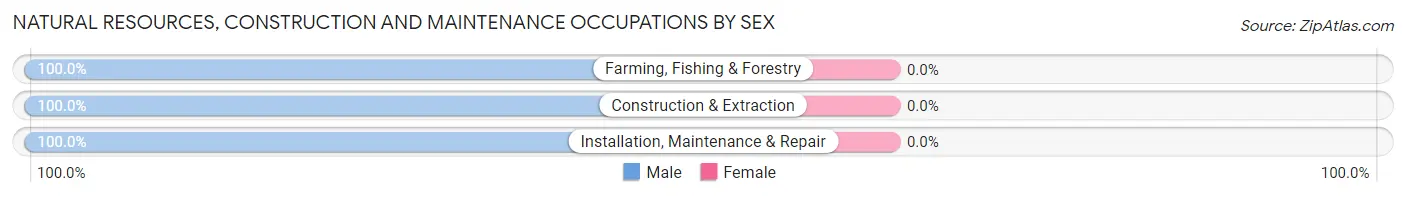
| Occupation | Male | Female |
| Farming, Fishing & Forestry | 3 (100.0%) | 0 (0.0%) |
| Construction & Extraction | 11 (100.0%) | 0 (0.0%) |
| Installation, Maintenance & Repair | 15 (100.0%) | 0 (0.0%) |
| Total (Category) | 29 (100.0%) | 0 (0.0%) |
| Total (Overall) | 124 (50.8%) | 120 (49.2%) |
Production, Transportation and Moving Occupations
The most common Production, Transportation and Moving occupations in Oakman are Production (52 | 21.3%), and Transportation (3 | 1.2%).
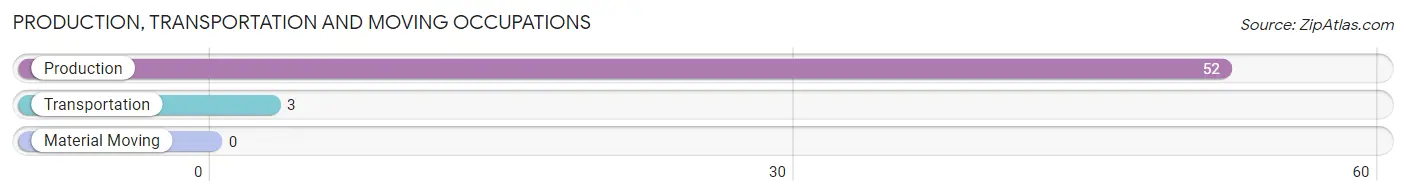
Production, Transportation and Moving Occupations by Sex
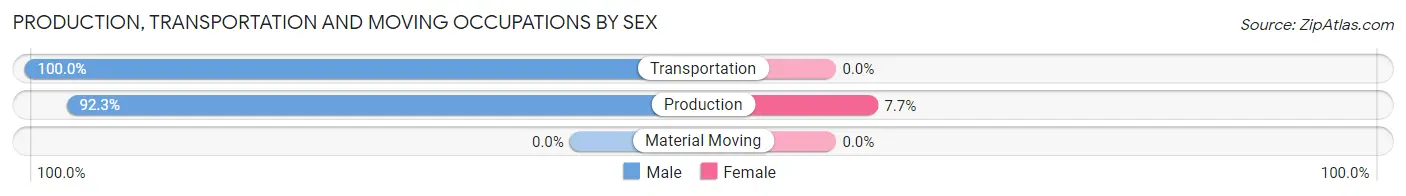
| Occupation | Male | Female |
| Production | 48 (92.3%) | 4 (7.7%) |
| Transportation | 3 (100.0%) | 0 (0.0%) |
| Material Moving | 0 (0.0%) | 0 (0.0%) |
| Total (Category) | 51 (92.7%) | 4 (7.3%) |
| Total (Overall) | 124 (50.8%) | 120 (49.2%) |
Employment Industries by Sex in Oakman
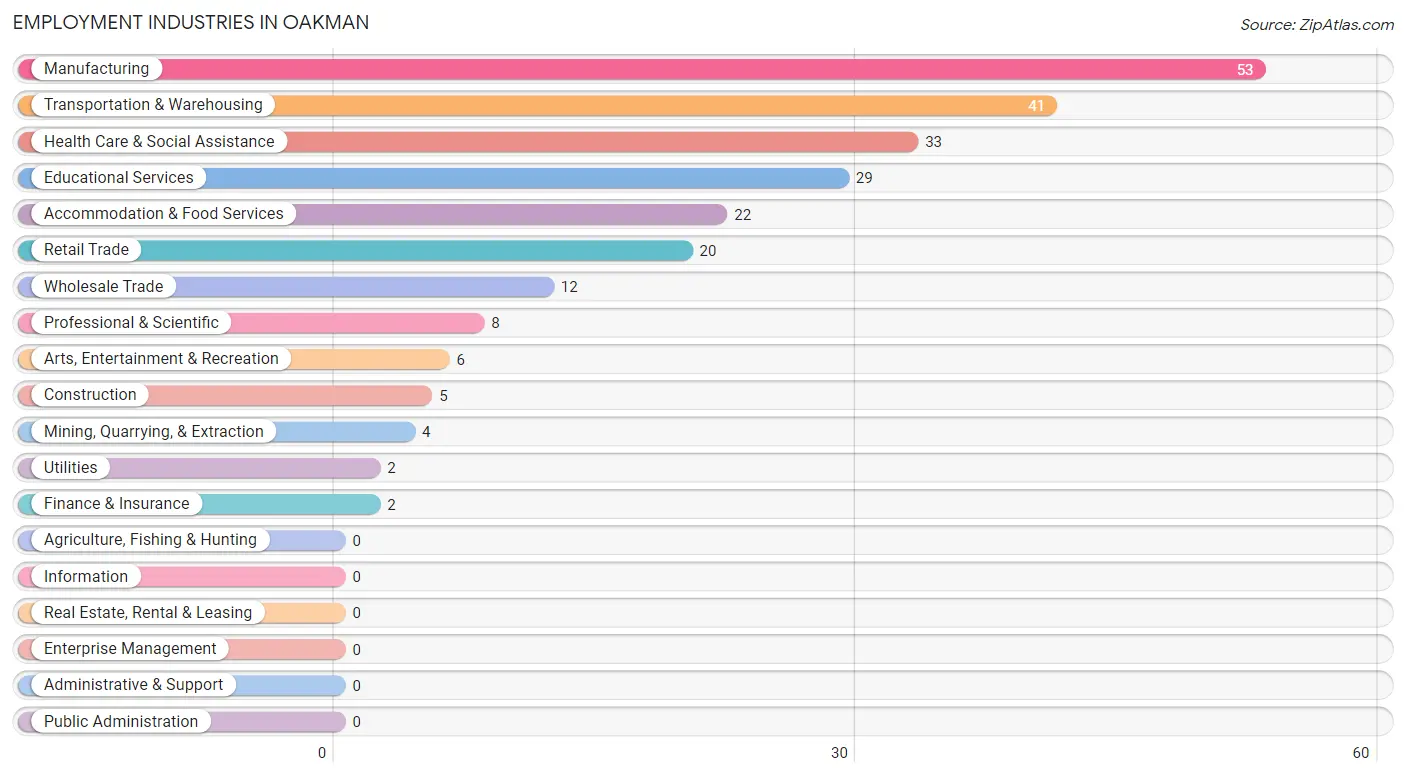
Employment Industries in Oakman
The major employment industries in Oakman include Manufacturing (53 | 21.7%), Transportation & Warehousing (41 | 16.8%), Health Care & Social Assistance (33 | 13.5%), Educational Services (29 | 11.9%), and Accommodation & Food Services (22 | 9.0%).
Employment Industries by Sex in Oakman
The Oakman industries that see more men than women are Mining, Quarrying, & Extraction (100.0%), Construction (100.0%), and Manufacturing (100.0%), whereas the industries that tend to have a higher number of women are Wholesale Trade (100.0%), Professional & Scientific (100.0%), and Arts, Entertainment & Recreation (100.0%).
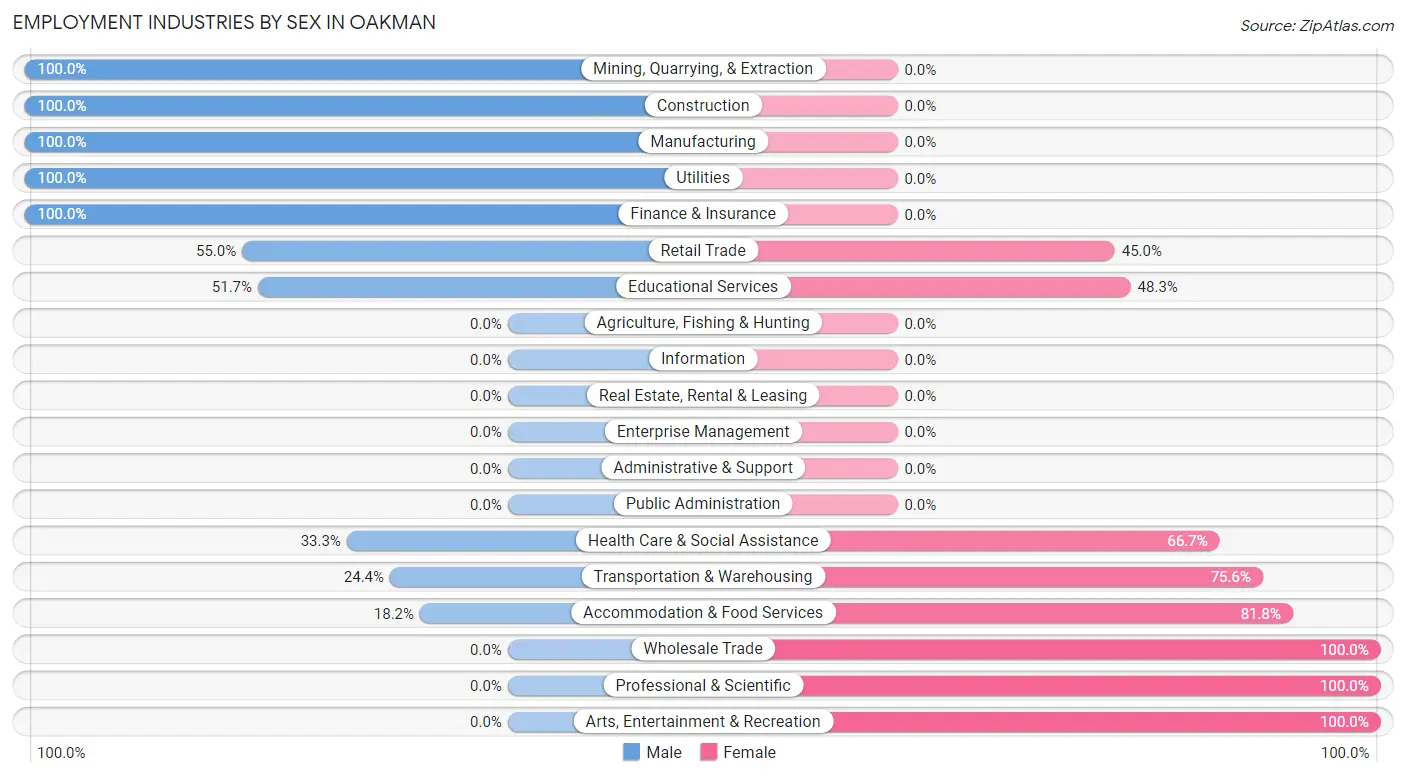
| Industry | Male | Female |
| Agriculture, Fishing & Hunting | 0 (0.0%) | 0 (0.0%) |
| Mining, Quarrying, & Extraction | 4 (100.0%) | 0 (0.0%) |
| Construction | 5 (100.0%) | 0 (0.0%) |
| Manufacturing | 53 (100.0%) | 0 (0.0%) |
| Wholesale Trade | 0 (0.0%) | 12 (100.0%) |
| Retail Trade | 11 (55.0%) | 9 (45.0%) |
| Transportation & Warehousing | 10 (24.4%) | 31 (75.6%) |
| Utilities | 2 (100.0%) | 0 (0.0%) |
| Information | 0 (0.0%) | 0 (0.0%) |
| Finance & Insurance | 2 (100.0%) | 0 (0.0%) |
| Real Estate, Rental & Leasing | 0 (0.0%) | 0 (0.0%) |
| Professional & Scientific | 0 (0.0%) | 8 (100.0%) |
| Enterprise Management | 0 (0.0%) | 0 (0.0%) |
| Administrative & Support | 0 (0.0%) | 0 (0.0%) |
| Educational Services | 15 (51.7%) | 14 (48.3%) |
| Health Care & Social Assistance | 11 (33.3%) | 22 (66.7%) |
| Arts, Entertainment & Recreation | 0 (0.0%) | 6 (100.0%) |
| Accommodation & Food Services | 4 (18.2%) | 18 (81.8%) |
| Public Administration | 0 (0.0%) | 0 (0.0%) |
| Total | 124 (50.8%) | 120 (49.2%) |
Education in Oakman
School Enrollment in Oakman
The most common levels of schooling among the 183 students in Oakman are middle school (78 | 42.6%), high school (35 | 19.1%), and elementary school (28 | 15.3%).
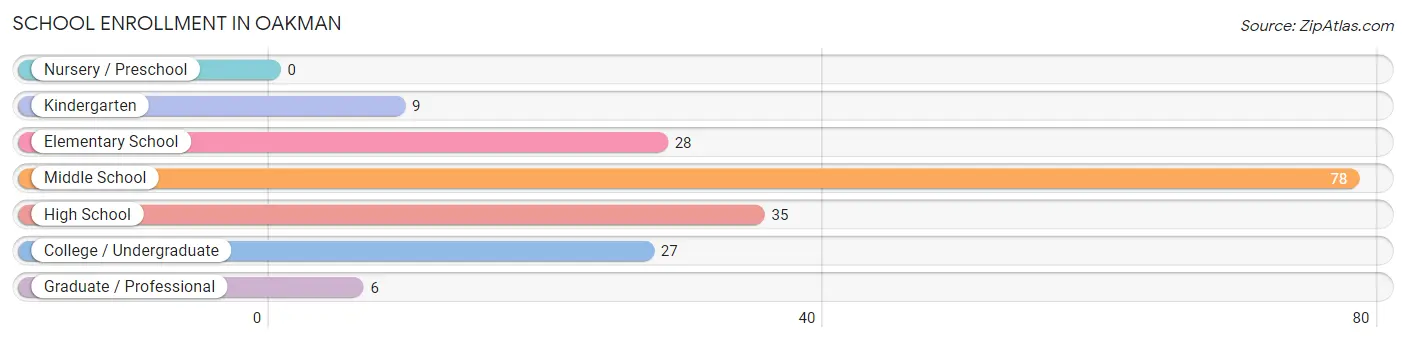
| School Level | # Students | % Students |
| Nursery / Preschool | 0 | 0.0% |
| Kindergarten | 9 | 4.9% |
| Elementary School | 28 | 15.3% |
| Middle School | 78 | 42.6% |
| High School | 35 | 19.1% |
| College / Undergraduate | 27 | 14.7% |
| Graduate / Professional | 6 | 3.3% |
| Total | 183 | 100.0% |
School Enrollment by Age by Funding Source in Oakman
Out of a total of 183 students who are enrolled in schools in Oakman, 3 (1.6%) attend a private institution, while the remaining 180 (98.4%) are enrolled in public schools. The age group of 5 to 9 year old has the highest likelihood of being enrolled in private schools, with 3 (9.7% in the age bracket) enrolled. Conversely, the age group of 10 to 14 year olds has the lowest likelihood of being enrolled in a private school, with 87 (100.0% in the age bracket) attending a public institution.
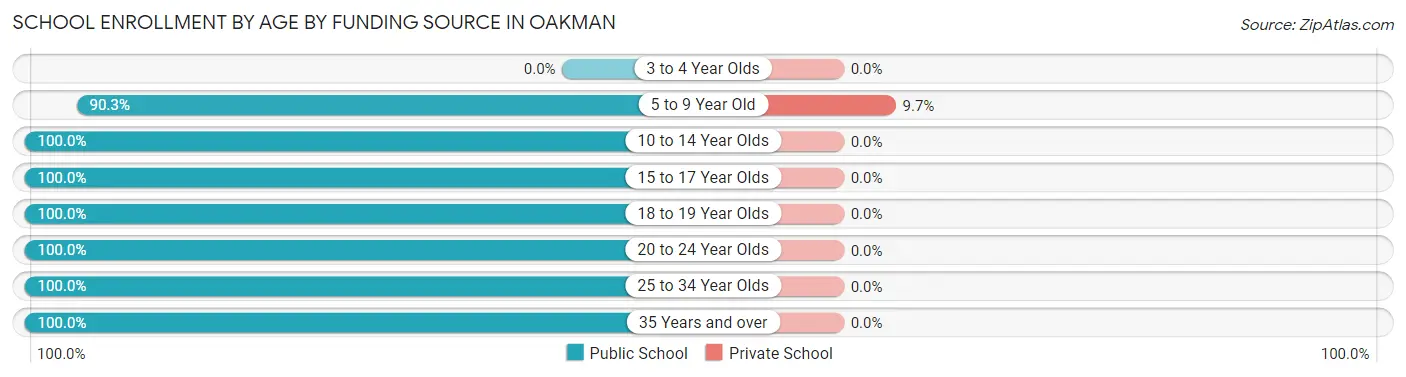
| Age Bracket | Public School | Private School |
| 3 to 4 Year Olds | 0 (0.0%) | 0 (0.0%) |
| 5 to 9 Year Old | 28 (90.3%) | 3 (9.7%) |
| 10 to 14 Year Olds | 87 (100.0%) | 0 (0.0%) |
| 15 to 17 Year Olds | 21 (100.0%) | 0 (0.0%) |
| 18 to 19 Year Olds | 11 (100.0%) | 0 (0.0%) |
| 20 to 24 Year Olds | 9 (100.0%) | 0 (0.0%) |
| 25 to 34 Year Olds | 18 (100.0%) | 0 (0.0%) |
| 35 Years and over | 6 (100.0%) | 0 (0.0%) |
| Total | 180 (98.4%) | 3 (1.6%) |
Educational Attainment by Field of Study in Oakman
Arts & humanities (14 | 35.0%), education (13 | 32.5%), engineering (12 | 30.0%), and science & technology (1 | 2.5%) are the most common fields of study among 40 individuals in Oakman who have obtained a bachelor's degree or higher.
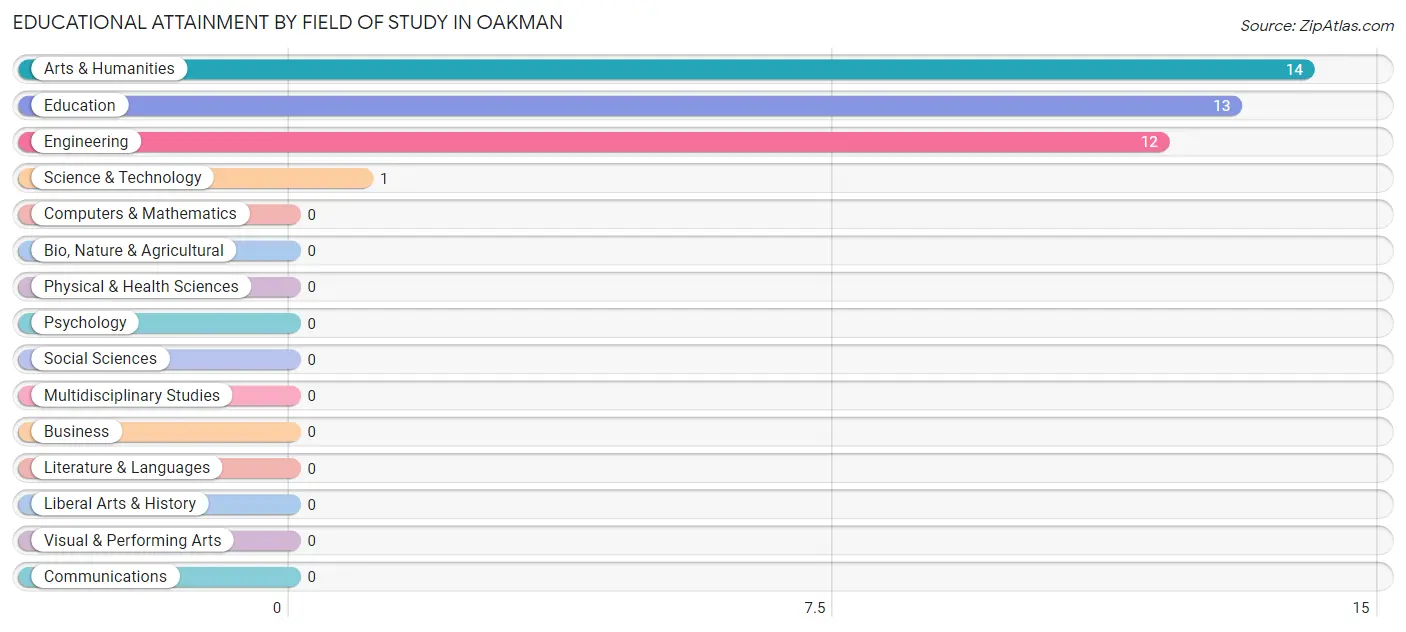
| Field of Study | # Graduates | % Graduates |
| Computers & Mathematics | 0 | 0.0% |
| Bio, Nature & Agricultural | 0 | 0.0% |
| Physical & Health Sciences | 0 | 0.0% |
| Psychology | 0 | 0.0% |
| Social Sciences | 0 | 0.0% |
| Engineering | 12 | 30.0% |
| Multidisciplinary Studies | 0 | 0.0% |
| Science & Technology | 1 | 2.5% |
| Business | 0 | 0.0% |
| Education | 13 | 32.5% |
| Literature & Languages | 0 | 0.0% |
| Liberal Arts & History | 0 | 0.0% |
| Visual & Performing Arts | 0 | 0.0% |
| Communications | 0 | 0.0% |
| Arts & Humanities | 14 | 35.0% |
| Total | 40 | 100.0% |
Transportation & Commute in Oakman
Vehicle Availability by Sex in Oakman
The most prevalent vehicle ownership categories in Oakman are males with 3 vehicles (63, accounting for 50.8%) and females with 3 vehicles (36, making up 52.5%).
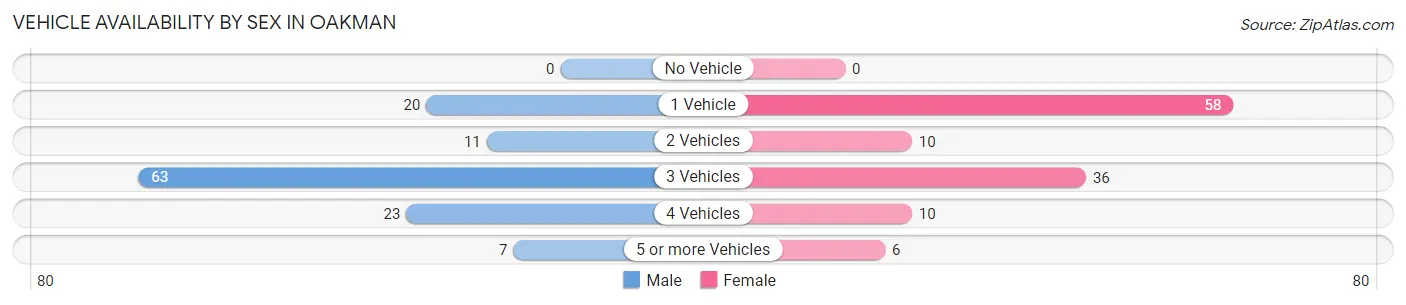
| Vehicles Available | Male | Female |
| No Vehicle | 0 (0.0%) | 0 (0.0%) |
| 1 Vehicle | 20 (16.1%) | 58 (48.3%) |
| 2 Vehicles | 11 (8.9%) | 10 (8.3%) |
| 3 Vehicles | 63 (50.8%) | 36 (30.0%) |
| 4 Vehicles | 23 (18.5%) | 10 (8.3%) |
| 5 or more Vehicles | 7 (5.7%) | 6 (5.0%) |
| Total | 124 (100.0%) | 120 (100.0%) |
Commute Time in Oakman
The most frequently occuring commute durations in Oakman are 20 to 24 minutes (47 commuters, 19.4%), 45 to 59 minutes (38 commuters, 15.7%), and 60 to 89 minutes (34 commuters, 14.1%).
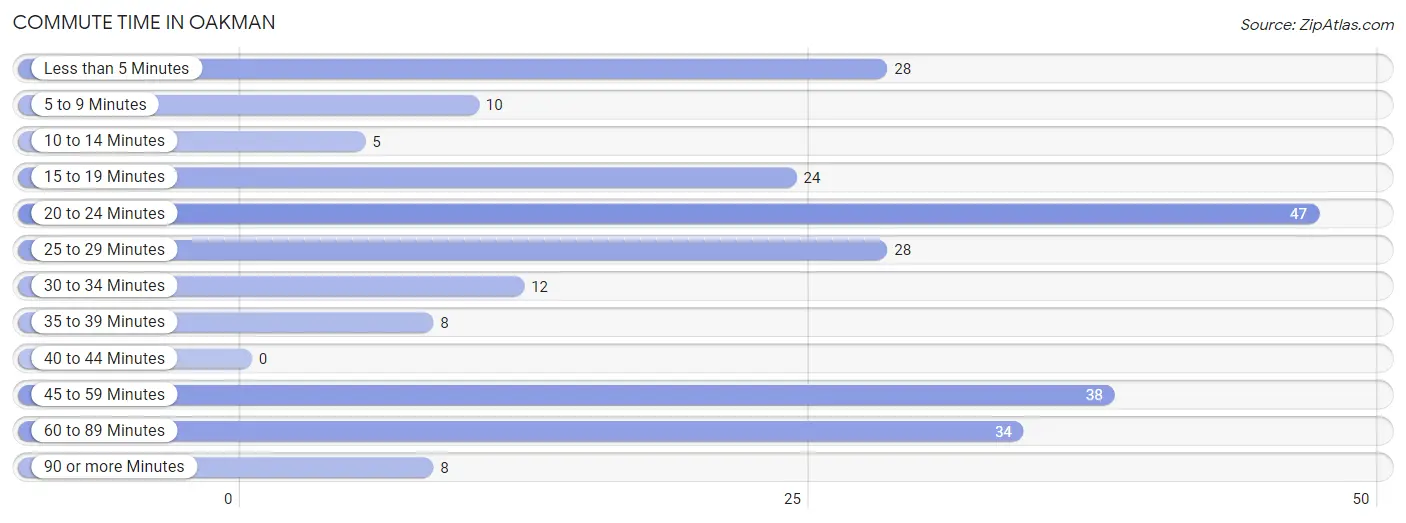
| Commute Time | # Commuters | % Commuters |
| Less than 5 Minutes | 28 | 11.6% |
| 5 to 9 Minutes | 10 | 4.1% |
| 10 to 14 Minutes | 5 | 2.1% |
| 15 to 19 Minutes | 24 | 9.9% |
| 20 to 24 Minutes | 47 | 19.4% |
| 25 to 29 Minutes | 28 | 11.6% |
| 30 to 34 Minutes | 12 | 5.0% |
| 35 to 39 Minutes | 8 | 3.3% |
| 40 to 44 Minutes | 0 | 0.0% |
| 45 to 59 Minutes | 38 | 15.7% |
| 60 to 89 Minutes | 34 | 14.1% |
| 90 or more Minutes | 8 | 3.3% |
Commute Time by Sex in Oakman
The most common commute times in Oakman are 45 to 59 minutes (38 commuters, 31.1%) for males and 20 to 24 minutes (39 commuters, 32.5%) for females.
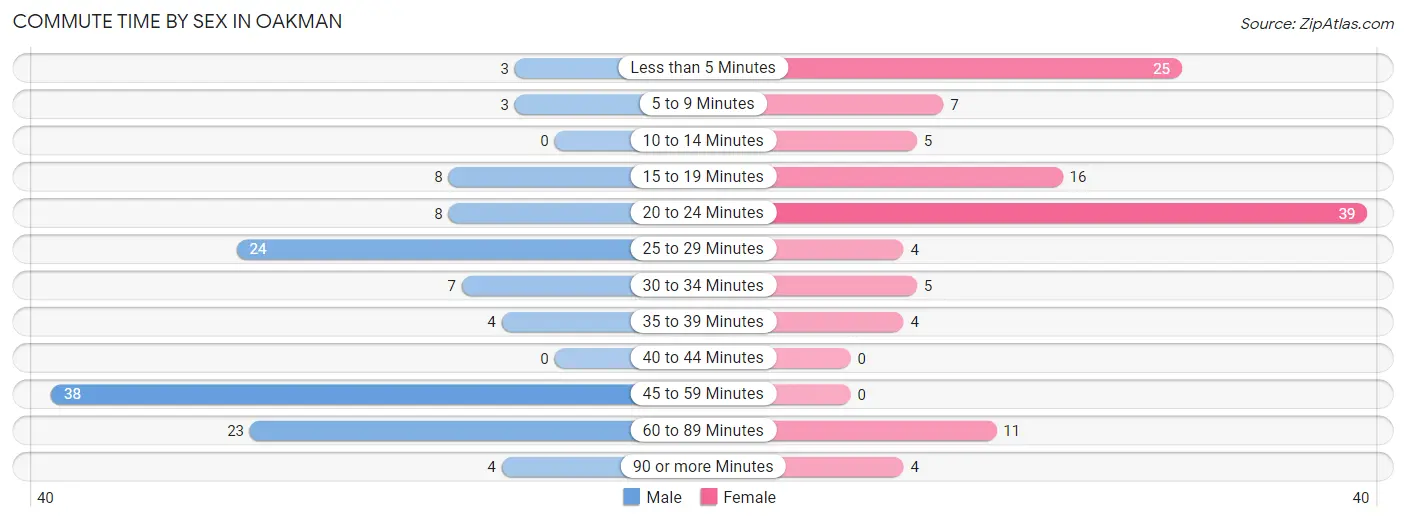
| Commute Time | Male | Female |
| Less than 5 Minutes | 3 (2.5%) | 25 (20.8%) |
| 5 to 9 Minutes | 3 (2.5%) | 7 (5.8%) |
| 10 to 14 Minutes | 0 (0.0%) | 5 (4.2%) |
| 15 to 19 Minutes | 8 (6.6%) | 16 (13.3%) |
| 20 to 24 Minutes | 8 (6.6%) | 39 (32.5%) |
| 25 to 29 Minutes | 24 (19.7%) | 4 (3.3%) |
| 30 to 34 Minutes | 7 (5.7%) | 5 (4.2%) |
| 35 to 39 Minutes | 4 (3.3%) | 4 (3.3%) |
| 40 to 44 Minutes | 0 (0.0%) | 0 (0.0%) |
| 45 to 59 Minutes | 38 (31.1%) | 0 (0.0%) |
| 60 to 89 Minutes | 23 (18.9%) | 11 (9.2%) |
| 90 or more Minutes | 4 (3.3%) | 4 (3.3%) |
Time of Departure to Work by Sex in Oakman
The most frequent times of departure to work in Oakman are 12:00 PM to 3:59 PM (27, 22.1%) for males and 12:00 AM to 4:59 AM (35, 29.2%) for females.
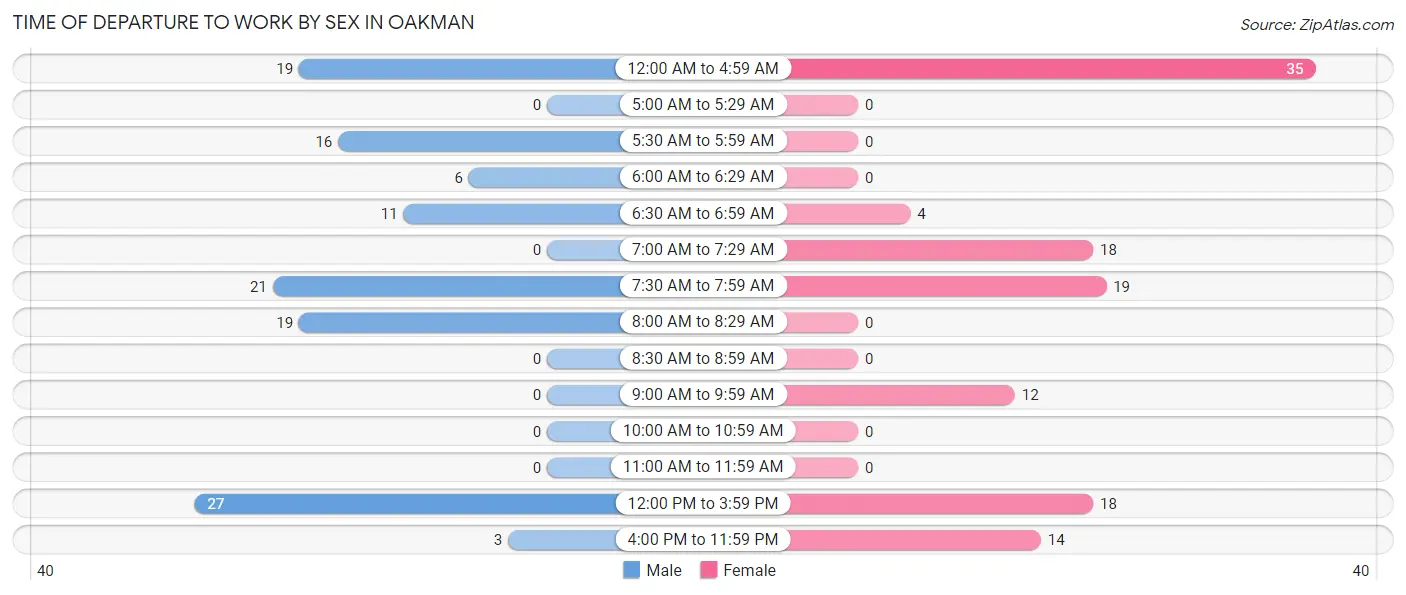
| Time of Departure | Male | Female |
| 12:00 AM to 4:59 AM | 19 (15.6%) | 35 (29.2%) |
| 5:00 AM to 5:29 AM | 0 (0.0%) | 0 (0.0%) |
| 5:30 AM to 5:59 AM | 16 (13.1%) | 0 (0.0%) |
| 6:00 AM to 6:29 AM | 6 (4.9%) | 0 (0.0%) |
| 6:30 AM to 6:59 AM | 11 (9.0%) | 4 (3.3%) |
| 7:00 AM to 7:29 AM | 0 (0.0%) | 18 (15.0%) |
| 7:30 AM to 7:59 AM | 21 (17.2%) | 19 (15.8%) |
| 8:00 AM to 8:29 AM | 19 (15.6%) | 0 (0.0%) |
| 8:30 AM to 8:59 AM | 0 (0.0%) | 0 (0.0%) |
| 9:00 AM to 9:59 AM | 0 (0.0%) | 12 (10.0%) |
| 10:00 AM to 10:59 AM | 0 (0.0%) | 0 (0.0%) |
| 11:00 AM to 11:59 AM | 0 (0.0%) | 0 (0.0%) |
| 12:00 PM to 3:59 PM | 27 (22.1%) | 18 (15.0%) |
| 4:00 PM to 11:59 PM | 3 (2.5%) | 14 (11.7%) |
| Total | 122 (100.0%) | 120 (100.0%) |
Housing Occupancy in Oakman
Occupancy by Ownership in Oakman
Of the total 382 dwellings in Oakman, owner-occupied units account for 292 (76.4%), while renter-occupied units make up 90 (23.6%).
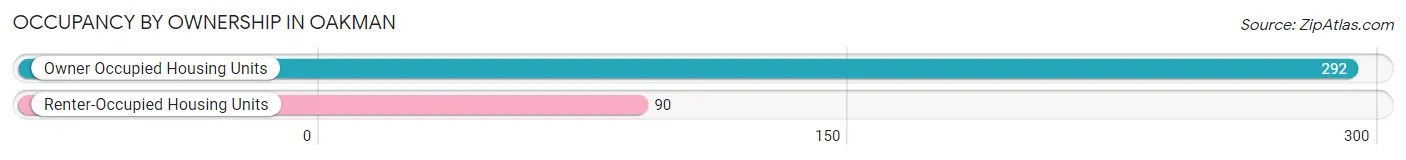
| Occupancy | # Housing Units | % Housing Units |
| Owner Occupied Housing Units | 292 | 76.4% |
| Renter-Occupied Housing Units | 90 | 23.6% |
| Total Occupied Housing Units | 382 | 100.0% |
Occupancy by Household Size in Oakman
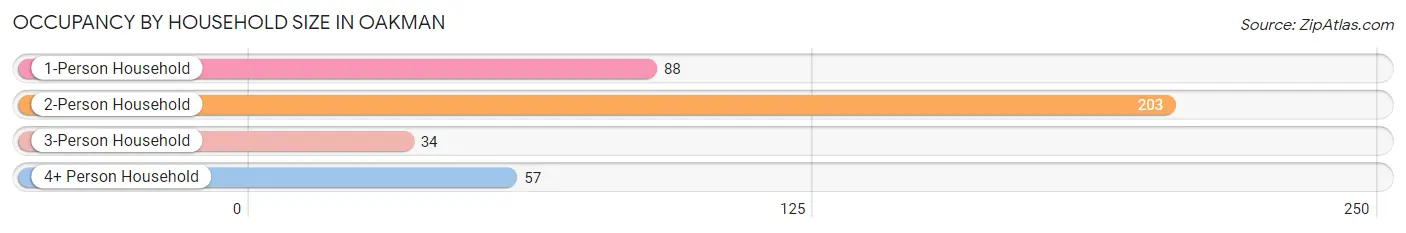
| Household Size | # Housing Units | % Housing Units |
| 1-Person Household | 88 | 23.0% |
| 2-Person Household | 203 | 53.1% |
| 3-Person Household | 34 | 8.9% |
| 4+ Person Household | 57 | 14.9% |
| Total Housing Units | 382 | 100.0% |
Occupancy by Ownership by Household Size in Oakman
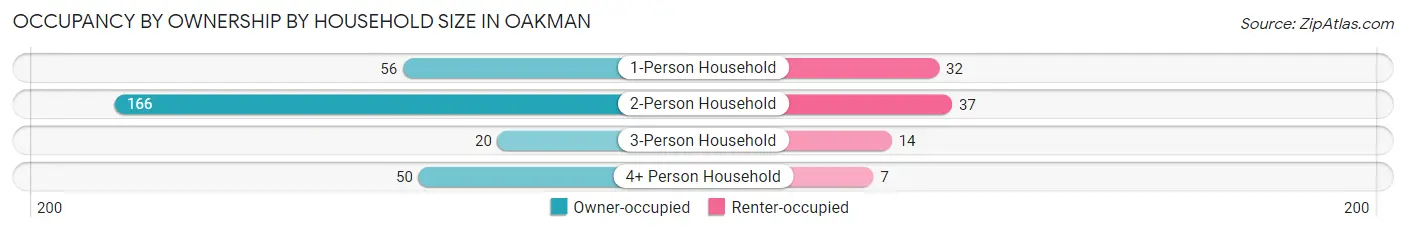
| Household Size | Owner-occupied | Renter-occupied |
| 1-Person Household | 56 (63.6%) | 32 (36.4%) |
| 2-Person Household | 166 (81.8%) | 37 (18.2%) |
| 3-Person Household | 20 (58.8%) | 14 (41.2%) |
| 4+ Person Household | 50 (87.7%) | 7 (12.3%) |
| Total Housing Units | 292 (76.4%) | 90 (23.6%) |
Occupancy by Educational Attainment in Oakman
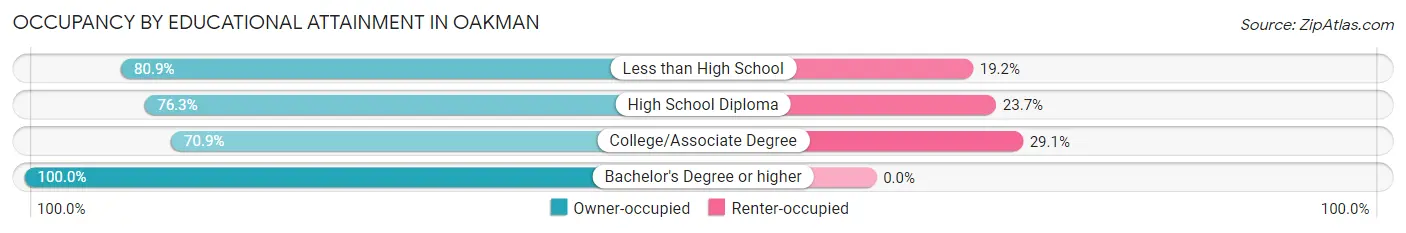
| Household Size | Owner-occupied | Renter-occupied |
| Less than High School | 38 (80.8%) | 9 (19.2%) |
| High School Diploma | 151 (76.3%) | 47 (23.7%) |
| College/Associate Degree | 83 (70.9%) | 34 (29.1%) |
| Bachelor's Degree or higher | 20 (100.0%) | 0 (0.0%) |
Occupancy by Age of Householder in Oakman
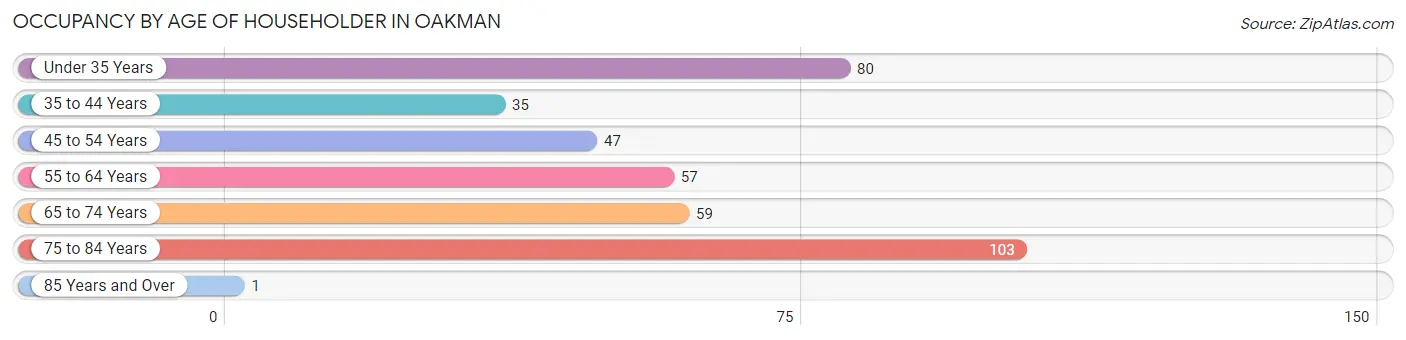
| Age Bracket | # Households | % Households |
| Under 35 Years | 80 | 20.9% |
| 35 to 44 Years | 35 | 9.2% |
| 45 to 54 Years | 47 | 12.3% |
| 55 to 64 Years | 57 | 14.9% |
| 65 to 74 Years | 59 | 15.4% |
| 75 to 84 Years | 103 | 27.0% |
| 85 Years and Over | 1 | 0.3% |
| Total | 382 | 100.0% |
Housing Finances in Oakman
Median Income by Occupancy in Oakman
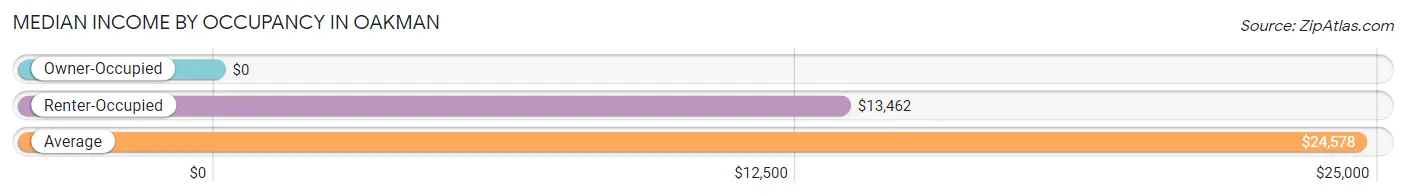
| Occupancy Type | # Households | Median Income |
| Owner-Occupied | 292 (76.4%) | $0 |
| Renter-Occupied | 90 (23.6%) | $13,462 |
| Average | 382 (100.0%) | $24,578 |
Occupancy by Householder Income Bracket in Oakman
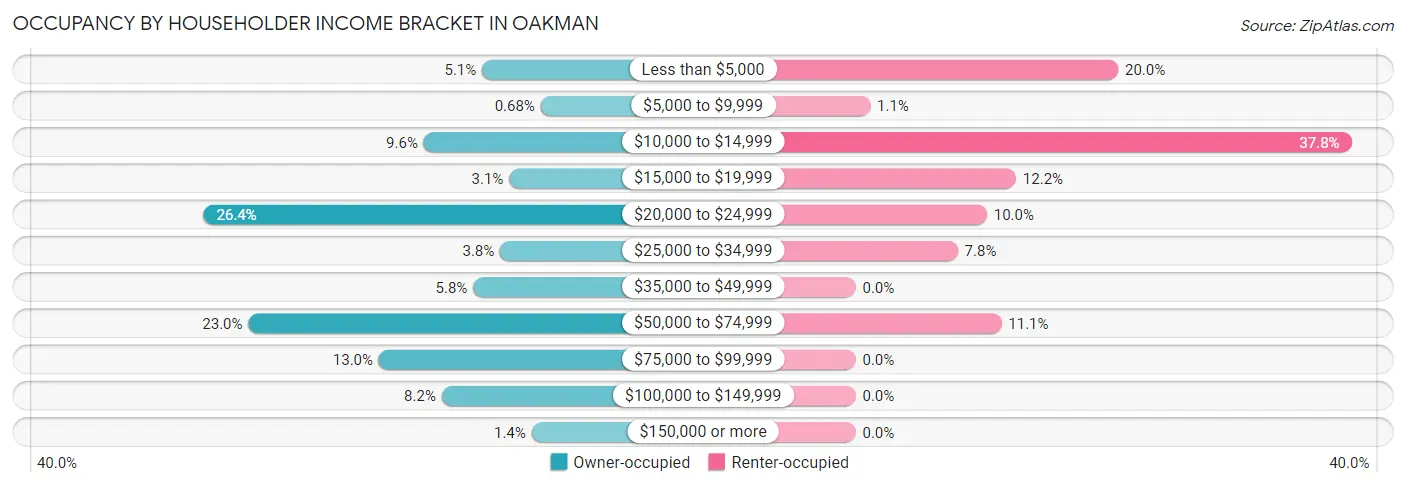
| Income Bracket | Owner-occupied | Renter-occupied |
| Less than $5,000 | 15 (5.1%) | 18 (20.0%) |
| $5,000 to $9,999 | 2 (0.7%) | 1 (1.1%) |
| $10,000 to $14,999 | 28 (9.6%) | 34 (37.8%) |
| $15,000 to $19,999 | 9 (3.1%) | 11 (12.2%) |
| $20,000 to $24,999 | 77 (26.4%) | 9 (10.0%) |
| $25,000 to $34,999 | 11 (3.8%) | 7 (7.8%) |
| $35,000 to $49,999 | 17 (5.8%) | 0 (0.0%) |
| $50,000 to $74,999 | 67 (23.0%) | 10 (11.1%) |
| $75,000 to $99,999 | 38 (13.0%) | 0 (0.0%) |
| $100,000 to $149,999 | 24 (8.2%) | 0 (0.0%) |
| $150,000 or more | 4 (1.4%) | 0 (0.0%) |
| Total | 292 (100.0%) | 90 (100.0%) |
Monthly Housing Cost Tiers in Oakman
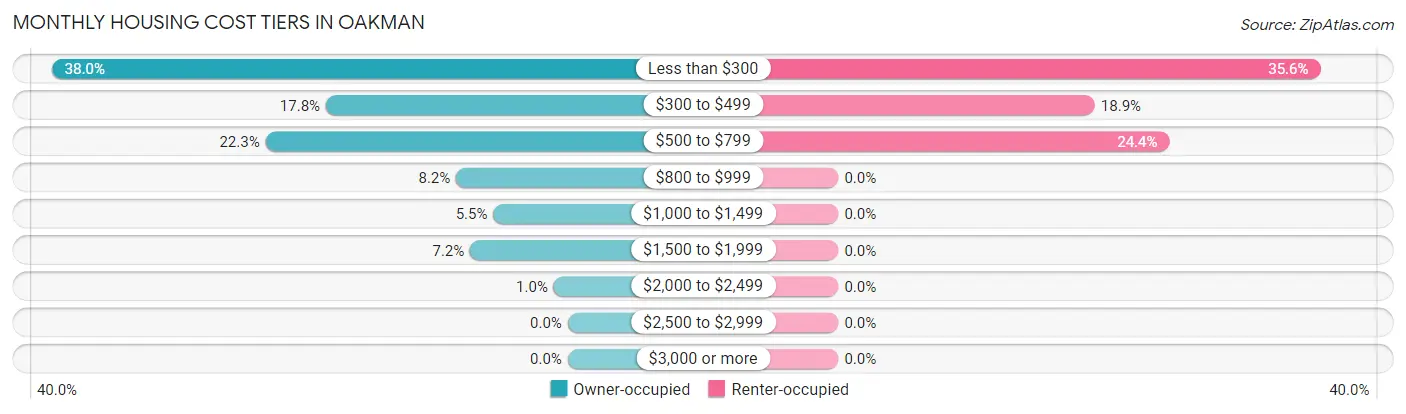
| Monthly Cost | Owner-occupied | Renter-occupied |
| Less than $300 | 111 (38.0%) | 32 (35.6%) |
| $300 to $499 | 52 (17.8%) | 17 (18.9%) |
| $500 to $799 | 65 (22.3%) | 22 (24.4%) |
| $800 to $999 | 24 (8.2%) | 0 (0.0%) |
| $1,000 to $1,499 | 16 (5.5%) | 0 (0.0%) |
| $1,500 to $1,999 | 21 (7.2%) | 0 (0.0%) |
| $2,000 to $2,499 | 3 (1.0%) | 0 (0.0%) |
| $2,500 to $2,999 | 0 (0.0%) | 0 (0.0%) |
| $3,000 or more | 0 (0.0%) | 0 (0.0%) |
| Total | 292 (100.0%) | 90 (100.0%) |
Physical Housing Characteristics in Oakman
Housing Structures in Oakman
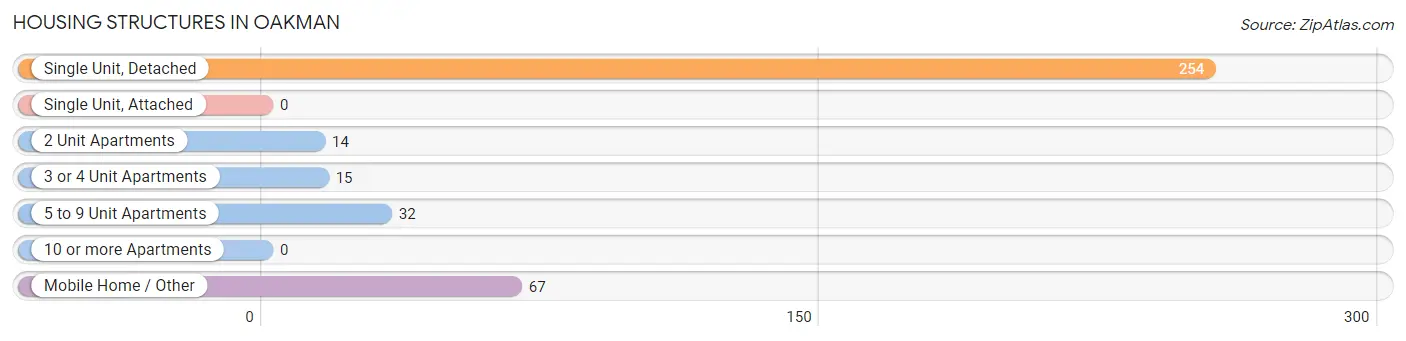
| Structure Type | # Housing Units | % Housing Units |
| Single Unit, Detached | 254 | 66.5% |
| Single Unit, Attached | 0 | 0.0% |
| 2 Unit Apartments | 14 | 3.7% |
| 3 or 4 Unit Apartments | 15 | 3.9% |
| 5 to 9 Unit Apartments | 32 | 8.4% |
| 10 or more Apartments | 0 | 0.0% |
| Mobile Home / Other | 67 | 17.5% |
| Total | 382 | 100.0% |
Housing Structures by Occupancy in Oakman
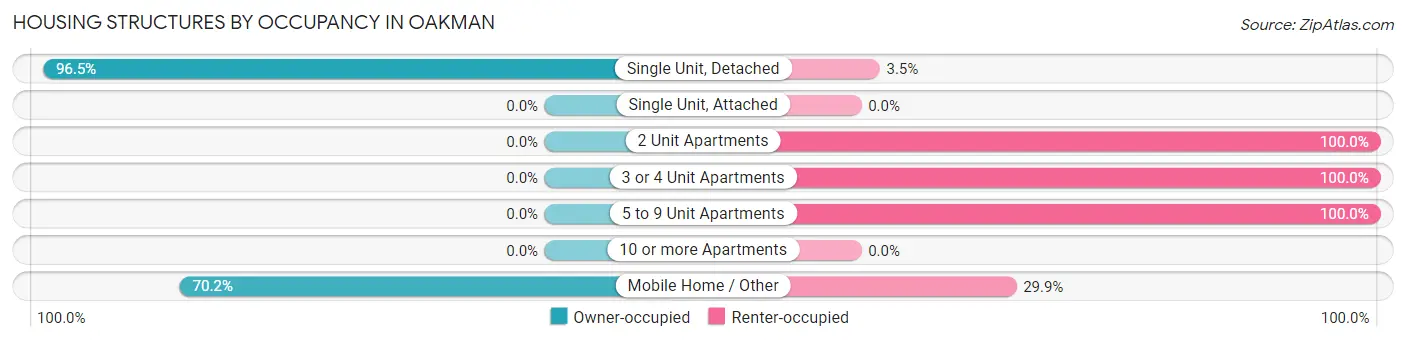
| Structure Type | Owner-occupied | Renter-occupied |
| Single Unit, Detached | 245 (96.5%) | 9 (3.5%) |
| Single Unit, Attached | 0 (0.0%) | 0 (0.0%) |
| 2 Unit Apartments | 0 (0.0%) | 14 (100.0%) |
| 3 or 4 Unit Apartments | 0 (0.0%) | 15 (100.0%) |
| 5 to 9 Unit Apartments | 0 (0.0%) | 32 (100.0%) |
| 10 or more Apartments | 0 (0.0%) | 0 (0.0%) |
| Mobile Home / Other | 47 (70.2%) | 20 (29.8%) |
| Total | 292 (76.4%) | 90 (23.6%) |
Housing Structures by Number of Rooms in Oakman
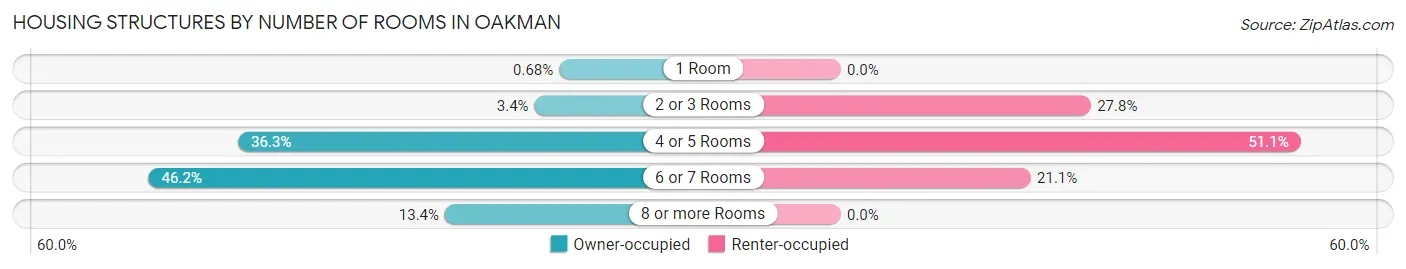
| Number of Rooms | Owner-occupied | Renter-occupied |
| 1 Room | 2 (0.7%) | 0 (0.0%) |
| 2 or 3 Rooms | 10 (3.4%) | 25 (27.8%) |
| 4 or 5 Rooms | 106 (36.3%) | 46 (51.1%) |
| 6 or 7 Rooms | 135 (46.2%) | 19 (21.1%) |
| 8 or more Rooms | 39 (13.4%) | 0 (0.0%) |
| Total | 292 (100.0%) | 90 (100.0%) |
Housing Structure by Heating Type in Oakman

| Heating Type | Owner-occupied | Renter-occupied |
| Utility Gas | 21 (7.2%) | 8 (8.9%) |
| Bottled, Tank, or LP Gas | 3 (1.0%) | 0 (0.0%) |
| Electricity | 260 (89.0%) | 82 (91.1%) |
| Fuel Oil or Kerosene | 0 (0.0%) | 0 (0.0%) |
| Coal or Coke | 0 (0.0%) | 0 (0.0%) |
| All other Fuels | 8 (2.7%) | 0 (0.0%) |
| No Fuel Used | 0 (0.0%) | 0 (0.0%) |
| Total | 292 (100.0%) | 90 (100.0%) |
Household Vehicle Usage in Oakman
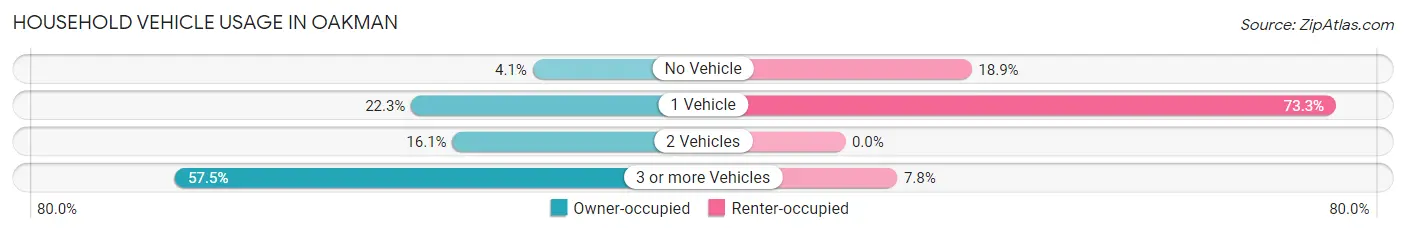
| Vehicles per Household | Owner-occupied | Renter-occupied |
| No Vehicle | 12 (4.1%) | 17 (18.9%) |
| 1 Vehicle | 65 (22.3%) | 66 (73.3%) |
| 2 Vehicles | 47 (16.1%) | 0 (0.0%) |
| 3 or more Vehicles | 168 (57.5%) | 7 (7.8%) |
| Total | 292 (100.0%) | 90 (100.0%) |
Real Estate & Mortgages in Oakman
Real Estate and Mortgage Overview in Oakman
| Characteristic | Without Mortgage | With Mortgage |
| Housing Units | 110 | 182 |
| Median Property Value | $74,000 | $0 |
| Median Household Income | $38,214 | $4 |
| Monthly Housing Costs | $386 | $0 |
| Real Estate Taxes | $199 | $86 |
Property Value by Mortgage Status in Oakman
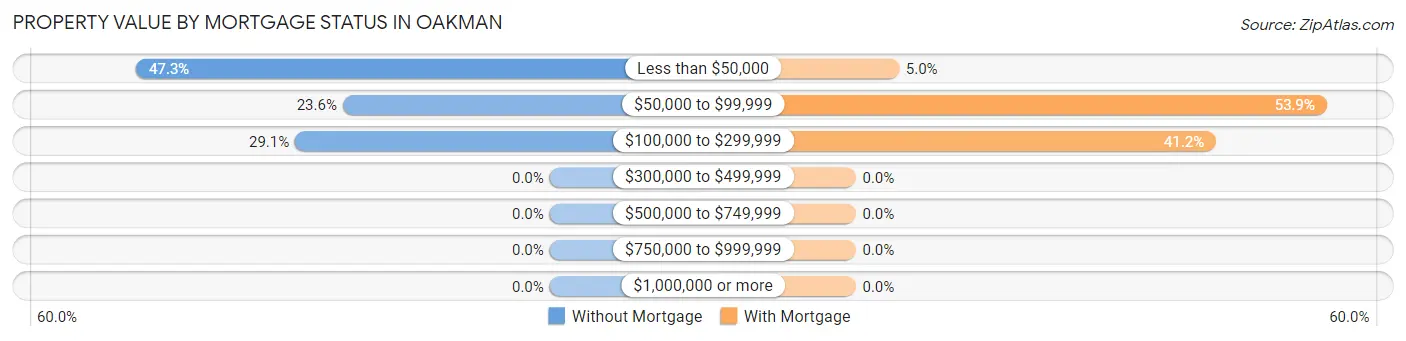
| Property Value | Without Mortgage | With Mortgage |
| Less than $50,000 | 52 (47.3%) | 9 (5.0%) |
| $50,000 to $99,999 | 26 (23.6%) | 98 (53.8%) |
| $100,000 to $299,999 | 32 (29.1%) | 75 (41.2%) |
| $300,000 to $499,999 | 0 (0.0%) | 0 (0.0%) |
| $500,000 to $749,999 | 0 (0.0%) | 0 (0.0%) |
| $750,000 to $999,999 | 0 (0.0%) | 0 (0.0%) |
| $1,000,000 or more | 0 (0.0%) | 0 (0.0%) |
| Total | 110 (100.0%) | 182 (100.0%) |
Household Income by Mortgage Status in Oakman
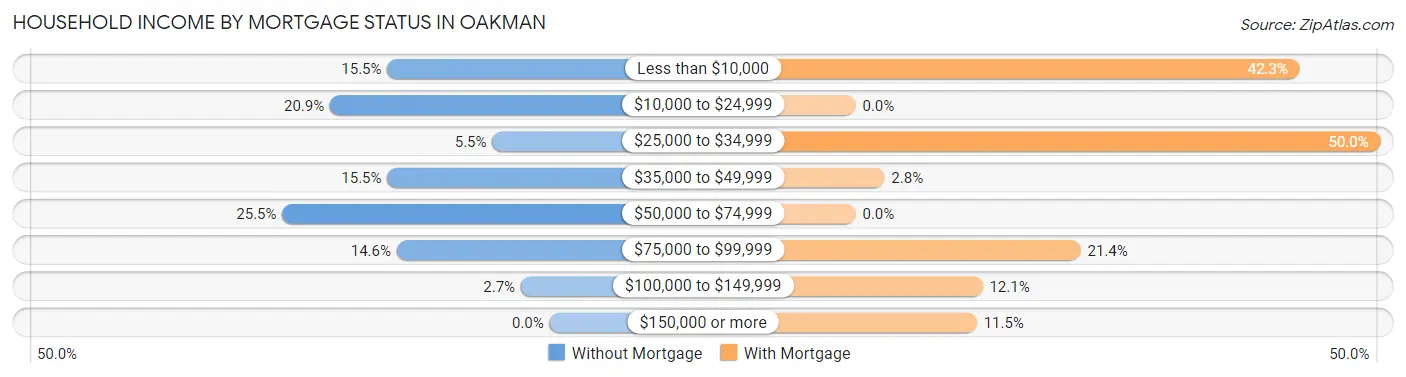
| Household Income | Without Mortgage | With Mortgage |
| Less than $10,000 | 17 (15.4%) | 77 (42.3%) |
| $10,000 to $24,999 | 23 (20.9%) | 0 (0.0%) |
| $25,000 to $34,999 | 6 (5.4%) | 91 (50.0%) |
| $35,000 to $49,999 | 17 (15.4%) | 5 (2.8%) |
| $50,000 to $74,999 | 28 (25.5%) | 0 (0.0%) |
| $75,000 to $99,999 | 16 (14.5%) | 39 (21.4%) |
| $100,000 to $149,999 | 3 (2.7%) | 22 (12.1%) |
| $150,000 or more | 0 (0.0%) | 21 (11.5%) |
| Total | 110 (100.0%) | 182 (100.0%) |
Property Value to Household Income Ratio in Oakman
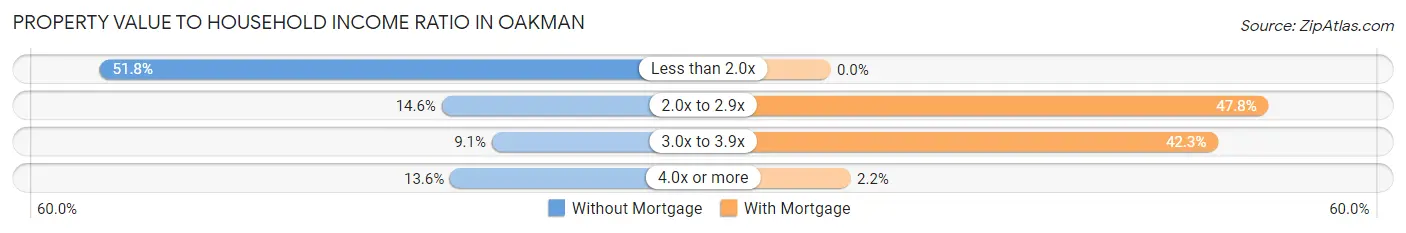
| Value-to-Income Ratio | Without Mortgage | With Mortgage |
| Less than 2.0x | 57 (51.8%) | 0 (0.0%) |
| 2.0x to 2.9x | 16 (14.5%) | 87 (47.8%) |
| 3.0x to 3.9x | 10 (9.1%) | 77 (42.3%) |
| 4.0x or more | 15 (13.6%) | 4 (2.2%) |
| Total | 110 (100.0%) | 182 (100.0%) |
Real Estate Taxes by Mortgage Status in Oakman
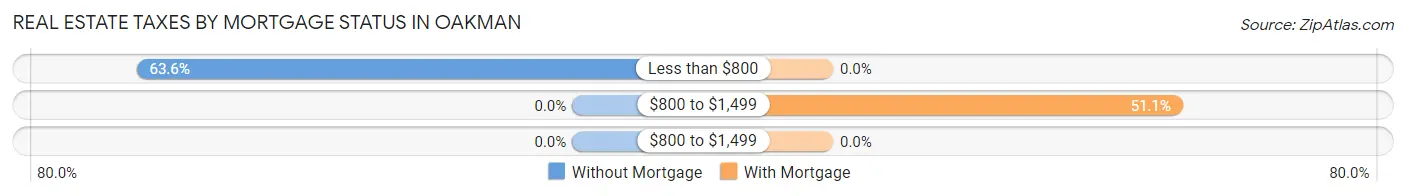
| Property Taxes | Without Mortgage | With Mortgage |
| Less than $800 | 70 (63.6%) | 0 (0.0%) |
| $800 to $1,499 | 0 (0.0%) | 93 (51.1%) |
| $800 to $1,499 | 0 (0.0%) | 0 (0.0%) |
| Total | 110 (100.0%) | 182 (100.0%) |
Health & Disability in Oakman
Health Insurance Coverage by Age in Oakman
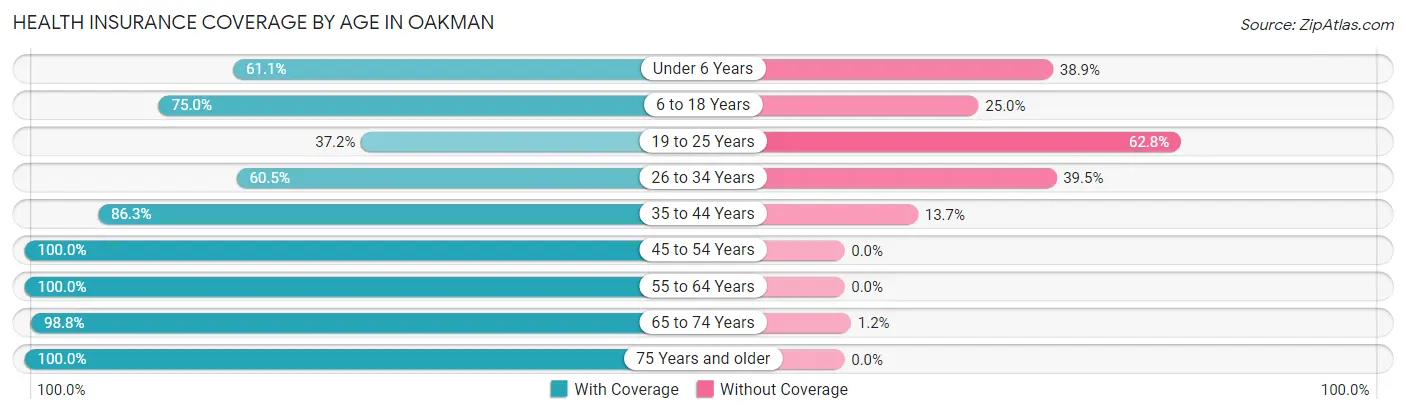
| Age Bracket | With Coverage | Without Coverage |
| Under 6 Years | 55 (61.1%) | 35 (38.9%) |
| 6 to 18 Years | 129 (75.0%) | 43 (25.0%) |
| 19 to 25 Years | 16 (37.2%) | 27 (62.8%) |
| 26 to 34 Years | 75 (60.5%) | 49 (39.5%) |
| 35 to 44 Years | 63 (86.3%) | 10 (13.7%) |
| 45 to 54 Years | 67 (100.0%) | 0 (0.0%) |
| 55 to 64 Years | 79 (100.0%) | 0 (0.0%) |
| 65 to 74 Years | 81 (98.8%) | 1 (1.2%) |
| 75 Years and older | 168 (100.0%) | 0 (0.0%) |
| Total | 733 (81.6%) | 165 (18.4%) |
Health Insurance Coverage by Citizenship Status in Oakman
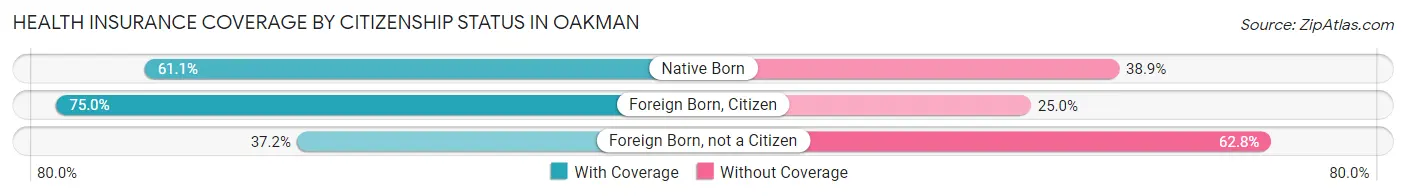
| Citizenship Status | With Coverage | Without Coverage |
| Native Born | 55 (61.1%) | 35 (38.9%) |
| Foreign Born, Citizen | 129 (75.0%) | 43 (25.0%) |
| Foreign Born, not a Citizen | 16 (37.2%) | 27 (62.8%) |
Health Insurance Coverage by Household Income in Oakman
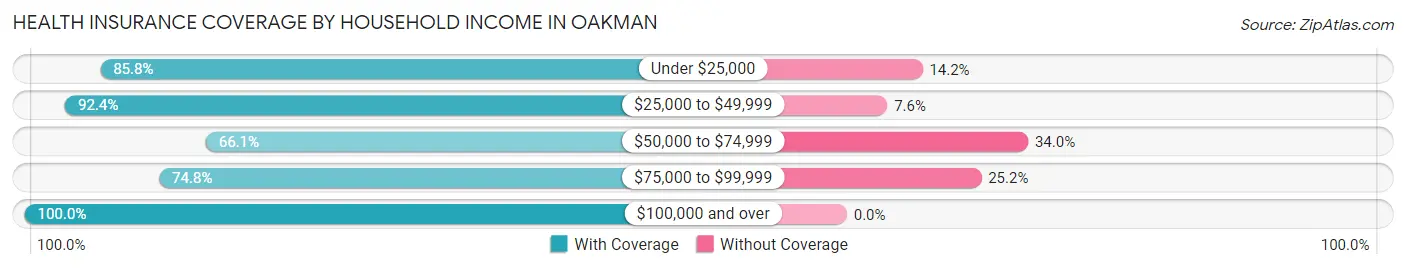
| Household Income | With Coverage | Without Coverage |
| Under $25,000 | 327 (85.8%) | 54 (14.2%) |
| $25,000 to $49,999 | 61 (92.4%) | 5 (7.6%) |
| $50,000 to $74,999 | 142 (66.0%) | 73 (34.0%) |
| $75,000 to $99,999 | 98 (74.8%) | 33 (25.2%) |
| $100,000 and over | 105 (100.0%) | 0 (0.0%) |
Public vs Private Health Insurance Coverage by Age in Oakman
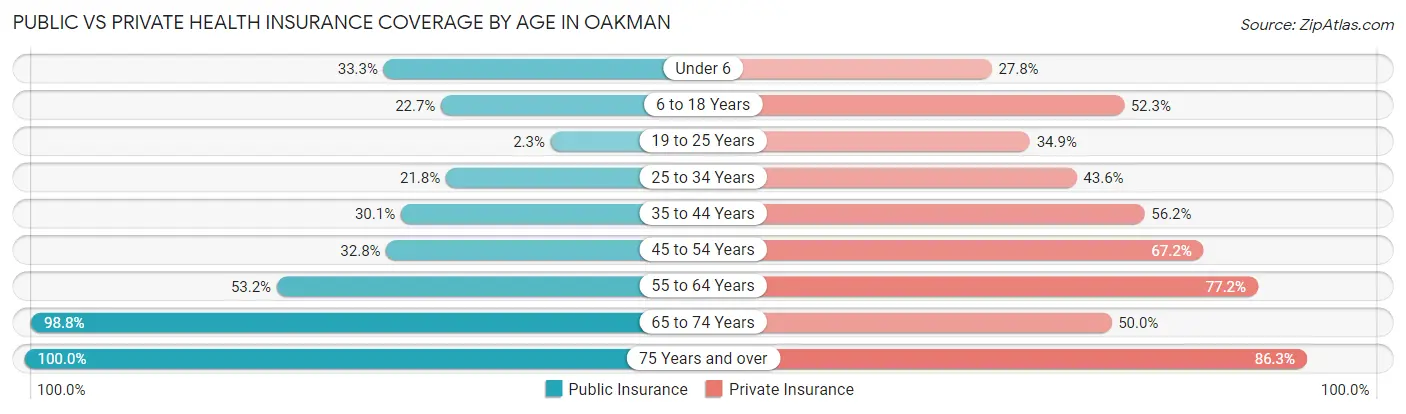
| Age Bracket | Public Insurance | Private Insurance |
| Under 6 | 30 (33.3%) | 25 (27.8%) |
| 6 to 18 Years | 39 (22.7%) | 90 (52.3%) |
| 19 to 25 Years | 1 (2.3%) | 15 (34.9%) |
| 25 to 34 Years | 27 (21.8%) | 54 (43.5%) |
| 35 to 44 Years | 22 (30.1%) | 41 (56.2%) |
| 45 to 54 Years | 22 (32.8%) | 45 (67.2%) |
| 55 to 64 Years | 42 (53.2%) | 61 (77.2%) |
| 65 to 74 Years | 81 (98.8%) | 41 (50.0%) |
| 75 Years and over | 168 (100.0%) | 145 (86.3%) |
| Total | 432 (48.1%) | 517 (57.6%) |
Disability Status by Sex by Age in Oakman
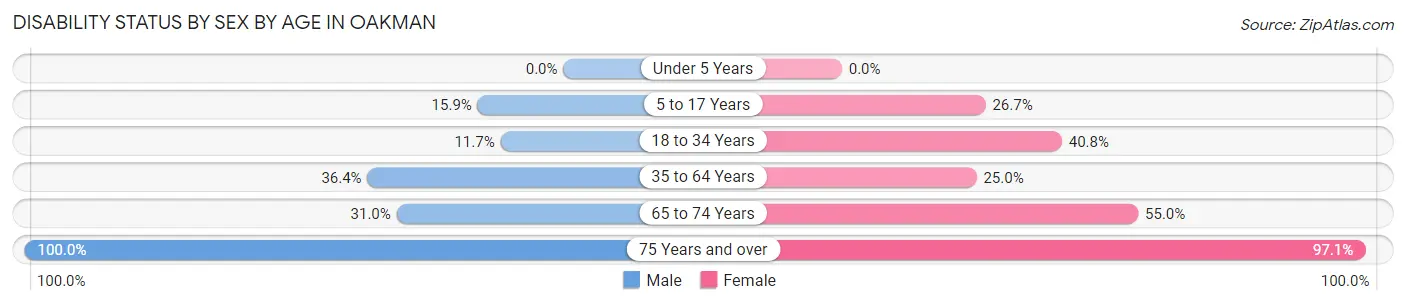
| Age Bracket | Male | Female |
| Under 5 Years | 0 (0.0%) | 0 (0.0%) |
| 5 to 17 Years | 21 (15.9%) | 8 (26.7%) |
| 18 to 34 Years | 7 (11.7%) | 49 (40.8%) |
| 35 to 64 Years | 36 (36.4%) | 30 (25.0%) |
| 65 to 74 Years | 13 (30.9%) | 22 (55.0%) |
| 75 Years and over | 64 (100.0%) | 101 (97.1%) |
Disability Class by Sex by Age in Oakman
Disability Class: Hearing Difficulty
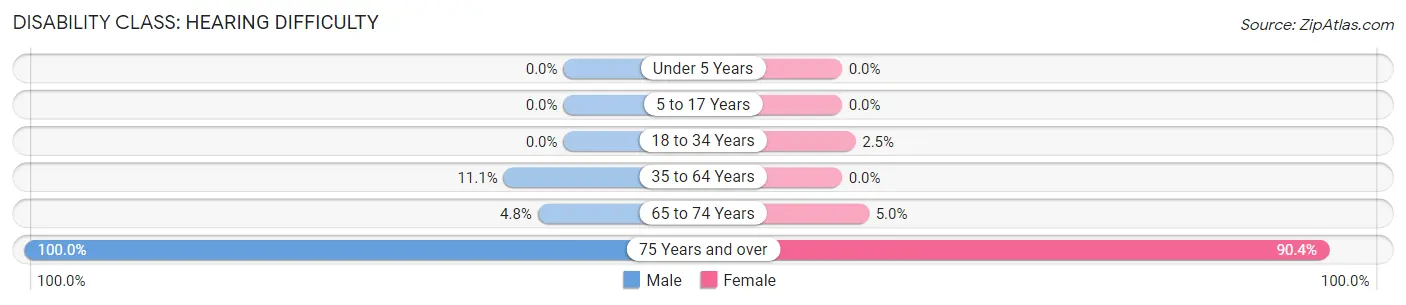
| Age Bracket | Male | Female |
| Under 5 Years | 0 (0.0%) | 0 (0.0%) |
| 5 to 17 Years | 0 (0.0%) | 0 (0.0%) |
| 18 to 34 Years | 0 (0.0%) | 3 (2.5%) |
| 35 to 64 Years | 11 (11.1%) | 0 (0.0%) |
| 65 to 74 Years | 2 (4.8%) | 2 (5.0%) |
| 75 Years and over | 64 (100.0%) | 94 (90.4%) |
Disability Class: Vision Difficulty
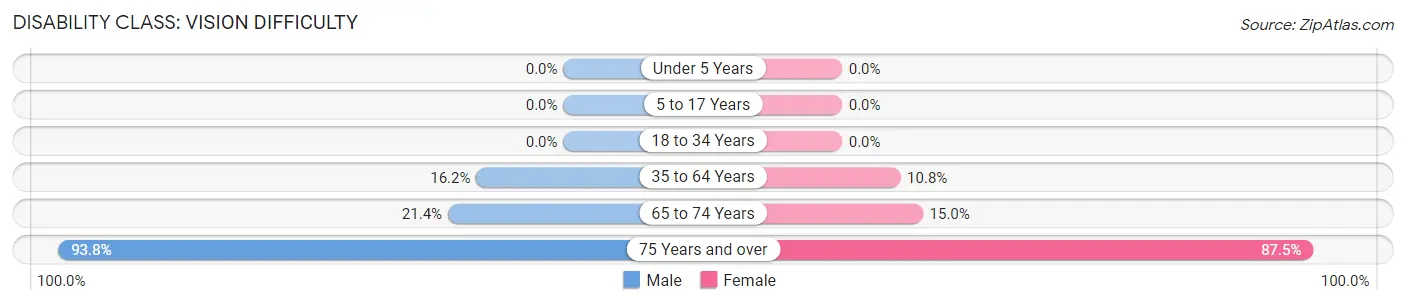
| Age Bracket | Male | Female |
| Under 5 Years | 0 (0.0%) | 0 (0.0%) |
| 5 to 17 Years | 0 (0.0%) | 0 (0.0%) |
| 18 to 34 Years | 0 (0.0%) | 0 (0.0%) |
| 35 to 64 Years | 16 (16.2%) | 13 (10.8%) |
| 65 to 74 Years | 9 (21.4%) | 6 (15.0%) |
| 75 Years and over | 60 (93.8%) | 91 (87.5%) |
Disability Class: Cognitive Difficulty
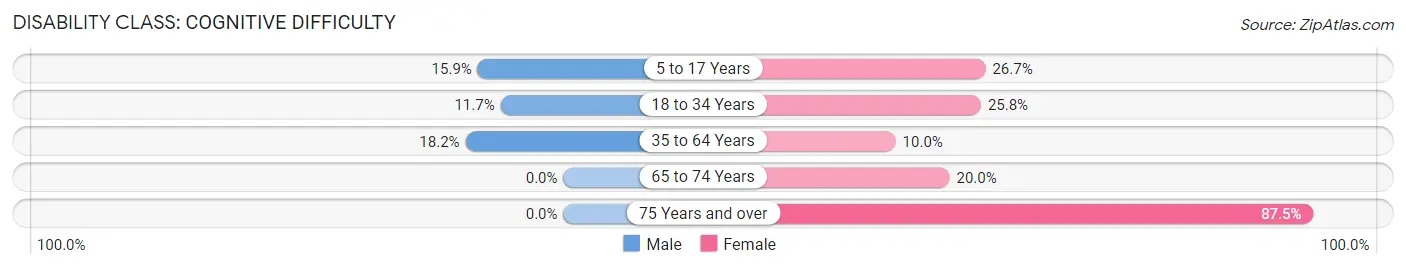
| Age Bracket | Male | Female |
| 5 to 17 Years | 21 (15.9%) | 8 (26.7%) |
| 18 to 34 Years | 7 (11.7%) | 31 (25.8%) |
| 35 to 64 Years | 18 (18.2%) | 12 (10.0%) |
| 65 to 74 Years | 0 (0.0%) | 8 (20.0%) |
| 75 Years and over | 0 (0.0%) | 91 (87.5%) |
Disability Class: Ambulatory Difficulty
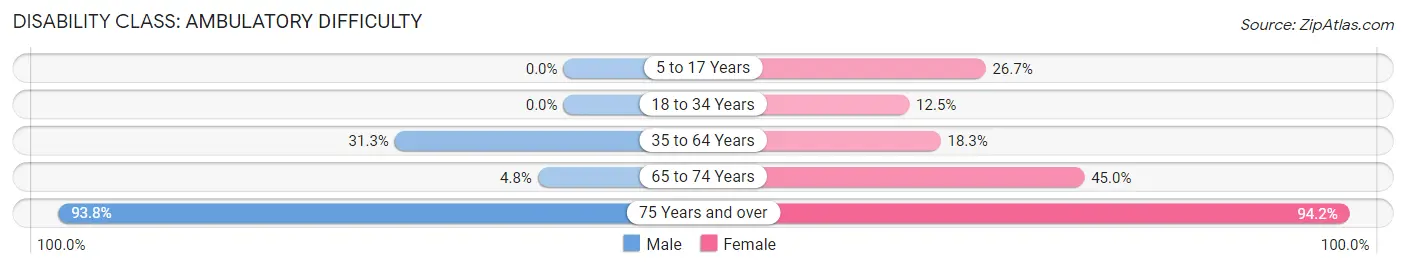
| Age Bracket | Male | Female |
| 5 to 17 Years | 0 (0.0%) | 8 (26.7%) |
| 18 to 34 Years | 0 (0.0%) | 15 (12.5%) |
| 35 to 64 Years | 31 (31.3%) | 22 (18.3%) |
| 65 to 74 Years | 2 (4.8%) | 18 (45.0%) |
| 75 Years and over | 60 (93.8%) | 98 (94.2%) |
Disability Class: Self-Care Difficulty
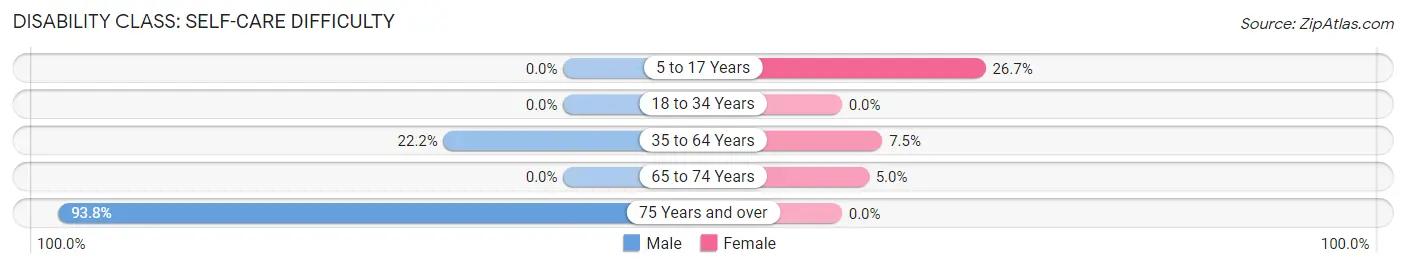
| Age Bracket | Male | Female |
| 5 to 17 Years | 0 (0.0%) | 8 (26.7%) |
| 18 to 34 Years | 0 (0.0%) | 0 (0.0%) |
| 35 to 64 Years | 22 (22.2%) | 9 (7.5%) |
| 65 to 74 Years | 0 (0.0%) | 2 (5.0%) |
| 75 Years and over | 60 (93.8%) | 0 (0.0%) |
Technology Access in Oakman
Computing Device Access in Oakman
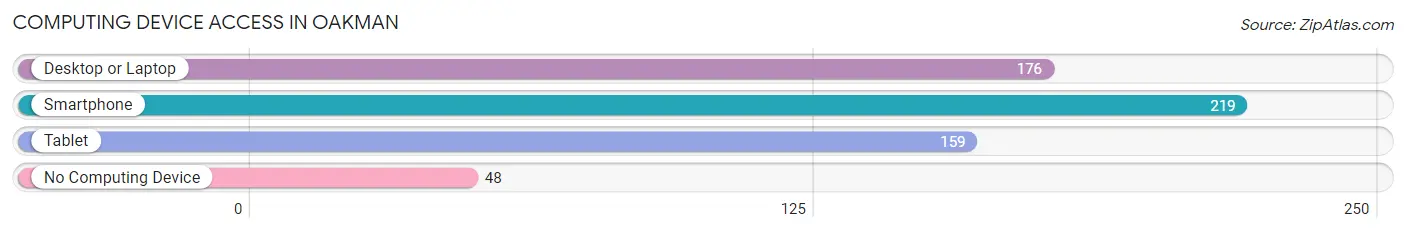
| Device Type | # Households | % Households |
| Desktop or Laptop | 176 | 46.1% |
| Smartphone | 219 | 57.3% |
| Tablet | 159 | 41.6% |
| No Computing Device | 48 | 12.6% |
| Total | 382 | 100.0% |
Internet Access in Oakman
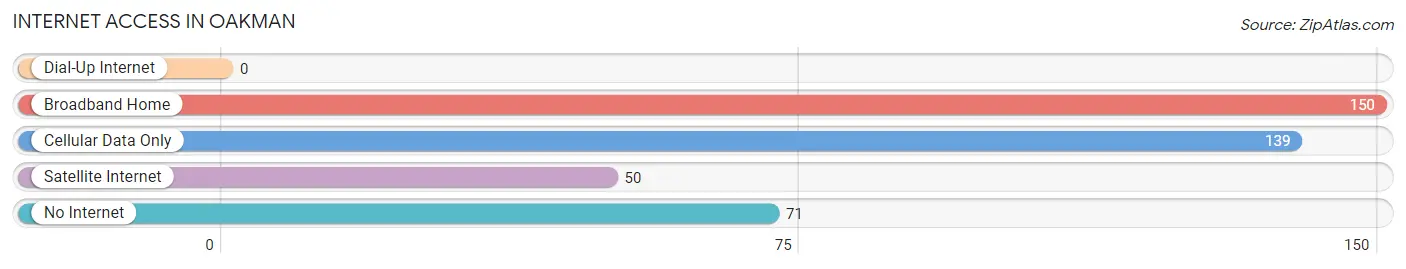
| Internet Type | # Households | % Households |
| Dial-Up Internet | 0 | 0.0% |
| Broadband Home | 150 | 39.3% |
| Cellular Data Only | 139 | 36.4% |
| Satellite Internet | 50 | 13.1% |
| No Internet | 71 | 18.6% |
| Total | 382 | 100.0% |
Oakman Summary
Oakman is a small town located in Walker County, Alabama. It is situated in the northwest corner of the county, approximately 20 miles from the city of Jasper. The town was founded in 1887 and was named after the Oakman family, who were early settlers in the area. The population of Oakman was 1,072 at the time of the 2010 census.
Geography
Oakman is located at 33°59'N 87°25'W (33.983, -87.417). It is situated in the northwest corner of Walker County, approximately 20 miles from the city of Jasper. The town is located in the foothills of the Appalachian Mountains and is surrounded by rolling hills and forests. The town is situated on the banks of the Mulberry Fork of the Black Warrior River.
The climate in Oakman is humid subtropical, with hot, humid summers and mild winters. The average annual temperature is 64°F (18°C), with an average high of 87°F (31°C) in July and an average low of 41°F (5°C) in January. The average annual precipitation is 56 inches (142 cm).
Economy
Oakman’s economy is largely based on agriculture and forestry. The town is home to several small farms, which produce a variety of crops, including corn, soybeans, cotton, and hay. The town is also home to several timber companies, which harvest timber from the surrounding forests.
The town is also home to several small businesses, including a grocery store, a hardware store, a pharmacy, and a few restaurants. The town also has a post office and a bank.
Demographics
At the time of the 2010 census, the population of Oakman was 1,072. The racial makeup of the town was 97.2% White, 0.9% African American, 0.3% Native American, 0.2% Asian, 0.1% from other races, and 1.3% from two or more races. Hispanic or Latino of any race were 0.7% of the population.
The median income for a household in Oakman was $30,938, and the median income for a family was $37,500. The per capita income for the town was $15,945. About 17.2% of families and 20.2% of the population were below the poverty line, including 28.3% of those under age 18 and 11.2% of those age 65 or over.
Education
Oakman is served by the Walker County School District. The town is home to Oakman Elementary School, which serves students in grades K-5. Students in grades 6-12 attend Oakman High School. The town also has a public library, which is part of the Walker County Library System.
Conclusion
Oakman is a small town located in Walker County, Alabama. It is situated in the northwest corner of the county, approximately 20 miles from the city of Jasper. The town was founded in 1887 and was named after the Oakman family, who were early settlers in the area. The population of Oakman was 1,072 at the time of the 2010 census. The town’s economy is largely based on agriculture and forestry, and it is home to several small businesses. The racial makeup of the town is predominantly White, with a small percentage of African American, Native American, and Asian residents. The town is served by the Walker County School District and has a public library.
Common Questions
What is Per Capita Income in Oakman?
Per Capita income in Oakman is $17,795.
What is the Median Household income in Oakman?
Median Household Income in Oakman is $24,578.
What is Income or Wage Gap in Oakman?
Income or Wage Gap in Oakman is 52.2%.
Women in Oakman earn 47.8 cents for every dollar earned by a man.
What is Inequality or Gini Index in Oakman?
Inequality or Gini Index in Oakman is 0.46.
What is the Total Population of Oakman?
Total Population of Oakman is 898.
What is the Total Male Population of Oakman?
Total Male Population of Oakman is 434.
What is the Total Female Population of Oakman?
Total Female Population of Oakman is 464.
What is the Ratio of Males per 100 Females in Oakman?
There are 93.53 Males per 100 Females in Oakman.
What is the Ratio of Females per 100 Males in Oakman?
There are 106.91 Females per 100 Males in Oakman.
What is the Median Population Age in Oakman?
Median Population Age in Oakman is 38.7 Years.
What is the Average Family Size in Oakman
Average Family Size in Oakman is 2.7 People.
What is the Average Household Size in Oakman
Average Household Size in Oakman is 2.4 People.
How Large is the Labor Force in Oakman?
There are 265 People in the Labor Forcein in Oakman.
What is the Percentage of People in the Labor Force in Oakman?
39.6% of People are in the Labor Force in Oakman.
What is the Unemployment Rate in Oakman?
Unemployment Rate in Oakman is 7.9%.