Tuskegee, AL Map & Demographics
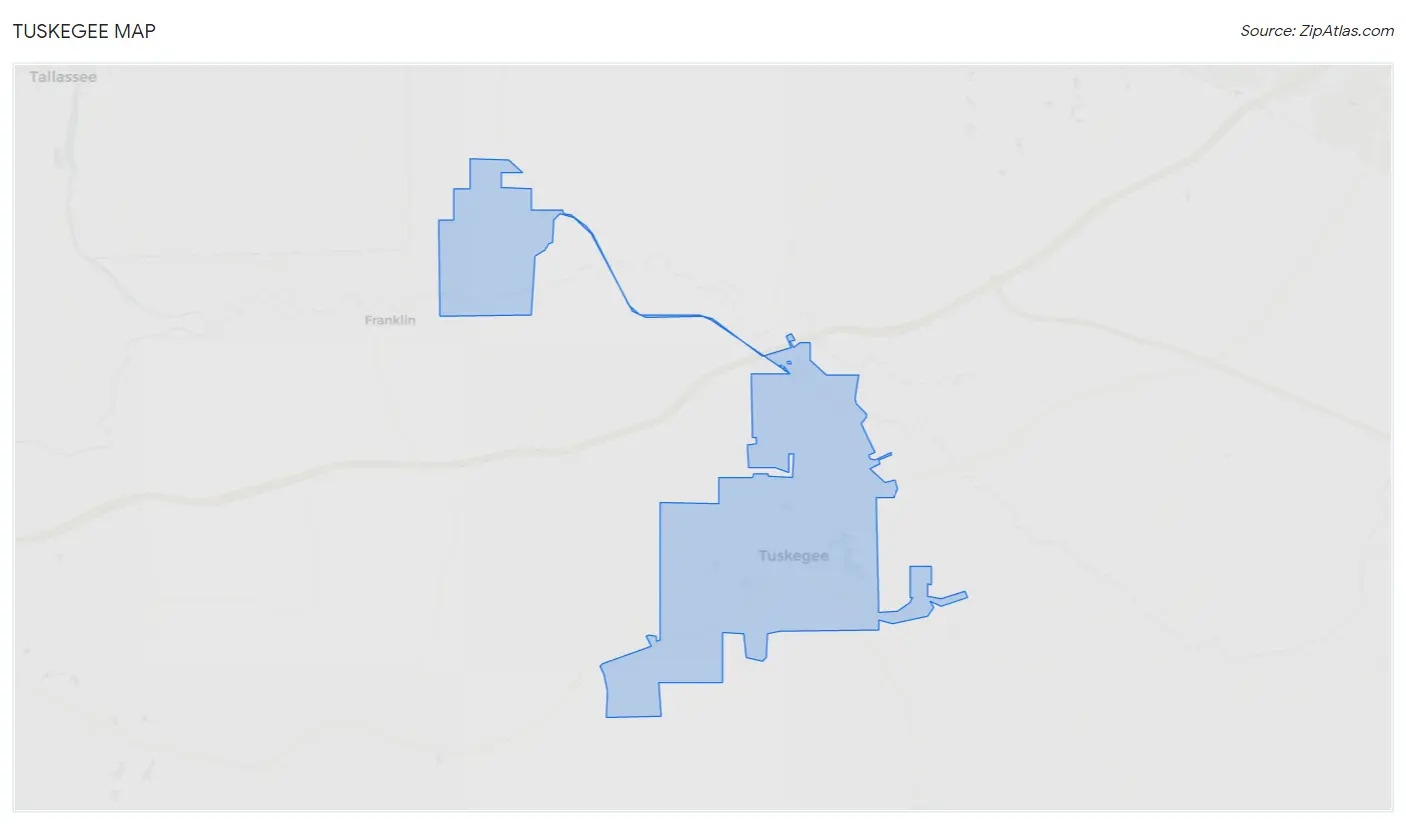
Tuskegee Map
Tuskegee Overview
$18,922
PER CAPITA INCOME
$47,841
AVG FAMILY INCOME
$32,449
AVG HOUSEHOLD INCOME
50.2%
WAGE / INCOME GAP [ % ]
49.8¢/ $1
WAGE / INCOME GAP [ $ ]
$11,622
FAMILY INCOME DEFICIT
0.54
INEQUALITY / GINI INDEX
9,173
TOTAL POPULATION
3,803
MALE POPULATION
5,370
FEMALE POPULATION
70.82
MALES / 100 FEMALES
141.20
FEMALES / 100 MALES
24.5
MEDIAN AGE
2.7
AVG FAMILY SIZE
2.1
AVG HOUSEHOLD SIZE
3,821
LABOR FORCE [ PEOPLE ]
48.1%
PERCENT IN LABOR FORCE
11.3%
UNEMPLOYMENT RATE
Tuskegee Zip Codes
Tuskegee Area Codes
Income in Tuskegee
Income Overview in Tuskegee
Per Capita Income in Tuskegee is $18,922, while median incomes of families and households are $47,841 and $32,449 respectively.
| Characteristic | Number | Measure |
| Per Capita Income | 9,173 | $18,922 |
| Median Family Income | 1,815 | $47,841 |
| Mean Family Income | 1,815 | $67,629 |
| Median Household Income | 3,150 | $32,449 |
| Mean Household Income | 3,150 | $52,676 |
| Income Deficit | 1,815 | $11,622 |
| Wage / Income Gap (%) | 9,173 | 50.17% |
| Wage / Income Gap ($) | 9,173 | 49.83¢ per $1 |
| Gini / Inequality Index | 9,173 | 0.54 |
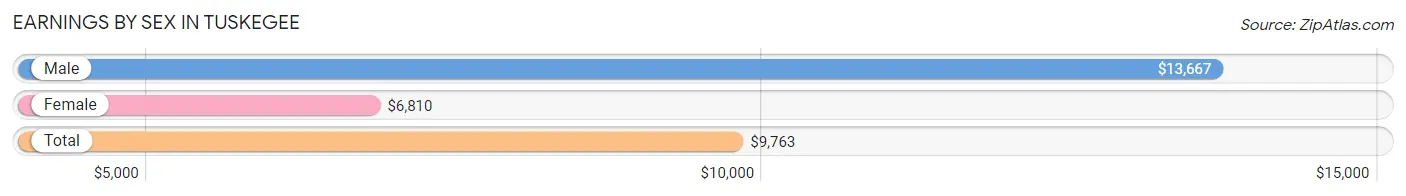
Earnings by Sex in Tuskegee
Average Earnings in Tuskegee are $9,763, $13,667 for men and $6,810 for women, a difference of 50.2%.
| Sex | Number | Average Earnings |
| Male | 1,914 (41.2%) | $13,667 |
| Female | 2,734 (58.8%) | $6,810 |
| Total | 4,648 (100.0%) | $9,763 |
Earnings by Sex by Income Bracket in Tuskegee
The most common earnings brackets in Tuskegee are $2,499 or less for men (343 | 17.9%) and $2,499 or less for women (657 | 24.0%).
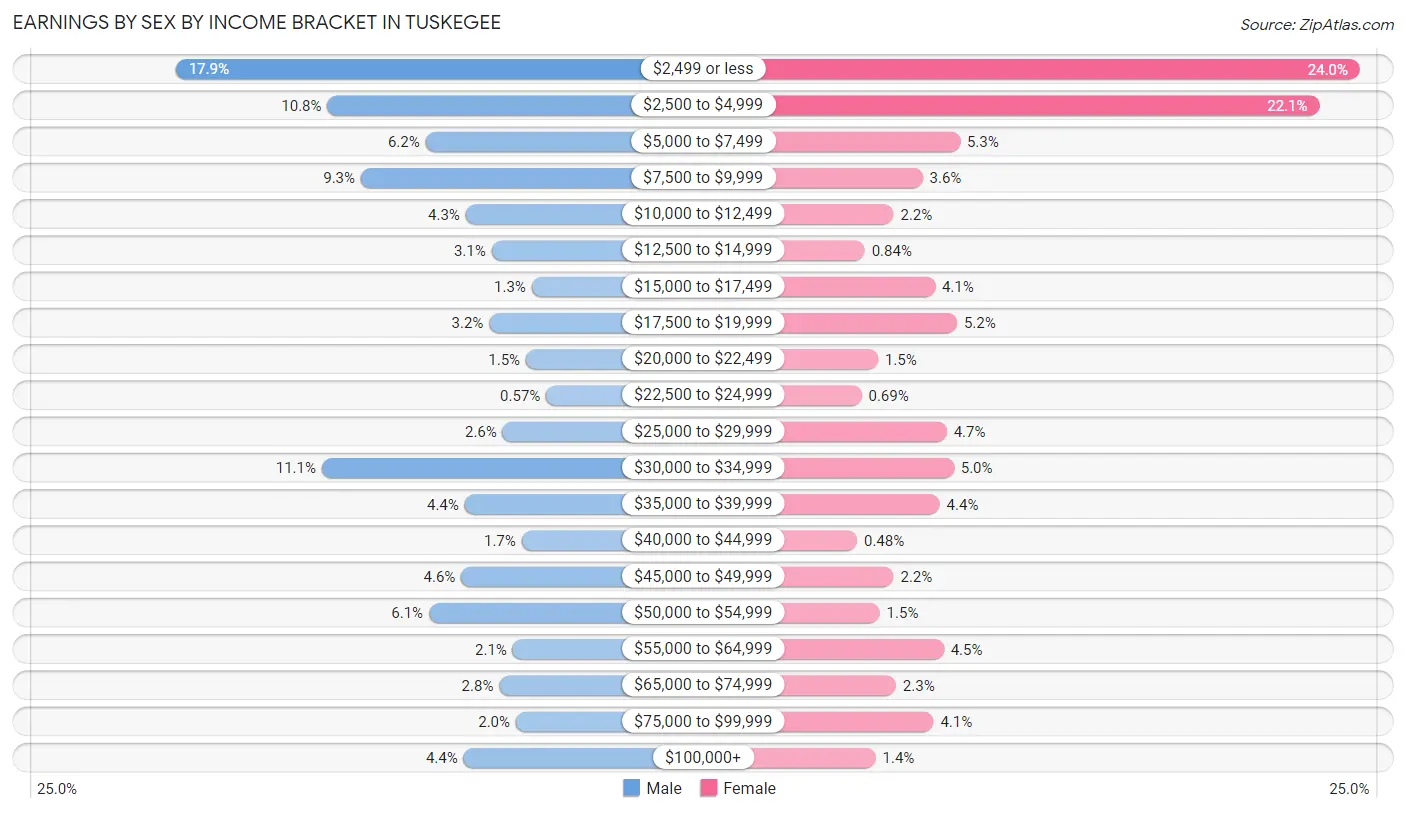
| Income | Male | Female |
| $2,499 or less | 343 (17.9%) | 657 (24.0%) |
| $2,500 to $4,999 | 207 (10.8%) | 605 (22.1%) |
| $5,000 to $7,499 | 119 (6.2%) | 145 (5.3%) |
| $7,500 to $9,999 | 177 (9.2%) | 97 (3.5%) |
| $10,000 to $12,499 | 83 (4.3%) | 60 (2.2%) |
| $12,500 to $14,999 | 60 (3.1%) | 23 (0.8%) |
| $15,000 to $17,499 | 24 (1.3%) | 113 (4.1%) |
| $17,500 to $19,999 | 62 (3.2%) | 141 (5.2%) |
| $20,000 to $22,499 | 29 (1.5%) | 40 (1.5%) |
| $22,500 to $24,999 | 11 (0.6%) | 19 (0.7%) |
| $25,000 to $29,999 | 50 (2.6%) | 128 (4.7%) |
| $30,000 to $34,999 | 212 (11.1%) | 137 (5.0%) |
| $35,000 to $39,999 | 84 (4.4%) | 119 (4.3%) |
| $40,000 to $44,999 | 33 (1.7%) | 13 (0.5%) |
| $45,000 to $49,999 | 87 (4.5%) | 60 (2.2%) |
| $50,000 to $54,999 | 116 (6.1%) | 42 (1.5%) |
| $55,000 to $64,999 | 41 (2.1%) | 124 (4.5%) |
| $65,000 to $74,999 | 53 (2.8%) | 63 (2.3%) |
| $75,000 to $99,999 | 38 (2.0%) | 111 (4.1%) |
| $100,000+ | 85 (4.4%) | 37 (1.3%) |
| Total | 1,914 (100.0%) | 2,734 (100.0%) |
Earnings by Sex by Educational Attainment in Tuskegee
Average earnings in Tuskegee are $34,782 for men and $32,969 for women, a difference of 5.2%. Men with an educational attainment of bachelor's degree enjoy the highest average annual earnings of $52,443, while those with less than high school education earn the least with $2,499. Women with an educational attainment of graduate degree earn the most with the average annual earnings of $62,039, while those with high school diploma education have the smallest earnings of $18,478.
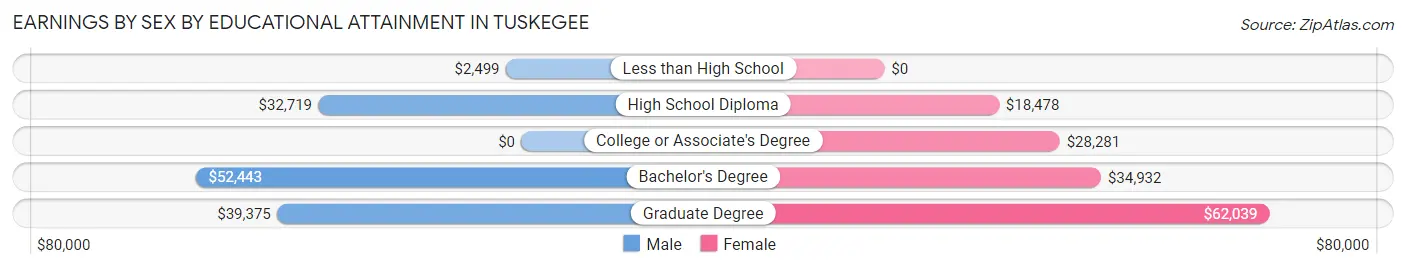
| Educational Attainment | Male Income | Female Income |
| Less than High School | $2,499 | $0 |
| High School Diploma | $32,719 | $18,478 |
| College or Associate's Degree | - | - |
| Bachelor's Degree | $52,443 | $34,932 |
| Graduate Degree | $39,375 | $62,039 |
| Total | $34,782 | $32,969 |
Family Income in Tuskegee
Family Income Brackets in Tuskegee
According to the Tuskegee family income data, there are 323 families falling into the $50,000 to $74,999 income range, which is the most common income bracket and makes up 17.8% of all families. Conversely, the $150,000 to $199,999 income bracket is the least frequent group with only 47 families (2.6%) belonging to this category.
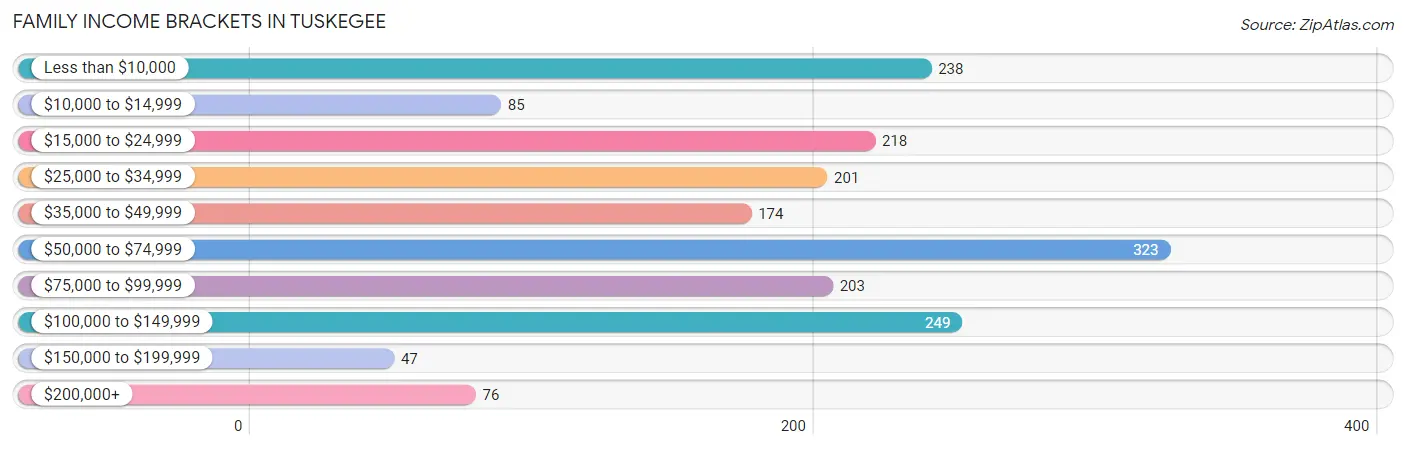
| Income Bracket | # Families | % Families |
| Less than $10,000 | 238 | 13.1% |
| $10,000 to $14,999 | 85 | 4.7% |
| $15,000 to $24,999 | 218 | 12.0% |
| $25,000 to $34,999 | 201 | 11.1% |
| $35,000 to $49,999 | 174 | 9.6% |
| $50,000 to $74,999 | 323 | 17.8% |
| $75,000 to $99,999 | 203 | 11.2% |
| $100,000 to $149,999 | 249 | 13.7% |
| $150,000 to $199,999 | 47 | 2.6% |
| $200,000+ | 76 | 4.2% |
Family Income by Famaliy Size in Tuskegee
7+ person families (27 | 1.5%) account for the highest median family income in Tuskegee with $97,969 per family, while 2-person families (1,061 | 58.5%) have the highest median income of $23,604 per family member.
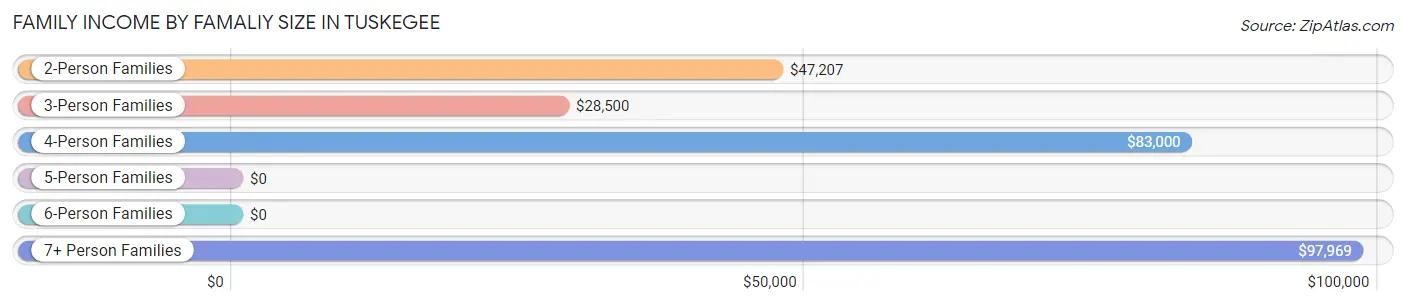
| Income Bracket | # Families | Median Income |
| 2-Person Families | 1,061 (58.5%) | $47,207 |
| 3-Person Families | 522 (28.8%) | $28,500 |
| 4-Person Families | 182 (10.0%) | $83,000 |
| 5-Person Families | 4 (0.2%) | $0 |
| 6-Person Families | 19 (1.1%) | $0 |
| 7+ Person Families | 27 (1.5%) | $97,969 |
| Total | 1,815 (100.0%) | $47,841 |
Family Income by Number of Earners in Tuskegee
The median family income in Tuskegee is $47,841, with families comprising 3+ earners (59) having the highest median family income of $98,281, while families with no earners (447) have the lowest median family income of $16,298, accounting for 3.3% and 24.6% of families, respectively.
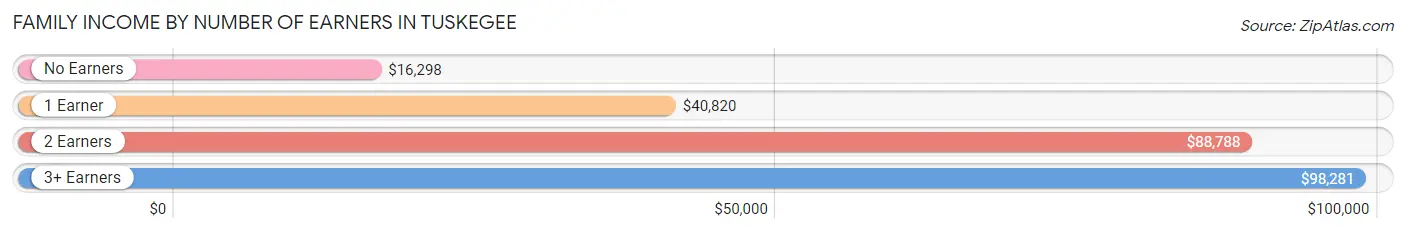
| Number of Earners | # Families | Median Income |
| No Earners | 447 (24.6%) | $16,298 |
| 1 Earner | 733 (40.4%) | $40,820 |
| 2 Earners | 576 (31.7%) | $88,788 |
| 3+ Earners | 59 (3.3%) | $98,281 |
| Total | 1,815 (100.0%) | $47,841 |
Household Income in Tuskegee
Household Income Brackets in Tuskegee
With 558 households falling in the category, the less than $10,000 income range is the most frequent in Tuskegee, accounting for 17.7% of all households. In contrast, only 54 households (1.7%) fall into the $150,000 to $199,999 income bracket, making it the least populous group.
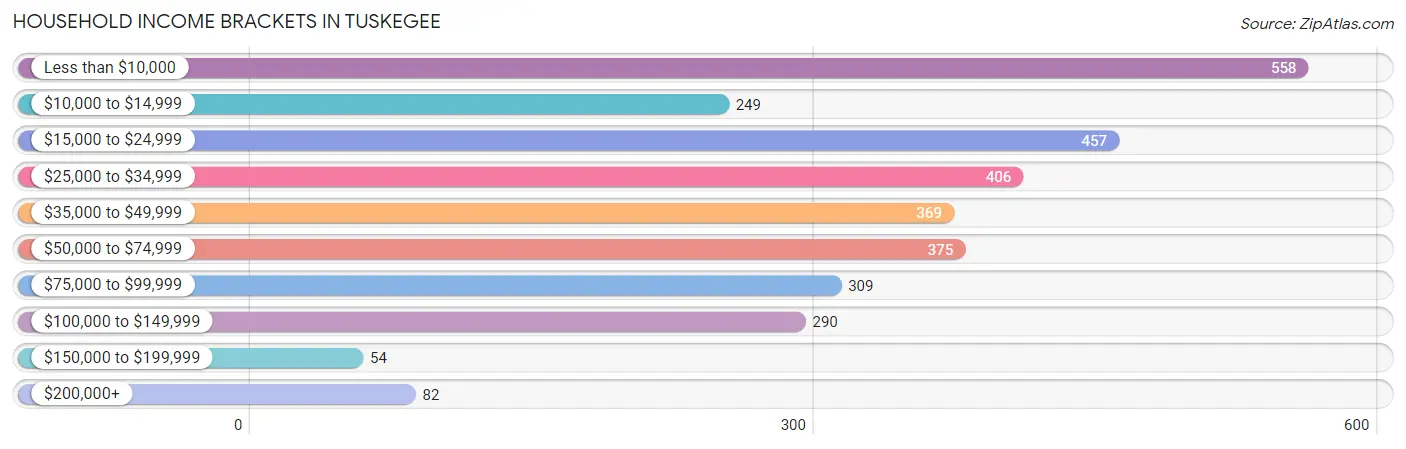
| Income Bracket | # Households | % Households |
| Less than $10,000 | 558 | 17.7% |
| $10,000 to $14,999 | 249 | 7.9% |
| $15,000 to $24,999 | 457 | 14.5% |
| $25,000 to $34,999 | 406 | 12.9% |
| $35,000 to $49,999 | 369 | 11.7% |
| $50,000 to $74,999 | 375 | 11.9% |
| $75,000 to $99,999 | 309 | 9.8% |
| $100,000 to $149,999 | 290 | 9.2% |
| $150,000 to $199,999 | 54 | 1.7% |
| $200,000+ | 82 | 2.6% |
Household Income by Householder Age in Tuskegee
The median household income in Tuskegee is $32,449, with the highest median household income of $45,875 found in the 45 to 64 years age bracket for the primary householder. A total of 1,091 households (34.6%) fall into this category. Meanwhile, the 15 to 24 years age bracket for the primary householder has the lowest median household income of $0, with 307 households (9.8%) in this group.
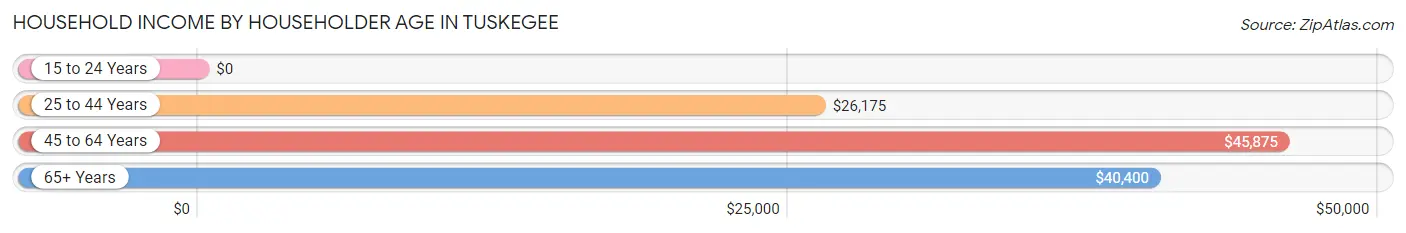
| Income Bracket | # Households | Median Income |
| 15 to 24 Years | 307 (9.8%) | $0 |
| 25 to 44 Years | 732 (23.2%) | $26,175 |
| 45 to 64 Years | 1,091 (34.6%) | $45,875 |
| 65+ Years | 1,020 (32.4%) | $40,400 |
| Total | 3,150 (100.0%) | $32,449 |
Poverty in Tuskegee
Income Below Poverty by Sex and Age in Tuskegee
With 32.9% poverty level for males and 30.7% for females among the residents of Tuskegee, 5 year old males and 18 to 24 year old females are the most vulnerable to poverty, with 19 males (100.0%) and 202 females (69.7%) in their respective age groups living below the poverty level.
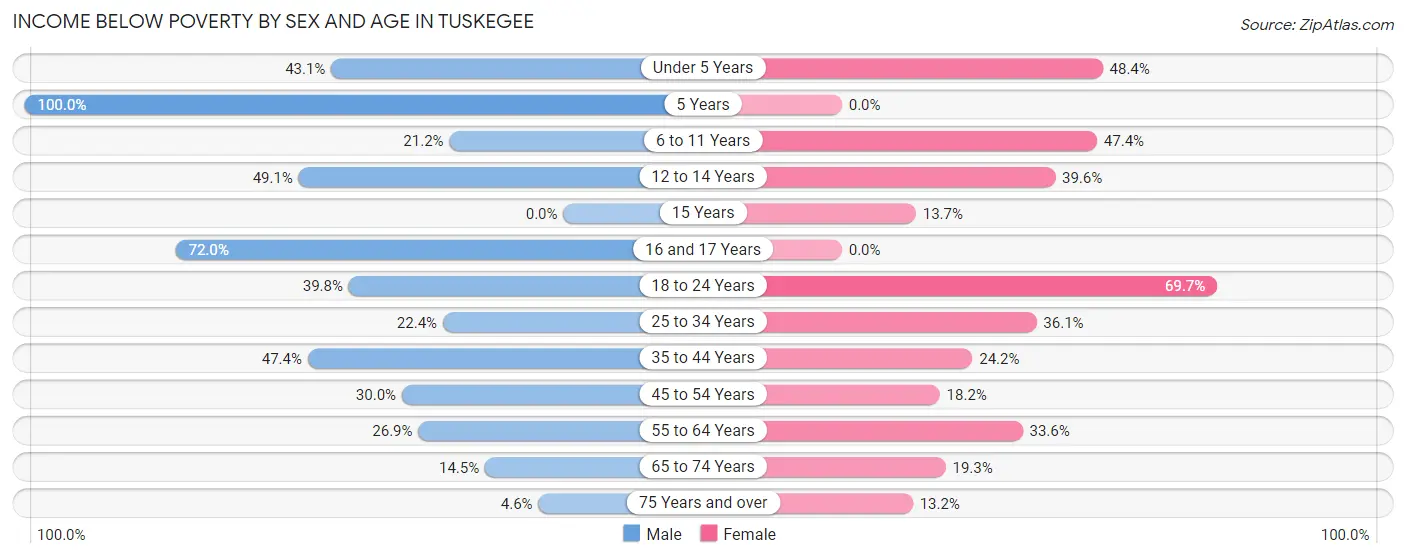
| Age Bracket | Male | Female |
| Under 5 Years | 106 (43.1%) | 61 (48.4%) |
| 5 Years | 19 (100.0%) | 0 (0.0%) |
| 6 to 11 Years | 33 (21.1%) | 134 (47.3%) |
| 12 to 14 Years | 56 (49.1%) | 57 (39.6%) |
| 15 Years | 0 (0.0%) | 7 (13.7%) |
| 16 and 17 Years | 95 (72.0%) | 0 (0.0%) |
| 18 to 24 Years | 223 (39.8%) | 202 (69.7%) |
| 25 to 34 Years | 74 (22.4%) | 177 (36.1%) |
| 35 to 44 Years | 129 (47.4%) | 86 (24.2%) |
| 45 to 54 Years | 95 (30.0%) | 79 (18.2%) |
| 55 to 64 Years | 102 (26.9%) | 154 (33.6%) |
| 65 to 74 Years | 52 (14.5%) | 89 (19.3%) |
| 75 Years and over | 6 (4.6%) | 55 (13.2%) |
| Total | 990 (32.9%) | 1,101 (30.7%) |
Income Above Poverty by Sex and Age in Tuskegee
According to the poverty statistics in Tuskegee, males aged 75 years and over and females aged 5 years are the age groups that are most secure financially, with 95.4% of males and 100.0% of females in these age groups living above the poverty line.
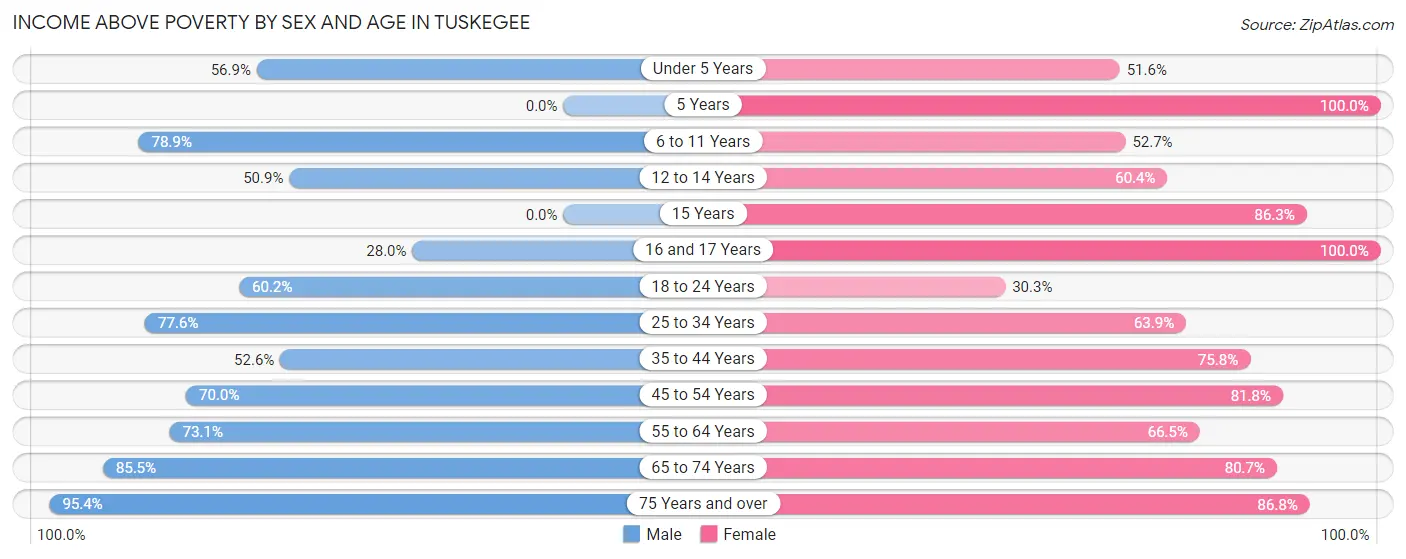
| Age Bracket | Male | Female |
| Under 5 Years | 140 (56.9%) | 65 (51.6%) |
| 5 Years | 0 (0.0%) | 24 (100.0%) |
| 6 to 11 Years | 123 (78.8%) | 149 (52.6%) |
| 12 to 14 Years | 58 (50.9%) | 87 (60.4%) |
| 15 Years | 0 (0.0%) | 44 (86.3%) |
| 16 and 17 Years | 37 (28.0%) | 52 (100.0%) |
| 18 to 24 Years | 337 (60.2%) | 88 (30.3%) |
| 25 to 34 Years | 257 (77.6%) | 313 (63.9%) |
| 35 to 44 Years | 143 (52.6%) | 269 (75.8%) |
| 45 to 54 Years | 222 (70.0%) | 356 (81.8%) |
| 55 to 64 Years | 277 (73.1%) | 305 (66.4%) |
| 65 to 74 Years | 306 (85.5%) | 373 (80.7%) |
| 75 Years and over | 124 (95.4%) | 363 (86.8%) |
| Total | 2,024 (67.1%) | 2,488 (69.3%) |
Income Below Poverty Among Married-Couple Families in Tuskegee
The poverty statistics for married-couple families in Tuskegee show that 11.9% or 72 of the total 607 families live below the poverty line. Families with 1 or 2 children have the highest poverty rate of 17.6%, comprising of 29 families. On the other hand, families with 3 or 4 children have the lowest poverty rate of 0.0%, which includes 0 families.
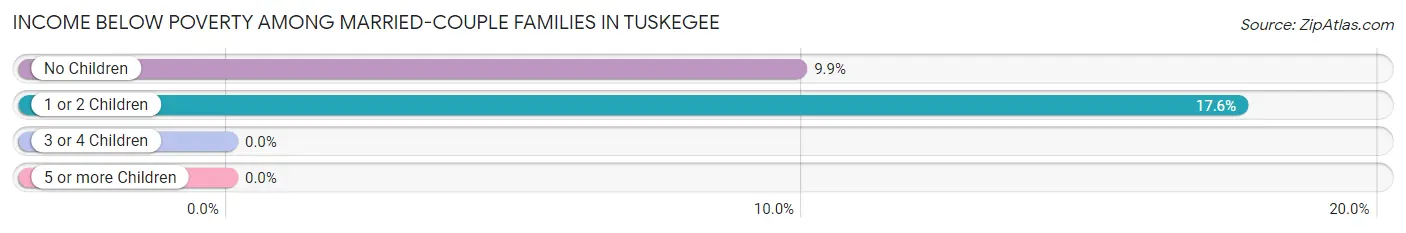
| Children | Above Poverty | Below Poverty |
| No Children | 391 (90.1%) | 43 (9.9%) |
| 1 or 2 Children | 136 (82.4%) | 29 (17.6%) |
| 3 or 4 Children | 8 (100.0%) | 0 (0.0%) |
| 5 or more Children | 0 (0.0%) | 0 (0.0%) |
| Total | 535 (88.1%) | 72 (11.9%) |
Income Below Poverty Among Single-Parent Households in Tuskegee
According to the poverty data in Tuskegee, 24.7% or 48 single-father households and 34.8% or 353 single-mother households are living below the poverty line. Among single-father households, those with 3 or 4 children have the highest poverty rate, with 6 households (30.0%) experiencing poverty. Likewise, among single-mother households, those with 3 or 4 children have the highest poverty rate, with 1 households (100.0%) falling below the poverty line.
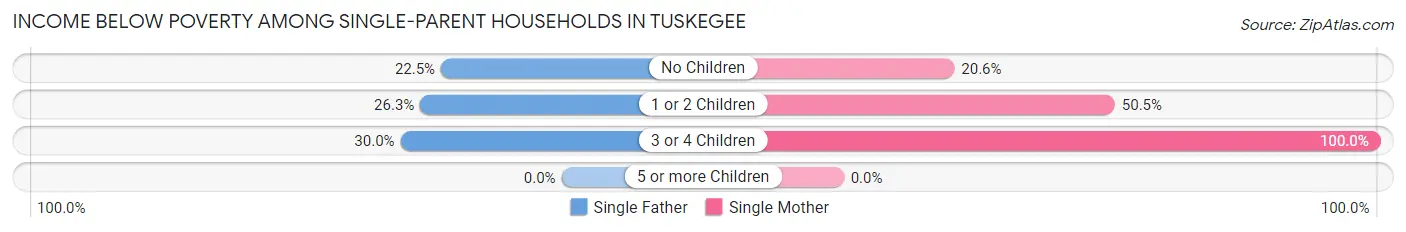
| Children | Single Father | Single Mother |
| No Children | 22 (22.5%) | 106 (20.6%) |
| 1 or 2 Children | 20 (26.3%) | 246 (50.5%) |
| 3 or 4 Children | 6 (30.0%) | 1 (100.0%) |
| 5 or more Children | 0 (0.0%) | 0 (0.0%) |
| Total | 48 (24.7%) | 353 (34.8%) |
Income Below Poverty Among Married-Couple vs Single-Parent Households in Tuskegee
The poverty data for Tuskegee shows that 72 of the married-couple family households (11.9%) and 401 of the single-parent households (33.2%) are living below the poverty level. Within the married-couple family households, those with 1 or 2 children have the highest poverty rate, with 29 households (17.6%) falling below the poverty line. Among the single-parent households, those with 1 or 2 children have the highest poverty rate, with 266 household (47.2%) living below poverty.
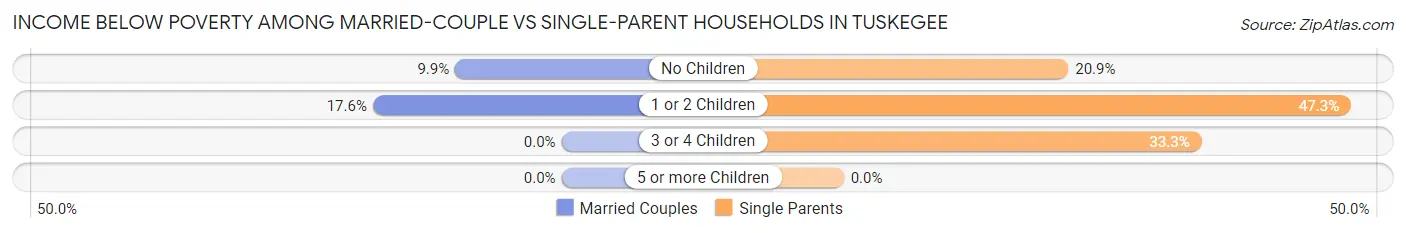
| Children | Married-Couple Families | Single-Parent Households |
| No Children | 43 (9.9%) | 128 (20.9%) |
| 1 or 2 Children | 29 (17.6%) | 266 (47.2%) |
| 3 or 4 Children | 0 (0.0%) | 7 (33.3%) |
| 5 or more Children | 0 (0.0%) | 0 (0.0%) |
| Total | 72 (11.9%) | 401 (33.2%) |
Race in Tuskegee
The most populous races in Tuskegee are Black / African American (8,149 | 88.8%), White / Caucasian (745 | 8.1%), and Two or more Races (170 | 1.8%).
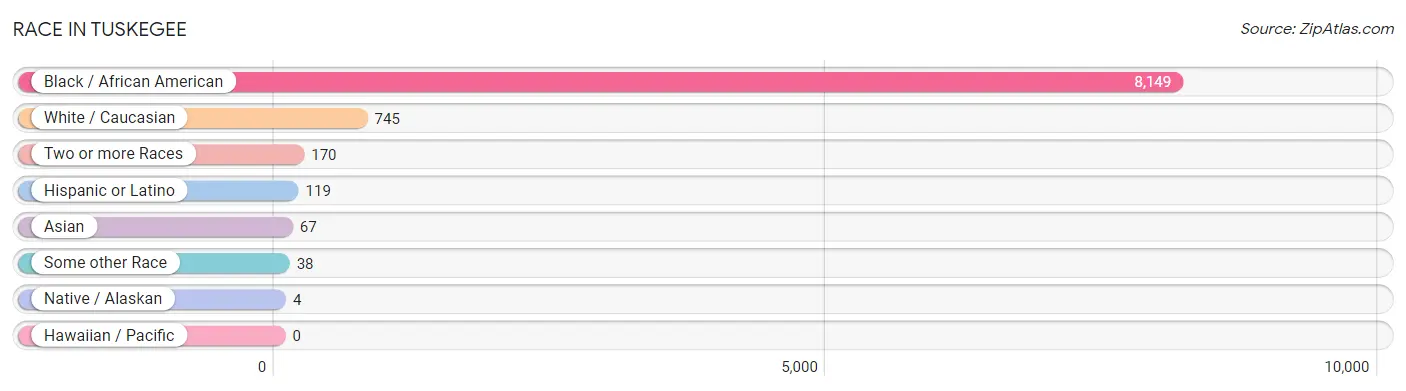
| Race | # Population | % Population |
| Asian | 67 | 0.7% |
| Black / African American | 8,149 | 88.8% |
| Hawaiian / Pacific | 0 | 0.0% |
| Hispanic or Latino | 119 | 1.3% |
| Native / Alaskan | 4 | 0.0% |
| White / Caucasian | 745 | 8.1% |
| Two or more Races | 170 | 1.8% |
| Some other Race | 38 | 0.4% |
| Total | 9,173 | 100.0% |
Ancestry in Tuskegee
The most populous ancestries reported in Tuskegee are American (858 | 9.3%), Subsaharan African (97 | 1.1%), Mexican (95 | 1.0%), English (84 | 0.9%), and German (73 | 0.8%), together accounting for 13.2% of all Tuskegee residents.
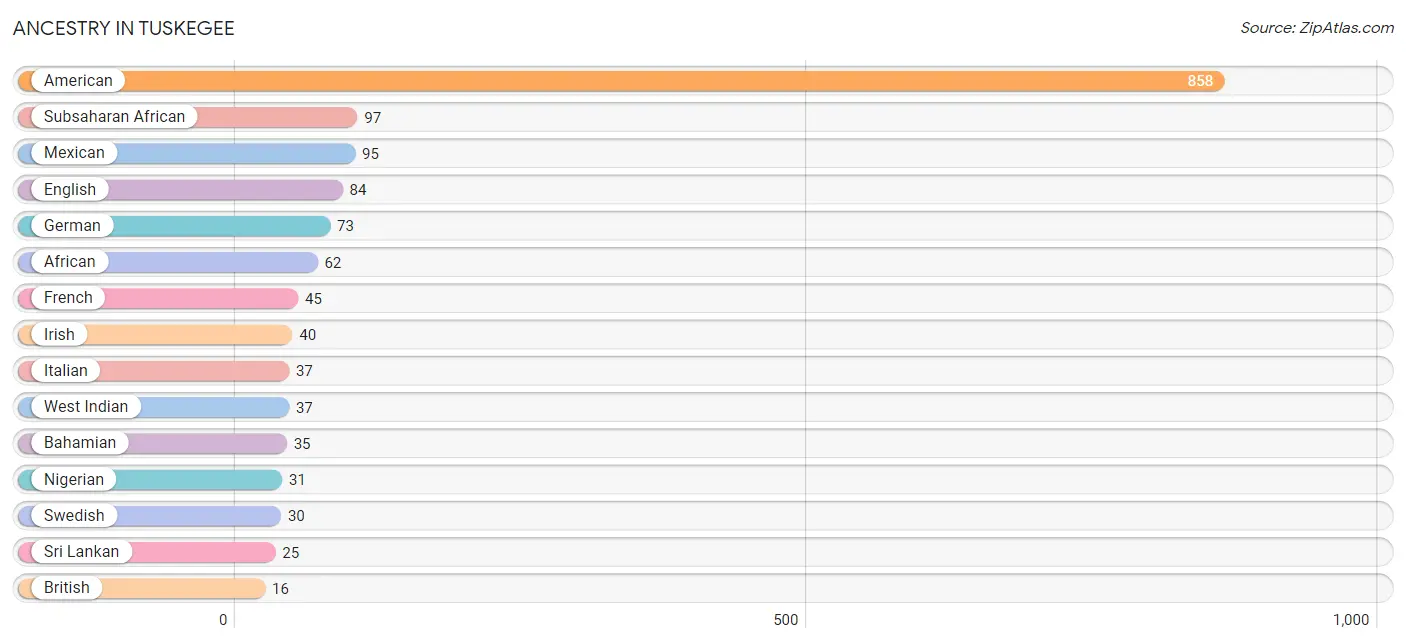
| Ancestry | # Population | % Population |
| African | 62 | 0.7% |
| American | 858 | 9.3% |
| Argentinean | 6 | 0.1% |
| Bahamian | 35 | 0.4% |
| Bhutanese | 5 | 0.1% |
| British | 16 | 0.2% |
| Burmese | 12 | 0.1% |
| Central American | 8 | 0.1% |
| Cherokee | 3 | 0.0% |
| Choctaw | 2 | 0.0% |
| Dominican | 4 | 0.0% |
| English | 84 | 0.9% |
| European | 4 | 0.0% |
| French | 45 | 0.5% |
| German | 73 | 0.8% |
| Greek | 14 | 0.2% |
| Guatemalan | 8 | 0.1% |
| Haitian | 15 | 0.2% |
| Irish | 40 | 0.4% |
| Israeli | 15 | 0.2% |
| Italian | 37 | 0.4% |
| Jamaican | 12 | 0.1% |
| Korean | 14 | 0.2% |
| Mexican | 95 | 1.0% |
| Mexican American Indian | 5 | 0.1% |
| Nigerian | 31 | 0.3% |
| Polish | 11 | 0.1% |
| Scottish | 7 | 0.1% |
| Sioux | 3 | 0.0% |
| South American | 6 | 0.1% |
| Sri Lankan | 25 | 0.3% |
| Subsaharan African | 97 | 1.1% |
| Swedish | 30 | 0.3% |
| Trinidadian and Tobagonian | 14 | 0.2% |
| Welsh | 2 | 0.0% |
| West Indian | 37 | 0.4% | View All 36 Rows |
Immigrants in Tuskegee
The most numerous immigrant groups reported in Tuskegee came from Africa (44 | 0.5%), Eastern Africa (44 | 0.5%), Latin America (33 | 0.4%), Central America (31 | 0.3%), and Mexico (23 | 0.3%), together accounting for 1.9% of all Tuskegee residents.
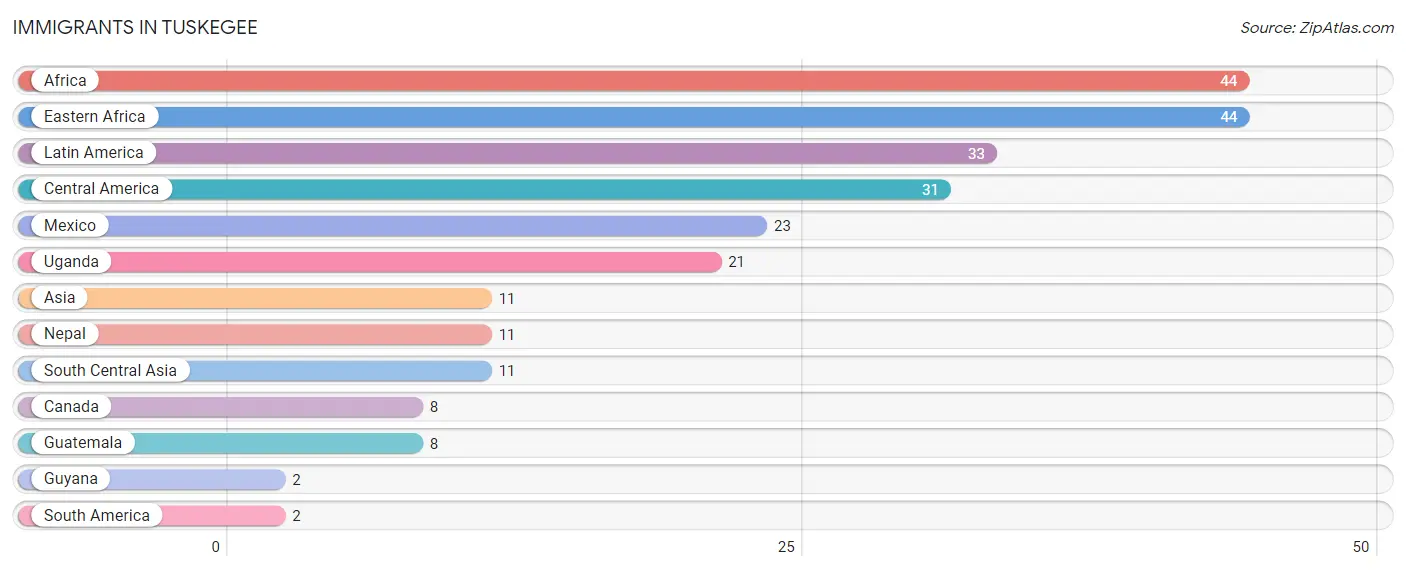
| Immigration Origin | # Population | % Population |
| Africa | 44 | 0.5% |
| Asia | 11 | 0.1% |
| Canada | 8 | 0.1% |
| Central America | 31 | 0.3% |
| Eastern Africa | 44 | 0.5% |
| Guatemala | 8 | 0.1% |
| Guyana | 2 | 0.0% |
| Latin America | 33 | 0.4% |
| Mexico | 23 | 0.3% |
| Nepal | 11 | 0.1% |
| South America | 2 | 0.0% |
| South Central Asia | 11 | 0.1% |
| Uganda | 21 | 0.2% | View All 13 Rows |
Sex and Age in Tuskegee
Sex and Age in Tuskegee
The most populous age groups in Tuskegee are 20 to 24 Years (687 | 18.1%) for men and 15 to 19 Years (1,139 | 21.2%) for women.
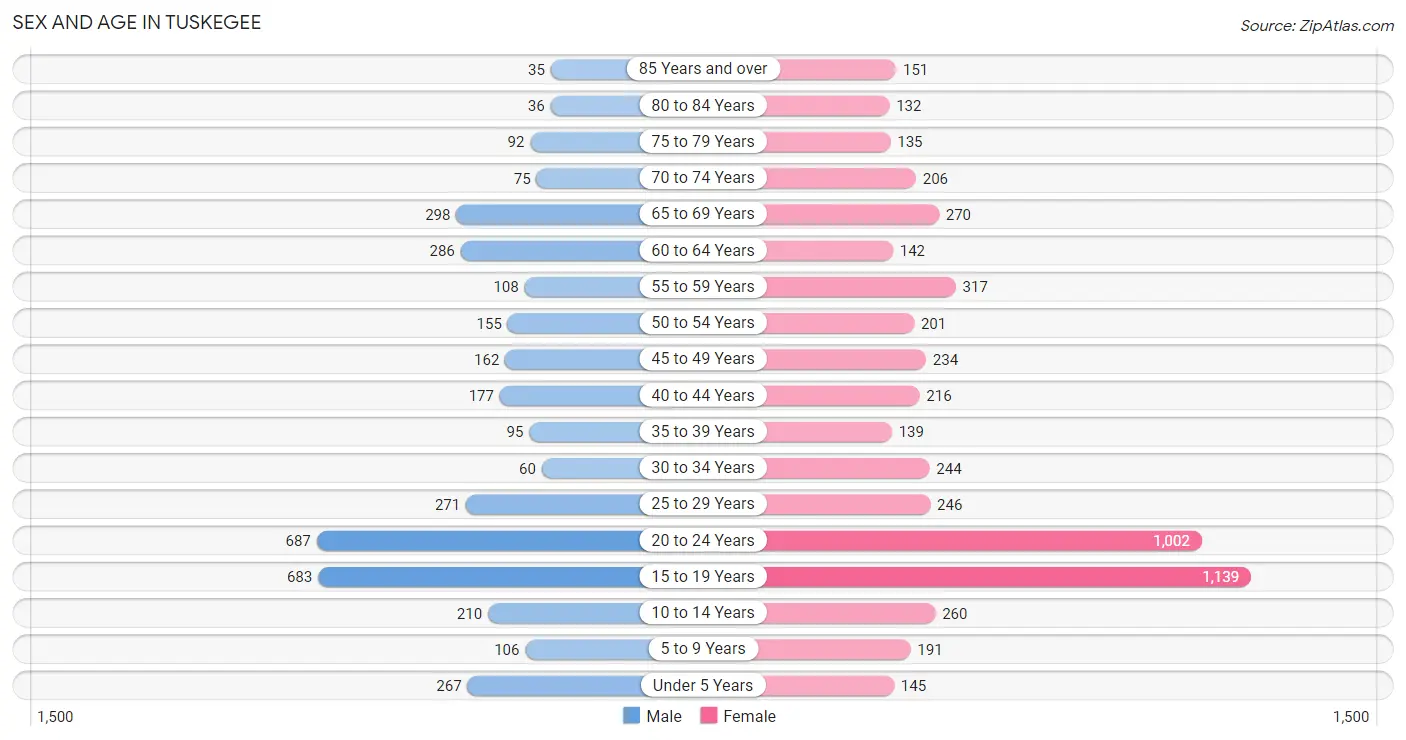
| Age Bracket | Male | Female |
| Under 5 Years | 267 (7.0%) | 145 (2.7%) |
| 5 to 9 Years | 106 (2.8%) | 191 (3.6%) |
| 10 to 14 Years | 210 (5.5%) | 260 (4.8%) |
| 15 to 19 Years | 683 (18.0%) | 1,139 (21.2%) |
| 20 to 24 Years | 687 (18.1%) | 1,002 (18.7%) |
| 25 to 29 Years | 271 (7.1%) | 246 (4.6%) |
| 30 to 34 Years | 60 (1.6%) | 244 (4.5%) |
| 35 to 39 Years | 95 (2.5%) | 139 (2.6%) |
| 40 to 44 Years | 177 (4.6%) | 216 (4.0%) |
| 45 to 49 Years | 162 (4.3%) | 234 (4.4%) |
| 50 to 54 Years | 155 (4.1%) | 201 (3.7%) |
| 55 to 59 Years | 108 (2.8%) | 317 (5.9%) |
| 60 to 64 Years | 286 (7.5%) | 142 (2.6%) |
| 65 to 69 Years | 298 (7.8%) | 270 (5.0%) |
| 70 to 74 Years | 75 (2.0%) | 206 (3.8%) |
| 75 to 79 Years | 92 (2.4%) | 135 (2.5%) |
| 80 to 84 Years | 36 (0.9%) | 132 (2.5%) |
| 85 Years and over | 35 (0.9%) | 151 (2.8%) |
| Total | 3,803 (100.0%) | 5,370 (100.0%) |
Families and Households in Tuskegee
Median Family Size in Tuskegee
The median family size in Tuskegee is 2.72 persons per family, with single female/mother families (1,014 | 55.9%) accounting for the largest median family size of 2.84 persons per family. On the other hand, married-couple families (607 | 33.4%) represent the smallest median family size with 2.57 persons per family.
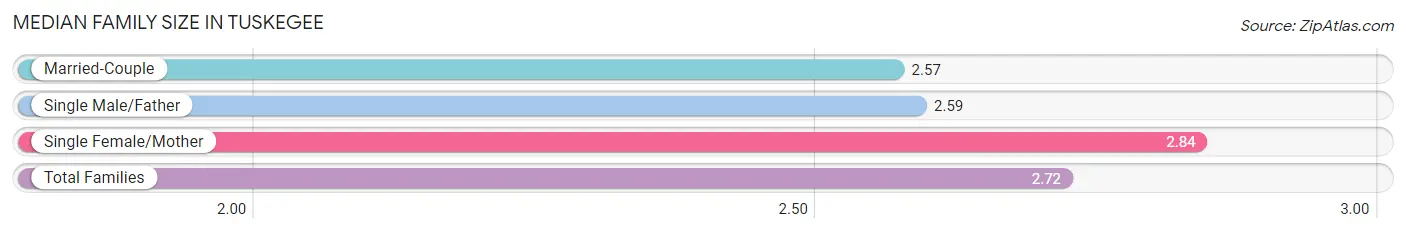
| Family Type | # Families | Family Size |
| Married-Couple | 607 (33.4%) | 2.57 |
| Single Male/Father | 194 (10.7%) | 2.59 |
| Single Female/Mother | 1,014 (55.9%) | 2.84 |
| Total Families | 1,815 (100.0%) | 2.72 |
Median Household Size in Tuskegee
The median household size in Tuskegee is 2.11 persons per household, with single male/father households (194 | 6.2%) accounting for the largest median household size of 3.09 persons per household. non-family households (1,335 | 42.4%) represent the smallest median household size with 1.14 persons per household.
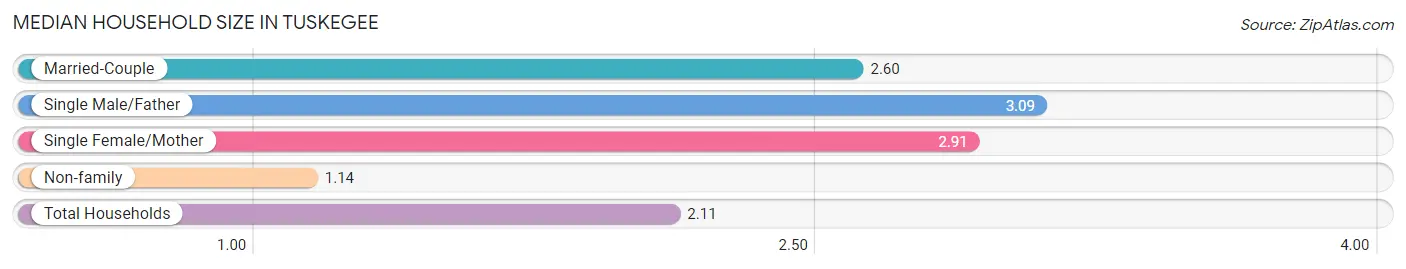
| Household Type | # Households | Household Size |
| Married-Couple | 607 (19.3%) | 2.60 |
| Single Male/Father | 194 (6.2%) | 3.09 |
| Single Female/Mother | 1,014 (32.2%) | 2.91 |
| Non-family | 1,335 (42.4%) | 1.14 |
| Total Households | 3,150 (100.0%) | 2.11 |
Household Size by Marriage Status in Tuskegee
Out of a total of 3,150 households in Tuskegee, 1,815 (57.6%) are family households, while 1,335 (42.4%) are nonfamily households. The most numerous type of family households are 2-person households, comprising 995, and the most common type of nonfamily households are 1-person households, comprising 1,210.
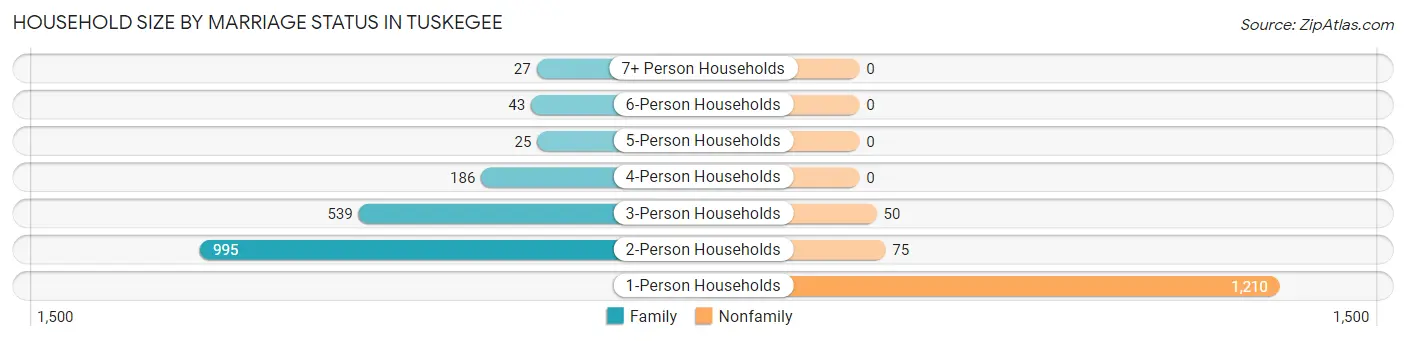
| Household Size | Family Households | Nonfamily Households |
| 1-Person Households | - | 1,210 (38.4%) |
| 2-Person Households | 995 (31.6%) | 75 (2.4%) |
| 3-Person Households | 539 (17.1%) | 50 (1.6%) |
| 4-Person Households | 186 (5.9%) | 0 (0.0%) |
| 5-Person Households | 25 (0.8%) | 0 (0.0%) |
| 6-Person Households | 43 (1.4%) | 0 (0.0%) |
| 7+ Person Households | 27 (0.9%) | 0 (0.0%) |
| Total | 1,815 (57.6%) | 1,335 (42.4%) |
Female Fertility in Tuskegee
Fertility by Age in Tuskegee
Average fertility rate in Tuskegee is 10.0 births per 1,000 women. Women in the age bracket of 35 to 50 years have the highest fertility rate with 40.0 births per 1,000 women. Women in the age bracket of 35 to 50 years acount for 73.5% of all women with births.
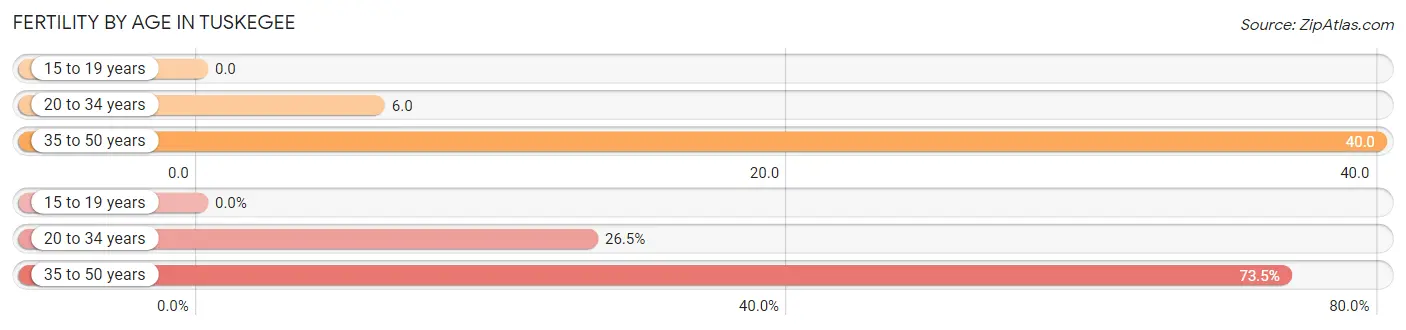
| Age Bracket | Women with Births | Births / 1,000 Women |
| 15 to 19 years | 0 (0.0%) | 0.0 |
| 20 to 34 years | 9 (26.5%) | 6.0 |
| 35 to 50 years | 25 (73.5%) | 40.0 |
| Total | 34 (100.0%) | 10.0 |
Fertility by Age by Marriage Status in Tuskegee
26.5% of women with births (34) in Tuskegee are married. The highest percentage of unmarried women with births falls into 35 to 50 years age bracket with 100.0% of them unmarried at the time of birth, while the lowest percentage of unmarried women with births belong to 20 to 34 years age bracket with 0.0% of them unmarried.

| Age Bracket | Married | Unmarried |
| 15 to 19 years | 0 (0.0%) | 0 (0.0%) |
| 20 to 34 years | 9 (100.0%) | 0 (0.0%) |
| 35 to 50 years | 0 (0.0%) | 25 (100.0%) |
| Total | 9 (26.5%) | 25 (73.5%) |
Fertility by Education in Tuskegee
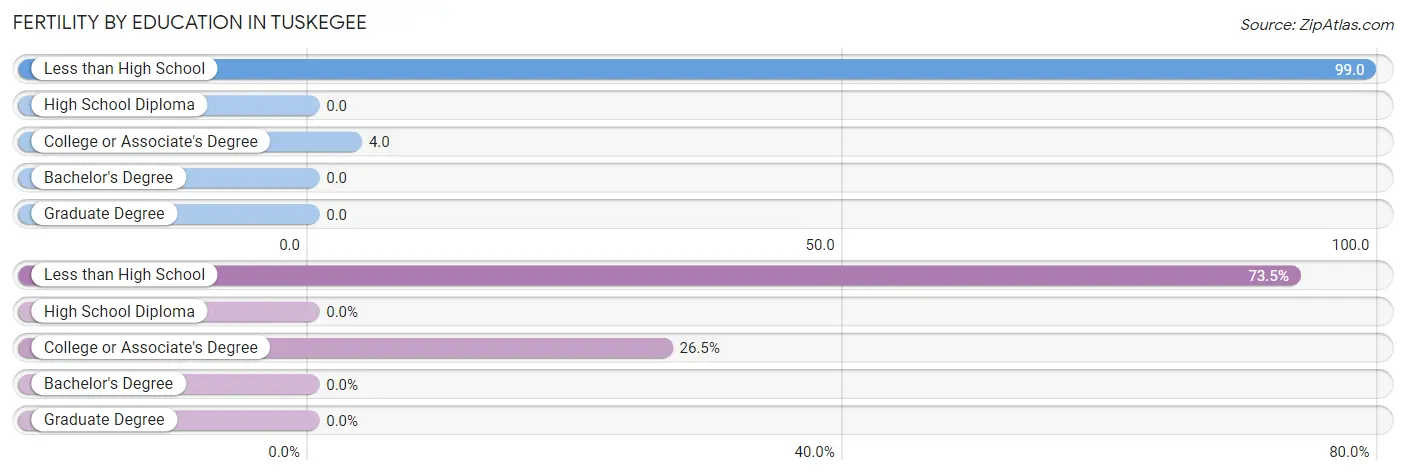
| Educational Attainment | Women with Births | Births / 1,000 Women |
| Less than High School | 25 (73.5%) | 99.0 |
| High School Diploma | 0 (0.0%) | 0.0 |
| College or Associate's Degree | 9 (26.5%) | 4.0 |
| Bachelor's Degree | 0 (0.0%) | 0.0 |
| Graduate Degree | 0 (0.0%) | 0.0 |
| Total | 34 (100.0%) | 10.0 |
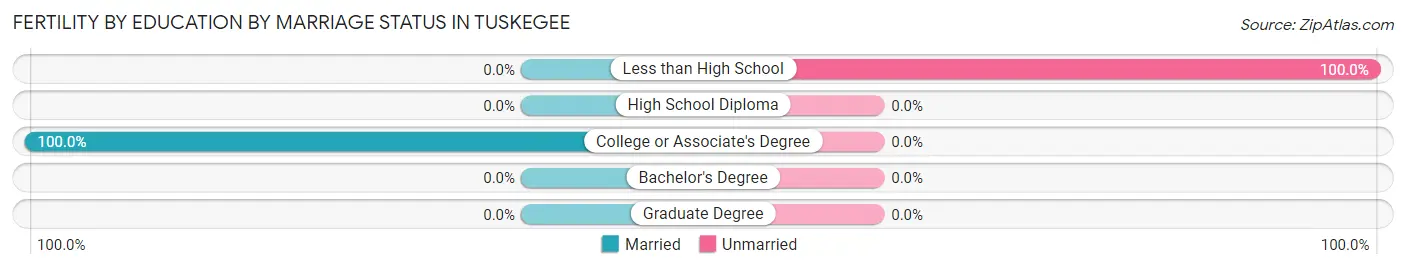
Fertility by Education by Marriage Status in Tuskegee
73.5% of women with births in Tuskegee are unmarried. Women with the educational attainment of college or associate's degree are most likely to be married with 100.0% of them married at childbirth, while women with the educational attainment of less than high school are least likely to be married with 100.0% of them unmarried at childbirth.
| Educational Attainment | Married | Unmarried |
| Less than High School | 0 (0.0%) | 25 (100.0%) |
| High School Diploma | 0 (0.0%) | 0 (0.0%) |
| College or Associate's Degree | 9 (100.0%) | 0 (0.0%) |
| Bachelor's Degree | 0 (0.0%) | 0 (0.0%) |
| Graduate Degree | 0 (0.0%) | 0 (0.0%) |
| Total | 9 (26.5%) | 25 (73.5%) |
Employment Characteristics in Tuskegee
Employment by Class of Employer in Tuskegee
Among the 3,237 employed individuals in Tuskegee, private company employees (1,756 | 54.2%), not-for-profit organizations (420 | 13.0%), and federal government employees (365 | 11.3%) make up the most common classes of employment.
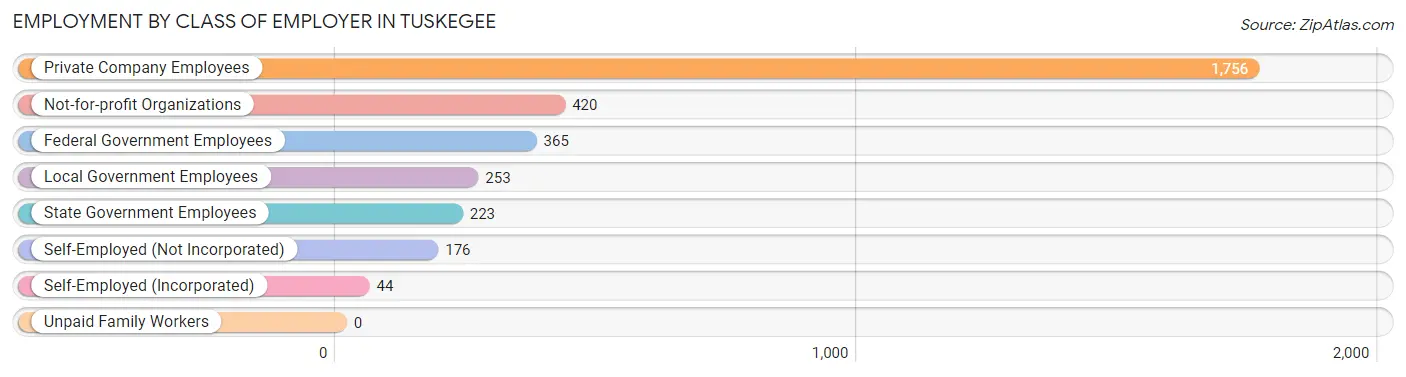
| Employer Class | # Employees | % Employees |
| Private Company Employees | 1,756 | 54.2% |
| Self-Employed (Incorporated) | 44 | 1.4% |
| Self-Employed (Not Incorporated) | 176 | 5.4% |
| Not-for-profit Organizations | 420 | 13.0% |
| Local Government Employees | 253 | 7.8% |
| State Government Employees | 223 | 6.9% |
| Federal Government Employees | 365 | 11.3% |
| Unpaid Family Workers | 0 | 0.0% |
| Total | 3,237 | 100.0% |
Employment Status by Age in Tuskegee
According to the labor force statistics for Tuskegee, out of the total population over 16 years of age (7,943), 48.1% or 3,821 individuals are in the labor force, with 11.3% or 432 of them unemployed. The age group with the highest labor force participation rate is 35 to 44 years, with 75.4% or 473 individuals in the labor force. Within the labor force, the 20 to 24 years age range has the highest percentage of unemployed individuals, with 21.4% or 182 of them being unemployed.
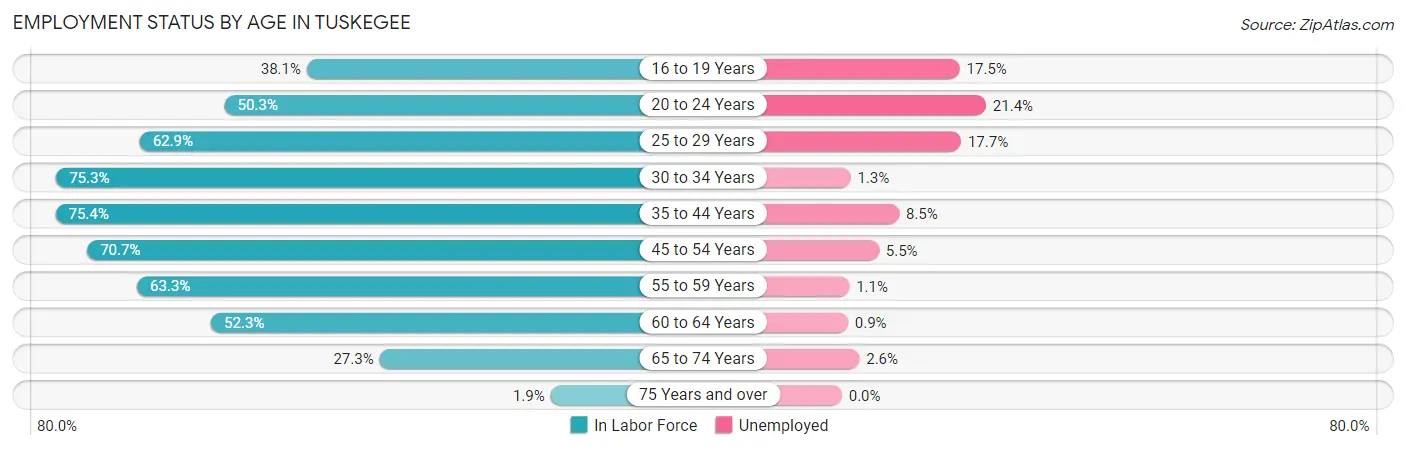
| Age Bracket | In Labor Force | Unemployed |
| 16 to 19 Years | 675 (38.1%) | 118 (17.5%) |
| 20 to 24 Years | 850 (50.3%) | 182 (21.4%) |
| 25 to 29 Years | 325 (62.9%) | 58 (17.7%) |
| 30 to 34 Years | 229 (75.3%) | 3 (1.3%) |
| 35 to 44 Years | 473 (75.4%) | 40 (8.5%) |
| 45 to 54 Years | 532 (70.7%) | 29 (5.5%) |
| 55 to 59 Years | 269 (63.3%) | 3 (1.1%) |
| 60 to 64 Years | 224 (52.3%) | 2 (0.9%) |
| 65 to 74 Years | 232 (27.3%) | 6 (2.6%) |
| 75 Years and over | 11 (1.9%) | 0 (0.0%) |
| Total | 3,821 (48.1%) | 432 (11.3%) |
Employment Status by Educational Attainment in Tuskegee
According to labor force statistics for Tuskegee, 67.2% of individuals (2,052) out of the total population between 25 and 64 years of age (3,053) are in the labor force, with 6.5% or 133 of them being unemployed. The group with the highest labor force participation rate are those with the educational attainment of bachelor's degree or higher, with 92.2% or 757 individuals in the labor force. Within the labor force, individuals with high school diploma education have the highest percentage of unemployment, with 14.5% or 70 of them being unemployed.
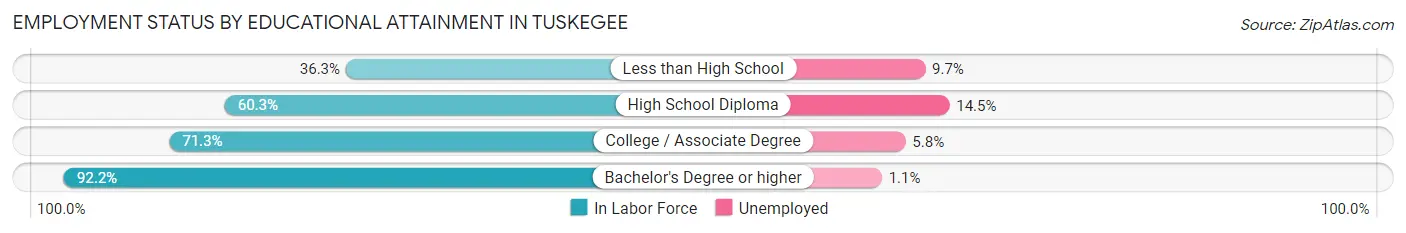
| Educational Attainment | In Labor Force | Unemployed |
| Less than High School | 216 (36.3%) | 58 (9.7%) |
| High School Diploma | 482 (60.3%) | 116 (14.5%) |
| College / Associate Degree | 597 (71.3%) | 49 (5.8%) |
| Bachelor's Degree or higher | 757 (92.2%) | 9 (1.1%) |
| Total | 2,052 (67.2%) | 198 (6.5%) |
Employment Occupations by Sex in Tuskegee
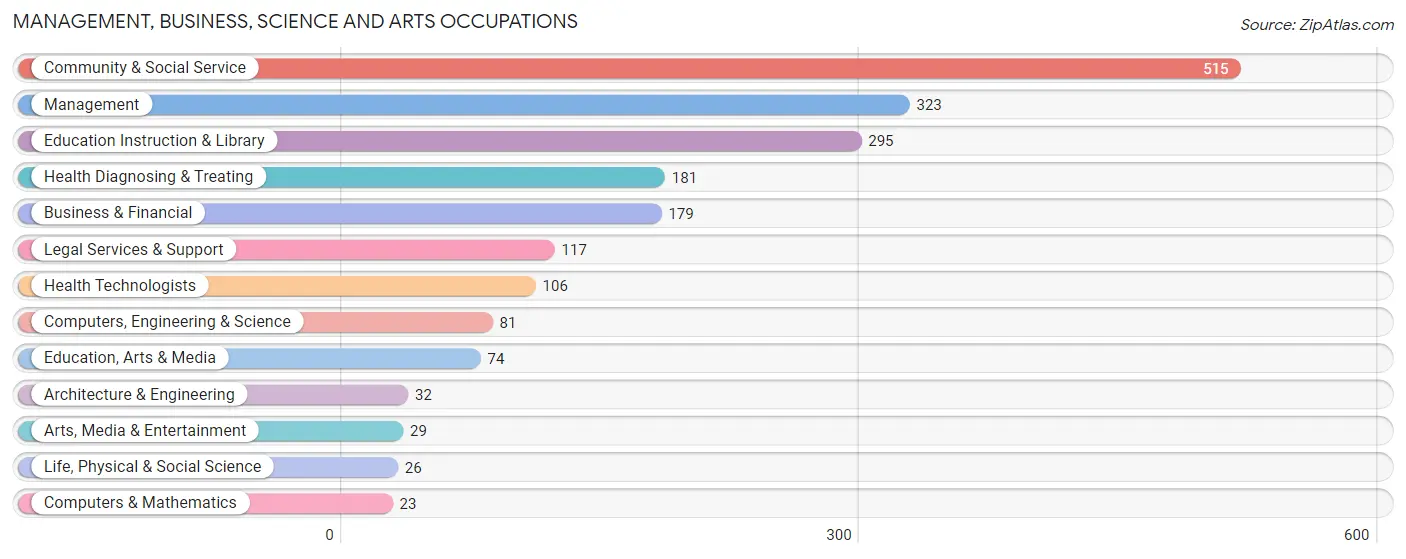
Management, Business, Science and Arts Occupations
The most common Management, Business, Science and Arts occupations in Tuskegee are Community & Social Service (515 | 15.6%), Management (323 | 9.8%), Education Instruction & Library (295 | 8.9%), Health Diagnosing & Treating (181 | 5.5%), and Business & Financial (179 | 5.4%).
Management, Business, Science and Arts Occupations by Sex
Within the Management, Business, Science and Arts occupations in Tuskegee, the most male-oriented occupations are Computers, Engineering & Science (100.0%), Computers & Mathematics (100.0%), and Architecture & Engineering (100.0%), while the most female-oriented occupations are Legal Services & Support (100.0%), Education Instruction & Library (92.9%), and Community & Social Service (86.8%).
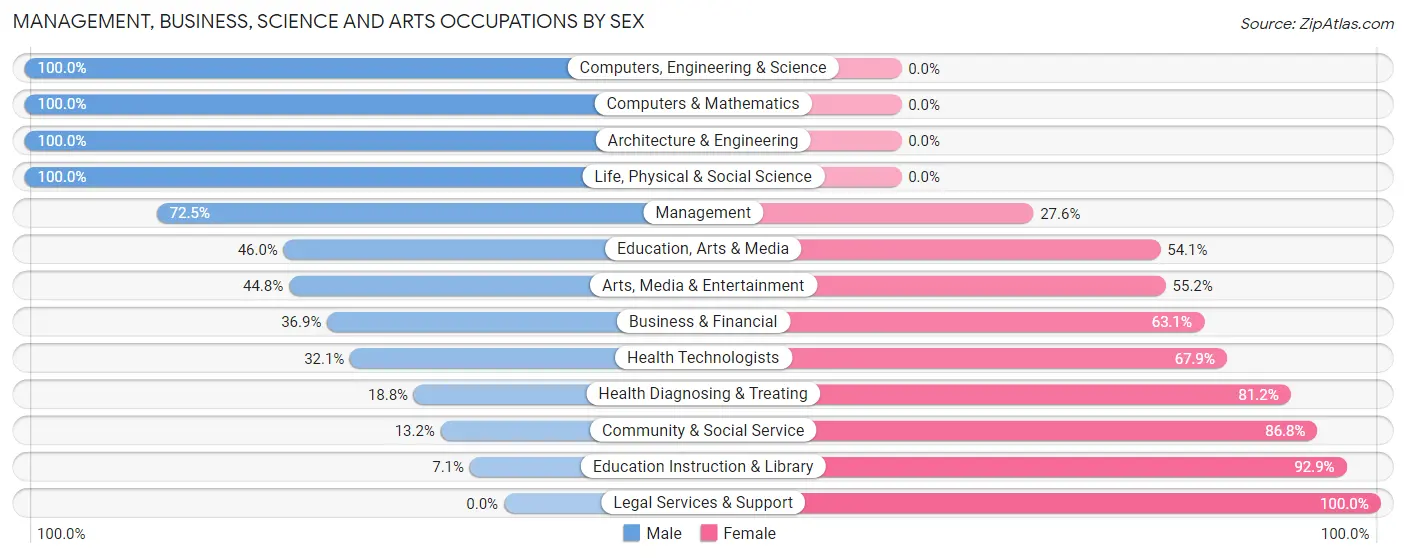
| Occupation | Male | Female |
| Management | 234 (72.5%) | 89 (27.6%) |
| Business & Financial | 66 (36.9%) | 113 (63.1%) |
| Computers, Engineering & Science | 81 (100.0%) | 0 (0.0%) |
| Computers & Mathematics | 23 (100.0%) | 0 (0.0%) |
| Architecture & Engineering | 32 (100.0%) | 0 (0.0%) |
| Life, Physical & Social Science | 26 (100.0%) | 0 (0.0%) |
| Community & Social Service | 68 (13.2%) | 447 (86.8%) |
| Education, Arts & Media | 34 (46.0%) | 40 (54.0%) |
| Legal Services & Support | 0 (0.0%) | 117 (100.0%) |
| Education Instruction & Library | 21 (7.1%) | 274 (92.9%) |
| Arts, Media & Entertainment | 13 (44.8%) | 16 (55.2%) |
| Health Diagnosing & Treating | 34 (18.8%) | 147 (81.2%) |
| Health Technologists | 34 (32.1%) | 72 (67.9%) |
| Total (Category) | 483 (37.8%) | 796 (62.2%) |
| Total (Overall) | 1,230 (37.2%) | 2,078 (62.8%) |
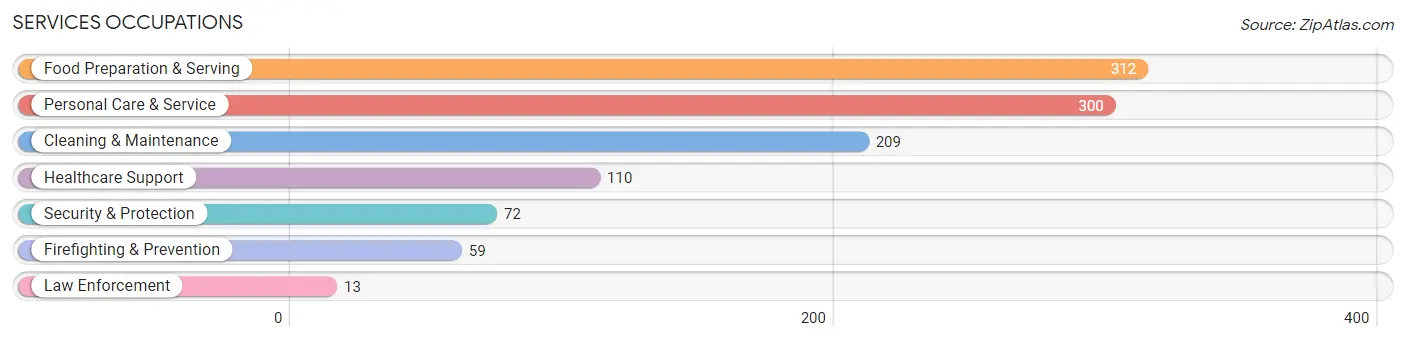
Services Occupations
The most common Services occupations in Tuskegee are Food Preparation & Serving (312 | 9.4%), Personal Care & Service (300 | 9.1%), Cleaning & Maintenance (209 | 6.3%), Healthcare Support (110 | 3.3%), and Security & Protection (72 | 2.2%).
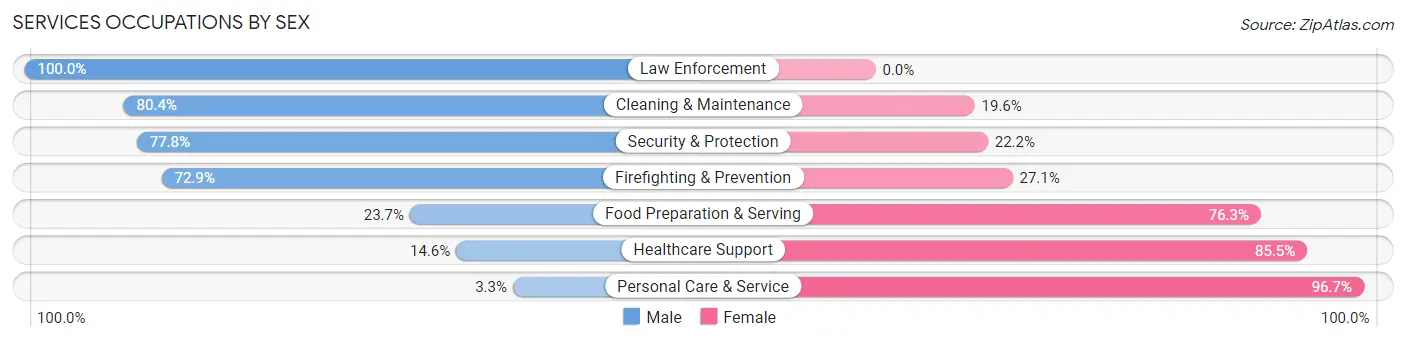
Services Occupations by Sex
Within the Services occupations in Tuskegee, the most male-oriented occupations are Law Enforcement (100.0%), Cleaning & Maintenance (80.4%), and Security & Protection (77.8%), while the most female-oriented occupations are Personal Care & Service (96.7%), Healthcare Support (85.5%), and Food Preparation & Serving (76.3%).
| Occupation | Male | Female |
| Healthcare Support | 16 (14.5%) | 94 (85.5%) |
| Security & Protection | 56 (77.8%) | 16 (22.2%) |
| Firefighting & Prevention | 43 (72.9%) | 16 (27.1%) |
| Law Enforcement | 13 (100.0%) | 0 (0.0%) |
| Food Preparation & Serving | 74 (23.7%) | 238 (76.3%) |
| Cleaning & Maintenance | 168 (80.4%) | 41 (19.6%) |
| Personal Care & Service | 10 (3.3%) | 290 (96.7%) |
| Total (Category) | 324 (32.3%) | 679 (67.7%) |
| Total (Overall) | 1,230 (37.2%) | 2,078 (62.8%) |
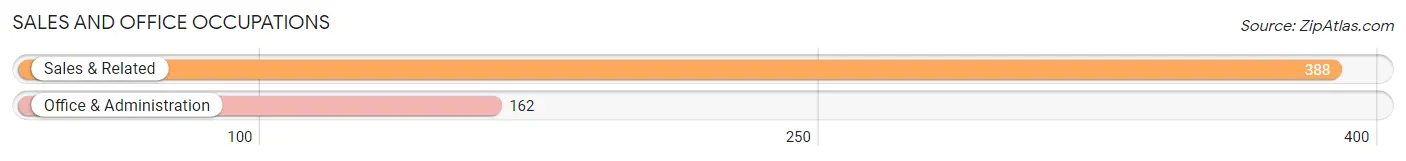
Sales and Office Occupations
The most common Sales and Office occupations in Tuskegee are Sales & Related (388 | 11.7%), and Office & Administration (162 | 4.9%).
Sales and Office Occupations by Sex

| Occupation | Male | Female |
| Sales & Related | 74 (19.1%) | 314 (80.9%) |
| Office & Administration | 17 (10.5%) | 145 (89.5%) |
| Total (Category) | 91 (16.6%) | 459 (83.5%) |
| Total (Overall) | 1,230 (37.2%) | 2,078 (62.8%) |
Natural Resources, Construction and Maintenance Occupations
The most common Natural Resources, Construction and Maintenance occupations in Tuskegee are Construction & Extraction (30 | 0.9%), and Installation, Maintenance & Repair (5 | 0.2%).
Natural Resources, Construction and Maintenance Occupations by Sex

| Occupation | Male | Female |
| Farming, Fishing & Forestry | 0 (0.0%) | 0 (0.0%) |
| Construction & Extraction | 30 (100.0%) | 0 (0.0%) |
| Installation, Maintenance & Repair | 5 (100.0%) | 0 (0.0%) |
| Total (Category) | 35 (100.0%) | 0 (0.0%) |
| Total (Overall) | 1,230 (37.2%) | 2,078 (62.8%) |
Production, Transportation and Moving Occupations
The most common Production, Transportation and Moving occupations in Tuskegee are Production (277 | 8.4%), Transportation (97 | 2.9%), and Material Moving (67 | 2.0%).
Production, Transportation and Moving Occupations by Sex
| Occupation | Male | Female |
| Production | 169 (61.0%) | 108 (39.0%) |
| Transportation | 84 (86.6%) | 13 (13.4%) |
| Material Moving | 44 (65.7%) | 23 (34.3%) |
| Total (Category) | 297 (67.3%) | 144 (32.7%) |
| Total (Overall) | 1,230 (37.2%) | 2,078 (62.8%) |
Employment Industries by Sex in Tuskegee
Employment Industries in Tuskegee
The major employment industries in Tuskegee include Educational Services (788 | 23.8%), Accommodation & Food Services (525 | 15.9%), Health Care & Social Assistance (463 | 14.0%), Public Administration (327 | 9.9%), and Retail Trade (245 | 7.4%).
Employment Industries by Sex in Tuskegee
The Tuskegee industries that see more men than women are Agriculture, Fishing & Hunting (100.0%), Construction (100.0%), and Wholesale Trade (100.0%), whereas the industries that tend to have a higher number of women are Finance & Insurance (100.0%), Arts, Entertainment & Recreation (94.1%), and Information (90.9%).
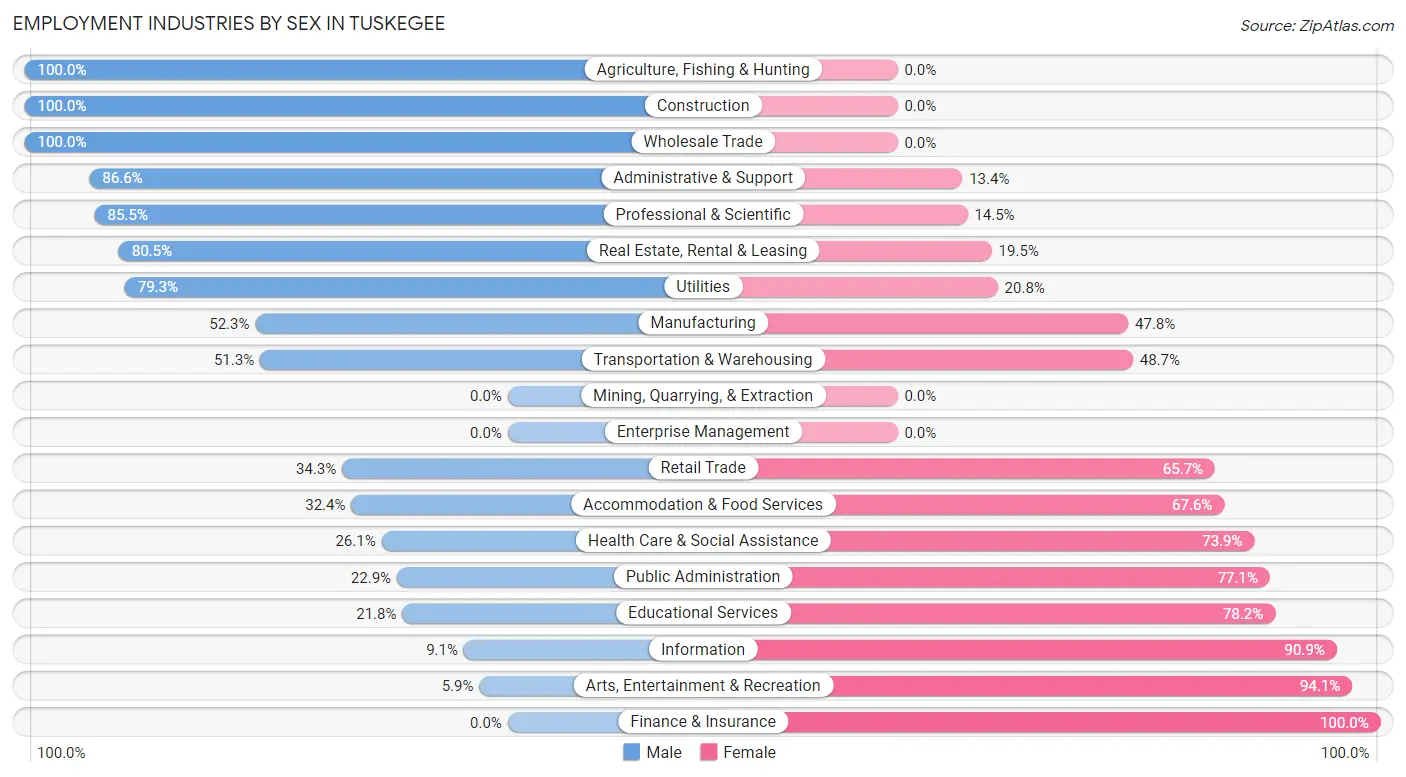
| Industry | Male | Female |
| Agriculture, Fishing & Hunting | 55 (100.0%) | 0 (0.0%) |
| Mining, Quarrying, & Extraction | 0 (0.0%) | 0 (0.0%) |
| Construction | 38 (100.0%) | 0 (0.0%) |
| Manufacturing | 116 (52.2%) | 106 (47.7%) |
| Wholesale Trade | 8 (100.0%) | 0 (0.0%) |
| Retail Trade | 84 (34.3%) | 161 (65.7%) |
| Transportation & Warehousing | 20 (51.3%) | 19 (48.7%) |
| Utilities | 42 (79.2%) | 11 (20.7%) |
| Information | 1 (9.1%) | 10 (90.9%) |
| Finance & Insurance | 0 (0.0%) | 10 (100.0%) |
| Real Estate, Rental & Leasing | 66 (80.5%) | 16 (19.5%) |
| Professional & Scientific | 59 (85.5%) | 10 (14.5%) |
| Enterprise Management | 0 (0.0%) | 0 (0.0%) |
| Administrative & Support | 129 (86.6%) | 20 (13.4%) |
| Educational Services | 172 (21.8%) | 616 (78.2%) |
| Health Care & Social Assistance | 121 (26.1%) | 342 (73.9%) |
| Arts, Entertainment & Recreation | 3 (5.9%) | 48 (94.1%) |
| Accommodation & Food Services | 170 (32.4%) | 355 (67.6%) |
| Public Administration | 75 (22.9%) | 252 (77.1%) |
| Total | 1,230 (37.2%) | 2,078 (62.8%) |
Education in Tuskegee
School Enrollment in Tuskegee
The most common levels of schooling among the 3,993 students in Tuskegee are college / undergraduate (2,857 | 71.6%), middle school (403 | 10.1%), and high school (306 | 7.7%).
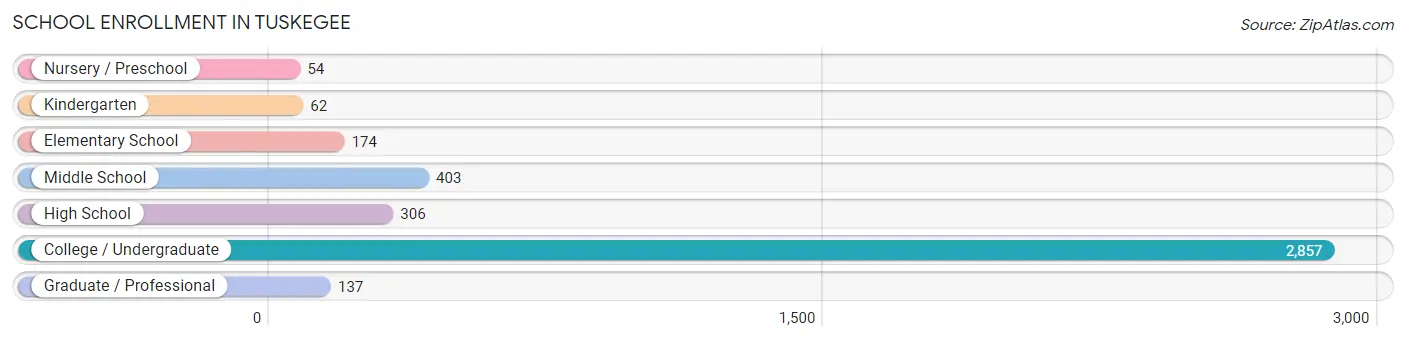
| School Level | # Students | % Students |
| Nursery / Preschool | 54 | 1.3% |
| Kindergarten | 62 | 1.5% |
| Elementary School | 174 | 4.4% |
| Middle School | 403 | 10.1% |
| High School | 306 | 7.7% |
| College / Undergraduate | 2,857 | 71.6% |
| Graduate / Professional | 137 | 3.4% |
| Total | 3,993 | 100.0% |
School Enrollment by Age by Funding Source in Tuskegee
Out of a total of 3,993 students who are enrolled in schools in Tuskegee, 1,869 (46.8%) attend a private institution, while the remaining 2,124 (53.2%) are enrolled in public schools. The age group of 20 to 24 year olds has the highest likelihood of being enrolled in private schools, with 1,008 (72.9% in the age bracket) enrolled. Conversely, the age group of 5 to 9 year old has the lowest likelihood of being enrolled in a private school, with 239 (100.0% in the age bracket) attending a public institution.
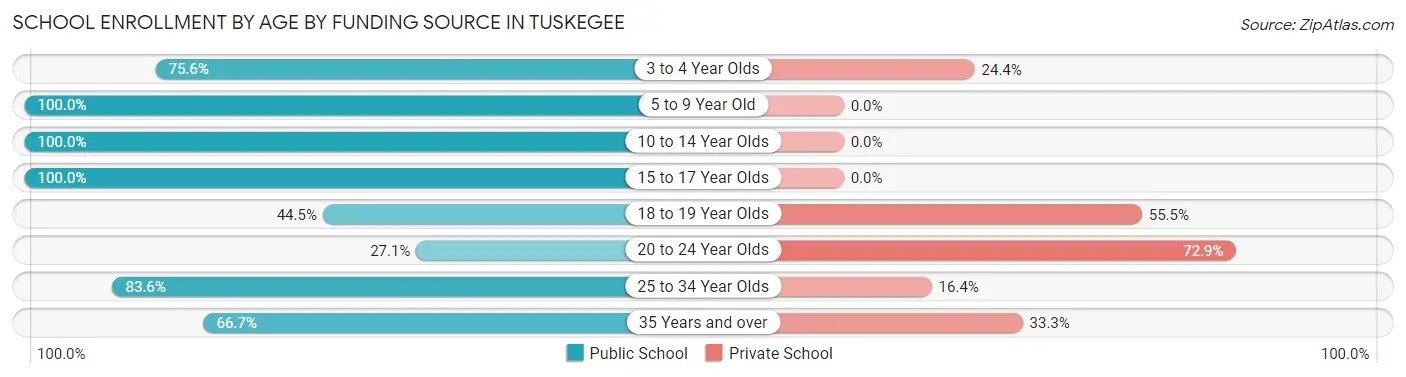
| Age Bracket | Public School | Private School |
| 3 to 4 Year Olds | 31 (75.6%) | 10 (24.4%) |
| 5 to 9 Year Old | 239 (100.0%) | 0 (0.0%) |
| 10 to 14 Year Olds | 445 (100.0%) | 0 (0.0%) |
| 15 to 17 Year Olds | 246 (100.0%) | 0 (0.0%) |
| 18 to 19 Year Olds | 651 (44.5%) | 813 (55.5%) |
| 20 to 24 Year Olds | 374 (27.1%) | 1,008 (72.9%) |
| 25 to 34 Year Olds | 102 (83.6%) | 20 (16.4%) |
| 35 Years and over | 36 (66.7%) | 18 (33.3%) |
| Total | 2,124 (53.2%) | 1,869 (46.8%) |
Educational Attainment by Field of Study in Tuskegee
Business (297 | 23.0%), arts & humanities (204 | 15.8%), education (167 | 12.9%), social sciences (146 | 11.3%), and bio, nature & agricultural (133 | 10.3%) are the most common fields of study among 1,293 individuals in Tuskegee who have obtained a bachelor's degree or higher.
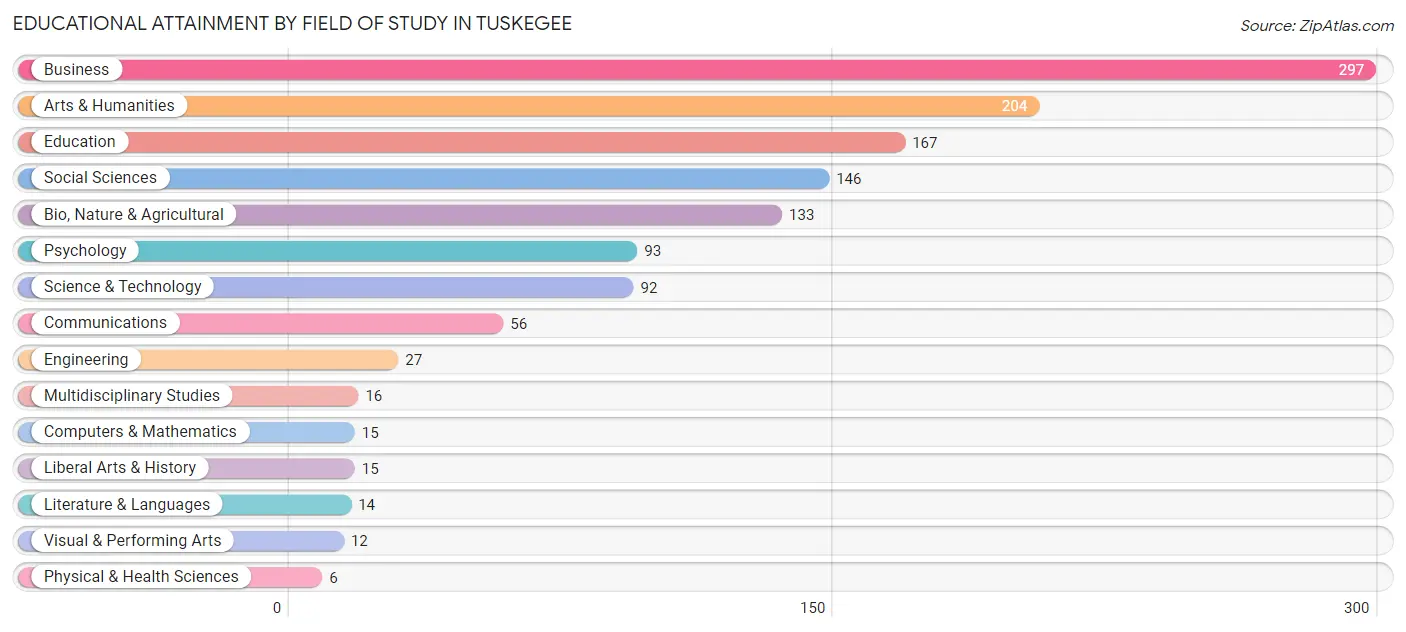
| Field of Study | # Graduates | % Graduates |
| Computers & Mathematics | 15 | 1.2% |
| Bio, Nature & Agricultural | 133 | 10.3% |
| Physical & Health Sciences | 6 | 0.5% |
| Psychology | 93 | 7.2% |
| Social Sciences | 146 | 11.3% |
| Engineering | 27 | 2.1% |
| Multidisciplinary Studies | 16 | 1.2% |
| Science & Technology | 92 | 7.1% |
| Business | 297 | 23.0% |
| Education | 167 | 12.9% |
| Literature & Languages | 14 | 1.1% |
| Liberal Arts & History | 15 | 1.2% |
| Visual & Performing Arts | 12 | 0.9% |
| Communications | 56 | 4.3% |
| Arts & Humanities | 204 | 15.8% |
| Total | 1,293 | 100.0% |
Transportation & Commute in Tuskegee
Vehicle Availability by Sex in Tuskegee
The most prevalent vehicle ownership categories in Tuskegee are males with 1 vehicle (376, accounting for 32.9%) and females with 1 vehicle (525, making up 27.8%).
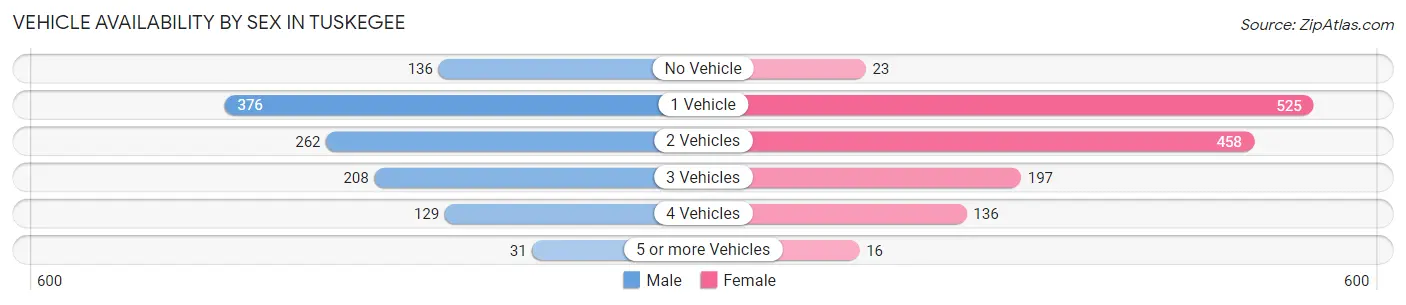
| Vehicles Available | Male | Female |
| No Vehicle | 136 (11.9%) | 23 (1.7%) |
| 1 Vehicle | 376 (32.9%) | 525 (38.8%) |
| 2 Vehicles | 262 (22.9%) | 458 (33.8%) |
| 3 Vehicles | 208 (18.2%) | 197 (14.5%) |
| 4 Vehicles | 129 (11.3%) | 136 (10.0%) |
| 5 or more Vehicles | 31 (2.7%) | 16 (1.2%) |
| Total | 1,142 (100.0%) | 1,355 (100.0%) |
Commute Time in Tuskegee
The most frequently occuring commute durations in Tuskegee are 5 to 9 minutes (651 commuters, 21.1%), 10 to 14 minutes (519 commuters, 16.8%), and 30 to 34 minutes (468 commuters, 15.2%).
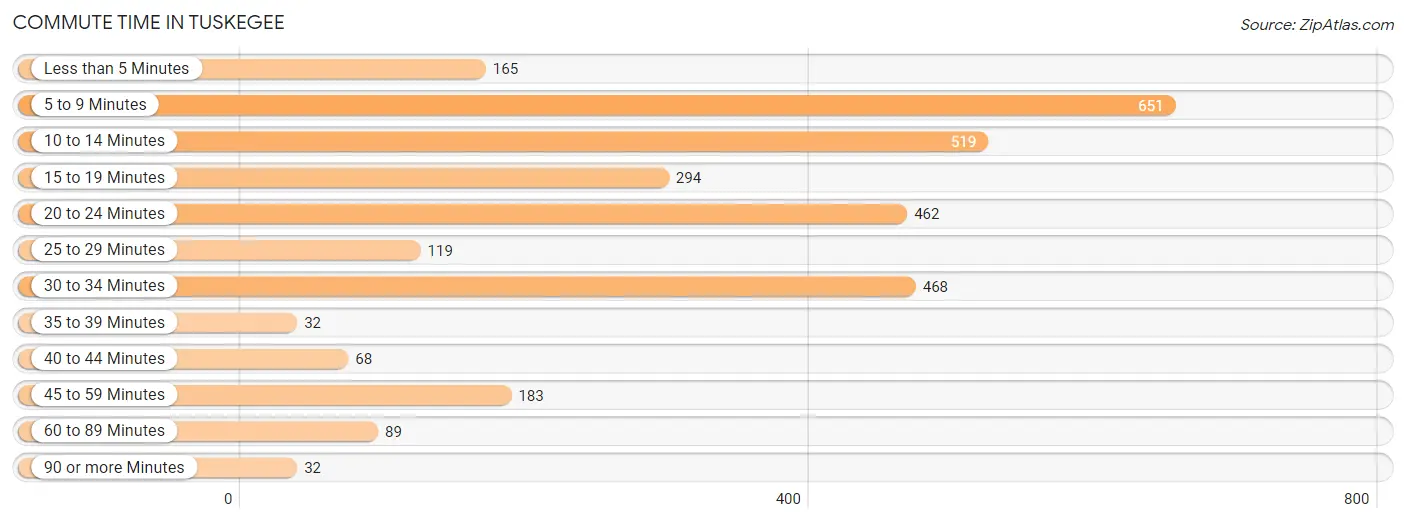
| Commute Time | # Commuters | % Commuters |
| Less than 5 Minutes | 165 | 5.3% |
| 5 to 9 Minutes | 651 | 21.1% |
| 10 to 14 Minutes | 519 | 16.8% |
| 15 to 19 Minutes | 294 | 9.5% |
| 20 to 24 Minutes | 462 | 15.0% |
| 25 to 29 Minutes | 119 | 3.9% |
| 30 to 34 Minutes | 468 | 15.2% |
| 35 to 39 Minutes | 32 | 1.0% |
| 40 to 44 Minutes | 68 | 2.2% |
| 45 to 59 Minutes | 183 | 5.9% |
| 60 to 89 Minutes | 89 | 2.9% |
| 90 or more Minutes | 32 | 1.0% |
Commute Time by Sex in Tuskegee
The most common commute times in Tuskegee are 10 to 14 minutes (228 commuters, 19.4%) for males and 5 to 9 minutes (427 commuters, 22.4%) for females.
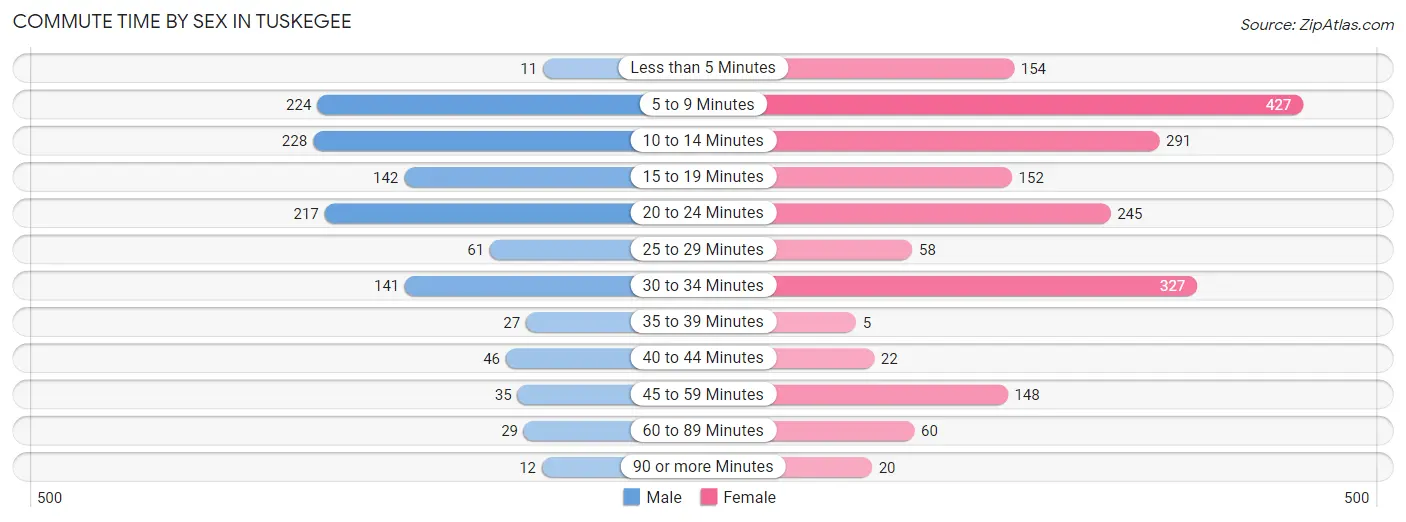
| Commute Time | Male | Female |
| Less than 5 Minutes | 11 (0.9%) | 154 (8.1%) |
| 5 to 9 Minutes | 224 (19.1%) | 427 (22.4%) |
| 10 to 14 Minutes | 228 (19.4%) | 291 (15.2%) |
| 15 to 19 Minutes | 142 (12.1%) | 152 (8.0%) |
| 20 to 24 Minutes | 217 (18.5%) | 245 (12.8%) |
| 25 to 29 Minutes | 61 (5.2%) | 58 (3.0%) |
| 30 to 34 Minutes | 141 (12.0%) | 327 (17.1%) |
| 35 to 39 Minutes | 27 (2.3%) | 5 (0.3%) |
| 40 to 44 Minutes | 46 (3.9%) | 22 (1.1%) |
| 45 to 59 Minutes | 35 (3.0%) | 148 (7.7%) |
| 60 to 89 Minutes | 29 (2.5%) | 60 (3.1%) |
| 90 or more Minutes | 12 (1.0%) | 20 (1.1%) |
Time of Departure to Work by Sex in Tuskegee
The most frequent times of departure to work in Tuskegee are 12:00 PM to 3:59 PM (243, 20.7%) for males and 12:00 PM to 3:59 PM (407, 21.3%) for females.
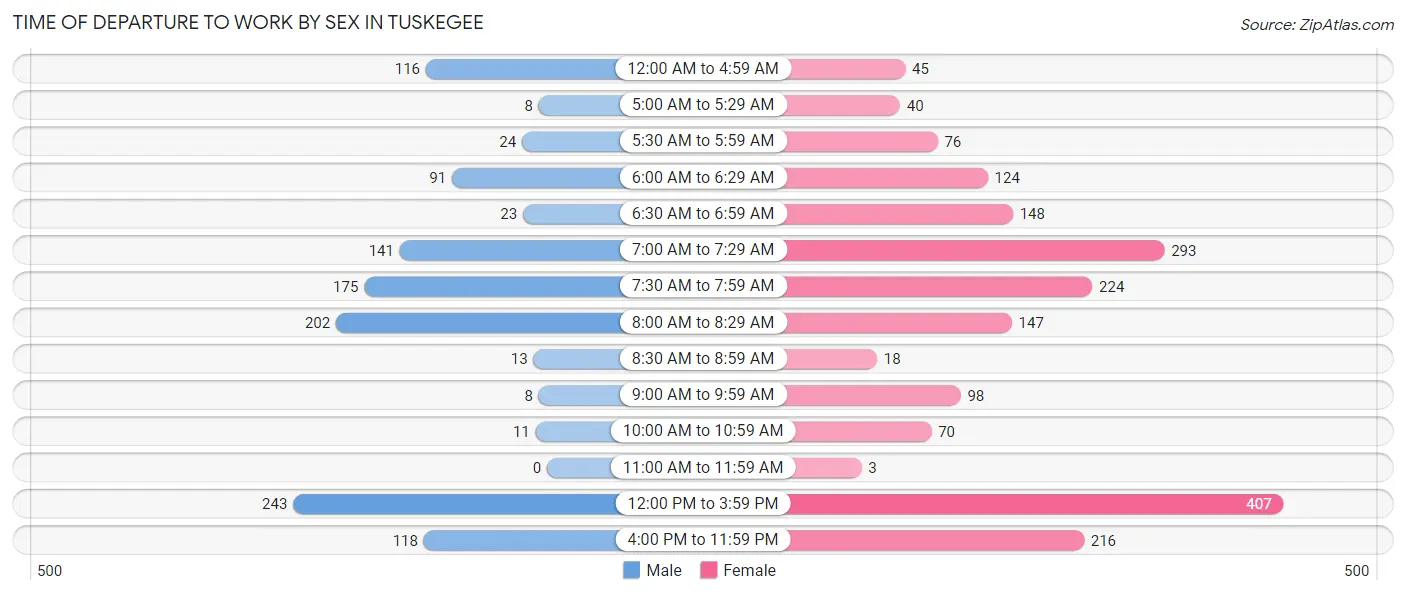
| Time of Departure | Male | Female |
| 12:00 AM to 4:59 AM | 116 (9.9%) | 45 (2.4%) |
| 5:00 AM to 5:29 AM | 8 (0.7%) | 40 (2.1%) |
| 5:30 AM to 5:59 AM | 24 (2.1%) | 76 (4.0%) |
| 6:00 AM to 6:29 AM | 91 (7.8%) | 124 (6.5%) |
| 6:30 AM to 6:59 AM | 23 (2.0%) | 148 (7.7%) |
| 7:00 AM to 7:29 AM | 141 (12.0%) | 293 (15.3%) |
| 7:30 AM to 7:59 AM | 175 (14.9%) | 224 (11.7%) |
| 8:00 AM to 8:29 AM | 202 (17.2%) | 147 (7.7%) |
| 8:30 AM to 8:59 AM | 13 (1.1%) | 18 (0.9%) |
| 9:00 AM to 9:59 AM | 8 (0.7%) | 98 (5.1%) |
| 10:00 AM to 10:59 AM | 11 (0.9%) | 70 (3.7%) |
| 11:00 AM to 11:59 AM | 0 (0.0%) | 3 (0.2%) |
| 12:00 PM to 3:59 PM | 243 (20.7%) | 407 (21.3%) |
| 4:00 PM to 11:59 PM | 118 (10.1%) | 216 (11.3%) |
| Total | 1,173 (100.0%) | 1,909 (100.0%) |
Housing Occupancy in Tuskegee
Occupancy by Ownership in Tuskegee
Of the total 3,150 dwellings in Tuskegee, owner-occupied units account for 1,455 (46.2%), while renter-occupied units make up 1,695 (53.8%).
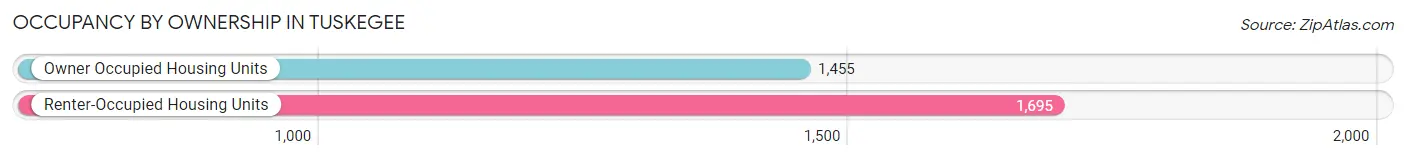
| Occupancy | # Housing Units | % Housing Units |
| Owner Occupied Housing Units | 1,455 | 46.2% |
| Renter-Occupied Housing Units | 1,695 | 53.8% |
| Total Occupied Housing Units | 3,150 | 100.0% |
Occupancy by Household Size in Tuskegee
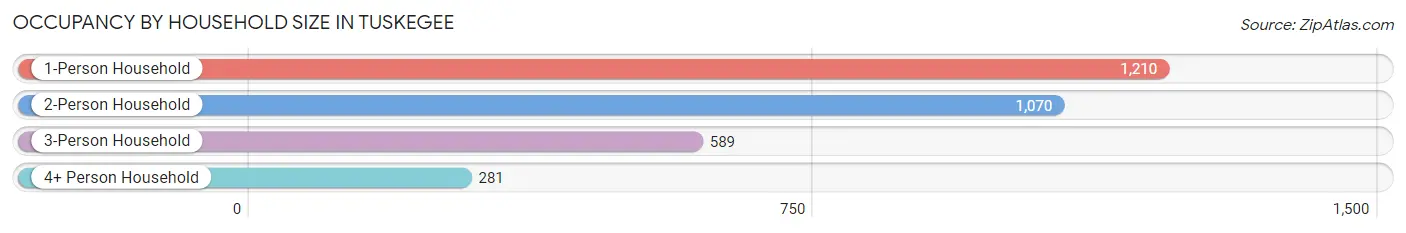
| Household Size | # Housing Units | % Housing Units |
| 1-Person Household | 1,210 | 38.4% |
| 2-Person Household | 1,070 | 34.0% |
| 3-Person Household | 589 | 18.7% |
| 4+ Person Household | 281 | 8.9% |
| Total Housing Units | 3,150 | 100.0% |
Occupancy by Ownership by Household Size in Tuskegee
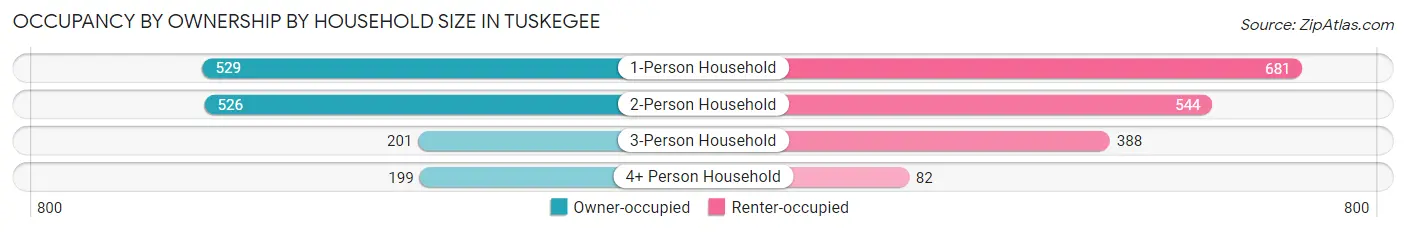
| Household Size | Owner-occupied | Renter-occupied |
| 1-Person Household | 529 (43.7%) | 681 (56.3%) |
| 2-Person Household | 526 (49.2%) | 544 (50.8%) |
| 3-Person Household | 201 (34.1%) | 388 (65.9%) |
| 4+ Person Household | 199 (70.8%) | 82 (29.2%) |
| Total Housing Units | 1,455 (46.2%) | 1,695 (53.8%) |
Occupancy by Educational Attainment in Tuskegee
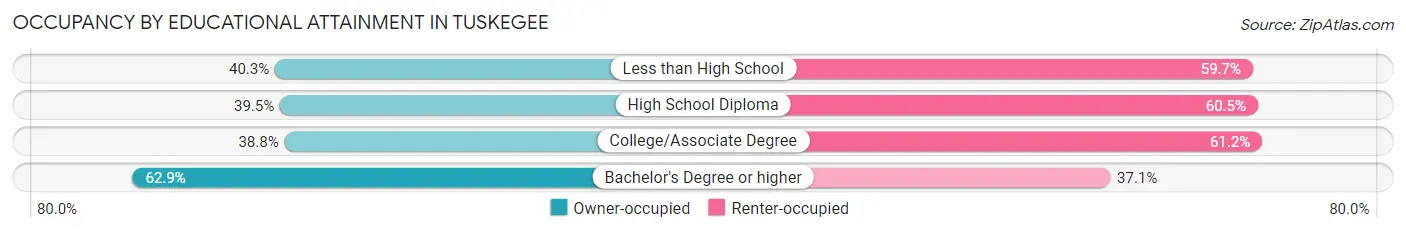
| Household Size | Owner-occupied | Renter-occupied |
| Less than High School | 182 (40.3%) | 270 (59.7%) |
| High School Diploma | 289 (39.5%) | 443 (60.5%) |
| College/Associate Degree | 406 (38.8%) | 641 (61.2%) |
| Bachelor's Degree or higher | 578 (62.9%) | 341 (37.1%) |
Occupancy by Age of Householder in Tuskegee
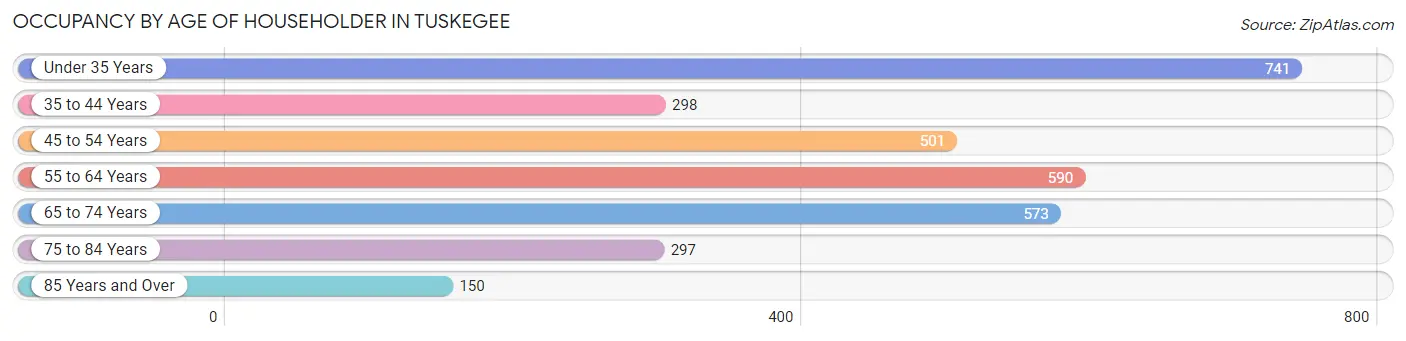
| Age Bracket | # Households | % Households |
| Under 35 Years | 741 | 23.5% |
| 35 to 44 Years | 298 | 9.5% |
| 45 to 54 Years | 501 | 15.9% |
| 55 to 64 Years | 590 | 18.7% |
| 65 to 74 Years | 573 | 18.2% |
| 75 to 84 Years | 297 | 9.4% |
| 85 Years and Over | 150 | 4.8% |
| Total | 3,150 | 100.0% |
Housing Finances in Tuskegee
Median Income by Occupancy in Tuskegee
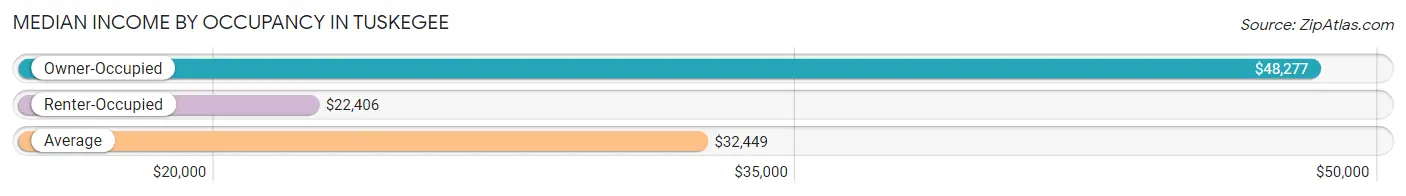
| Occupancy Type | # Households | Median Income |
| Owner-Occupied | 1,455 (46.2%) | $48,277 |
| Renter-Occupied | 1,695 (53.8%) | $22,406 |
| Average | 3,150 (100.0%) | $32,449 |
Occupancy by Householder Income Bracket in Tuskegee
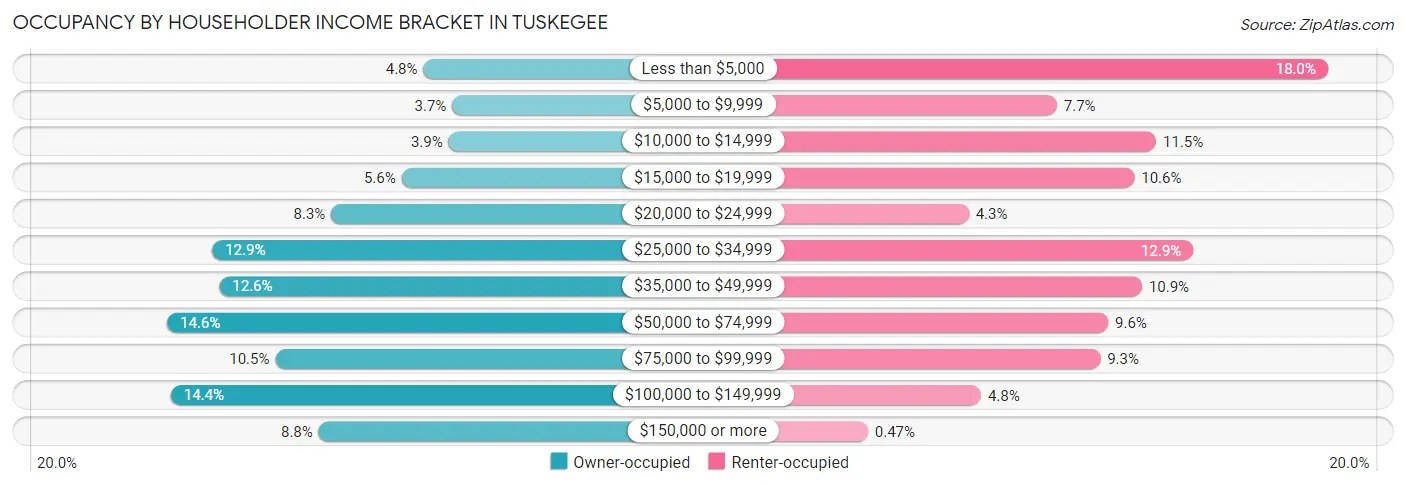
| Income Bracket | Owner-occupied | Renter-occupied |
| Less than $5,000 | 70 (4.8%) | 305 (18.0%) |
| $5,000 to $9,999 | 54 (3.7%) | 130 (7.7%) |
| $10,000 to $14,999 | 56 (3.8%) | 194 (11.5%) |
| $15,000 to $19,999 | 82 (5.6%) | 180 (10.6%) |
| $20,000 to $24,999 | 121 (8.3%) | 73 (4.3%) |
| $25,000 to $34,999 | 187 (12.9%) | 218 (12.9%) |
| $35,000 to $49,999 | 183 (12.6%) | 185 (10.9%) |
| $50,000 to $74,999 | 212 (14.6%) | 163 (9.6%) |
| $75,000 to $99,999 | 152 (10.4%) | 158 (9.3%) |
| $100,000 to $149,999 | 210 (14.4%) | 81 (4.8%) |
| $150,000 or more | 128 (8.8%) | 8 (0.5%) |
| Total | 1,455 (100.0%) | 1,695 (100.0%) |
Monthly Housing Cost Tiers in Tuskegee
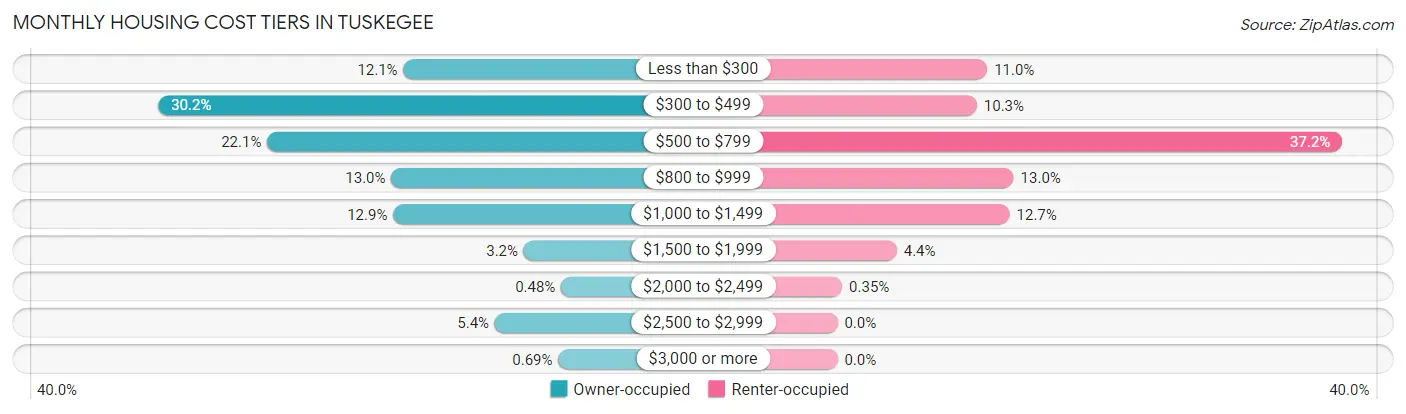
| Monthly Cost | Owner-occupied | Renter-occupied |
| Less than $300 | 176 (12.1%) | 187 (11.0%) |
| $300 to $499 | 439 (30.2%) | 174 (10.3%) |
| $500 to $799 | 322 (22.1%) | 630 (37.2%) |
| $800 to $999 | 189 (13.0%) | 220 (13.0%) |
| $1,000 to $1,499 | 187 (12.9%) | 215 (12.7%) |
| $1,500 to $1,999 | 47 (3.2%) | 74 (4.4%) |
| $2,000 to $2,499 | 7 (0.5%) | 6 (0.4%) |
| $2,500 to $2,999 | 78 (5.4%) | 0 (0.0%) |
| $3,000 or more | 10 (0.7%) | 0 (0.0%) |
| Total | 1,455 (100.0%) | 1,695 (100.0%) |
Physical Housing Characteristics in Tuskegee
Housing Structures in Tuskegee
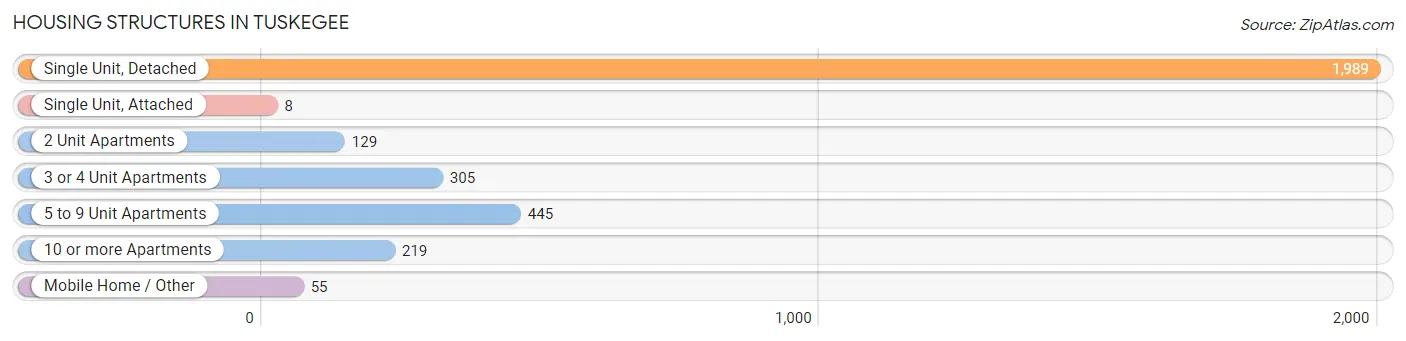
| Structure Type | # Housing Units | % Housing Units |
| Single Unit, Detached | 1,989 | 63.1% |
| Single Unit, Attached | 8 | 0.3% |
| 2 Unit Apartments | 129 | 4.1% |
| 3 or 4 Unit Apartments | 305 | 9.7% |
| 5 to 9 Unit Apartments | 445 | 14.1% |
| 10 or more Apartments | 219 | 7.0% |
| Mobile Home / Other | 55 | 1.8% |
| Total | 3,150 | 100.0% |
Housing Structures by Occupancy in Tuskegee
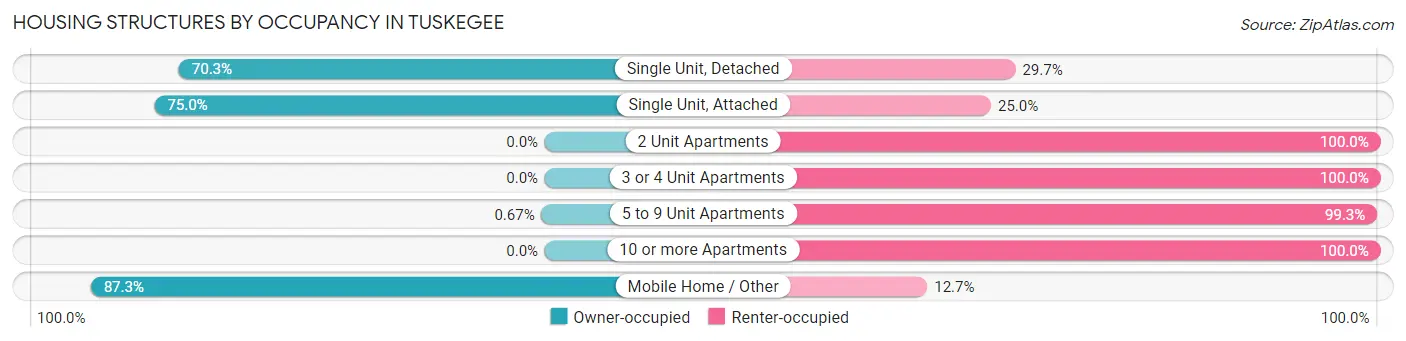
| Structure Type | Owner-occupied | Renter-occupied |
| Single Unit, Detached | 1,398 (70.3%) | 591 (29.7%) |
| Single Unit, Attached | 6 (75.0%) | 2 (25.0%) |
| 2 Unit Apartments | 0 (0.0%) | 129 (100.0%) |
| 3 or 4 Unit Apartments | 0 (0.0%) | 305 (100.0%) |
| 5 to 9 Unit Apartments | 3 (0.7%) | 442 (99.3%) |
| 10 or more Apartments | 0 (0.0%) | 219 (100.0%) |
| Mobile Home / Other | 48 (87.3%) | 7 (12.7%) |
| Total | 1,455 (46.2%) | 1,695 (53.8%) |
Housing Structures by Number of Rooms in Tuskegee
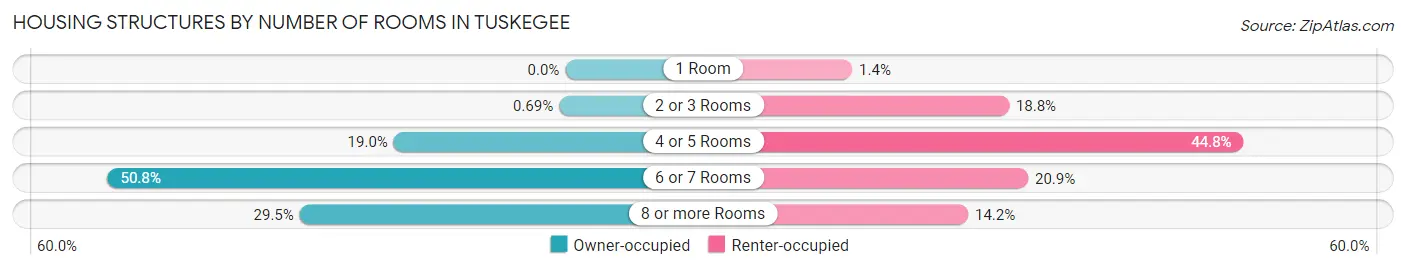
| Number of Rooms | Owner-occupied | Renter-occupied |
| 1 Room | 0 (0.0%) | 23 (1.4%) |
| 2 or 3 Rooms | 10 (0.7%) | 318 (18.8%) |
| 4 or 5 Rooms | 277 (19.0%) | 759 (44.8%) |
| 6 or 7 Rooms | 739 (50.8%) | 354 (20.9%) |
| 8 or more Rooms | 429 (29.5%) | 241 (14.2%) |
| Total | 1,455 (100.0%) | 1,695 (100.0%) |
Housing Structure by Heating Type in Tuskegee
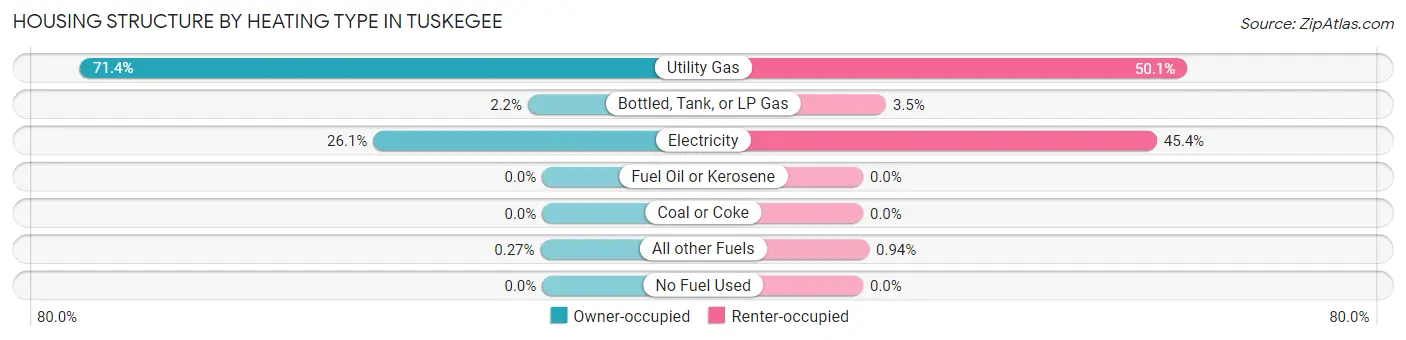
| Heating Type | Owner-occupied | Renter-occupied |
| Utility Gas | 1,039 (71.4%) | 849 (50.1%) |
| Bottled, Tank, or LP Gas | 32 (2.2%) | 60 (3.5%) |
| Electricity | 380 (26.1%) | 770 (45.4%) |
| Fuel Oil or Kerosene | 0 (0.0%) | 0 (0.0%) |
| Coal or Coke | 0 (0.0%) | 0 (0.0%) |
| All other Fuels | 4 (0.3%) | 16 (0.9%) |
| No Fuel Used | 0 (0.0%) | 0 (0.0%) |
| Total | 1,455 (100.0%) | 1,695 (100.0%) |
Household Vehicle Usage in Tuskegee
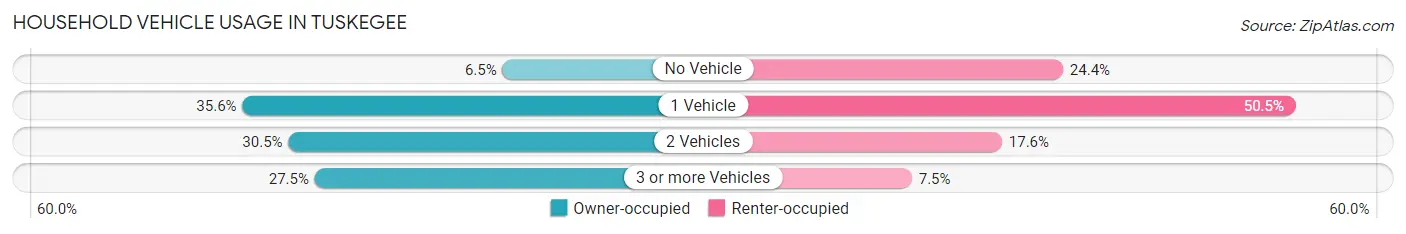
| Vehicles per Household | Owner-occupied | Renter-occupied |
| No Vehicle | 94 (6.5%) | 414 (24.4%) |
| 1 Vehicle | 518 (35.6%) | 856 (50.5%) |
| 2 Vehicles | 443 (30.4%) | 298 (17.6%) |
| 3 or more Vehicles | 400 (27.5%) | 127 (7.5%) |
| Total | 1,455 (100.0%) | 1,695 (100.0%) |
Real Estate & Mortgages in Tuskegee
Real Estate and Mortgage Overview in Tuskegee
| Characteristic | Without Mortgage | With Mortgage |
| Housing Units | 842 | 613 |
| Median Property Value | $94,700 | $96,300 |
| Median Household Income | $41,250 | $83 |
| Monthly Housing Costs | $442 | $10 |
| Real Estate Taxes | $363 | $142 |
Property Value by Mortgage Status in Tuskegee
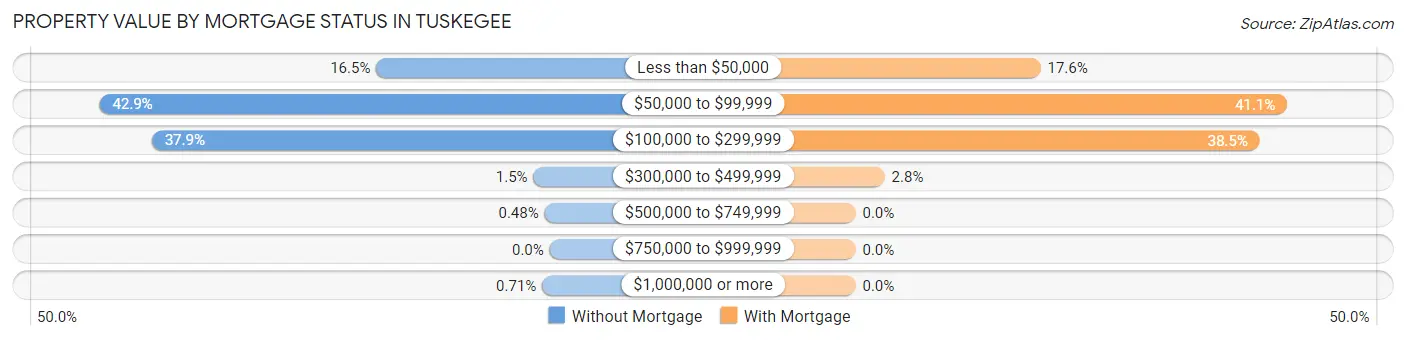
| Property Value | Without Mortgage | With Mortgage |
| Less than $50,000 | 139 (16.5%) | 108 (17.6%) |
| $50,000 to $99,999 | 361 (42.9%) | 252 (41.1%) |
| $100,000 to $299,999 | 319 (37.9%) | 236 (38.5%) |
| $300,000 to $499,999 | 13 (1.5%) | 17 (2.8%) |
| $500,000 to $749,999 | 4 (0.5%) | 0 (0.0%) |
| $750,000 to $999,999 | 0 (0.0%) | 0 (0.0%) |
| $1,000,000 or more | 6 (0.7%) | 0 (0.0%) |
| Total | 842 (100.0%) | 613 (100.0%) |
Household Income by Mortgage Status in Tuskegee
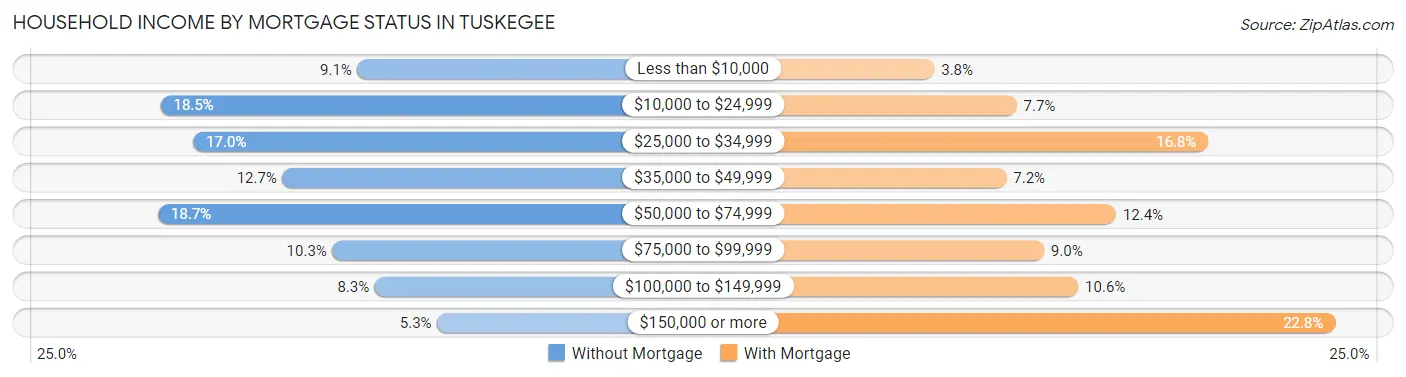
| Household Income | Without Mortgage | With Mortgage |
| Less than $10,000 | 77 (9.1%) | 23 (3.7%) |
| $10,000 to $24,999 | 156 (18.5%) | 47 (7.7%) |
| $25,000 to $34,999 | 143 (17.0%) | 103 (16.8%) |
| $35,000 to $49,999 | 107 (12.7%) | 44 (7.2%) |
| $50,000 to $74,999 | 157 (18.6%) | 76 (12.4%) |
| $75,000 to $99,999 | 87 (10.3%) | 55 (9.0%) |
| $100,000 to $149,999 | 70 (8.3%) | 65 (10.6%) |
| $150,000 or more | 45 (5.3%) | 140 (22.8%) |
| Total | 842 (100.0%) | 613 (100.0%) |
Property Value to Household Income Ratio in Tuskegee
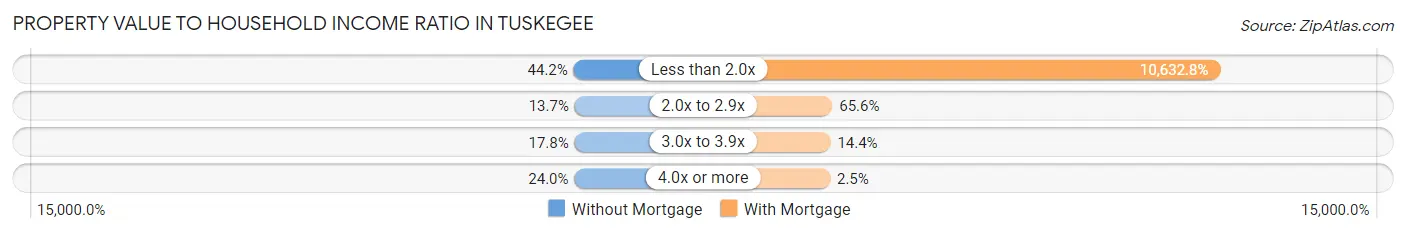
| Value-to-Income Ratio | Without Mortgage | With Mortgage |
| Less than 2.0x | 372 (44.2%) | 65,179 (10,632.8%) |
| 2.0x to 2.9x | 115 (13.7%) | 402 (65.6%) |
| 3.0x to 3.9x | 150 (17.8%) | 88 (14.4%) |
| 4.0x or more | 202 (24.0%) | 15 (2.5%) |
| Total | 842 (100.0%) | 613 (100.0%) |
Real Estate Taxes by Mortgage Status in Tuskegee
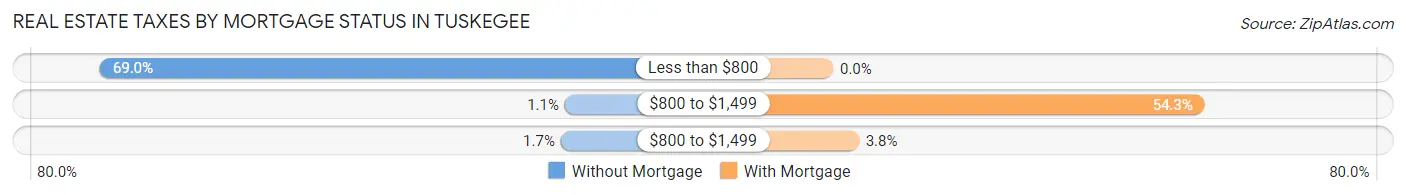
| Property Taxes | Without Mortgage | With Mortgage |
| Less than $800 | 581 (69.0%) | 0 (0.0%) |
| $800 to $1,499 | 9 (1.1%) | 333 (54.3%) |
| $800 to $1,499 | 14 (1.7%) | 23 (3.7%) |
| Total | 842 (100.0%) | 613 (100.0%) |
Health & Disability in Tuskegee
Health Insurance Coverage by Age in Tuskegee
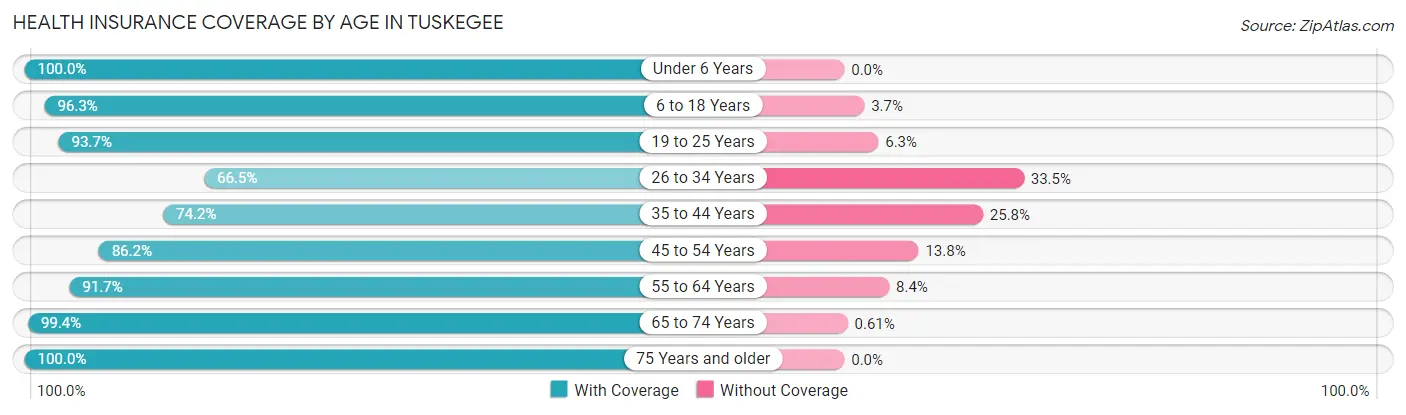
| Age Bracket | With Coverage | Without Coverage |
| Under 6 Years | 454 (100.0%) | 0 (0.0%) |
| 6 to 18 Years | 1,507 (96.3%) | 58 (3.7%) |
| 19 to 25 Years | 2,512 (93.7%) | 170 (6.3%) |
| 26 to 34 Years | 479 (66.5%) | 241 (33.5%) |
| 35 to 44 Years | 465 (74.2%) | 162 (25.8%) |
| 45 to 54 Years | 648 (86.2%) | 104 (13.8%) |
| 55 to 64 Years | 768 (91.6%) | 70 (8.4%) |
| 65 to 74 Years | 815 (99.4%) | 5 (0.6%) |
| 75 Years and older | 548 (100.0%) | 0 (0.0%) |
| Total | 8,196 (91.0%) | 810 (9.0%) |
Health Insurance Coverage by Citizenship Status in Tuskegee
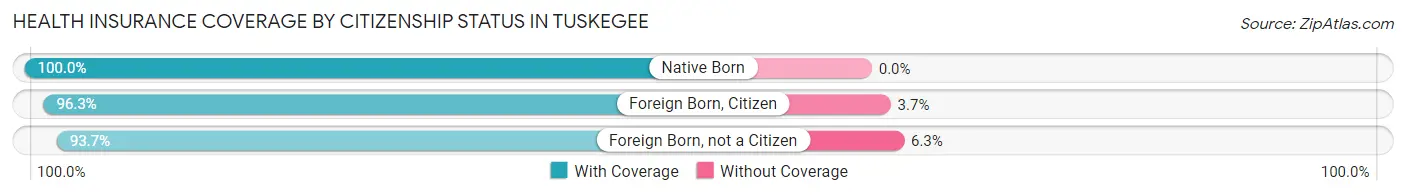
| Citizenship Status | With Coverage | Without Coverage |
| Native Born | 454 (100.0%) | 0 (0.0%) |
| Foreign Born, Citizen | 1,507 (96.3%) | 58 (3.7%) |
| Foreign Born, not a Citizen | 2,512 (93.7%) | 170 (6.3%) |
Health Insurance Coverage by Household Income in Tuskegee
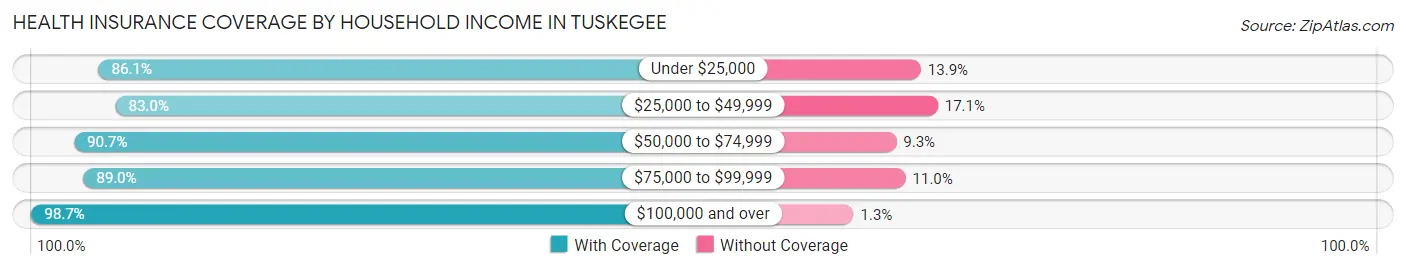
| Household Income | With Coverage | Without Coverage |
| Under $25,000 | 2,073 (86.1%) | 334 (13.9%) |
| $25,000 to $49,999 | 1,148 (83.0%) | 236 (17.1%) |
| $50,000 to $74,999 | 782 (90.7%) | 80 (9.3%) |
| $75,000 to $99,999 | 872 (89.0%) | 108 (11.0%) |
| $100,000 and over | 1,002 (98.7%) | 13 (1.3%) |
Public vs Private Health Insurance Coverage by Age in Tuskegee
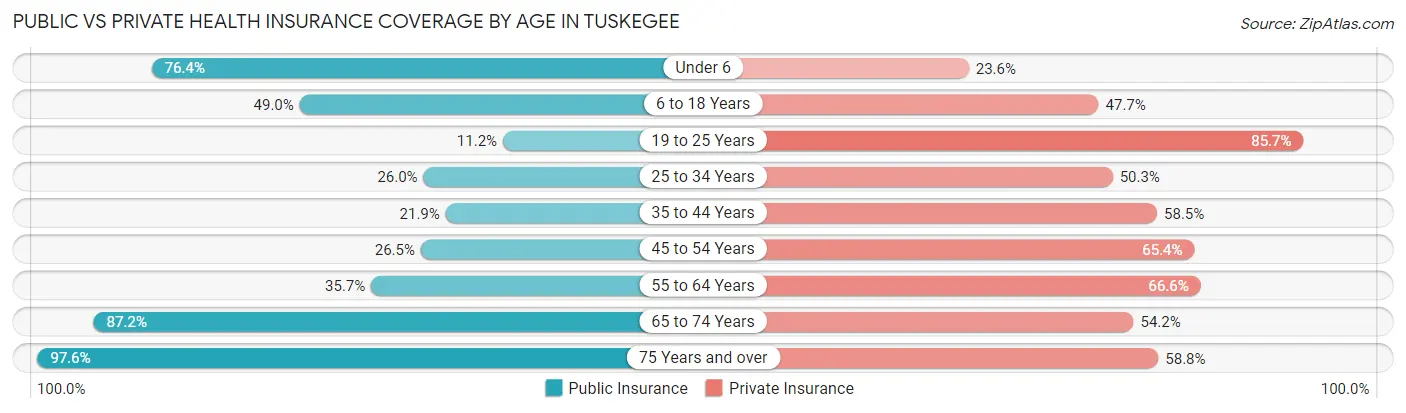
| Age Bracket | Public Insurance | Private Insurance |
| Under 6 | 347 (76.4%) | 107 (23.6%) |
| 6 to 18 Years | 766 (48.9%) | 746 (47.7%) |
| 19 to 25 Years | 301 (11.2%) | 2,297 (85.7%) |
| 25 to 34 Years | 187 (26.0%) | 362 (50.3%) |
| 35 to 44 Years | 137 (21.8%) | 367 (58.5%) |
| 45 to 54 Years | 199 (26.5%) | 492 (65.4%) |
| 55 to 64 Years | 299 (35.7%) | 558 (66.6%) |
| 65 to 74 Years | 715 (87.2%) | 444 (54.1%) |
| 75 Years and over | 535 (97.6%) | 322 (58.8%) |
| Total | 3,486 (38.7%) | 5,695 (63.2%) |
Disability Status by Sex by Age in Tuskegee
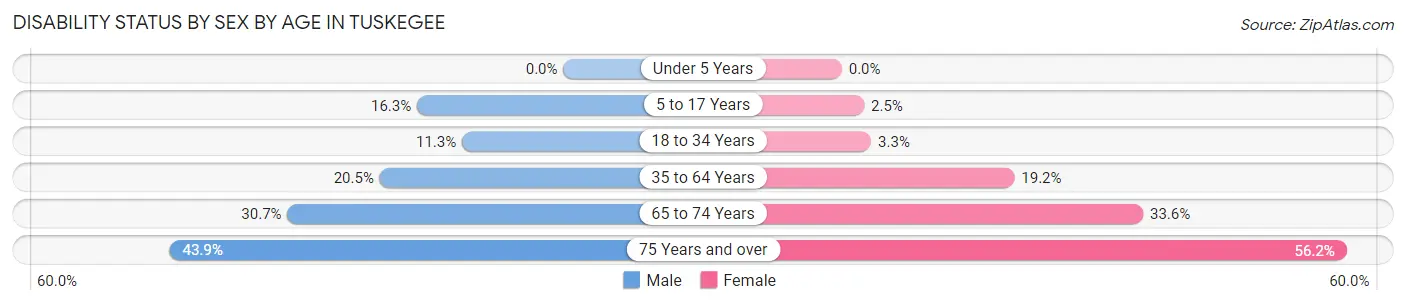
| Age Bracket | Male | Female |
| Under 5 Years | 0 (0.0%) | 0 (0.0%) |
| 5 to 17 Years | 73 (16.3%) | 14 (2.5%) |
| 18 to 34 Years | 168 (11.3%) | 82 (3.3%) |
| 35 to 64 Years | 198 (20.4%) | 240 (19.2%) |
| 65 to 74 Years | 110 (30.7%) | 155 (33.6%) |
| 75 Years and over | 57 (43.9%) | 235 (56.2%) |
Disability Class by Sex by Age in Tuskegee
Disability Class: Hearing Difficulty
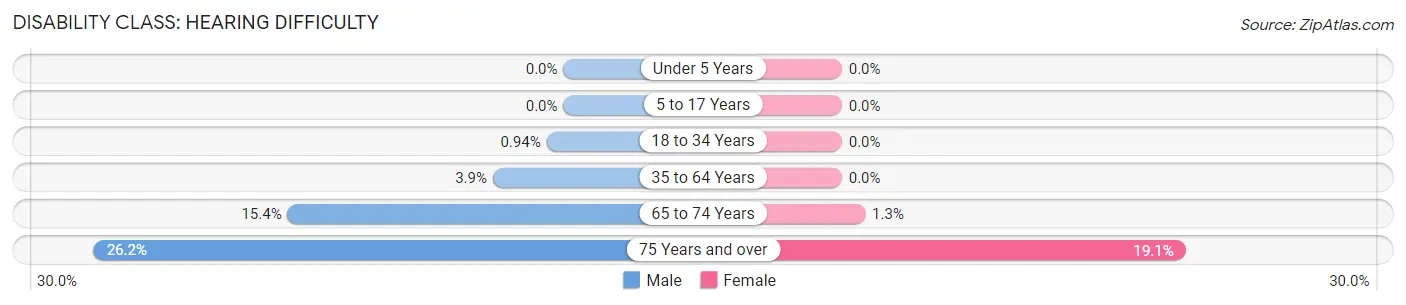
| Age Bracket | Male | Female |
| Under 5 Years | 0 (0.0%) | 0 (0.0%) |
| 5 to 17 Years | 0 (0.0%) | 0 (0.0%) |
| 18 to 34 Years | 14 (0.9%) | 0 (0.0%) |
| 35 to 64 Years | 38 (3.9%) | 0 (0.0%) |
| 65 to 74 Years | 55 (15.4%) | 6 (1.3%) |
| 75 Years and over | 34 (26.2%) | 80 (19.1%) |
Disability Class: Vision Difficulty
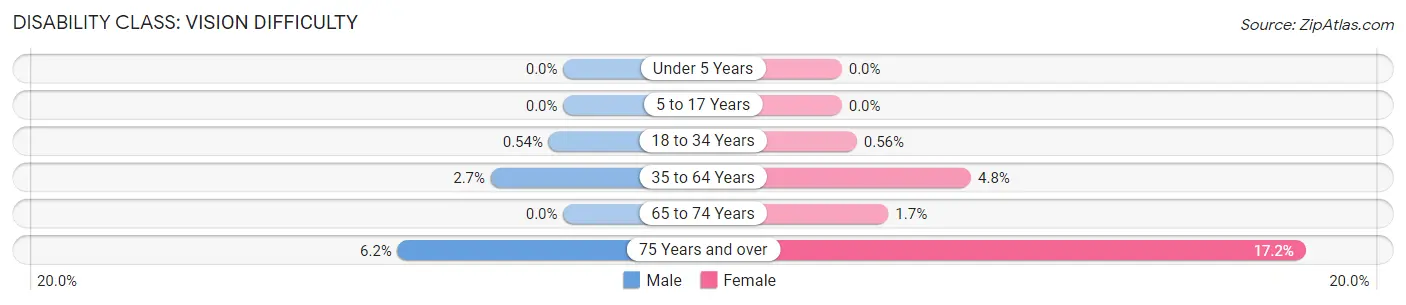
| Age Bracket | Male | Female |
| Under 5 Years | 0 (0.0%) | 0 (0.0%) |
| 5 to 17 Years | 0 (0.0%) | 0 (0.0%) |
| 18 to 34 Years | 8 (0.5%) | 14 (0.6%) |
| 35 to 64 Years | 26 (2.7%) | 60 (4.8%) |
| 65 to 74 Years | 0 (0.0%) | 8 (1.7%) |
| 75 Years and over | 8 (6.1%) | 72 (17.2%) |
Disability Class: Cognitive Difficulty
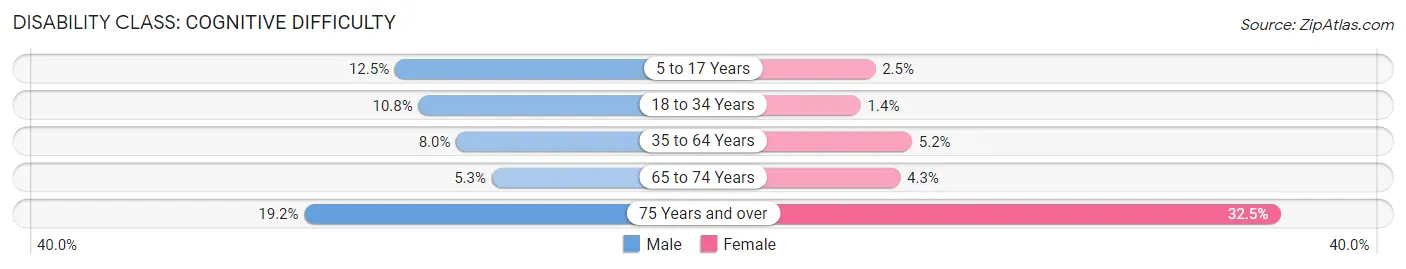
| Age Bracket | Male | Female |
| 5 to 17 Years | 56 (12.5%) | 14 (2.5%) |
| 18 to 34 Years | 160 (10.7%) | 35 (1.4%) |
| 35 to 64 Years | 77 (8.0%) | 65 (5.2%) |
| 65 to 74 Years | 19 (5.3%) | 20 (4.3%) |
| 75 Years and over | 25 (19.2%) | 136 (32.5%) |
Disability Class: Ambulatory Difficulty
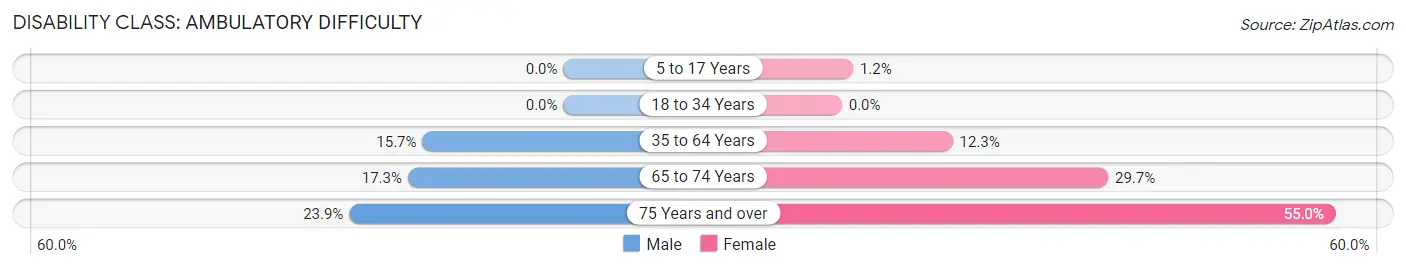
| Age Bracket | Male | Female |
| 5 to 17 Years | 0 (0.0%) | 7 (1.2%) |
| 18 to 34 Years | 0 (0.0%) | 0 (0.0%) |
| 35 to 64 Years | 152 (15.7%) | 154 (12.3%) |
| 65 to 74 Years | 62 (17.3%) | 137 (29.6%) |
| 75 Years and over | 31 (23.8%) | 230 (55.0%) |
Disability Class: Self-Care Difficulty
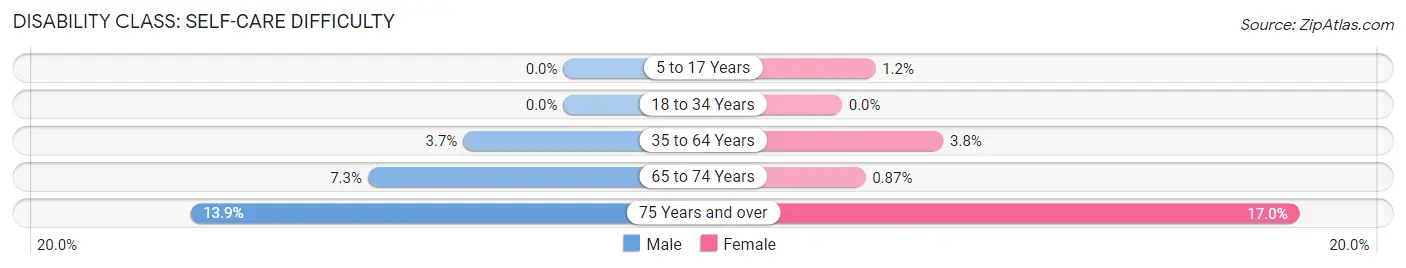
| Age Bracket | Male | Female |
| 5 to 17 Years | 0 (0.0%) | 7 (1.2%) |
| 18 to 34 Years | 0 (0.0%) | 0 (0.0%) |
| 35 to 64 Years | 36 (3.7%) | 47 (3.8%) |
| 65 to 74 Years | 26 (7.3%) | 4 (0.9%) |
| 75 Years and over | 18 (13.9%) | 71 (17.0%) |
Technology Access in Tuskegee
Computing Device Access in Tuskegee
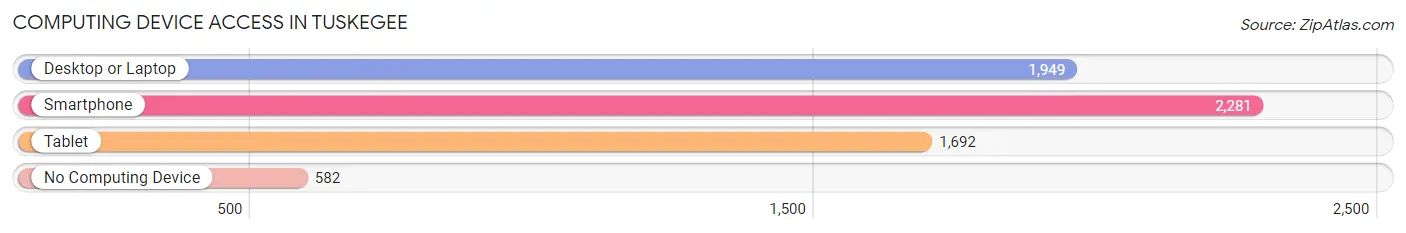
| Device Type | # Households | % Households |
| Desktop or Laptop | 1,949 | 61.9% |
| Smartphone | 2,281 | 72.4% |
| Tablet | 1,692 | 53.7% |
| No Computing Device | 582 | 18.5% |
| Total | 3,150 | 100.0% |
Internet Access in Tuskegee
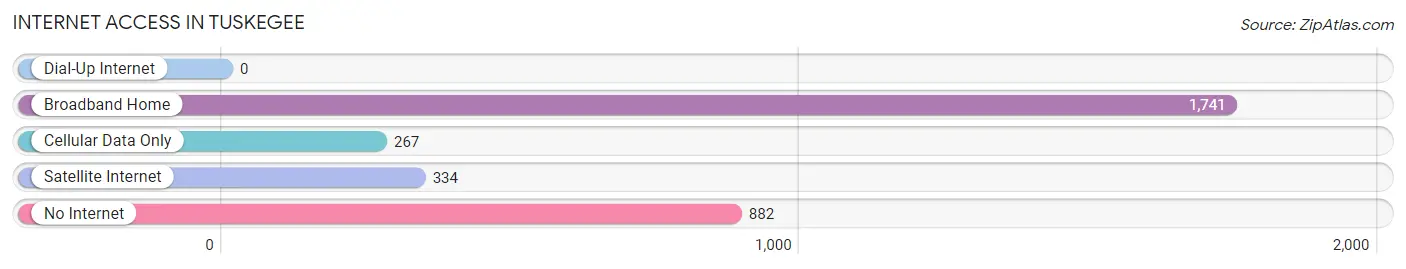
| Internet Type | # Households | % Households |
| Dial-Up Internet | 0 | 0.0% |
| Broadband Home | 1,741 | 55.3% |
| Cellular Data Only | 267 | 8.5% |
| Satellite Internet | 334 | 10.6% |
| No Internet | 882 | 28.0% |
| Total | 3,150 | 100.0% |
Tuskegee Summary
Tuskegee, Alabama is a small city located in Macon County, Alabama. It is located about 30 miles east of Montgomery, the state capital. The city is best known for its association with the Tuskegee Institute, which was founded in 1881 by Booker T. Washington. The city has a population of 9,865 as of the 2010 census.
History
Tuskegee was founded in 1833 by General Thomas Simpson Woodward, a Creek Indian who had served in the War of 1812. He named the town after the Creek Indian word for “warrior.” The town was incorporated in 1843 and was the county seat of Macon County.
Tuskegee was an important center of African American education and culture in the late 19th and early 20th centuries. In 1881, Booker T. Washington founded the Tuskegee Institute, which became a major center of African American education and culture. The institute was the first African American college in the United States and was the first to offer a degree in agriculture.
The city was also the site of the famous Tuskegee Airmen, a group of African American pilots who served in World War II. The Tuskegee Airmen were the first African American military aviators in the United States Armed Forces.
Geography
Tuskegee is located in Macon County, Alabama. It is situated in the Black Belt region of the state, which is characterized by its rich, fertile soil. The city is located about 30 miles east of Montgomery, the state capital.
The city has a total area of 8.2 square miles, all of which is land. The city is located at an elevation of about 300 feet above sea level. The climate is humid subtropical, with hot, humid summers and mild winters.
Economy
Tuskegee’s economy is largely based on agriculture and education. The city is home to the Tuskegee Institute, which is a major employer in the area. The institute is also a major source of education and research in the area.
The city is also home to several other businesses, including a number of manufacturing companies. The city is also home to a number of small businesses, including restaurants, retail stores, and other services.
Demographics
As of the 2010 census, Tuskegee had a population of 9,865. The racial makeup of the city was 57.3% African American, 37.2% White, 0.3% Native American, 0.2% Asian, 0.1% Pacific Islander, and 4.9% from other races.
The median household income in the city was $25,945, and the median family income was $31,919. The per capita income in the city was $14,945. About 22.2% of the population was below the poverty line.
Tuskegee is a small city with a rich history and culture. It is best known for its association with the Tuskegee Institute, which was founded in 1881 by Booker T. Washington. The city has a diverse economy and is home to a number of businesses and educational institutions. The city has a population of 9,865 as of the 2010 census.
Common Questions
What is Per Capita Income in Tuskegee?
Per Capita income in Tuskegee is $18,922.
What is the Median Family Income in Tuskegee?
Median Family Income in Tuskegee is $47,841.
What is the Median Household income in Tuskegee?
Median Household Income in Tuskegee is $32,449.
What is Income or Wage Gap in Tuskegee?
Income or Wage Gap in Tuskegee is 50.2%.
Women in Tuskegee earn 49.8 cents for every dollar earned by a man.
What is Family Income Deficit in Tuskegee?
Family Income Deficit in Tuskegee is $11,622.
Families that are below poverty line in Tuskegee earn $11,622 less on average than the poverty threshold level.
What is Inequality or Gini Index in Tuskegee?
Inequality or Gini Index in Tuskegee is 0.54.
What is the Total Population of Tuskegee?
Total Population of Tuskegee is 9,173.
What is the Total Male Population of Tuskegee?
Total Male Population of Tuskegee is 3,803.
What is the Total Female Population of Tuskegee?
Total Female Population of Tuskegee is 5,370.
What is the Ratio of Males per 100 Females in Tuskegee?
There are 70.82 Males per 100 Females in Tuskegee.
What is the Ratio of Females per 100 Males in Tuskegee?
There are 141.20 Females per 100 Males in Tuskegee.
What is the Median Population Age in Tuskegee?
Median Population Age in Tuskegee is 24.5 Years.
What is the Average Family Size in Tuskegee
Average Family Size in Tuskegee is 2.7 People.
What is the Average Household Size in Tuskegee
Average Household Size in Tuskegee is 2.1 People.
How Large is the Labor Force in Tuskegee?
There are 3,821 People in the Labor Forcein in Tuskegee.
What is the Percentage of People in the Labor Force in Tuskegee?
48.1% of People are in the Labor Force in Tuskegee.
What is the Unemployment Rate in Tuskegee?
Unemployment Rate in Tuskegee is 11.3%.