Zip Codes with the Highest Percentage of Population Employed in Legal Services & Support in Birmingham, AL
RELATED REPORTS & OPTIONS
Legal Services & Support
Birmingham
Compare Zip Codes
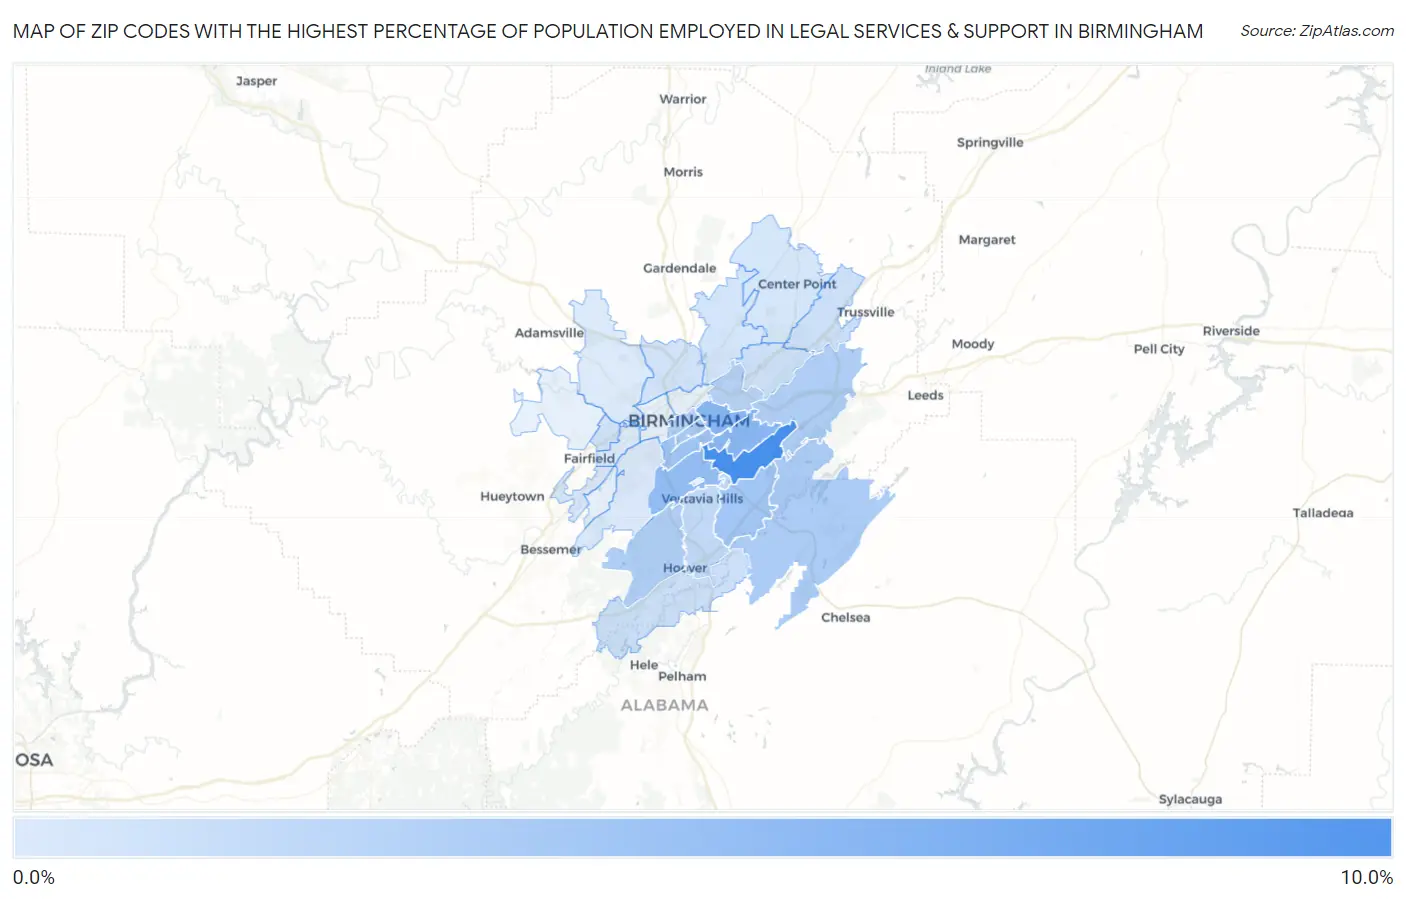
Map of Zip Codes with the Highest Percentage of Population Employed in Legal Services & Support in Birmingham
0.077%
9.2%
Zip Codes with the Highest Percentage of Population Employed in Legal Services & Support in Birmingham, AL
| Zip Code | % Employed | vs State | vs National | |
| 1. | 35223 | 9.2% | 0.90%(+8.33)#2 | 1.2%(+8.05)#185 |
| 2. | 35222 | 5.1% | 0.90%(+4.24)#7 | 1.2%(+3.95)#684 |
| 3. | 35213 | 5.1% | 0.90%(+4.20)#8 | 1.2%(+3.91)#694 |
| 4. | 35209 | 4.5% | 0.90%(+3.60)#11 | 1.2%(+3.31)#900 |
| 5. | 35205 | 3.6% | 0.90%(+2.70)#20 | 1.2%(+2.41)#1,352 |
| 6. | 35243 | 3.6% | 0.90%(+2.65)#21 | 1.2%(+2.37)#1,390 |
| 7. | 35233 | 3.3% | 0.90%(+2.39)#23 | 1.2%(+2.11)#1,584 |
| 8. | 35242 | 2.9% | 0.90%(+2.04)#30 | 1.2%(+1.75)#1,922 |
| 9. | 35210 | 2.9% | 0.90%(+1.96)#31 | 1.2%(+1.67)#2,017 |
| 10. | 35226 | 2.7% | 0.90%(+1.83)#33 | 1.2%(+1.54)#2,169 |
| 11. | 35203 | 2.5% | 0.90%(+1.63)#42 | 1.2%(+1.34)#2,473 |
| 12. | 35212 | 2.3% | 0.90%(+1.38)#49 | 1.2%(+1.09)#2,883 |
| 13. | 35216 | 1.7% | 0.90%(+0.804)#66 | 1.2%(+0.517)#4,312 |
| 14. | 35244 | 1.0% | 0.90%(+0.132)#120 | 1.2%(-0.155)#7,626 |
| 15. | 35235 | 1.0% | 0.90%(+0.114)#121 | 1.2%(-0.173)#7,745 |
| 16. | 35206 | 0.83% | 0.90%(-0.063)#141 | 1.2%(-0.350)#9,159 |
| 17. | 35218 | 0.70% | 0.90%(-0.192)#171 | 1.2%(-0.479)#10,359 |
| 18. | 35207 | 0.70% | 0.90%(-0.194)#172 | 1.2%(-0.481)#10,378 |
| 19. | 35217 | 0.58% | 0.90%(-0.319)#205 | 1.2%(-0.606)#11,721 |
| 20. | 35215 | 0.54% | 0.90%(-0.359)#210 | 1.2%(-0.646)#12,169 |
| 21. | 35228 | 0.23% | 0.90%(-0.670)#278 | 1.2%(-0.957)#15,914 |
| 22. | 35211 | 0.15% | 0.90%(-0.749)#297 | 1.2%(-1.04)#16,706 |
| 23. | 35214 | 0.13% | 0.90%(-0.771)#304 | 1.2%(-1.06)#16,901 |
| 24. | 35208 | 0.077% | 0.90%(-0.820)#314 | 1.2%(-1.11)#17,287 |
1
Common Questions
What are the Top 10 Zip Codes with the Highest Percentage of Population Employed in Legal Services & Support in Birmingham, AL?
Top 10 Zip Codes with the Highest Percentage of Population Employed in Legal Services & Support in Birmingham, AL are:
What zip code has the Highest Percentage of Population Employed in Legal Services & Support in Birmingham, AL?
35223 has the Highest Percentage of Population Employed in Legal Services & Support in Birmingham, AL with 9.2%.
What is the Percentage of Population Employed in Legal Services & Support in Birmingham, AL?
Percentage of Population Employed in Legal Services & Support in Birmingham is 1.5%.
What is the Percentage of Population Employed in Legal Services & Support in Alabama?
Percentage of Population Employed in Legal Services & Support in Alabama is 0.90%.
What is the Percentage of Population Employed in Legal Services & Support in the United States?
Percentage of Population Employed in Legal Services & Support in the United States is 1.2%.