Perdido Beach, AL Map & Demographics
Perdido Beach Map
Perdido Beach Overview
$45,359
PER CAPITA INCOME
$84,583
AVG FAMILY INCOME
$76,389
AVG HOUSEHOLD INCOME
63.4%
WAGE / INCOME GAP [ % ]
36.6¢/ $1
WAGE / INCOME GAP [ $ ]
0.40
INEQUALITY / GINI INDEX
464
TOTAL POPULATION
244
MALE POPULATION
220
FEMALE POPULATION
110.91
MALES / 100 FEMALES
90.16
FEMALES / 100 MALES
62.4
MEDIAN AGE
2.4
AVG FAMILY SIZE
2.0
AVG HOUSEHOLD SIZE
200
LABOR FORCE [ PEOPLE ]
47.7%
PERCENT IN LABOR FORCE
3.0%
UNEMPLOYMENT RATE
Perdido Beach Area Codes
Income in Perdido Beach
Income Overview in Perdido Beach
Per Capita Income in Perdido Beach is $45,359, while median incomes of families and households are $84,583 and $76,389 respectively.
| Characteristic | Number | Measure |
| Per Capita Income | 464 | $45,359 |
| Median Family Income | 153 | $84,583 |
| Mean Family Income | 153 | $93,231 |
| Median Household Income | 228 | $76,389 |
| Mean Household Income | 228 | $92,047 |
| Income Deficit | 153 | $0 |
| Wage / Income Gap (%) | 464 | 63.42% |
| Wage / Income Gap ($) | 464 | 36.58¢ per $1 |
| Gini / Inequality Index | 464 | 0.40 |
Earnings by Sex in Perdido Beach
Average Earnings in Perdido Beach are $41,875, $64,000 for men and $23,409 for women, a difference of 63.4%.
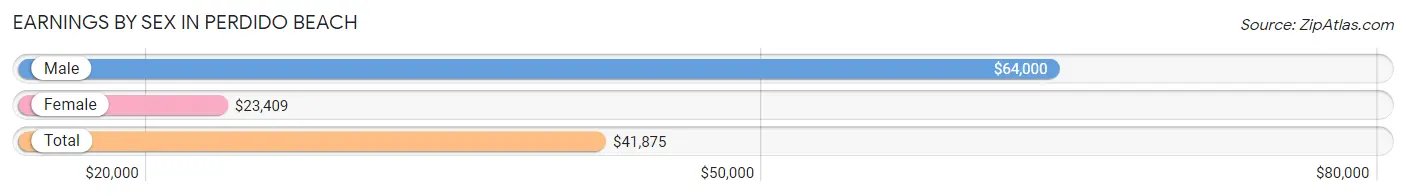
| Sex | Number | Average Earnings |
| Male | 128 (61.0%) | $64,000 |
| Female | 82 (39.1%) | $23,409 |
| Total | 210 (100.0%) | $41,875 |
Earnings by Sex by Income Bracket in Perdido Beach
The most common earnings brackets in Perdido Beach are $75,000 to $99,999 for men (32 | 25.0%) and $22,500 to $24,999 for women (11 | 13.4%).
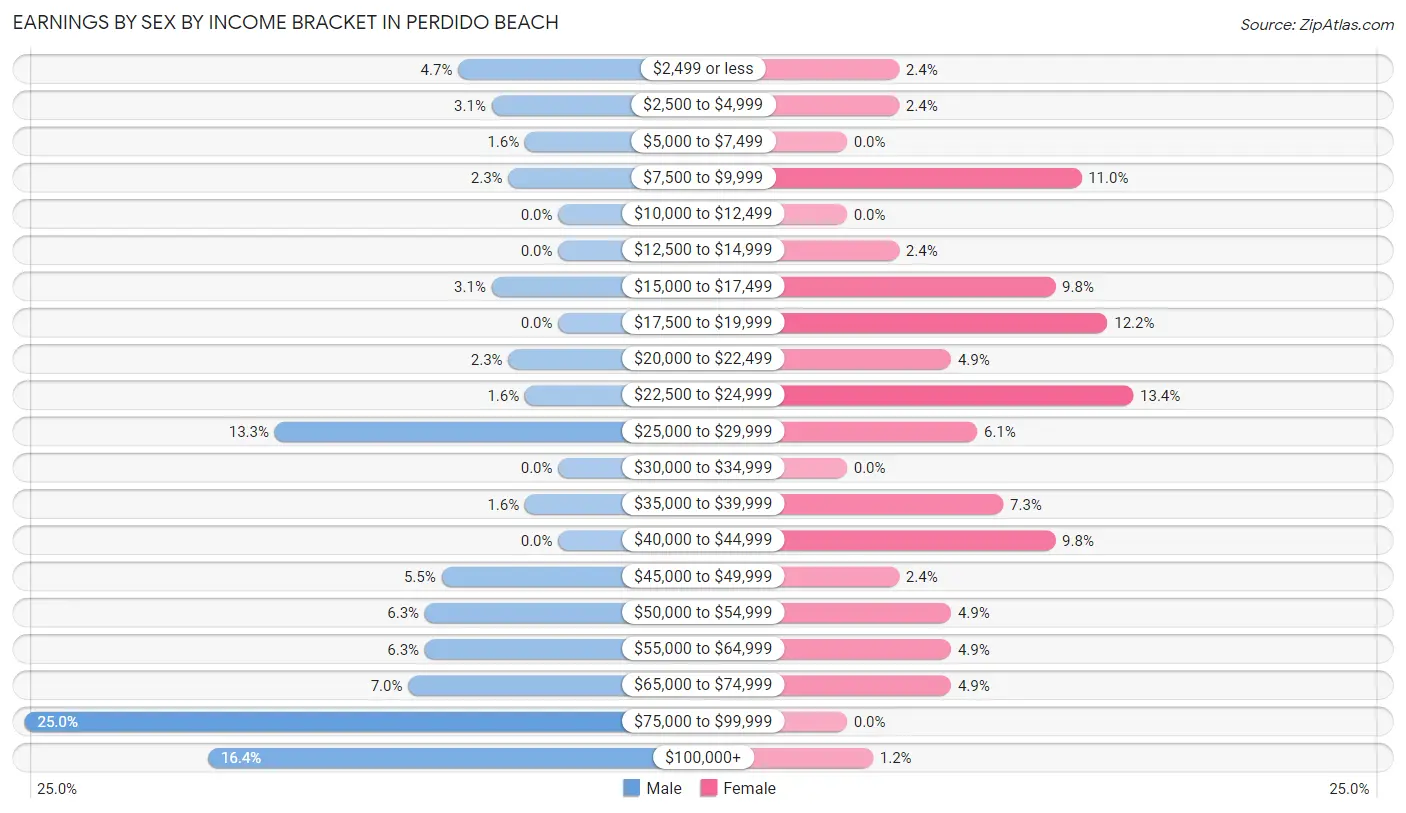
| Income | Male | Female |
| $2,499 or less | 6 (4.7%) | 2 (2.4%) |
| $2,500 to $4,999 | 4 (3.1%) | 2 (2.4%) |
| $5,000 to $7,499 | 2 (1.6%) | 0 (0.0%) |
| $7,500 to $9,999 | 3 (2.3%) | 9 (11.0%) |
| $10,000 to $12,499 | 0 (0.0%) | 0 (0.0%) |
| $12,500 to $14,999 | 0 (0.0%) | 2 (2.4%) |
| $15,000 to $17,499 | 4 (3.1%) | 8 (9.8%) |
| $17,500 to $19,999 | 0 (0.0%) | 10 (12.2%) |
| $20,000 to $22,499 | 3 (2.3%) | 4 (4.9%) |
| $22,500 to $24,999 | 2 (1.6%) | 11 (13.4%) |
| $25,000 to $29,999 | 17 (13.3%) | 5 (6.1%) |
| $30,000 to $34,999 | 0 (0.0%) | 0 (0.0%) |
| $35,000 to $39,999 | 2 (1.6%) | 6 (7.3%) |
| $40,000 to $44,999 | 0 (0.0%) | 8 (9.8%) |
| $45,000 to $49,999 | 7 (5.5%) | 2 (2.4%) |
| $50,000 to $54,999 | 8 (6.2%) | 4 (4.9%) |
| $55,000 to $64,999 | 8 (6.2%) | 4 (4.9%) |
| $65,000 to $74,999 | 9 (7.0%) | 4 (4.9%) |
| $75,000 to $99,999 | 32 (25.0%) | 0 (0.0%) |
| $100,000+ | 21 (16.4%) | 1 (1.2%) |
| Total | 128 (100.0%) | 82 (100.0%) |
Earnings by Sex by Educational Attainment in Perdido Beach
Average earnings in Perdido Beach are $64,750 for men and $23,625 for women, a difference of 63.5%. Men with an educational attainment of graduate degree enjoy the highest average annual earnings of $78,600, while those with high school diploma education earn the least with $28,594. Women with an educational attainment of graduate degree earn the most with the average annual earnings of $41,250, while those with college or associate's degree education have the smallest earnings of $17,917.
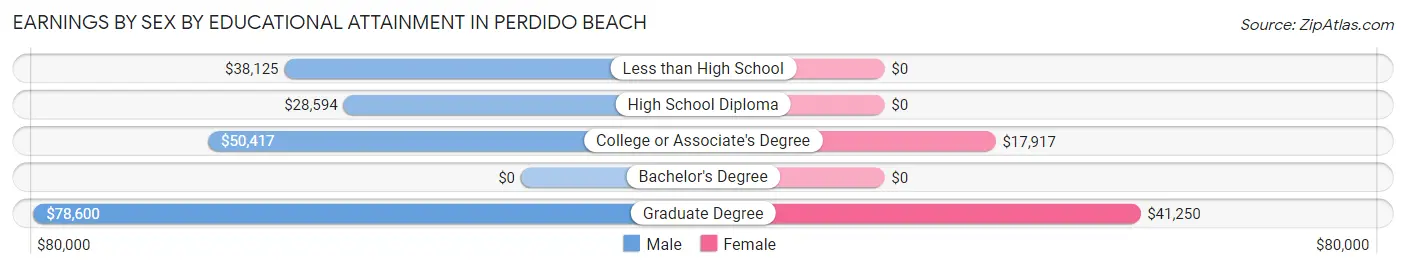
| Educational Attainment | Male Income | Female Income |
| Less than High School | $38,125 | $0 |
| High School Diploma | $28,594 | $0 |
| College or Associate's Degree | $50,417 | $17,917 |
| Bachelor's Degree | - | - |
| Graduate Degree | $78,600 | $41,250 |
| Total | $64,750 | $23,625 |
Family Income in Perdido Beach
Family Income Brackets in Perdido Beach
According to the Perdido Beach family income data, there are 49 families falling into the $75,000 to $99,999 income range, which is the most common income bracket and makes up 32.0% of all families.
| Income Bracket | # Families | % Families |
| Less than $10,000 | 4 | 2.6% |
| $10,000 to $14,999 | 0 | 0.0% |
| $15,000 to $24,999 | 0 | 0.0% |
| $25,000 to $34,999 | 6 | 3.9% |
| $35,000 to $49,999 | 25 | 16.3% |
| $50,000 to $74,999 | 29 | 19.0% |
| $75,000 to $99,999 | 49 | 32.0% |
| $100,000 to $149,999 | 18 | 11.8% |
| $150,000 to $199,999 | 13 | 8.5% |
| $200,000+ | 9 | 5.9% |
Family Income by Famaliy Size in Perdido Beach
2-person families (119 | 77.8%) account for the highest median family income in Perdido Beach with $87,917 per family, while 2-person families (119 | 77.8%) have the highest median income of $43,958 per family member.
| Income Bracket | # Families | Median Income |
| 2-Person Families | 119 (77.8%) | $87,917 |
| 3-Person Families | 24 (15.7%) | $68,750 |
| 4-Person Families | 6 (3.9%) | $0 |
| 5-Person Families | 2 (1.3%) | $0 |
| 6-Person Families | 0 (0.0%) | $0 |
| 7+ Person Families | 2 (1.3%) | $0 |
| Total | 153 (100.0%) | $84,583 |
Family Income by Number of Earners in Perdido Beach
The median family income in Perdido Beach is $84,583, with families comprising 3+ earners (8) having the highest median family income of $138,750, while families with 2 earners (33) have the lowest median family income of $83,250, accounting for 5.2% and 21.6% of families, respectively.
| Number of Earners | # Families | Median Income |
| No Earners | 43 (28.1%) | $83,281 |
| 1 Earner | 69 (45.1%) | $95,050 |
| 2 Earners | 33 (21.6%) | $83,250 |
| 3+ Earners | 8 (5.2%) | $138,750 |
| Total | 153 (100.0%) | $84,583 |
Household Income in Perdido Beach
Household Income Brackets in Perdido Beach
With 60 households falling in the category, the $75,000 to $99,999 income range is the most frequent in Perdido Beach, accounting for 26.3% of all households. In contrast, only 2 households (0.9%) fall into the $10,000 to $14,999 income bracket, making it the least populous group.
| Income Bracket | # Households | % Households |
| Less than $10,000 | 10 | 4.4% |
| $10,000 to $14,999 | 2 | 0.9% |
| $15,000 to $24,999 | 11 | 4.8% |
| $25,000 to $34,999 | 6 | 2.6% |
| $35,000 to $49,999 | 40 | 17.5% |
| $50,000 to $74,999 | 40 | 17.5% |
| $75,000 to $99,999 | 60 | 26.3% |
| $100,000 to $149,999 | 26 | 11.4% |
| $150,000 to $199,999 | 15 | 6.6% |
| $200,000+ | 18 | 7.9% |
Household Income by Householder Age in Perdido Beach
The median household income in Perdido Beach is $76,389, with the highest median household income of $89,000 found in the 45 to 64 years age bracket for the primary householder. A total of 70 households (30.7%) fall into this category.
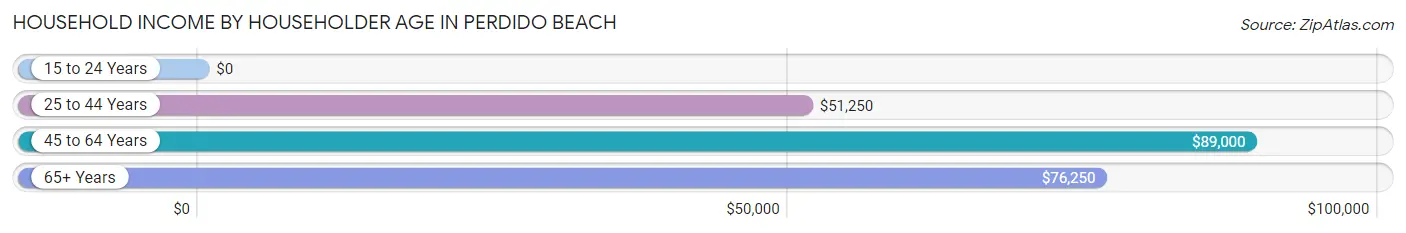
| Income Bracket | # Households | Median Income |
| 15 to 24 Years | 0 (0.0%) | $0 |
| 25 to 44 Years | 19 (8.3%) | $51,250 |
| 45 to 64 Years | 70 (30.7%) | $89,000 |
| 65+ Years | 139 (61.0%) | $76,250 |
| Total | 228 (100.0%) | $76,389 |
Poverty in Perdido Beach
Income Below Poverty by Sex and Age in Perdido Beach
With 2.5% poverty level for males and 8.2% for females among the residents of Perdido Beach, 35 to 44 year old males and 35 to 44 year old females are the most vulnerable to poverty, with 4 males (40.0%) and 4 females (33.3%) in their respective age groups living below the poverty level.
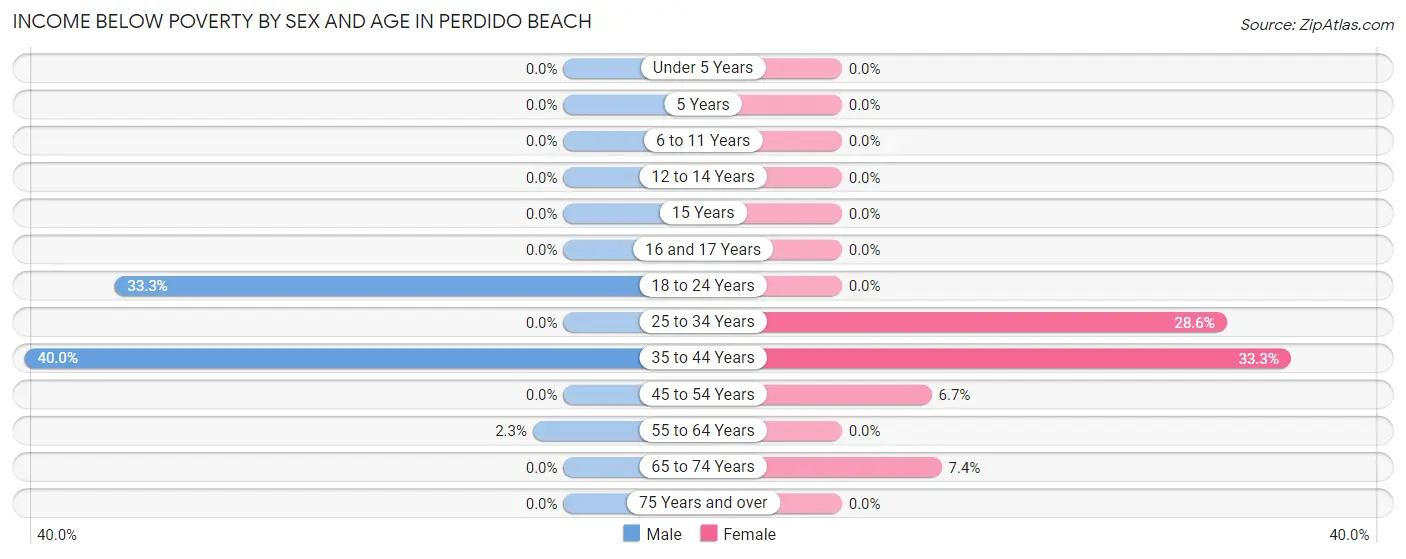
| Age Bracket | Male | Female |
| Under 5 Years | 0 (0.0%) | 0 (0.0%) |
| 5 Years | 0 (0.0%) | 0 (0.0%) |
| 6 to 11 Years | 0 (0.0%) | 0 (0.0%) |
| 12 to 14 Years | 0 (0.0%) | 0 (0.0%) |
| 15 Years | 0 (0.0%) | 0 (0.0%) |
| 16 and 17 Years | 0 (0.0%) | 0 (0.0%) |
| 18 to 24 Years | 1 (33.3%) | 0 (0.0%) |
| 25 to 34 Years | 0 (0.0%) | 6 (28.6%) |
| 35 to 44 Years | 4 (40.0%) | 4 (33.3%) |
| 45 to 54 Years | 0 (0.0%) | 2 (6.7%) |
| 55 to 64 Years | 1 (2.3%) | 0 (0.0%) |
| 65 to 74 Years | 0 (0.0%) | 6 (7.4%) |
| 75 Years and over | 0 (0.0%) | 0 (0.0%) |
| Total | 6 (2.5%) | 18 (8.2%) |
Income Above Poverty by Sex and Age in Perdido Beach
According to the poverty statistics in Perdido Beach, males aged under 5 years and females aged under 5 years are the age groups that are most secure financially, with 100.0% of males and 100.0% of females in these age groups living above the poverty line.
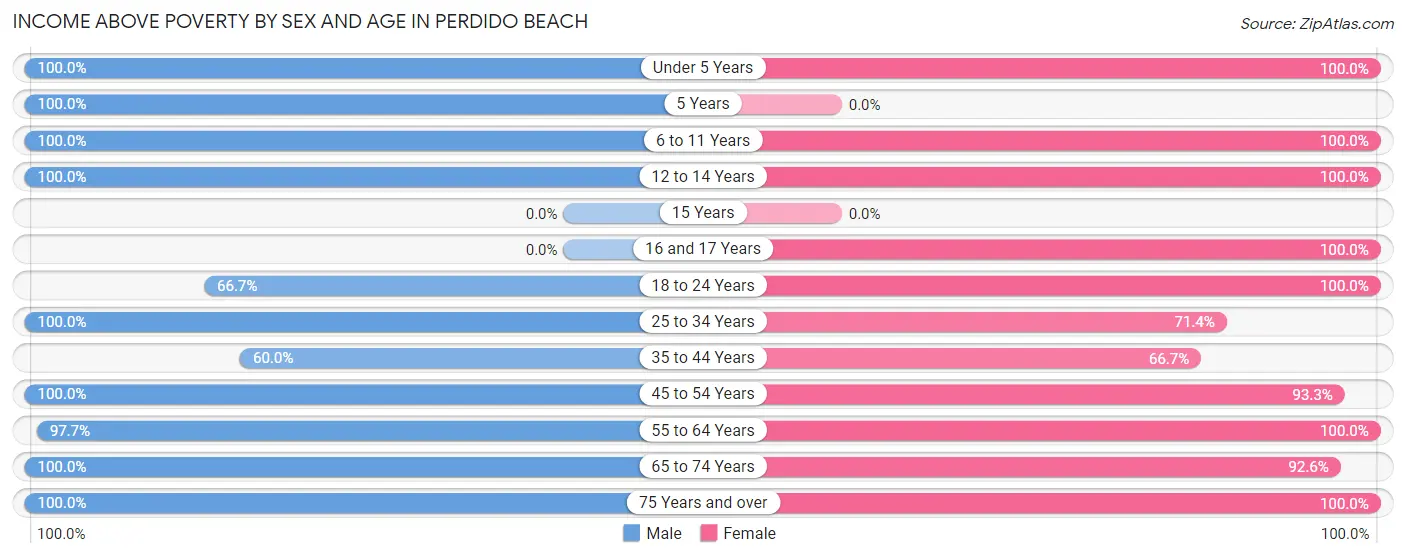
| Age Bracket | Male | Female |
| Under 5 Years | 6 (100.0%) | 3 (100.0%) |
| 5 Years | 5 (100.0%) | 0 (0.0%) |
| 6 to 11 Years | 17 (100.0%) | 8 (100.0%) |
| 12 to 14 Years | 3 (100.0%) | 3 (100.0%) |
| 15 Years | 0 (0.0%) | 0 (0.0%) |
| 16 and 17 Years | 0 (0.0%) | 2 (100.0%) |
| 18 to 24 Years | 2 (66.7%) | 5 (100.0%) |
| 25 to 34 Years | 18 (100.0%) | 15 (71.4%) |
| 35 to 44 Years | 6 (60.0%) | 8 (66.7%) |
| 45 to 54 Years | 31 (100.0%) | 28 (93.3%) |
| 55 to 64 Years | 43 (97.7%) | 33 (100.0%) |
| 65 to 74 Years | 70 (100.0%) | 75 (92.6%) |
| 75 Years and over | 37 (100.0%) | 22 (100.0%) |
| Total | 238 (97.5%) | 202 (91.8%) |
Income Below Poverty Among Married-Couple Families in Perdido Beach
The poverty statistics for married-couple families in Perdido Beach show that 2.8% or 4 of the total 145 families live below the poverty line. Families with no children have the highest poverty rate of 3.2%, comprising of 4 families. On the other hand, families with 1 or 2 children have the lowest poverty rate of 0.0%, which includes 0 families.
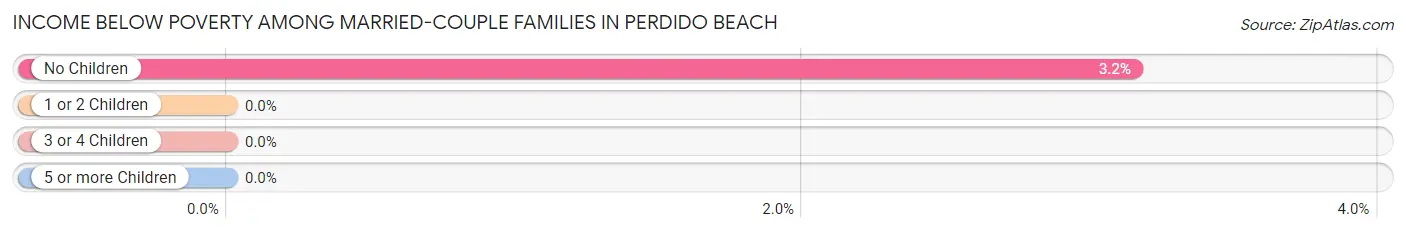
| Children | Above Poverty | Below Poverty |
| No Children | 123 (96.9%) | 4 (3.2%) |
| 1 or 2 Children | 16 (100.0%) | 0 (0.0%) |
| 3 or 4 Children | 0 (0.0%) | 0 (0.0%) |
| 5 or more Children | 2 (100.0%) | 0 (0.0%) |
| Total | 141 (97.2%) | 4 (2.8%) |
Income Below Poverty Among Single-Parent Households in Perdido Beach
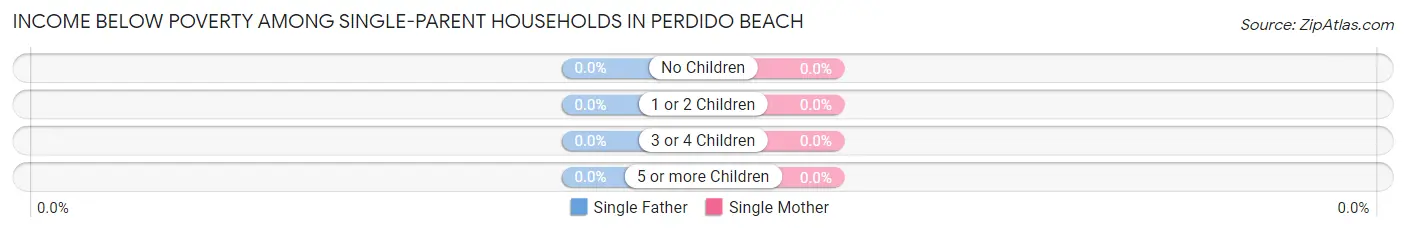
| Children | Single Father | Single Mother |
| No Children | 0 (0.0%) | 0 (0.0%) |
| 1 or 2 Children | 0 (0.0%) | 0 (0.0%) |
| 3 or 4 Children | 0 (0.0%) | 0 (0.0%) |
| 5 or more Children | 0 (0.0%) | 0 (0.0%) |
| Total | 0 (0.0%) | 0 (0.0%) |
Income Below Poverty Among Married-Couple vs Single-Parent Households in Perdido Beach
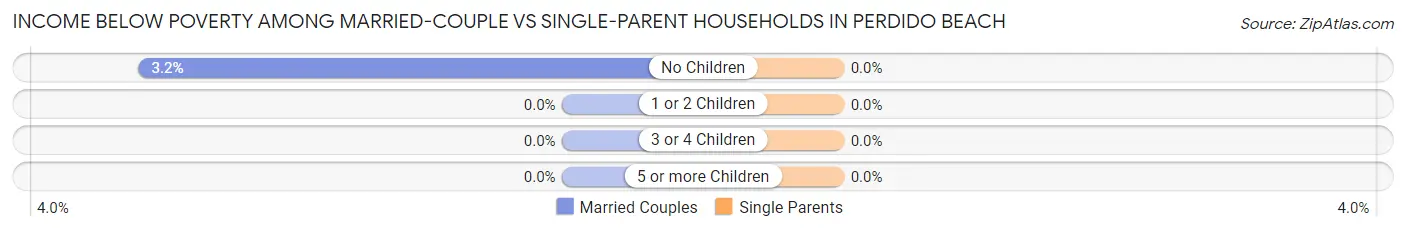
| Children | Married-Couple Families | Single-Parent Households |
| No Children | 4 (3.2%) | 0 (0.0%) |
| 1 or 2 Children | 0 (0.0%) | 0 (0.0%) |
| 3 or 4 Children | 0 (0.0%) | 0 (0.0%) |
| 5 or more Children | 0 (0.0%) | 0 (0.0%) |
| Total | 4 (2.8%) | 0 (0.0%) |
Race in Perdido Beach
The most populous races in Perdido Beach are White / Caucasian (449 | 96.8%), Two or more Races (13 | 2.8%), and Hispanic or Latino (6 | 1.3%).
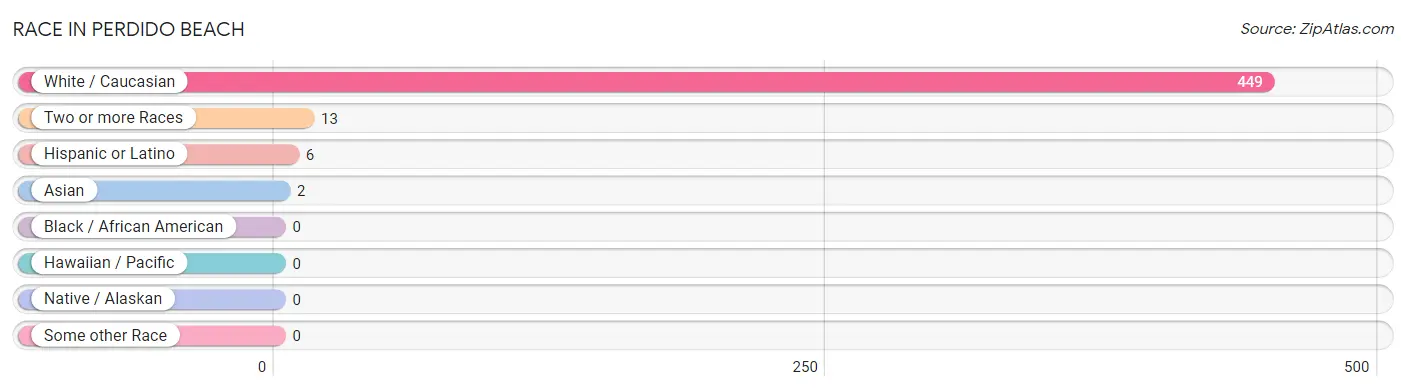
| Race | # Population | % Population |
| Asian | 2 | 0.4% |
| Black / African American | 0 | 0.0% |
| Hawaiian / Pacific | 0 | 0.0% |
| Hispanic or Latino | 6 | 1.3% |
| Native / Alaskan | 0 | 0.0% |
| White / Caucasian | 449 | 96.8% |
| Two or more Races | 13 | 2.8% |
| Some other Race | 0 | 0.0% |
| Total | 464 | 100.0% |
Ancestry in Perdido Beach
The most populous ancestries reported in Perdido Beach are English (99 | 21.3%), German (86 | 18.5%), American (77 | 16.6%), Scottish (38 | 8.2%), and Irish (32 | 6.9%), together accounting for 71.6% of all Perdido Beach residents.
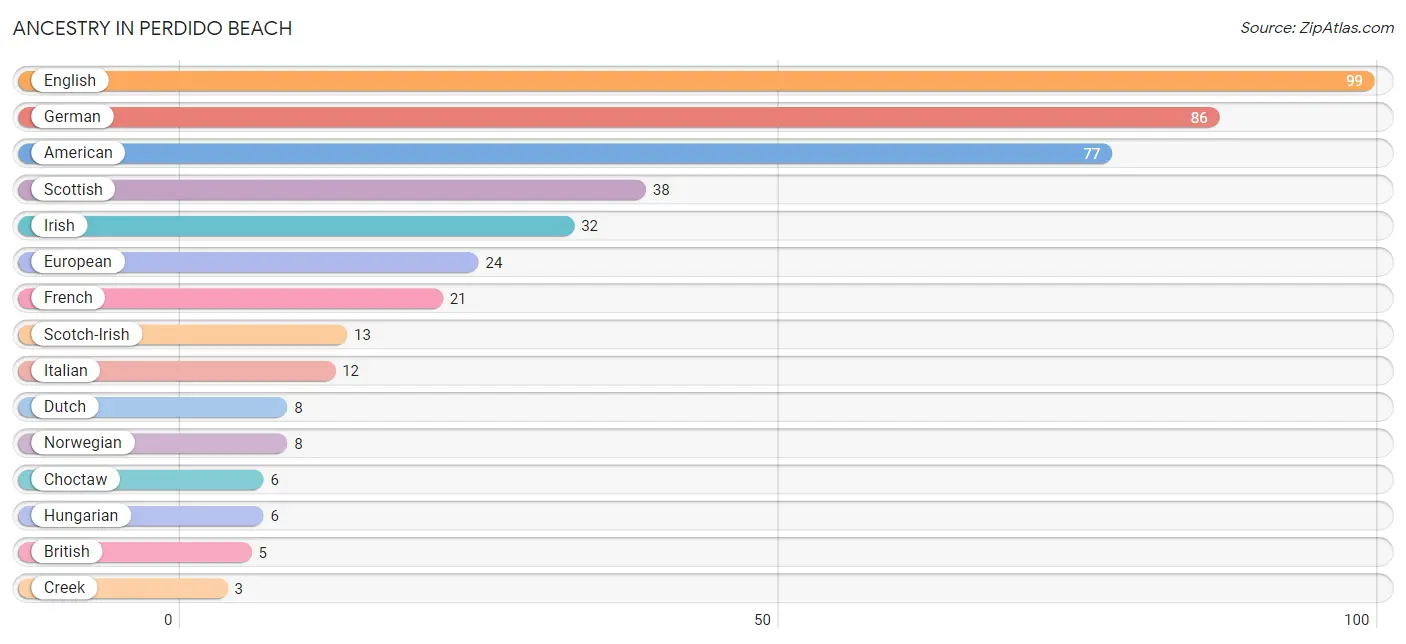
| Ancestry | # Population | % Population |
| American | 77 | 16.6% |
| Austrian | 2 | 0.4% |
| British | 5 | 1.1% |
| Cajun | 1 | 0.2% |
| Canadian | 2 | 0.4% |
| Choctaw | 6 | 1.3% |
| Creek | 3 | 0.6% |
| Danish | 2 | 0.4% |
| Dutch | 8 | 1.7% |
| English | 99 | 21.3% |
| European | 24 | 5.2% |
| French | 21 | 4.5% |
| French Canadian | 2 | 0.4% |
| German | 86 | 18.5% |
| Hungarian | 6 | 1.3% |
| Indian (Asian) | 2 | 0.4% |
| Irish | 32 | 6.9% |
| Italian | 12 | 2.6% |
| Lithuanian | 2 | 0.4% |
| Norwegian | 8 | 1.7% |
| Polish | 2 | 0.4% |
| Scandinavian | 3 | 0.6% |
| Scotch-Irish | 13 | 2.8% |
| Scottish | 38 | 8.2% |
| Slovak | 2 | 0.4% |
| Spaniard | 2 | 0.4% |
| Swedish | 2 | 0.4% |
| Welsh | 2 | 0.4% | View All 28 Rows |
Immigrants in Perdido Beach
The most numerous immigrant groups reported in Perdido Beach came from Europe (7 | 1.5%), Germany (4 | 0.9%), Western Europe (4 | 0.9%), Northern Europe (3 | 0.6%), and Norway (3 | 0.6%), together accounting for 4.5% of all Perdido Beach residents.
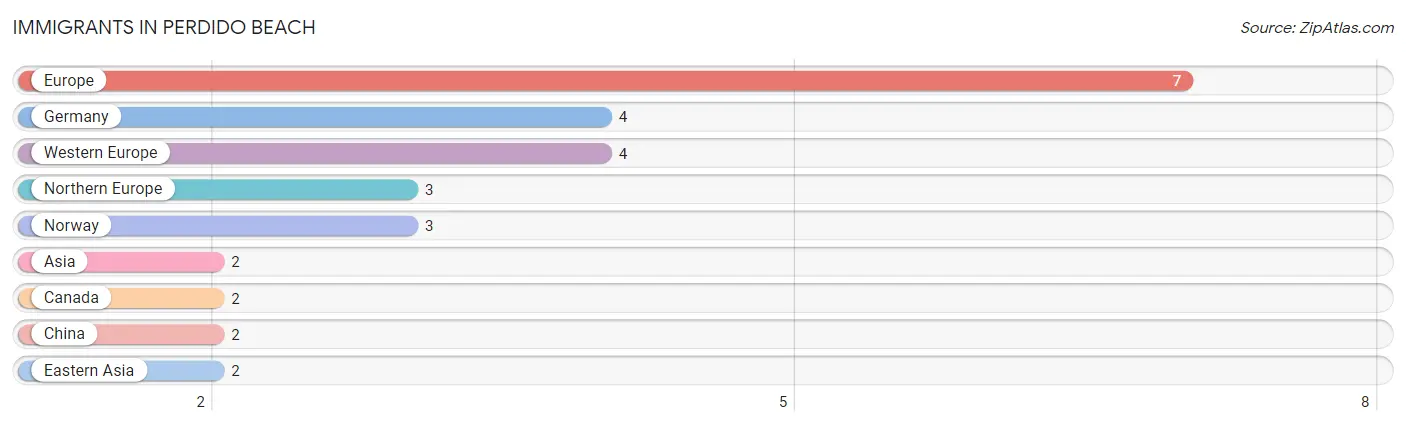
| Immigration Origin | # Population | % Population |
| Asia | 2 | 0.4% |
| Canada | 2 | 0.4% |
| China | 2 | 0.4% |
| Eastern Asia | 2 | 0.4% |
| Europe | 7 | 1.5% |
| Germany | 4 | 0.9% |
| Northern Europe | 3 | 0.6% |
| Norway | 3 | 0.6% |
| Western Europe | 4 | 0.9% | View All 9 Rows |
Sex and Age in Perdido Beach
Sex and Age in Perdido Beach
The most populous age groups in Perdido Beach are 65 to 69 Years (46 | 18.9%) for men and 70 to 74 Years (46 | 20.9%) for women.
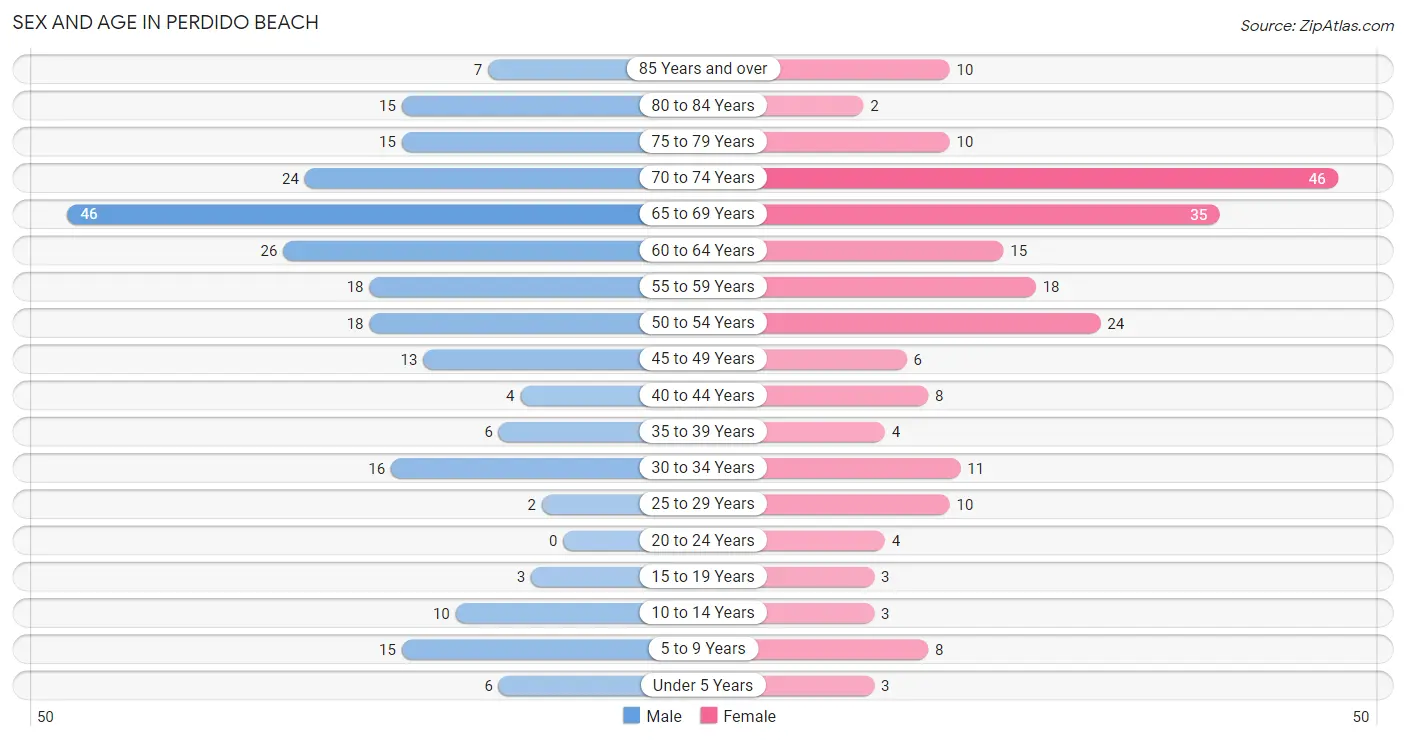
| Age Bracket | Male | Female |
| Under 5 Years | 6 (2.5%) | 3 (1.4%) |
| 5 to 9 Years | 15 (6.1%) | 8 (3.6%) |
| 10 to 14 Years | 10 (4.1%) | 3 (1.4%) |
| 15 to 19 Years | 3 (1.2%) | 3 (1.4%) |
| 20 to 24 Years | 0 (0.0%) | 4 (1.8%) |
| 25 to 29 Years | 2 (0.8%) | 10 (4.5%) |
| 30 to 34 Years | 16 (6.6%) | 11 (5.0%) |
| 35 to 39 Years | 6 (2.5%) | 4 (1.8%) |
| 40 to 44 Years | 4 (1.6%) | 8 (3.6%) |
| 45 to 49 Years | 13 (5.3%) | 6 (2.7%) |
| 50 to 54 Years | 18 (7.4%) | 24 (10.9%) |
| 55 to 59 Years | 18 (7.4%) | 18 (8.2%) |
| 60 to 64 Years | 26 (10.7%) | 15 (6.8%) |
| 65 to 69 Years | 46 (18.9%) | 35 (15.9%) |
| 70 to 74 Years | 24 (9.8%) | 46 (20.9%) |
| 75 to 79 Years | 15 (6.1%) | 10 (4.5%) |
| 80 to 84 Years | 15 (6.1%) | 2 (0.9%) |
| 85 Years and over | 7 (2.9%) | 10 (4.5%) |
| Total | 244 (100.0%) | 220 (100.0%) |
Families and Households in Perdido Beach
Median Family Size in Perdido Beach
The median family size in Perdido Beach is 2.39 persons per family, with single female/mother families (2 | 1.3%) accounting for the largest median family size of 3.5 persons per family. On the other hand, married-couple families (145 | 94.8%) represent the smallest median family size with 2.34 persons per family.
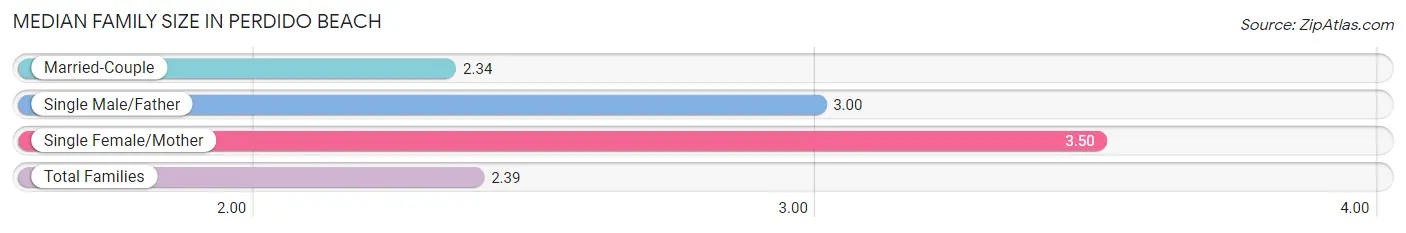
| Family Type | # Families | Family Size |
| Married-Couple | 145 (94.8%) | 2.34 |
| Single Male/Father | 6 (3.9%) | 3.00 |
| Single Female/Mother | 2 (1.3%) | 3.50 |
| Total Families | 153 (100.0%) | 2.39 |
Median Household Size in Perdido Beach
The median household size in Perdido Beach is 2.04 persons per household, with single male/father households (6 | 2.6%) accounting for the largest median household size of 4 persons per household. non-family households (75 | 32.9%) represent the smallest median household size with 1.23 persons per household.
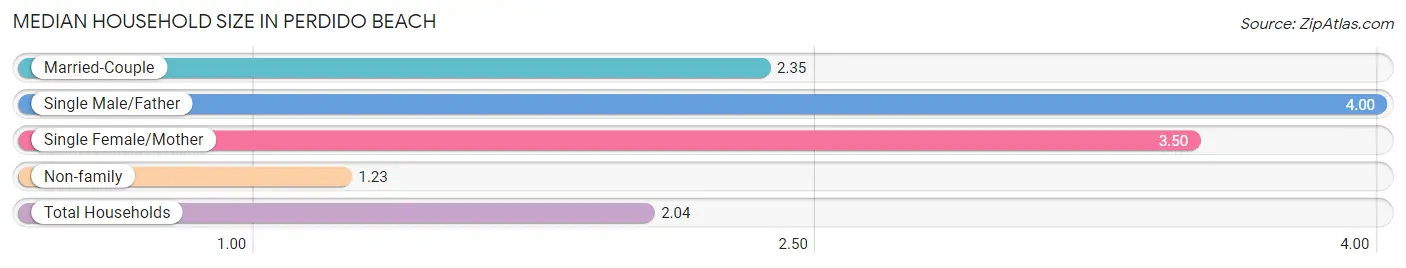
| Household Type | # Households | Household Size |
| Married-Couple | 145 (63.6%) | 2.35 |
| Single Male/Father | 6 (2.6%) | 4.00 |
| Single Female/Mother | 2 (0.9%) | 3.50 |
| Non-family | 75 (32.9%) | 1.23 |
| Total Households | 228 (100.0%) | 2.04 |
Household Size by Marriage Status in Perdido Beach
Out of a total of 228 households in Perdido Beach, 153 (67.1%) are family households, while 75 (32.9%) are nonfamily households. The most numerous type of family households are 2-person households, comprising 117, and the most common type of nonfamily households are 1-person households, comprising 64.
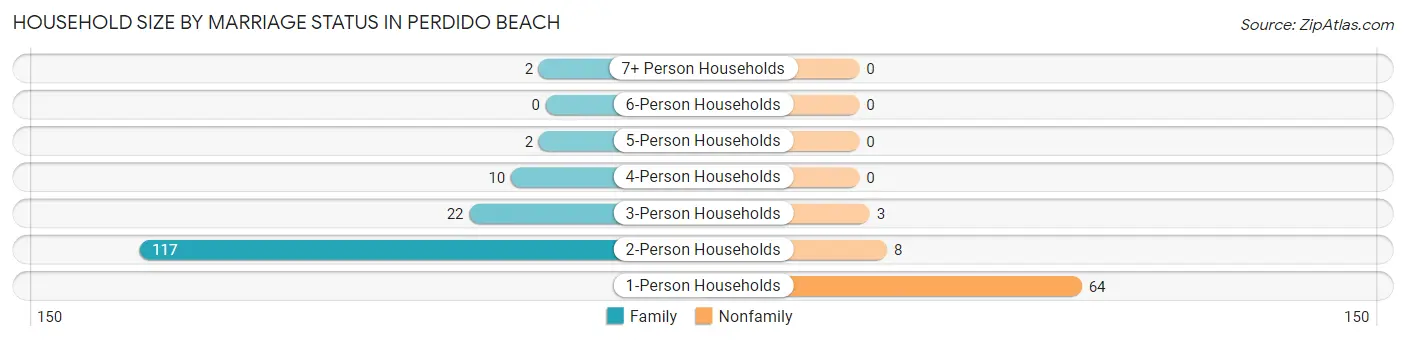
| Household Size | Family Households | Nonfamily Households |
| 1-Person Households | - | 64 (28.1%) |
| 2-Person Households | 117 (51.3%) | 8 (3.5%) |
| 3-Person Households | 22 (9.7%) | 3 (1.3%) |
| 4-Person Households | 10 (4.4%) | 0 (0.0%) |
| 5-Person Households | 2 (0.9%) | 0 (0.0%) |
| 6-Person Households | 0 (0.0%) | 0 (0.0%) |
| 7+ Person Households | 2 (0.9%) | 0 (0.0%) |
| Total | 153 (67.1%) | 75 (32.9%) |
Female Fertility in Perdido Beach
Fertility by Age in Perdido Beach
Average fertility rate in Perdido Beach is 77.0 births per 1,000 women. Women in the age bracket of 35 to 50 years have the highest fertility rate with 167.0 births per 1,000 women. Women in the age bracket of 35 to 50 years acount for 100.0% of all women with births.
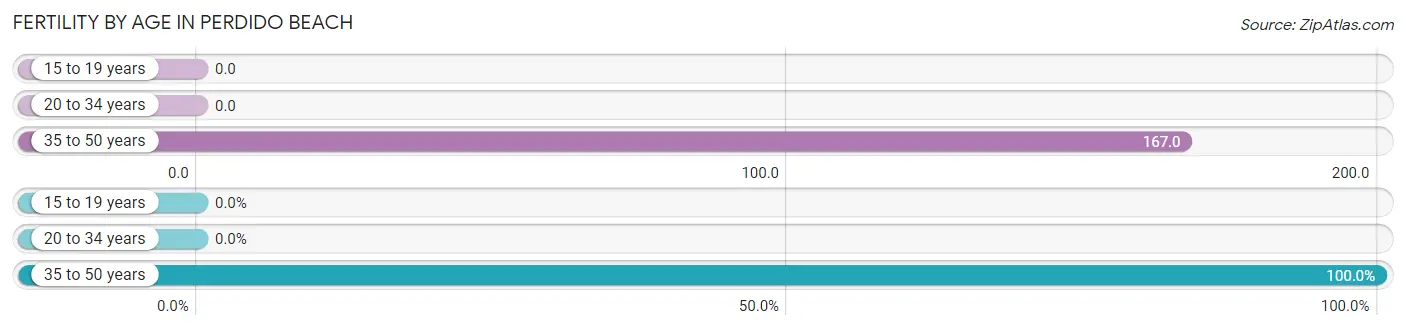
| Age Bracket | Women with Births | Births / 1,000 Women |
| 15 to 19 years | 0 (0.0%) | 0.0 |
| 20 to 34 years | 0 (0.0%) | 0.0 |
| 35 to 50 years | 4 (100.0%) | 167.0 |
| Total | 4 (100.0%) | 77.0 |
Fertility by Age by Marriage Status in Perdido Beach
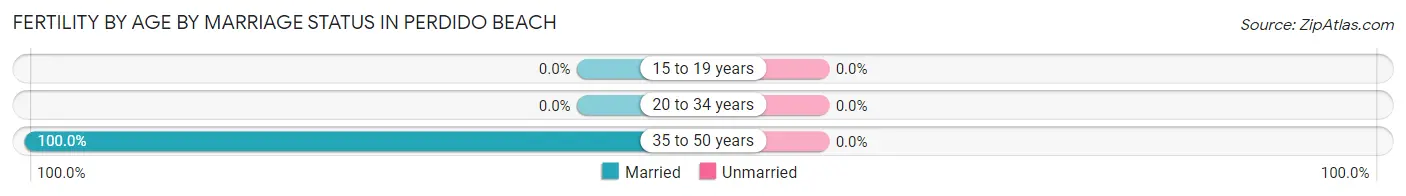
| Age Bracket | Married | Unmarried |
| 15 to 19 years | 0 (0.0%) | 0 (0.0%) |
| 20 to 34 years | 0 (0.0%) | 0 (0.0%) |
| 35 to 50 years | 4 (100.0%) | 0 (0.0%) |
| Total | 4 (100.0%) | 0 (0.0%) |
Fertility by Education in Perdido Beach
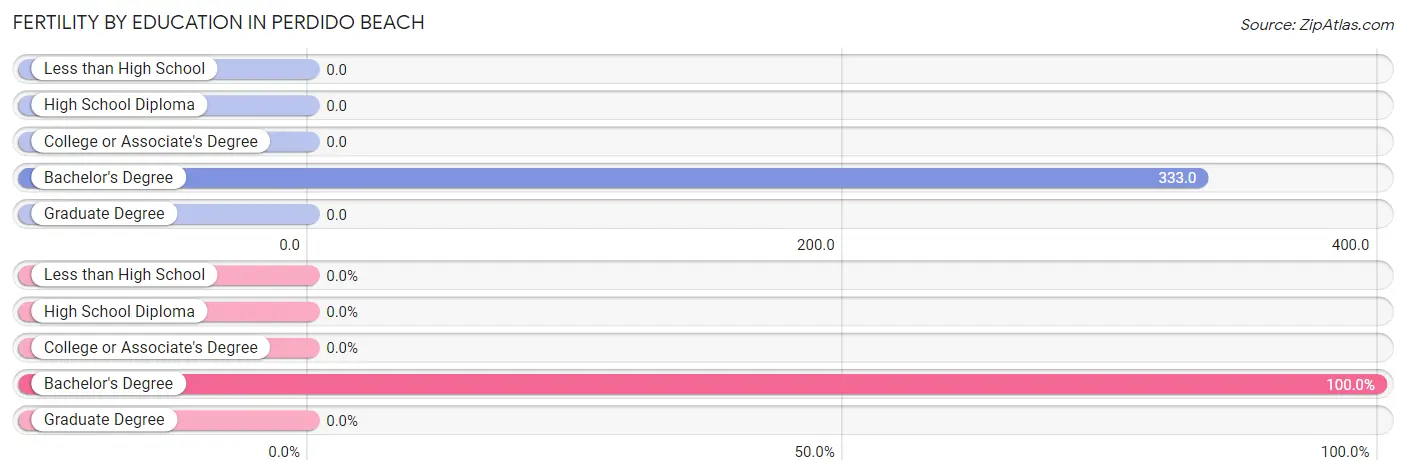
| Educational Attainment | Women with Births | Births / 1,000 Women |
| Less than High School | 0 (0.0%) | 0.0 |
| High School Diploma | 0 (0.0%) | 0.0 |
| College or Associate's Degree | 0 (0.0%) | 0.0 |
| Bachelor's Degree | 4 (100.0%) | 333.0 |
| Graduate Degree | 0 (0.0%) | 0.0 |
| Total | 4 (100.0%) | 77.0 |
Fertility by Education by Marriage Status in Perdido Beach
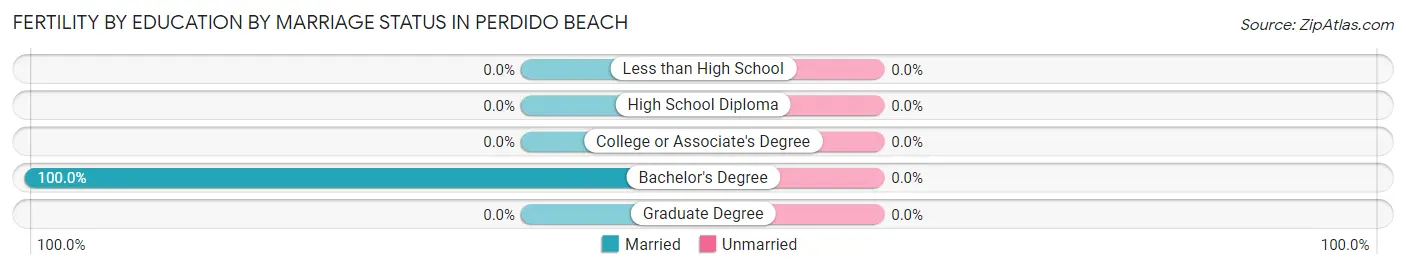
| Educational Attainment | Married | Unmarried |
| Less than High School | 0 (0.0%) | 0 (0.0%) |
| High School Diploma | 0 (0.0%) | 0 (0.0%) |
| College or Associate's Degree | 0 (0.0%) | 0 (0.0%) |
| Bachelor's Degree | 4 (100.0%) | 0 (0.0%) |
| Graduate Degree | 0 (0.0%) | 0 (0.0%) |
| Total | 4 (100.0%) | 0 (0.0%) |
Employment Characteristics in Perdido Beach
Employment by Class of Employer in Perdido Beach
Among the 194 employed individuals in Perdido Beach, private company employees (113 | 58.3%), self-employed (incorporated) (38 | 19.6%), and state government employees (15 | 7.7%) make up the most common classes of employment.
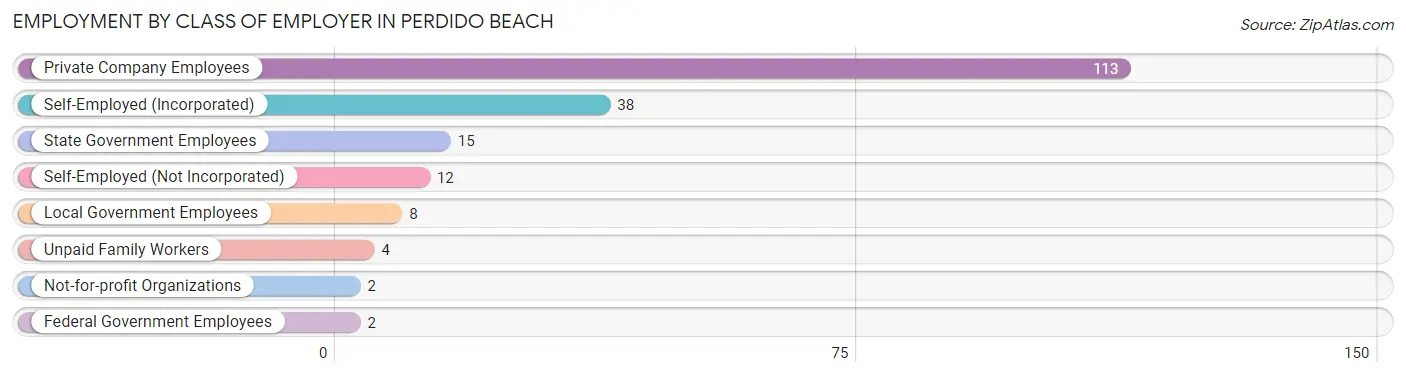
| Employer Class | # Employees | % Employees |
| Private Company Employees | 113 | 58.3% |
| Self-Employed (Incorporated) | 38 | 19.6% |
| Self-Employed (Not Incorporated) | 12 | 6.2% |
| Not-for-profit Organizations | 2 | 1.0% |
| Local Government Employees | 8 | 4.1% |
| State Government Employees | 15 | 7.7% |
| Federal Government Employees | 2 | 1.0% |
| Unpaid Family Workers | 4 | 2.1% |
| Total | 194 | 100.0% |
Employment Status by Age in Perdido Beach
According to the labor force statistics for Perdido Beach, out of the total population over 16 years of age (419), 47.7% or 200 individuals are in the labor force, with 3.0% or 6 of them unemployed. The age group with the highest labor force participation rate is 20 to 24 years, with 100.0% or 4 individuals in the labor force. Within the labor force, the 16 to 19 years age range has the highest percentage of unemployed individuals, with 50.0% or 2 of them being unemployed.
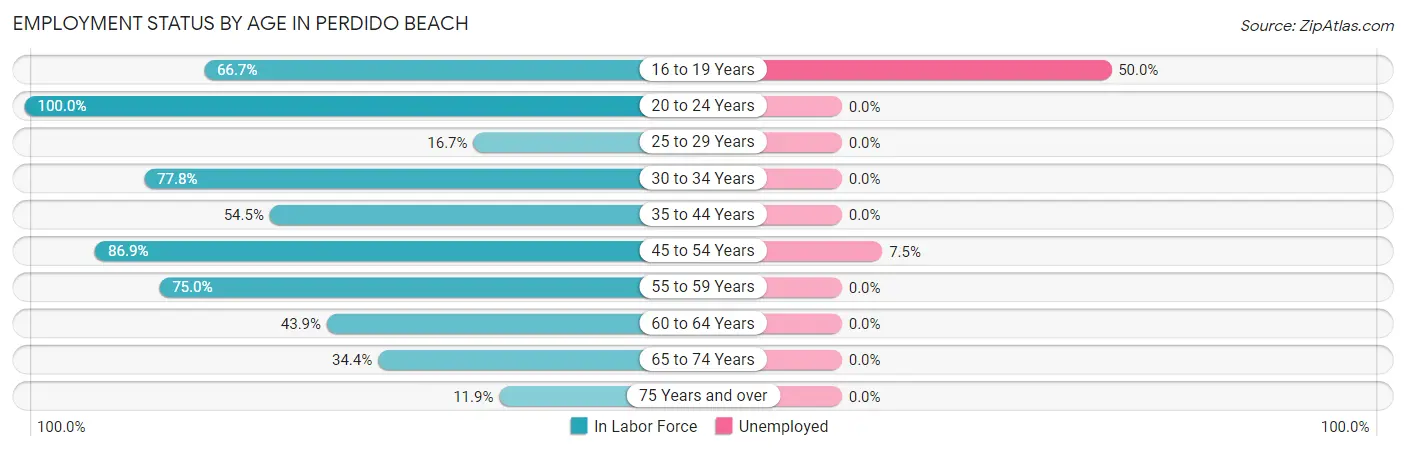
| Age Bracket | In Labor Force | Unemployed |
| 16 to 19 Years | 4 (66.7%) | 2 (50.0%) |
| 20 to 24 Years | 4 (100.0%) | 0 (0.0%) |
| 25 to 29 Years | 2 (16.7%) | 0 (0.0%) |
| 30 to 34 Years | 21 (77.8%) | 0 (0.0%) |
| 35 to 44 Years | 12 (54.5%) | 0 (0.0%) |
| 45 to 54 Years | 53 (86.9%) | 4 (7.5%) |
| 55 to 59 Years | 27 (75.0%) | 0 (0.0%) |
| 60 to 64 Years | 18 (43.9%) | 0 (0.0%) |
| 65 to 74 Years | 52 (34.4%) | 0 (0.0%) |
| 75 Years and over | 7 (11.9%) | 0 (0.0%) |
| Total | 200 (47.7%) | 6 (3.0%) |
Employment Status by Educational Attainment in Perdido Beach
According to labor force statistics for Perdido Beach, 66.8% of individuals (133) out of the total population between 25 and 64 years of age (199) are in the labor force, with 3.0% or 4 of them being unemployed. The group with the highest labor force participation rate are those with the educational attainment of bachelor's degree or higher, with 82.2% or 37 individuals in the labor force. Within the labor force, individuals with bachelor's degree or higher education have the highest percentage of unemployment, with 5.4% or 2 of them being unemployed.
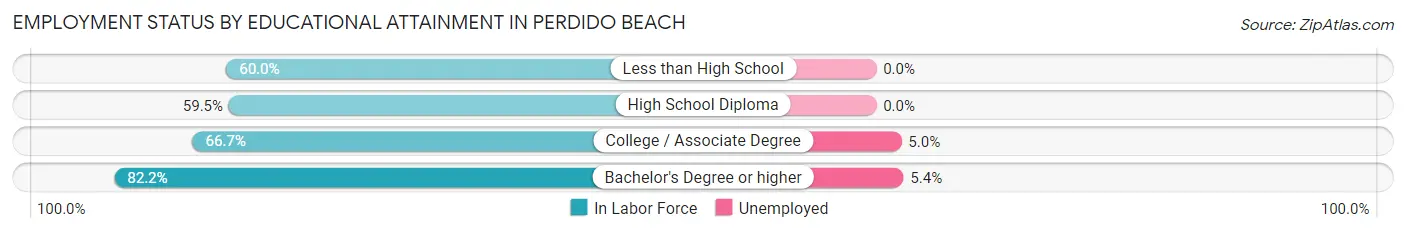
| Educational Attainment | In Labor Force | Unemployed |
| Less than High School | 9 (60.0%) | 0 (0.0%) |
| High School Diploma | 47 (59.5%) | 0 (0.0%) |
| College / Associate Degree | 40 (66.7%) | 3 (5.0%) |
| Bachelor's Degree or higher | 37 (82.2%) | 2 (5.4%) |
| Total | 133 (66.8%) | 6 (3.0%) |
Employment Occupations by Sex in Perdido Beach
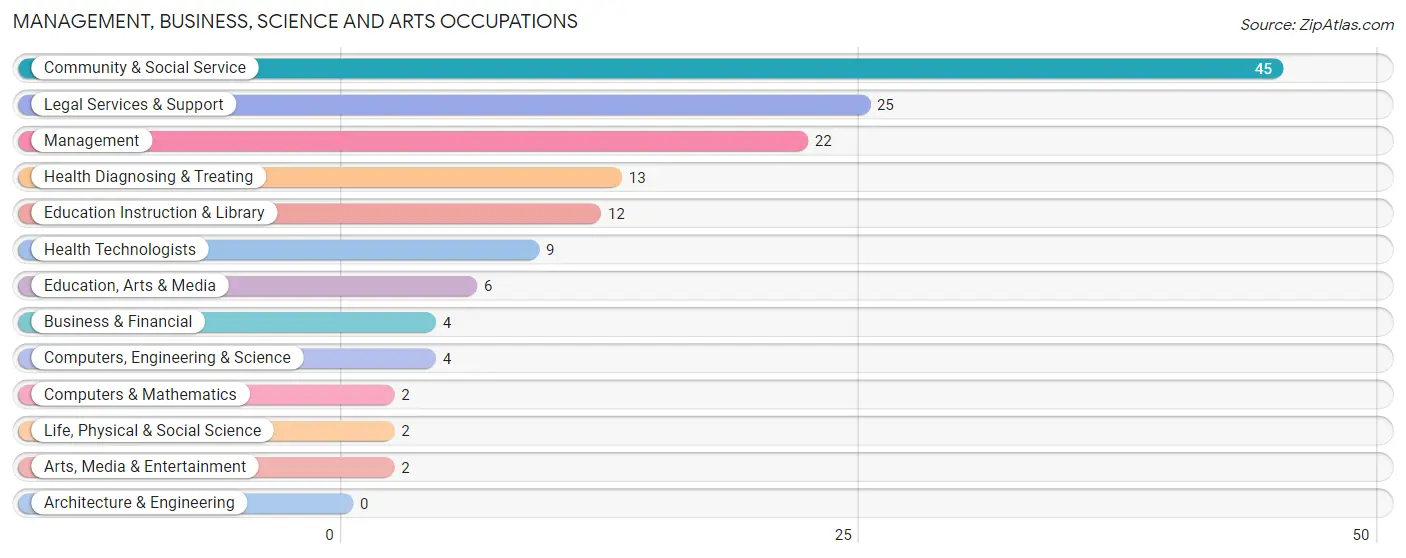
Management, Business, Science and Arts Occupations
The most common Management, Business, Science and Arts occupations in Perdido Beach are Community & Social Service (45 | 23.2%), Legal Services & Support (25 | 12.9%), Management (22 | 11.3%), Health Diagnosing & Treating (13 | 6.7%), and Education Instruction & Library (12 | 6.2%).
Management, Business, Science and Arts Occupations by Sex
Within the Management, Business, Science and Arts occupations in Perdido Beach, the most male-oriented occupations are Life, Physical & Social Science (100.0%), Legal Services & Support (100.0%), and Arts, Media & Entertainment (100.0%), while the most female-oriented occupations are Computers & Mathematics (100.0%), Education, Arts & Media (100.0%), and Education Instruction & Library (91.7%).
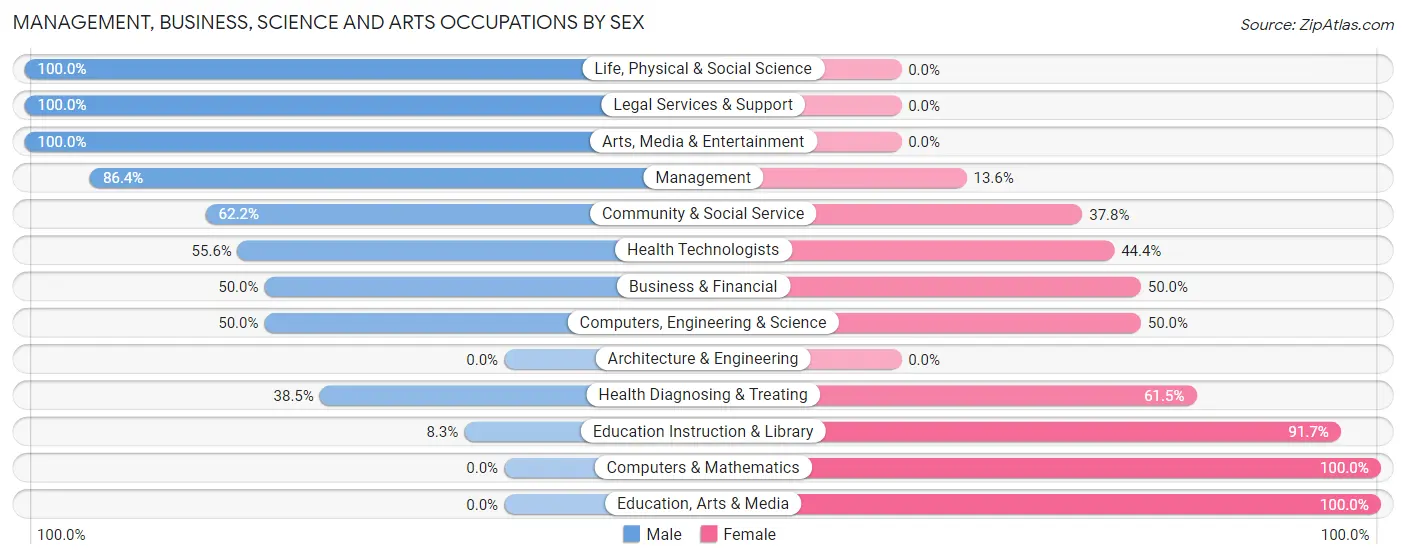
| Occupation | Male | Female |
| Management | 19 (86.4%) | 3 (13.6%) |
| Business & Financial | 2 (50.0%) | 2 (50.0%) |
| Computers, Engineering & Science | 2 (50.0%) | 2 (50.0%) |
| Computers & Mathematics | 0 (0.0%) | 2 (100.0%) |
| Architecture & Engineering | 0 (0.0%) | 0 (0.0%) |
| Life, Physical & Social Science | 2 (100.0%) | 0 (0.0%) |
| Community & Social Service | 28 (62.2%) | 17 (37.8%) |
| Education, Arts & Media | 0 (0.0%) | 6 (100.0%) |
| Legal Services & Support | 25 (100.0%) | 0 (0.0%) |
| Education Instruction & Library | 1 (8.3%) | 11 (91.7%) |
| Arts, Media & Entertainment | 2 (100.0%) | 0 (0.0%) |
| Health Diagnosing & Treating | 5 (38.5%) | 8 (61.5%) |
| Health Technologists | 5 (55.6%) | 4 (44.4%) |
| Total (Category) | 56 (63.6%) | 32 (36.4%) |
| Total (Overall) | 120 (61.9%) | 74 (38.1%) |
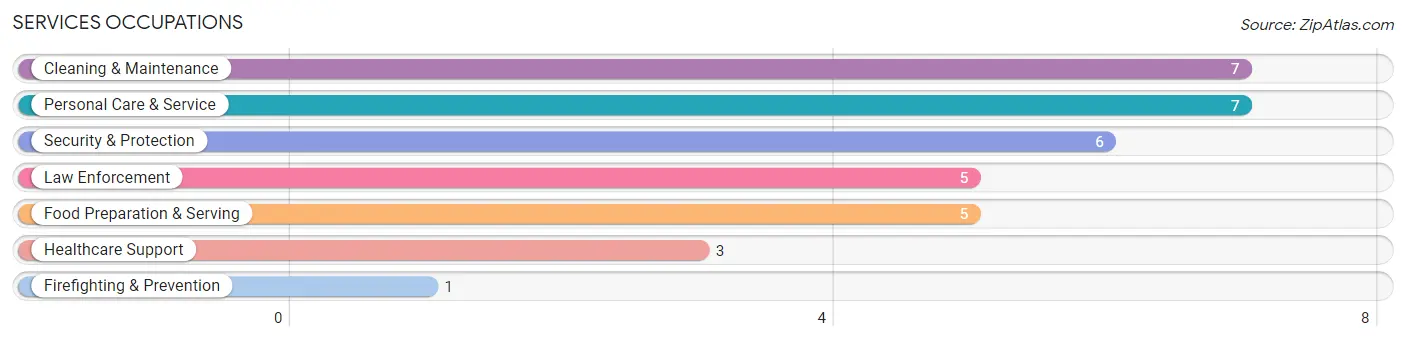
Services Occupations
The most common Services occupations in Perdido Beach are Cleaning & Maintenance (7 | 3.6%), Personal Care & Service (7 | 3.6%), Security & Protection (6 | 3.1%), Law Enforcement (5 | 2.6%), and Food Preparation & Serving (5 | 2.6%).
Services Occupations by Sex
Within the Services occupations in Perdido Beach, the most male-oriented occupations are Security & Protection (100.0%), Firefighting & Prevention (100.0%), and Law Enforcement (100.0%), while the most female-oriented occupations are Healthcare Support (100.0%), Personal Care & Service (100.0%), and Food Preparation & Serving (40.0%).
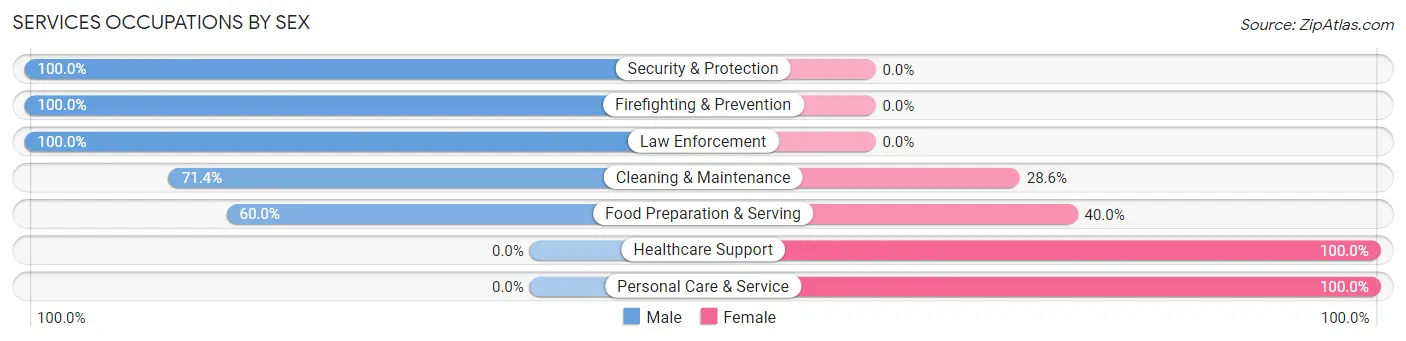
| Occupation | Male | Female |
| Healthcare Support | 0 (0.0%) | 3 (100.0%) |
| Security & Protection | 6 (100.0%) | 0 (0.0%) |
| Firefighting & Prevention | 1 (100.0%) | 0 (0.0%) |
| Law Enforcement | 5 (100.0%) | 0 (0.0%) |
| Food Preparation & Serving | 3 (60.0%) | 2 (40.0%) |
| Cleaning & Maintenance | 5 (71.4%) | 2 (28.6%) |
| Personal Care & Service | 0 (0.0%) | 7 (100.0%) |
| Total (Category) | 14 (50.0%) | 14 (50.0%) |
| Total (Overall) | 120 (61.9%) | 74 (38.1%) |
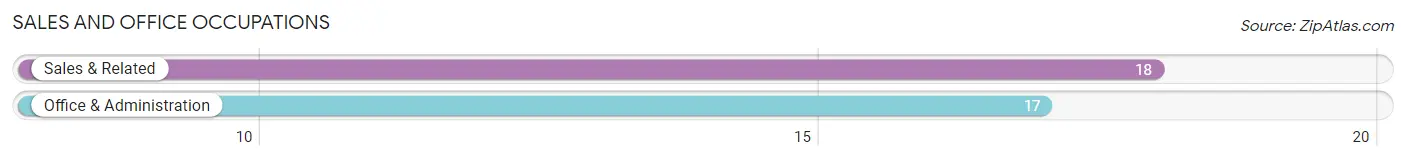
Sales and Office Occupations
The most common Sales and Office occupations in Perdido Beach are Sales & Related (18 | 9.3%), and Office & Administration (17 | 8.8%).
Sales and Office Occupations by Sex
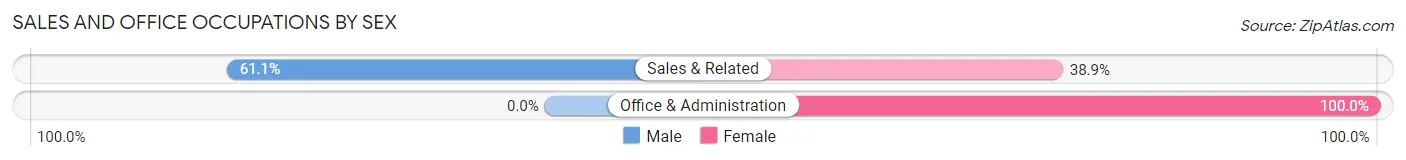
| Occupation | Male | Female |
| Sales & Related | 11 (61.1%) | 7 (38.9%) |
| Office & Administration | 0 (0.0%) | 17 (100.0%) |
| Total (Category) | 11 (31.4%) | 24 (68.6%) |
| Total (Overall) | 120 (61.9%) | 74 (38.1%) |
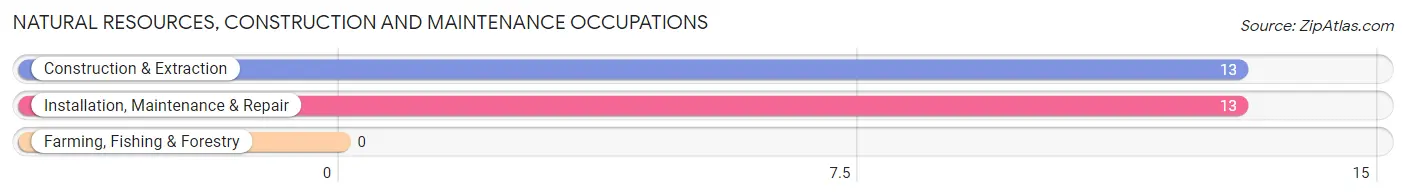
Natural Resources, Construction and Maintenance Occupations
The most common Natural Resources, Construction and Maintenance occupations in Perdido Beach are Construction & Extraction (13 | 6.7%), and Installation, Maintenance & Repair (13 | 6.7%).
Natural Resources, Construction and Maintenance Occupations by Sex
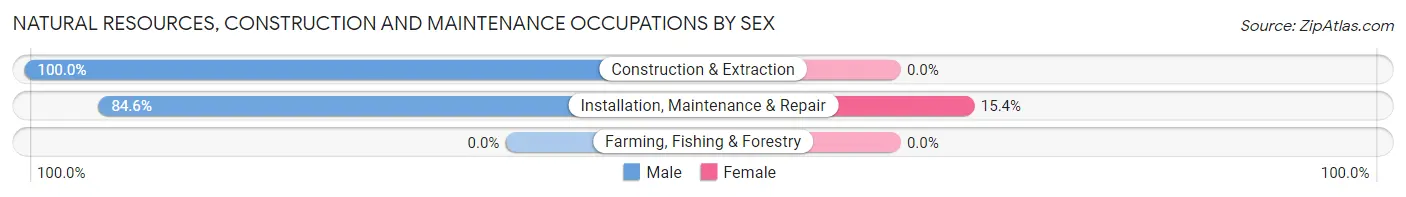
| Occupation | Male | Female |
| Farming, Fishing & Forestry | 0 (0.0%) | 0 (0.0%) |
| Construction & Extraction | 13 (100.0%) | 0 (0.0%) |
| Installation, Maintenance & Repair | 11 (84.6%) | 2 (15.4%) |
| Total (Category) | 24 (92.3%) | 2 (7.7%) |
| Total (Overall) | 120 (61.9%) | 74 (38.1%) |
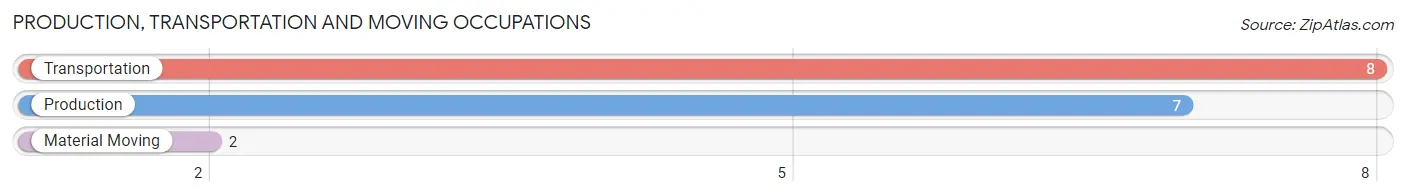
Production, Transportation and Moving Occupations
The most common Production, Transportation and Moving occupations in Perdido Beach are Transportation (8 | 4.1%), Production (7 | 3.6%), and Material Moving (2 | 1.0%).
Production, Transportation and Moving Occupations by Sex
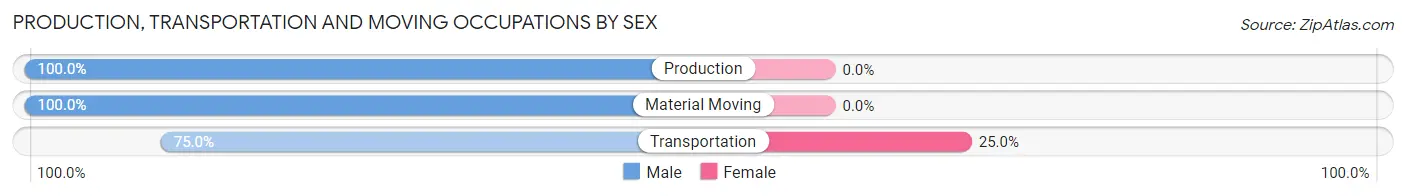
| Occupation | Male | Female |
| Production | 7 (100.0%) | 0 (0.0%) |
| Transportation | 6 (75.0%) | 2 (25.0%) |
| Material Moving | 2 (100.0%) | 0 (0.0%) |
| Total (Category) | 15 (88.2%) | 2 (11.8%) |
| Total (Overall) | 120 (61.9%) | 74 (38.1%) |
Employment Industries by Sex in Perdido Beach
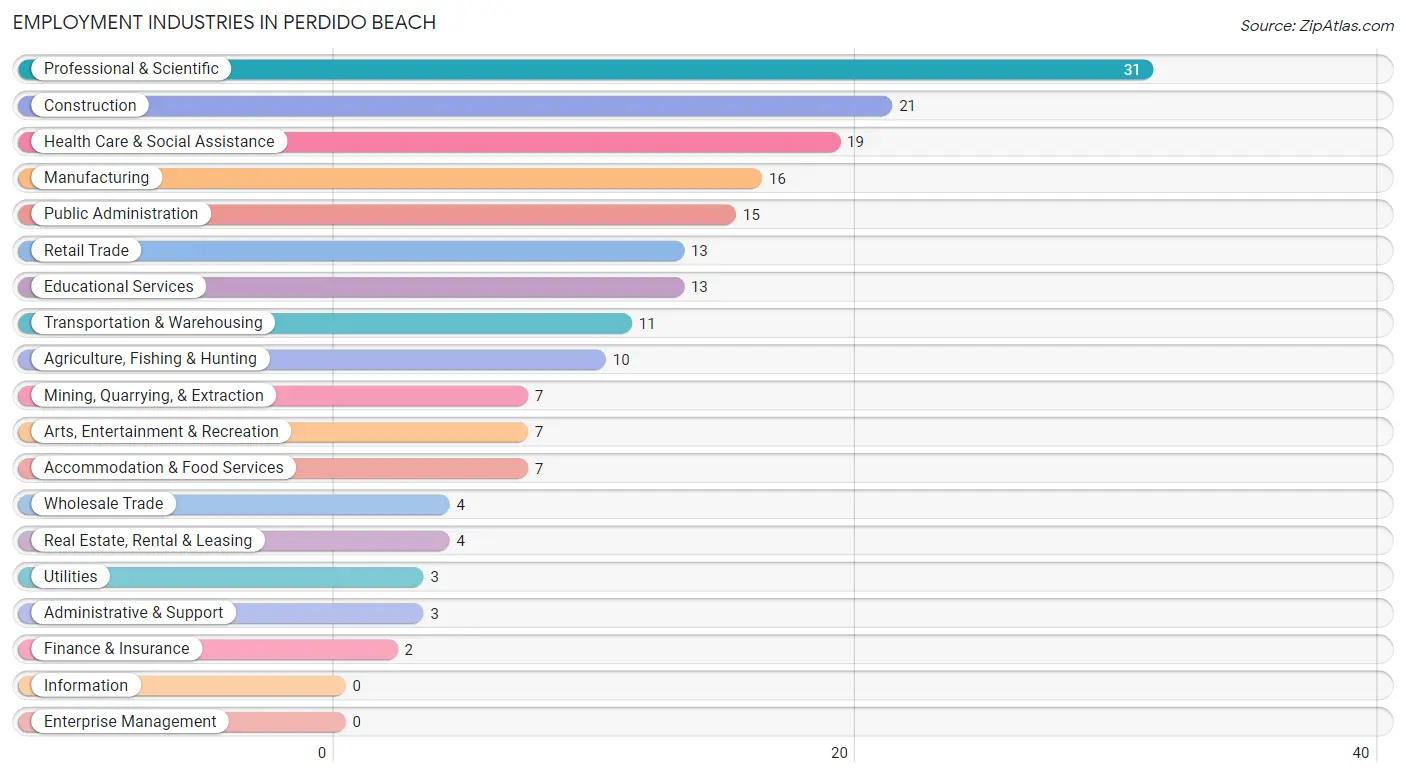
Employment Industries in Perdido Beach
The major employment industries in Perdido Beach include Professional & Scientific (31 | 16.0%), Construction (21 | 10.8%), Health Care & Social Assistance (19 | 9.8%), Manufacturing (16 | 8.3%), and Public Administration (15 | 7.7%).
Employment Industries by Sex in Perdido Beach
The Perdido Beach industries that see more men than women are Mining, Quarrying, & Extraction (100.0%), Construction (100.0%), and Manufacturing (100.0%), whereas the industries that tend to have a higher number of women are Educational Services (76.9%), Health Care & Social Assistance (73.7%), and Administrative & Support (66.7%).
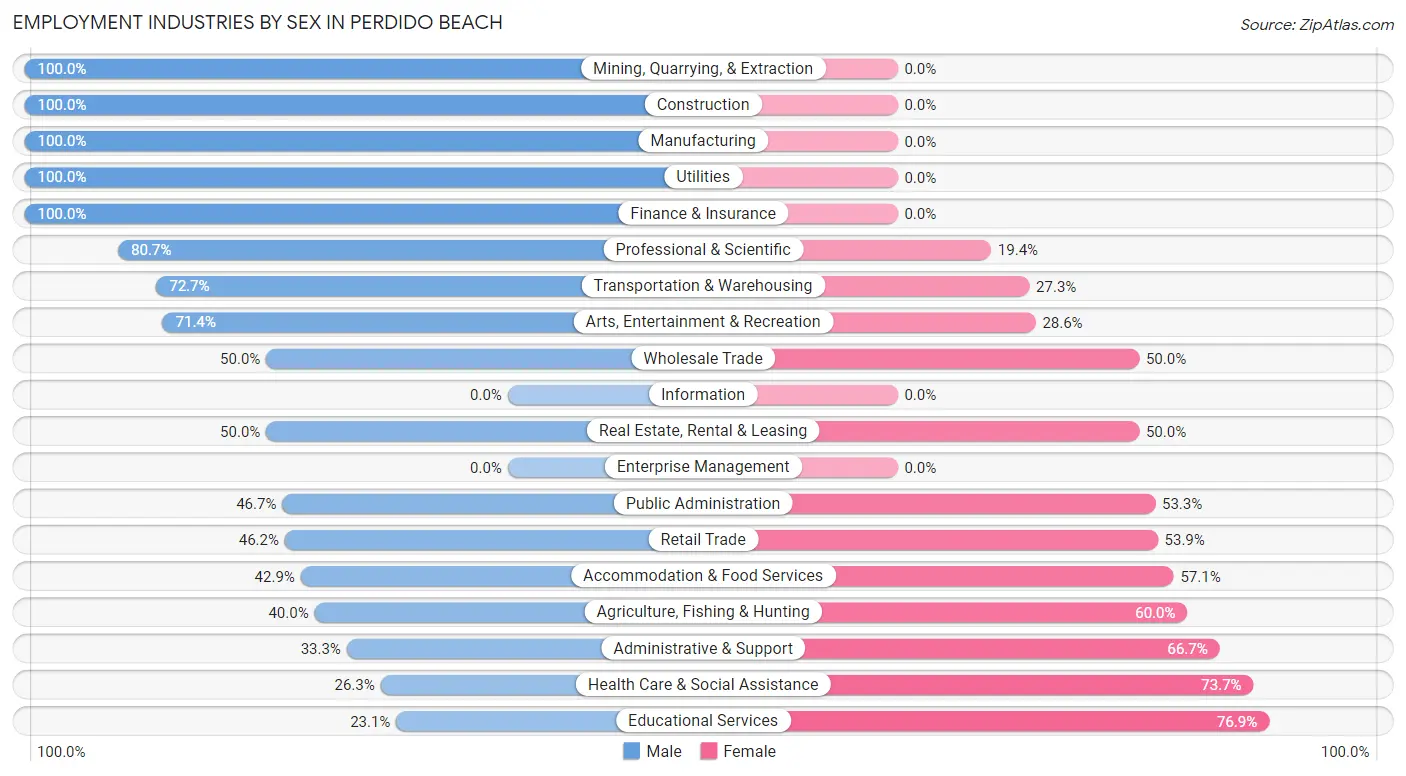
| Industry | Male | Female |
| Agriculture, Fishing & Hunting | 4 (40.0%) | 6 (60.0%) |
| Mining, Quarrying, & Extraction | 7 (100.0%) | 0 (0.0%) |
| Construction | 21 (100.0%) | 0 (0.0%) |
| Manufacturing | 16 (100.0%) | 0 (0.0%) |
| Wholesale Trade | 2 (50.0%) | 2 (50.0%) |
| Retail Trade | 6 (46.2%) | 7 (53.8%) |
| Transportation & Warehousing | 8 (72.7%) | 3 (27.3%) |
| Utilities | 3 (100.0%) | 0 (0.0%) |
| Information | 0 (0.0%) | 0 (0.0%) |
| Finance & Insurance | 2 (100.0%) | 0 (0.0%) |
| Real Estate, Rental & Leasing | 2 (50.0%) | 2 (50.0%) |
| Professional & Scientific | 25 (80.6%) | 6 (19.4%) |
| Enterprise Management | 0 (0.0%) | 0 (0.0%) |
| Administrative & Support | 1 (33.3%) | 2 (66.7%) |
| Educational Services | 3 (23.1%) | 10 (76.9%) |
| Health Care & Social Assistance | 5 (26.3%) | 14 (73.7%) |
| Arts, Entertainment & Recreation | 5 (71.4%) | 2 (28.6%) |
| Accommodation & Food Services | 3 (42.9%) | 4 (57.1%) |
| Public Administration | 7 (46.7%) | 8 (53.3%) |
| Total | 120 (61.9%) | 74 (38.1%) |
Education in Perdido Beach
School Enrollment in Perdido Beach
The most common levels of schooling among the 38 students in Perdido Beach are elementary school (16 | 42.1%), middle school (11 | 28.9%), and kindergarten (4 | 10.5%).
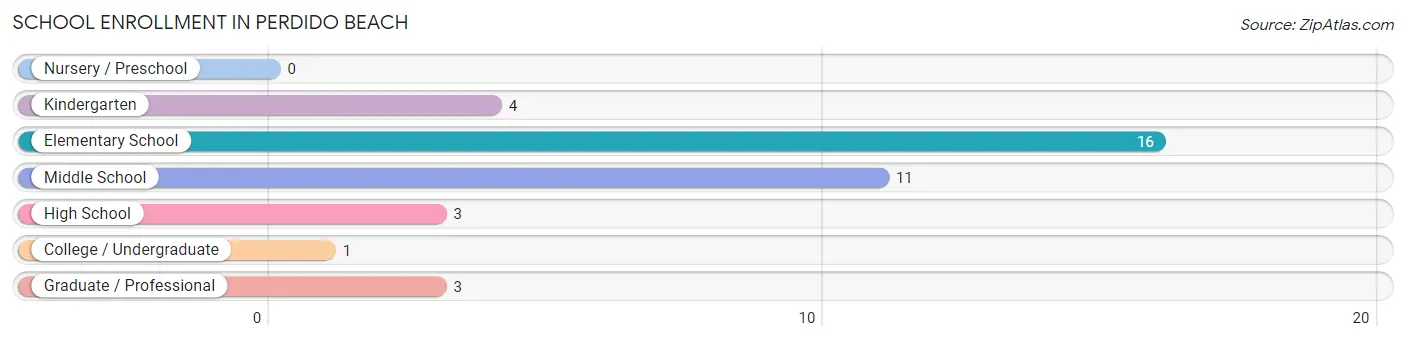
| School Level | # Students | % Students |
| Nursery / Preschool | 0 | 0.0% |
| Kindergarten | 4 | 10.5% |
| Elementary School | 16 | 42.1% |
| Middle School | 11 | 28.9% |
| High School | 3 | 7.9% |
| College / Undergraduate | 1 | 2.6% |
| Graduate / Professional | 3 | 7.9% |
| Total | 38 | 100.0% |
School Enrollment by Age by Funding Source in Perdido Beach
Out of a total of 38 students who are enrolled in schools in Perdido Beach, 5 (13.2%) attend a private institution, while the remaining 33 (86.8%) are enrolled in public schools. The age group of 35 years and over has the highest likelihood of being enrolled in private schools, with 3 (100.0% in the age bracket) enrolled. Conversely, the age group of 10 to 14 year olds has the lowest likelihood of being enrolled in a private school, with 13 (100.0% in the age bracket) attending a public institution.
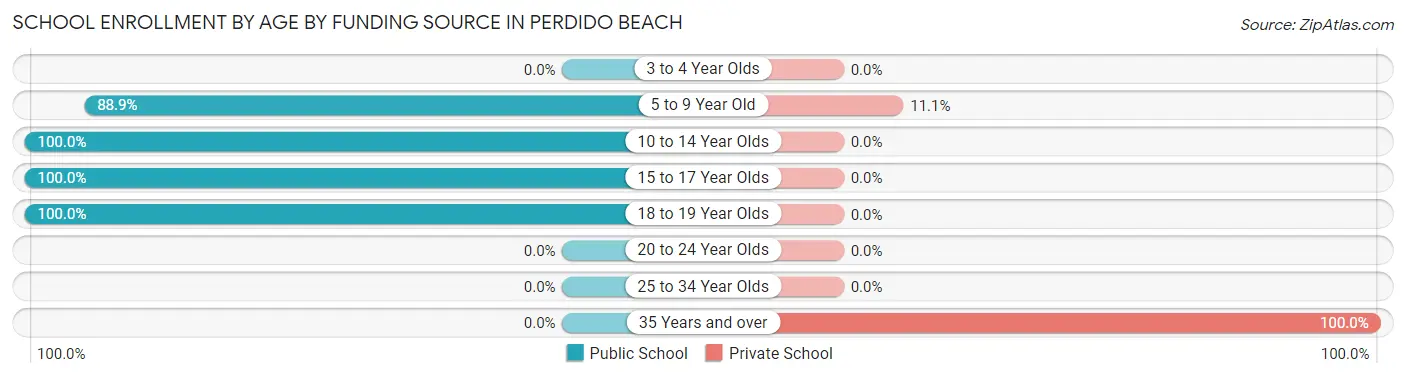
| Age Bracket | Public School | Private School |
| 3 to 4 Year Olds | 0 (0.0%) | 0 (0.0%) |
| 5 to 9 Year Old | 16 (88.9%) | 2 (11.1%) |
| 10 to 14 Year Olds | 13 (100.0%) | 0 (0.0%) |
| 15 to 17 Year Olds | 2 (100.0%) | 0 (0.0%) |
| 18 to 19 Year Olds | 2 (100.0%) | 0 (0.0%) |
| 20 to 24 Year Olds | 0 (0.0%) | 0 (0.0%) |
| 25 to 34 Year Olds | 0 (0.0%) | 0 (0.0%) |
| 35 Years and over | 0 (0.0%) | 3 (100.0%) |
| Total | 33 (86.8%) | 5 (13.2%) |
Educational Attainment by Field of Study in Perdido Beach
Arts & humanities (36 | 24.2%), science & technology (33 | 22.2%), bio, nature & agricultural (16 | 10.7%), business (14 | 9.4%), and engineering (10 | 6.7%) are the most common fields of study among 149 individuals in Perdido Beach who have obtained a bachelor's degree or higher.
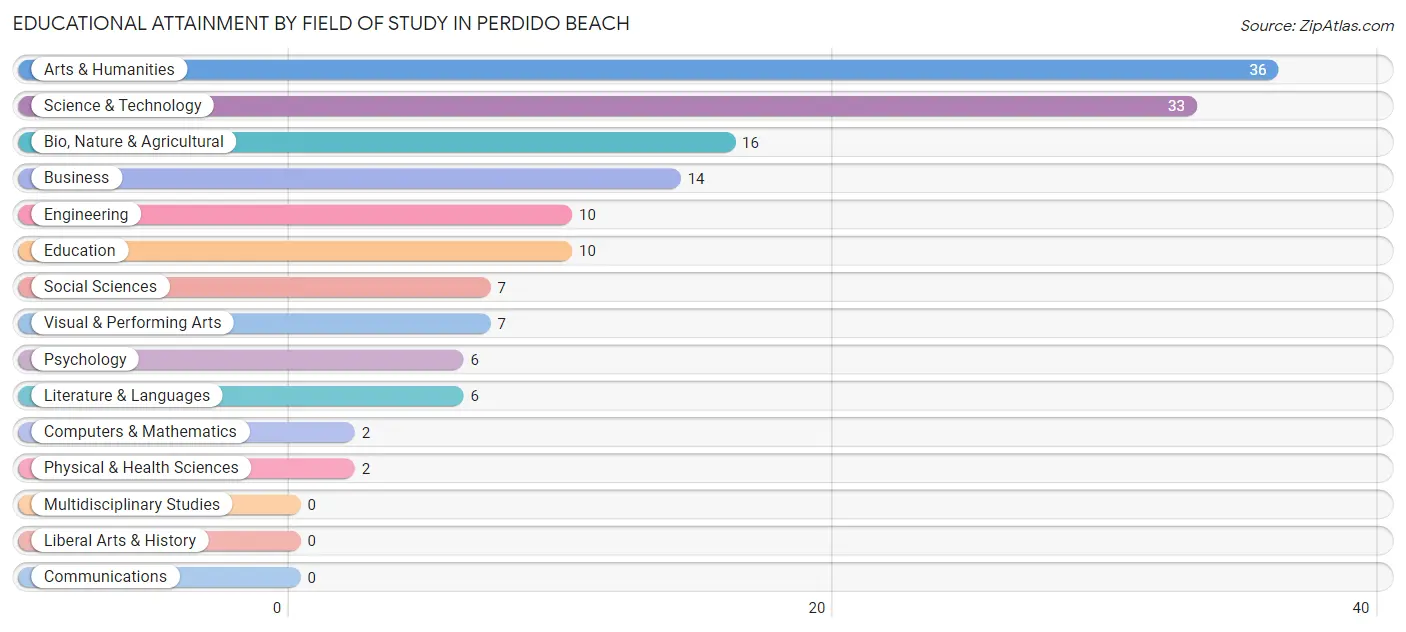
| Field of Study | # Graduates | % Graduates |
| Computers & Mathematics | 2 | 1.3% |
| Bio, Nature & Agricultural | 16 | 10.7% |
| Physical & Health Sciences | 2 | 1.3% |
| Psychology | 6 | 4.0% |
| Social Sciences | 7 | 4.7% |
| Engineering | 10 | 6.7% |
| Multidisciplinary Studies | 0 | 0.0% |
| Science & Technology | 33 | 22.2% |
| Business | 14 | 9.4% |
| Education | 10 | 6.7% |
| Literature & Languages | 6 | 4.0% |
| Liberal Arts & History | 0 | 0.0% |
| Visual & Performing Arts | 7 | 4.7% |
| Communications | 0 | 0.0% |
| Arts & Humanities | 36 | 24.2% |
| Total | 149 | 100.0% |
Transportation & Commute in Perdido Beach
Vehicle Availability by Sex in Perdido Beach
The most prevalent vehicle ownership categories in Perdido Beach are males with 3 vehicles (52, accounting for 43.3%) and females with 3 vehicles (12, making up 70.3%).
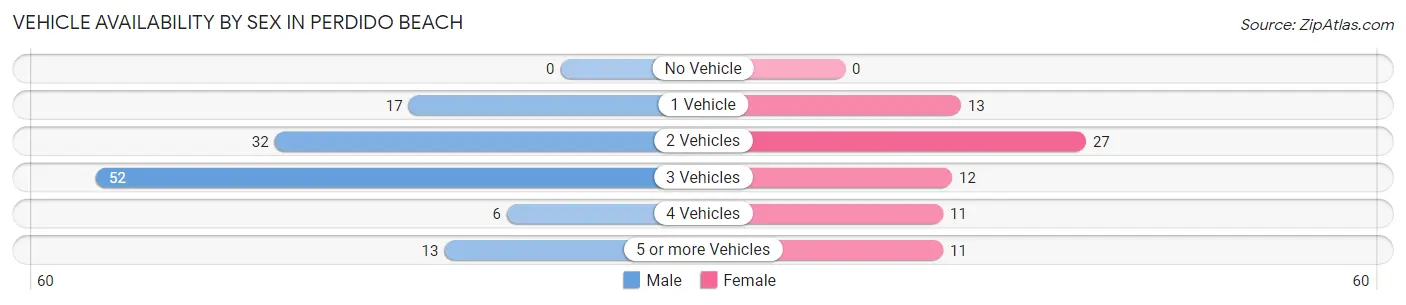
| Vehicles Available | Male | Female |
| No Vehicle | 0 (0.0%) | 0 (0.0%) |
| 1 Vehicle | 17 (14.2%) | 13 (17.6%) |
| 2 Vehicles | 32 (26.7%) | 27 (36.5%) |
| 3 Vehicles | 52 (43.3%) | 12 (16.2%) |
| 4 Vehicles | 6 (5.0%) | 11 (14.9%) |
| 5 or more Vehicles | 13 (10.8%) | 11 (14.9%) |
| Total | 120 (100.0%) | 74 (100.0%) |
Commute Time in Perdido Beach
The most frequently occuring commute durations in Perdido Beach are 15 to 19 minutes (44 commuters, 25.6%), 30 to 34 minutes (40 commuters, 23.3%), and 60 to 89 minutes (21 commuters, 12.2%).
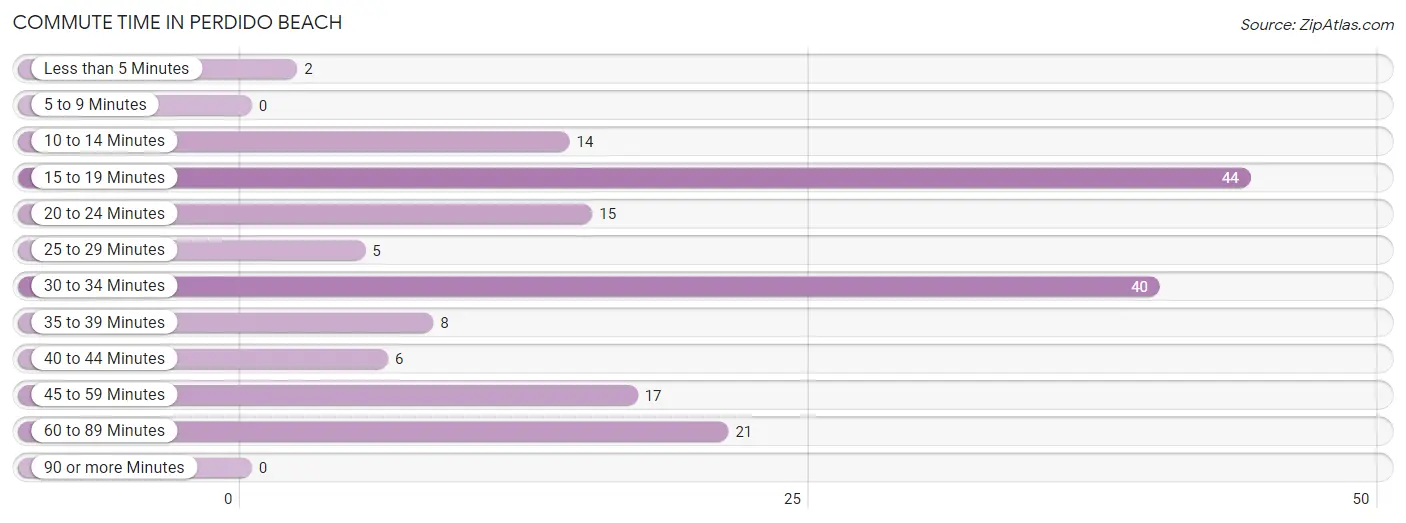
| Commute Time | # Commuters | % Commuters |
| Less than 5 Minutes | 2 | 1.2% |
| 5 to 9 Minutes | 0 | 0.0% |
| 10 to 14 Minutes | 14 | 8.1% |
| 15 to 19 Minutes | 44 | 25.6% |
| 20 to 24 Minutes | 15 | 8.7% |
| 25 to 29 Minutes | 5 | 2.9% |
| 30 to 34 Minutes | 40 | 23.3% |
| 35 to 39 Minutes | 8 | 4.6% |
| 40 to 44 Minutes | 6 | 3.5% |
| 45 to 59 Minutes | 17 | 9.9% |
| 60 to 89 Minutes | 21 | 12.2% |
| 90 or more Minutes | 0 | 0.0% |
Commute Time by Sex in Perdido Beach
The most common commute times in Perdido Beach are 15 to 19 minutes (34 commuters, 32.1%) for males and 30 to 34 minutes (24 commuters, 36.4%) for females.
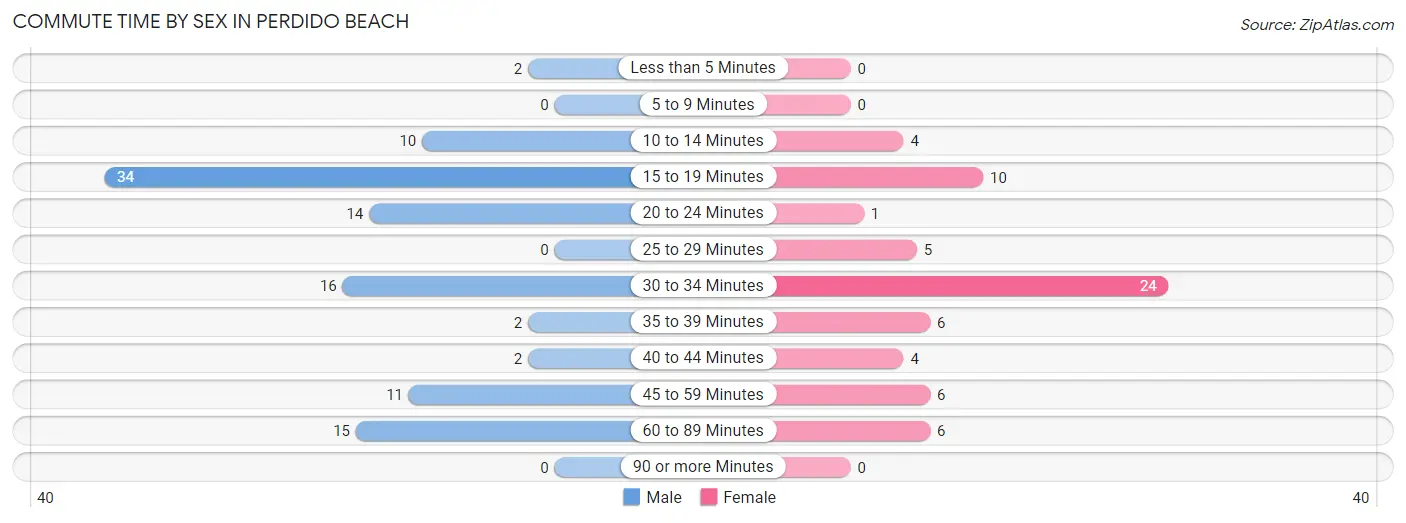
| Commute Time | Male | Female |
| Less than 5 Minutes | 2 (1.9%) | 0 (0.0%) |
| 5 to 9 Minutes | 0 (0.0%) | 0 (0.0%) |
| 10 to 14 Minutes | 10 (9.4%) | 4 (6.1%) |
| 15 to 19 Minutes | 34 (32.1%) | 10 (15.1%) |
| 20 to 24 Minutes | 14 (13.2%) | 1 (1.5%) |
| 25 to 29 Minutes | 0 (0.0%) | 5 (7.6%) |
| 30 to 34 Minutes | 16 (15.1%) | 24 (36.4%) |
| 35 to 39 Minutes | 2 (1.9%) | 6 (9.1%) |
| 40 to 44 Minutes | 2 (1.9%) | 4 (6.1%) |
| 45 to 59 Minutes | 11 (10.4%) | 6 (9.1%) |
| 60 to 89 Minutes | 15 (14.1%) | 6 (9.1%) |
| 90 or more Minutes | 0 (0.0%) | 0 (0.0%) |
Time of Departure to Work by Sex in Perdido Beach
The most frequent times of departure to work in Perdido Beach are 6:30 AM to 6:59 AM (31, 29.2%) for males and 8:00 AM to 8:29 AM (19, 28.8%) for females.
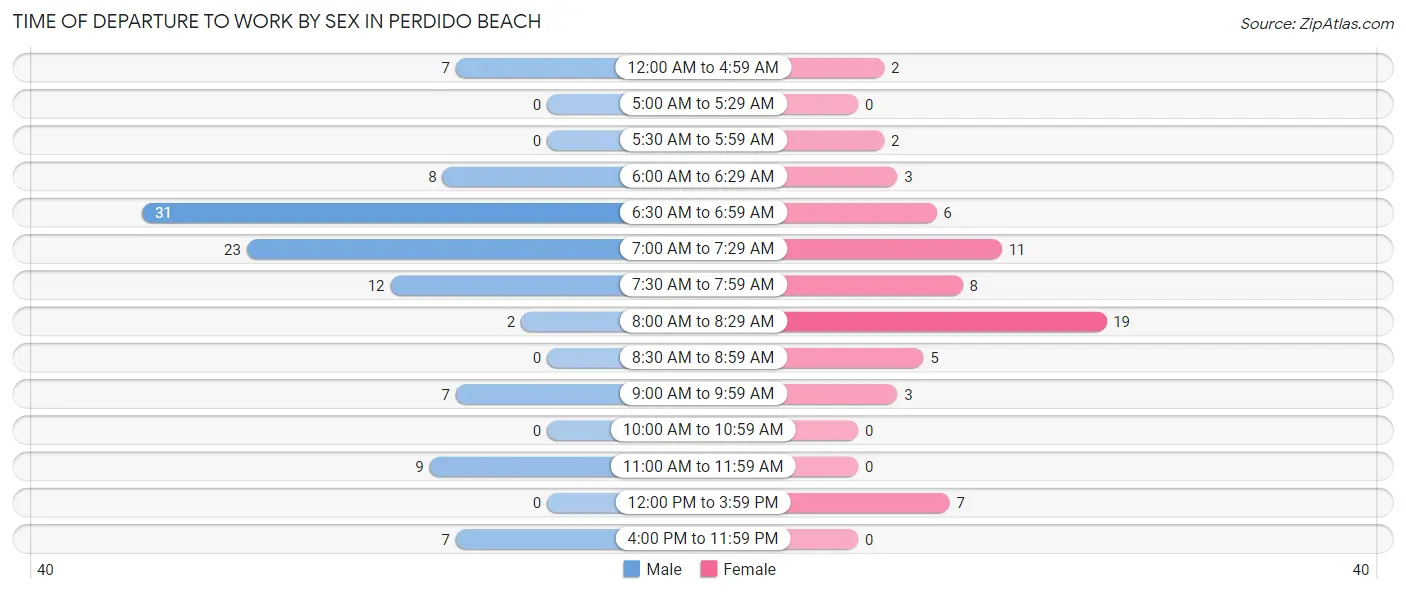
| Time of Departure | Male | Female |
| 12:00 AM to 4:59 AM | 7 (6.6%) | 2 (3.0%) |
| 5:00 AM to 5:29 AM | 0 (0.0%) | 0 (0.0%) |
| 5:30 AM to 5:59 AM | 0 (0.0%) | 2 (3.0%) |
| 6:00 AM to 6:29 AM | 8 (7.5%) | 3 (4.5%) |
| 6:30 AM to 6:59 AM | 31 (29.2%) | 6 (9.1%) |
| 7:00 AM to 7:29 AM | 23 (21.7%) | 11 (16.7%) |
| 7:30 AM to 7:59 AM | 12 (11.3%) | 8 (12.1%) |
| 8:00 AM to 8:29 AM | 2 (1.9%) | 19 (28.8%) |
| 8:30 AM to 8:59 AM | 0 (0.0%) | 5 (7.6%) |
| 9:00 AM to 9:59 AM | 7 (6.6%) | 3 (4.5%) |
| 10:00 AM to 10:59 AM | 0 (0.0%) | 0 (0.0%) |
| 11:00 AM to 11:59 AM | 9 (8.5%) | 0 (0.0%) |
| 12:00 PM to 3:59 PM | 0 (0.0%) | 7 (10.6%) |
| 4:00 PM to 11:59 PM | 7 (6.6%) | 0 (0.0%) |
| Total | 106 (100.0%) | 66 (100.0%) |
Housing Occupancy in Perdido Beach
Occupancy by Ownership in Perdido Beach
Of the total 228 dwellings in Perdido Beach, owner-occupied units account for 224 (98.3%), while renter-occupied units make up 4 (1.8%).
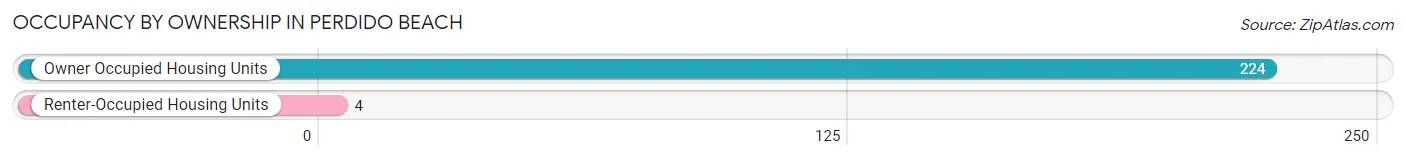
| Occupancy | # Housing Units | % Housing Units |
| Owner Occupied Housing Units | 224 | 98.3% |
| Renter-Occupied Housing Units | 4 | 1.8% |
| Total Occupied Housing Units | 228 | 100.0% |
Occupancy by Household Size in Perdido Beach
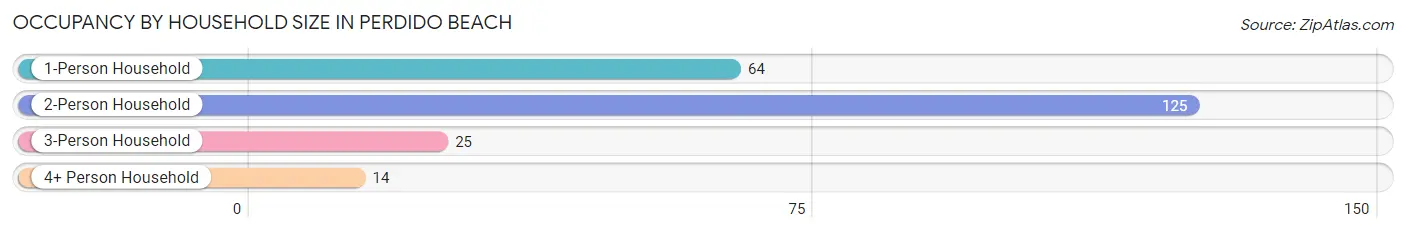
| Household Size | # Housing Units | % Housing Units |
| 1-Person Household | 64 | 28.1% |
| 2-Person Household | 125 | 54.8% |
| 3-Person Household | 25 | 11.0% |
| 4+ Person Household | 14 | 6.1% |
| Total Housing Units | 228 | 100.0% |
Occupancy by Ownership by Household Size in Perdido Beach
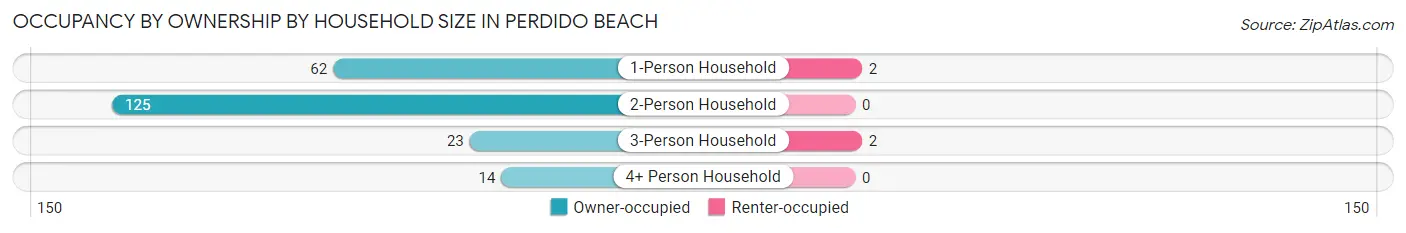
| Household Size | Owner-occupied | Renter-occupied |
| 1-Person Household | 62 (96.9%) | 2 (3.1%) |
| 2-Person Household | 125 (100.0%) | 0 (0.0%) |
| 3-Person Household | 23 (92.0%) | 2 (8.0%) |
| 4+ Person Household | 14 (100.0%) | 0 (0.0%) |
| Total Housing Units | 224 (98.3%) | 4 (1.8%) |
Occupancy by Educational Attainment in Perdido Beach
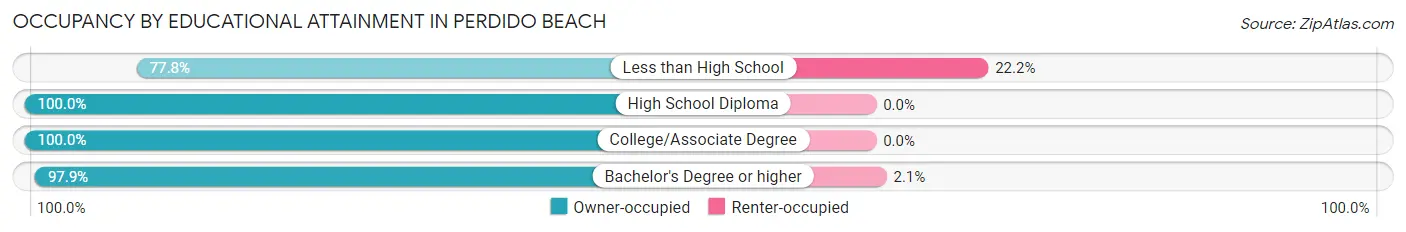
| Household Size | Owner-occupied | Renter-occupied |
| Less than High School | 7 (77.8%) | 2 (22.2%) |
| High School Diploma | 58 (100.0%) | 0 (0.0%) |
| College/Associate Degree | 64 (100.0%) | 0 (0.0%) |
| Bachelor's Degree or higher | 95 (97.9%) | 2 (2.1%) |
Occupancy by Age of Householder in Perdido Beach
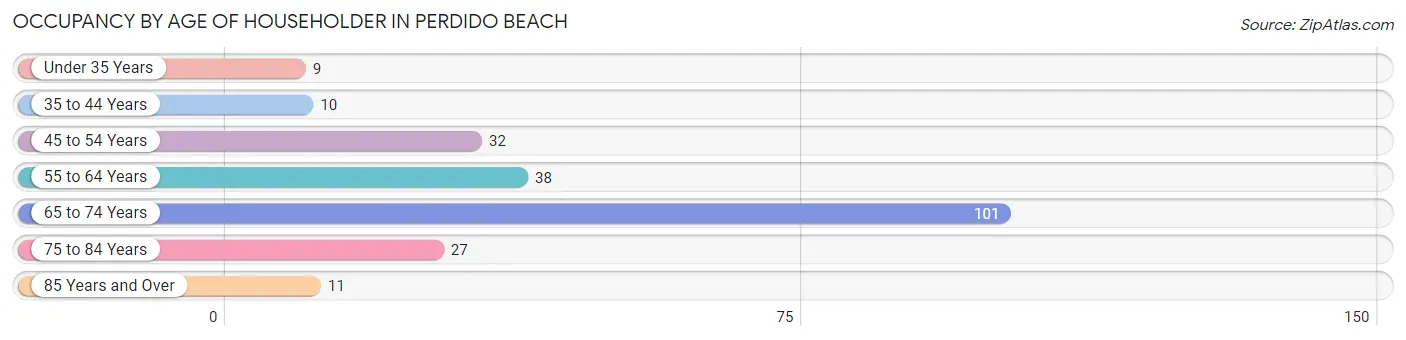
| Age Bracket | # Households | % Households |
| Under 35 Years | 9 | 4.0% |
| 35 to 44 Years | 10 | 4.4% |
| 45 to 54 Years | 32 | 14.0% |
| 55 to 64 Years | 38 | 16.7% |
| 65 to 74 Years | 101 | 44.3% |
| 75 to 84 Years | 27 | 11.8% |
| 85 Years and Over | 11 | 4.8% |
| Total | 228 | 100.0% |
Housing Finances in Perdido Beach
Median Income by Occupancy in Perdido Beach
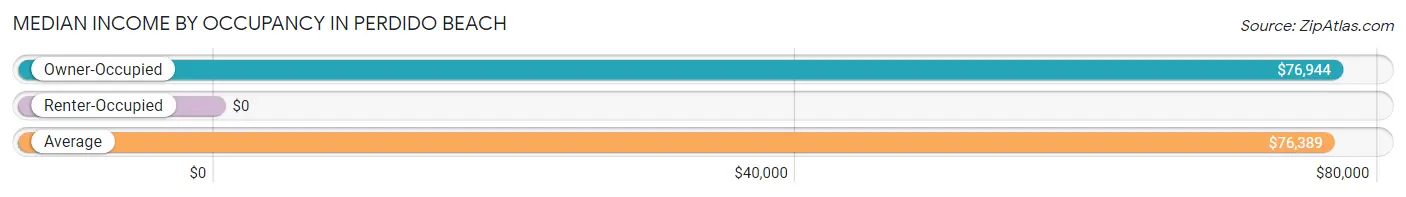
| Occupancy Type | # Households | Median Income |
| Owner-Occupied | 224 (98.3%) | $76,944 |
| Renter-Occupied | 4 (1.8%) | $0 |
| Average | 228 (100.0%) | $76,389 |
Occupancy by Householder Income Bracket in Perdido Beach
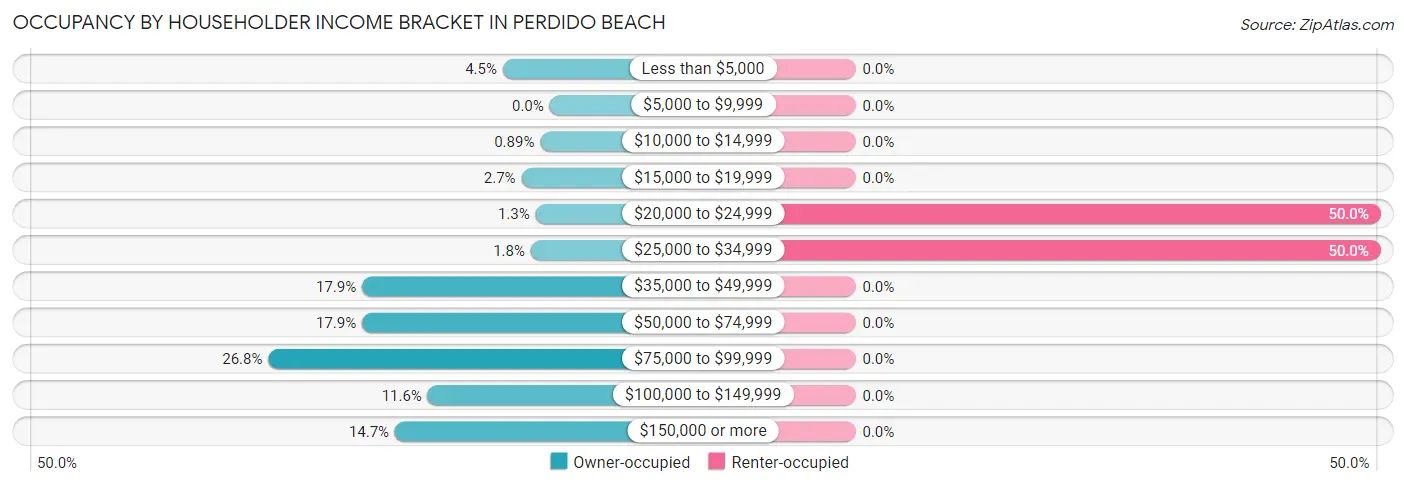
| Income Bracket | Owner-occupied | Renter-occupied |
| Less than $5,000 | 10 (4.5%) | 0 (0.0%) |
| $5,000 to $9,999 | 0 (0.0%) | 0 (0.0%) |
| $10,000 to $14,999 | 2 (0.9%) | 0 (0.0%) |
| $15,000 to $19,999 | 6 (2.7%) | 0 (0.0%) |
| $20,000 to $24,999 | 3 (1.3%) | 2 (50.0%) |
| $25,000 to $34,999 | 4 (1.8%) | 2 (50.0%) |
| $35,000 to $49,999 | 40 (17.9%) | 0 (0.0%) |
| $50,000 to $74,999 | 40 (17.9%) | 0 (0.0%) |
| $75,000 to $99,999 | 60 (26.8%) | 0 (0.0%) |
| $100,000 to $149,999 | 26 (11.6%) | 0 (0.0%) |
| $150,000 or more | 33 (14.7%) | 0 (0.0%) |
| Total | 224 (100.0%) | 4 (100.0%) |
Monthly Housing Cost Tiers in Perdido Beach
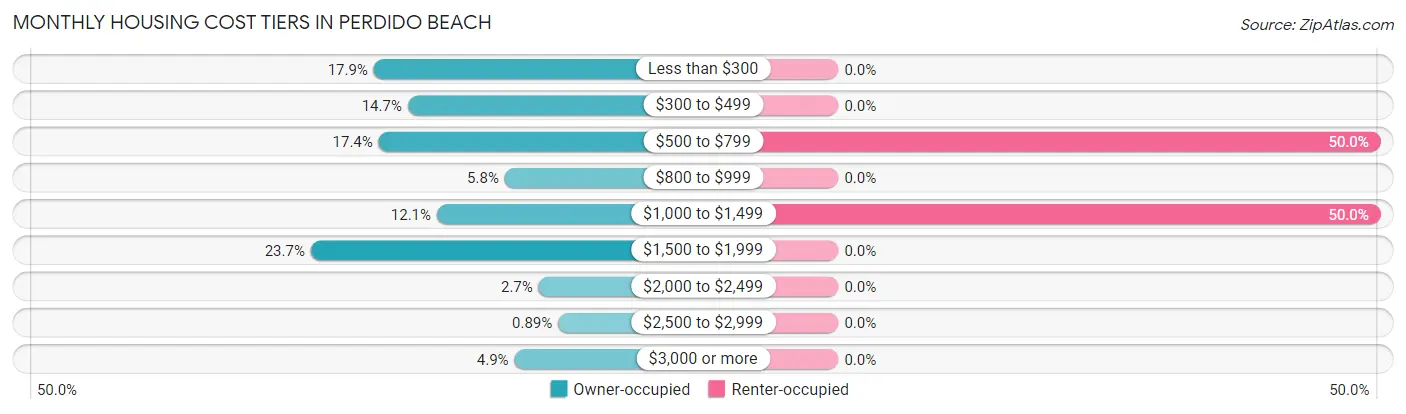
| Monthly Cost | Owner-occupied | Renter-occupied |
| Less than $300 | 40 (17.9%) | 0 (0.0%) |
| $300 to $499 | 33 (14.7%) | 0 (0.0%) |
| $500 to $799 | 39 (17.4%) | 2 (50.0%) |
| $800 to $999 | 13 (5.8%) | 0 (0.0%) |
| $1,000 to $1,499 | 27 (12.0%) | 2 (50.0%) |
| $1,500 to $1,999 | 53 (23.7%) | 0 (0.0%) |
| $2,000 to $2,499 | 6 (2.7%) | 0 (0.0%) |
| $2,500 to $2,999 | 2 (0.9%) | 0 (0.0%) |
| $3,000 or more | 11 (4.9%) | 0 (0.0%) |
| Total | 224 (100.0%) | 4 (100.0%) |
Physical Housing Characteristics in Perdido Beach
Housing Structures in Perdido Beach
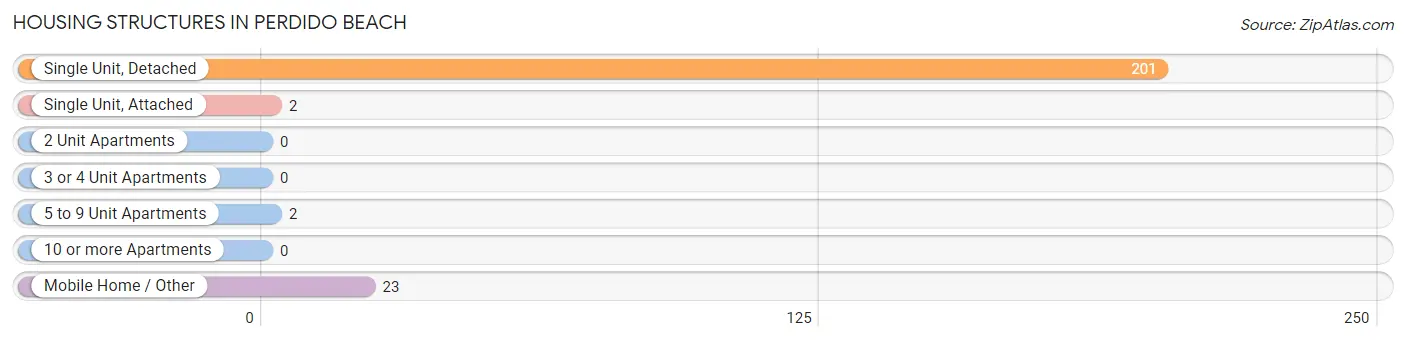
| Structure Type | # Housing Units | % Housing Units |
| Single Unit, Detached | 201 | 88.2% |
| Single Unit, Attached | 2 | 0.9% |
| 2 Unit Apartments | 0 | 0.0% |
| 3 or 4 Unit Apartments | 0 | 0.0% |
| 5 to 9 Unit Apartments | 2 | 0.9% |
| 10 or more Apartments | 0 | 0.0% |
| Mobile Home / Other | 23 | 10.1% |
| Total | 228 | 100.0% |
Housing Structures by Occupancy in Perdido Beach
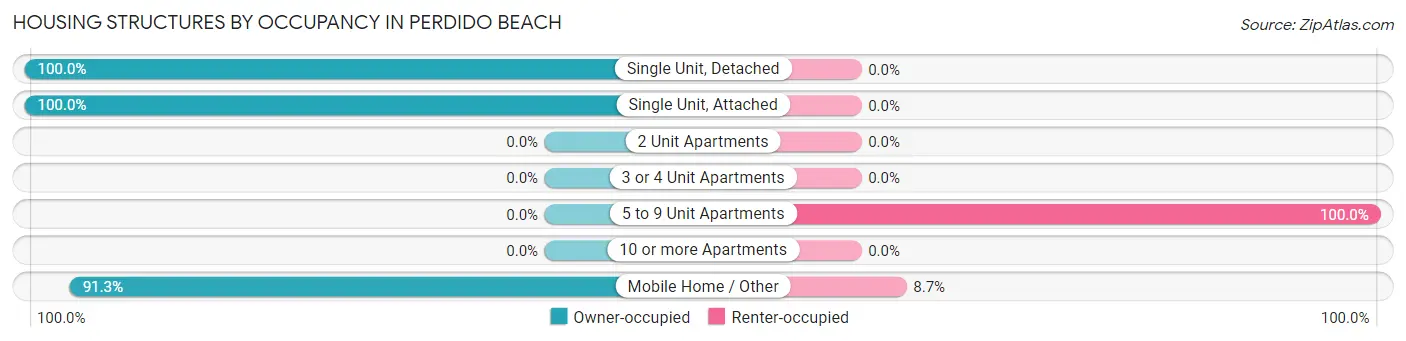
| Structure Type | Owner-occupied | Renter-occupied |
| Single Unit, Detached | 201 (100.0%) | 0 (0.0%) |
| Single Unit, Attached | 2 (100.0%) | 0 (0.0%) |
| 2 Unit Apartments | 0 (0.0%) | 0 (0.0%) |
| 3 or 4 Unit Apartments | 0 (0.0%) | 0 (0.0%) |
| 5 to 9 Unit Apartments | 0 (0.0%) | 2 (100.0%) |
| 10 or more Apartments | 0 (0.0%) | 0 (0.0%) |
| Mobile Home / Other | 21 (91.3%) | 2 (8.7%) |
| Total | 224 (98.3%) | 4 (1.8%) |
Housing Structures by Number of Rooms in Perdido Beach
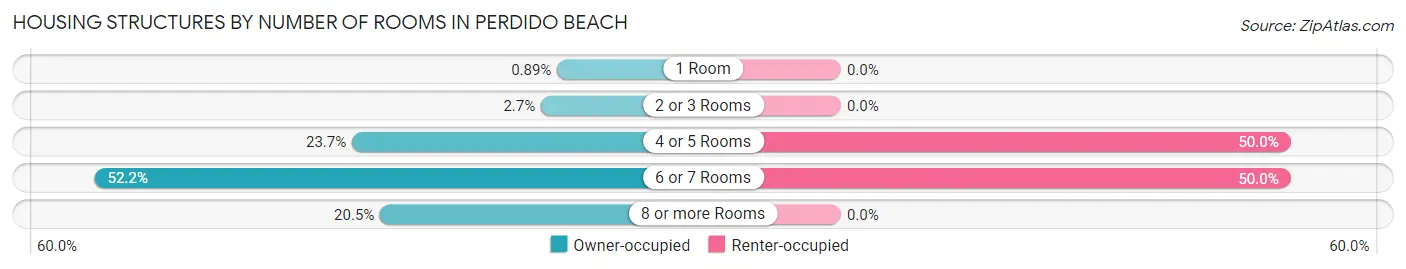
| Number of Rooms | Owner-occupied | Renter-occupied |
| 1 Room | 2 (0.9%) | 0 (0.0%) |
| 2 or 3 Rooms | 6 (2.7%) | 0 (0.0%) |
| 4 or 5 Rooms | 53 (23.7%) | 2 (50.0%) |
| 6 or 7 Rooms | 117 (52.2%) | 2 (50.0%) |
| 8 or more Rooms | 46 (20.5%) | 0 (0.0%) |
| Total | 224 (100.0%) | 4 (100.0%) |
Housing Structure by Heating Type in Perdido Beach
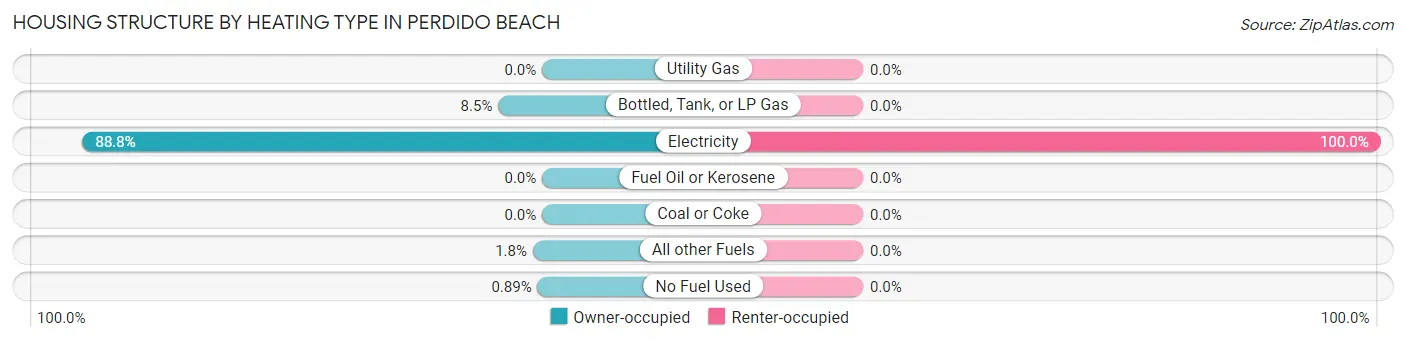
| Heating Type | Owner-occupied | Renter-occupied |
| Utility Gas | 0 (0.0%) | 0 (0.0%) |
| Bottled, Tank, or LP Gas | 19 (8.5%) | 0 (0.0%) |
| Electricity | 199 (88.8%) | 4 (100.0%) |
| Fuel Oil or Kerosene | 0 (0.0%) | 0 (0.0%) |
| Coal or Coke | 0 (0.0%) | 0 (0.0%) |
| All other Fuels | 4 (1.8%) | 0 (0.0%) |
| No Fuel Used | 2 (0.9%) | 0 (0.0%) |
| Total | 224 (100.0%) | 4 (100.0%) |
Household Vehicle Usage in Perdido Beach
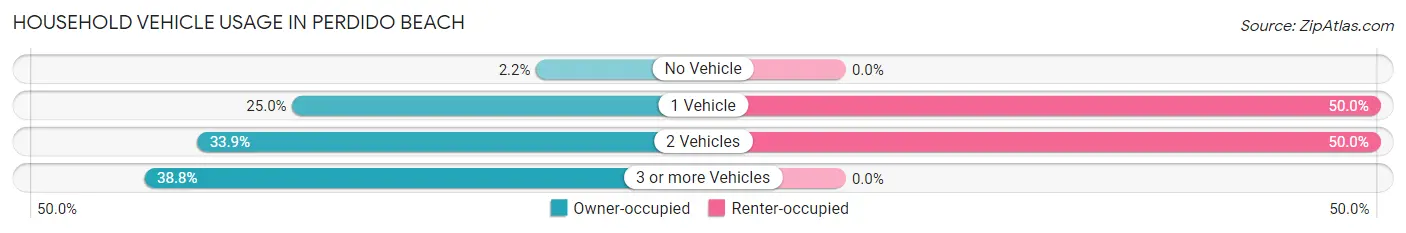
| Vehicles per Household | Owner-occupied | Renter-occupied |
| No Vehicle | 5 (2.2%) | 0 (0.0%) |
| 1 Vehicle | 56 (25.0%) | 2 (50.0%) |
| 2 Vehicles | 76 (33.9%) | 2 (50.0%) |
| 3 or more Vehicles | 87 (38.8%) | 0 (0.0%) |
| Total | 224 (100.0%) | 4 (100.0%) |
Real Estate & Mortgages in Perdido Beach
Real Estate and Mortgage Overview in Perdido Beach
| Characteristic | Without Mortgage | With Mortgage |
| Housing Units | 113 | 111 |
| Median Property Value | $229,200 | $266,200 |
| Median Household Income | $68,958 | $14 |
| Monthly Housing Costs | $403 | $11 |
| Real Estate Taxes | $763 | $2 |
Property Value by Mortgage Status in Perdido Beach
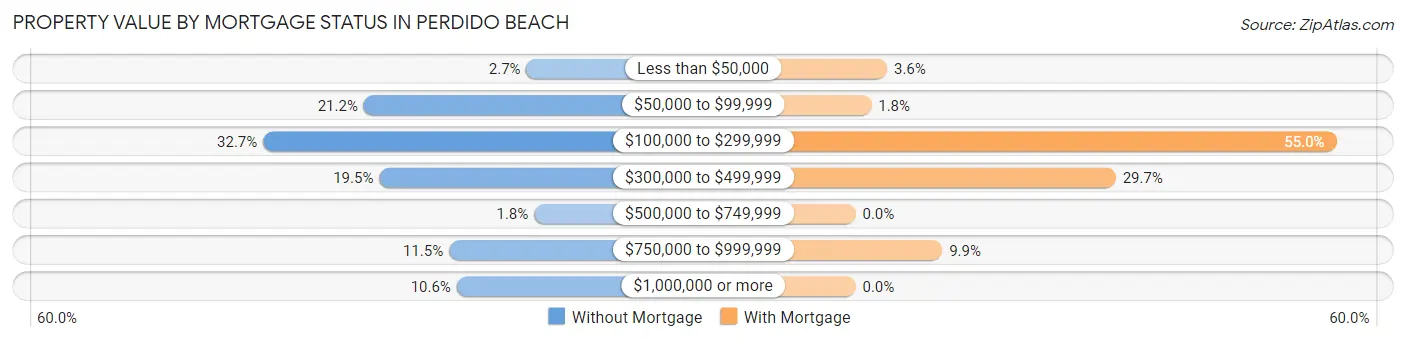
| Property Value | Without Mortgage | With Mortgage |
| Less than $50,000 | 3 (2.6%) | 4 (3.6%) |
| $50,000 to $99,999 | 24 (21.2%) | 2 (1.8%) |
| $100,000 to $299,999 | 37 (32.7%) | 61 (54.9%) |
| $300,000 to $499,999 | 22 (19.5%) | 33 (29.7%) |
| $500,000 to $749,999 | 2 (1.8%) | 0 (0.0%) |
| $750,000 to $999,999 | 13 (11.5%) | 11 (9.9%) |
| $1,000,000 or more | 12 (10.6%) | 0 (0.0%) |
| Total | 113 (100.0%) | 111 (100.0%) |
Household Income by Mortgage Status in Perdido Beach
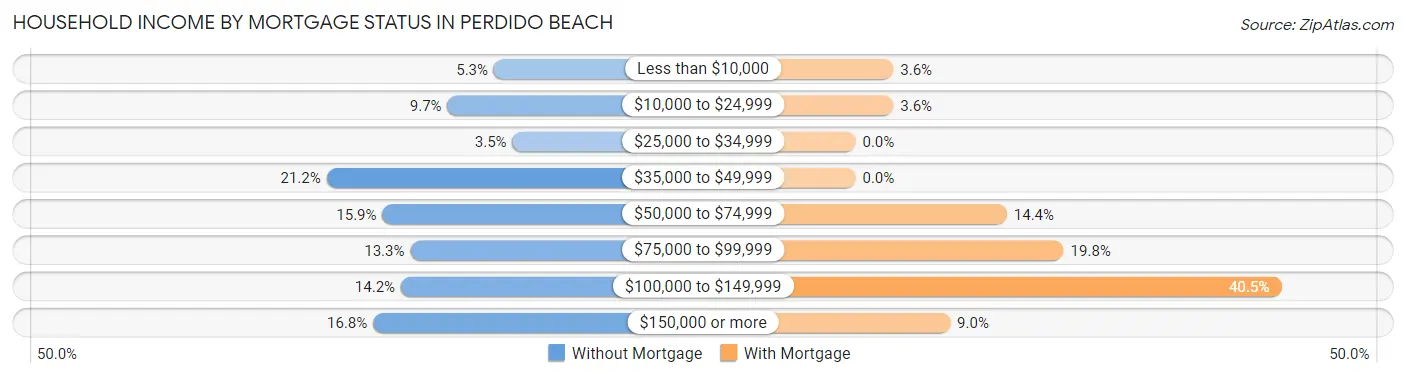
| Household Income | Without Mortgage | With Mortgage |
| Less than $10,000 | 6 (5.3%) | 4 (3.6%) |
| $10,000 to $24,999 | 11 (9.7%) | 4 (3.6%) |
| $25,000 to $34,999 | 4 (3.5%) | 0 (0.0%) |
| $35,000 to $49,999 | 24 (21.2%) | 0 (0.0%) |
| $50,000 to $74,999 | 18 (15.9%) | 16 (14.4%) |
| $75,000 to $99,999 | 15 (13.3%) | 22 (19.8%) |
| $100,000 to $149,999 | 16 (14.2%) | 45 (40.5%) |
| $150,000 or more | 19 (16.8%) | 10 (9.0%) |
| Total | 113 (100.0%) | 111 (100.0%) |
Property Value to Household Income Ratio in Perdido Beach
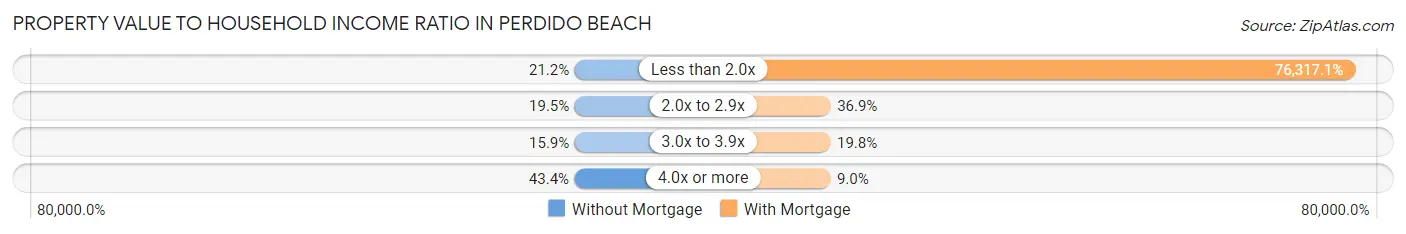
| Value-to-Income Ratio | Without Mortgage | With Mortgage |
| Less than 2.0x | 24 (21.2%) | 84,712 (76,317.1%) |
| 2.0x to 2.9x | 22 (19.5%) | 41 (36.9%) |
| 3.0x to 3.9x | 18 (15.9%) | 22 (19.8%) |
| 4.0x or more | 49 (43.4%) | 10 (9.0%) |
| Total | 113 (100.0%) | 111 (100.0%) |
Real Estate Taxes by Mortgage Status in Perdido Beach
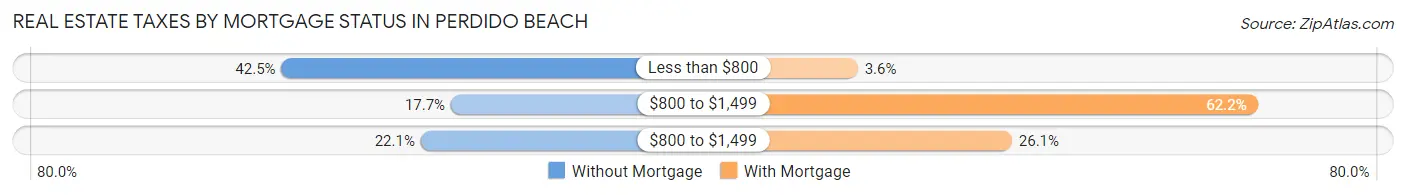
| Property Taxes | Without Mortgage | With Mortgage |
| Less than $800 | 48 (42.5%) | 4 (3.6%) |
| $800 to $1,499 | 20 (17.7%) | 69 (62.2%) |
| $800 to $1,499 | 25 (22.1%) | 29 (26.1%) |
| Total | 113 (100.0%) | 111 (100.0%) |
Health & Disability in Perdido Beach
Health Insurance Coverage by Age in Perdido Beach
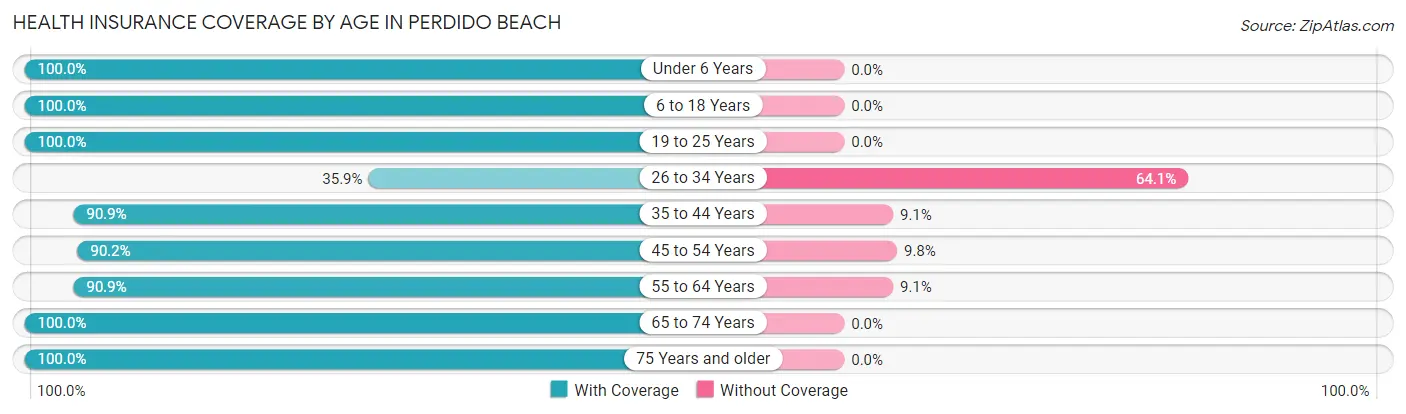
| Age Bracket | With Coverage | Without Coverage |
| Under 6 Years | 14 (100.0%) | 0 (0.0%) |
| 6 to 18 Years | 34 (100.0%) | 0 (0.0%) |
| 19 to 25 Years | 7 (100.0%) | 0 (0.0%) |
| 26 to 34 Years | 14 (35.9%) | 25 (64.1%) |
| 35 to 44 Years | 20 (90.9%) | 2 (9.1%) |
| 45 to 54 Years | 55 (90.2%) | 6 (9.8%) |
| 55 to 64 Years | 70 (90.9%) | 7 (9.1%) |
| 65 to 74 Years | 151 (100.0%) | 0 (0.0%) |
| 75 Years and older | 59 (100.0%) | 0 (0.0%) |
| Total | 424 (91.4%) | 40 (8.6%) |
Health Insurance Coverage by Citizenship Status in Perdido Beach
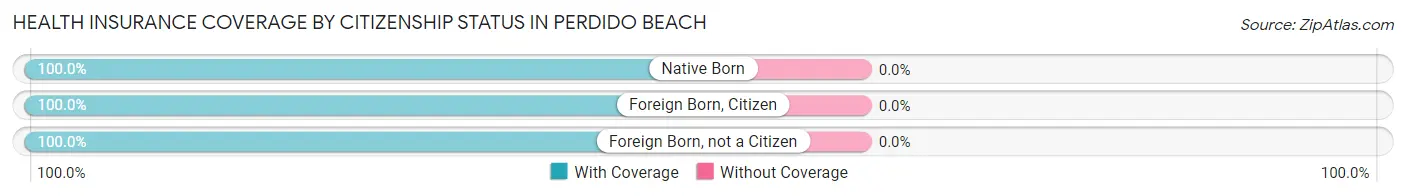
| Citizenship Status | With Coverage | Without Coverage |
| Native Born | 14 (100.0%) | 0 (0.0%) |
| Foreign Born, Citizen | 34 (100.0%) | 0 (0.0%) |
| Foreign Born, not a Citizen | 7 (100.0%) | 0 (0.0%) |
Health Insurance Coverage by Household Income in Perdido Beach
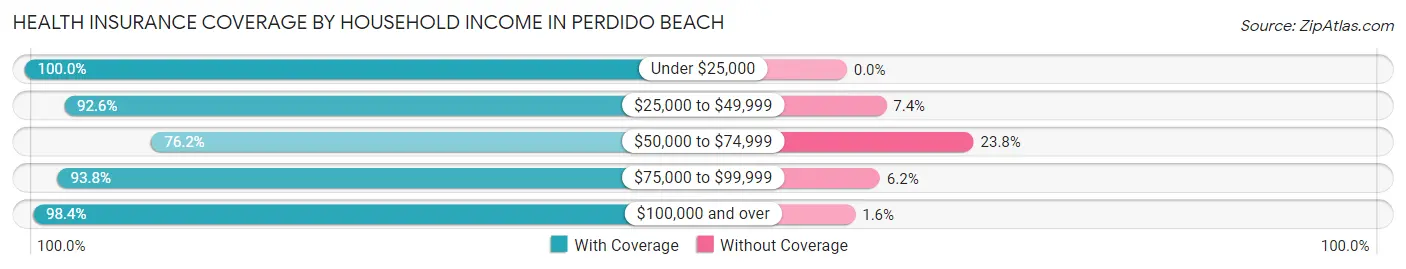
| Household Income | With Coverage | Without Coverage |
| Under $25,000 | 27 (100.0%) | 0 (0.0%) |
| $25,000 to $49,999 | 75 (92.6%) | 6 (7.4%) |
| $50,000 to $74,999 | 77 (76.2%) | 24 (23.8%) |
| $75,000 to $99,999 | 121 (93.8%) | 8 (6.2%) |
| $100,000 and over | 124 (98.4%) | 2 (1.6%) |
Public vs Private Health Insurance Coverage by Age in Perdido Beach
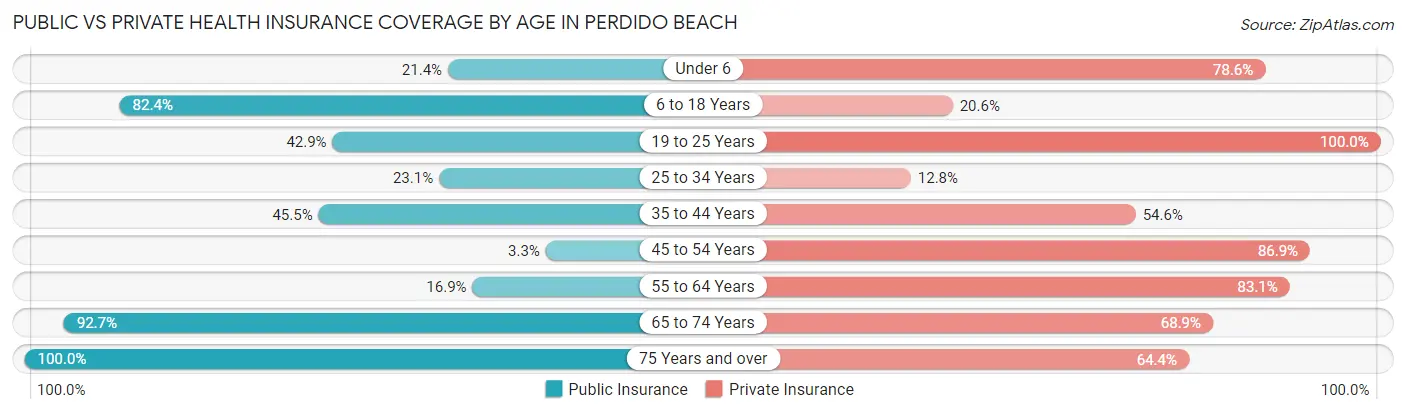
| Age Bracket | Public Insurance | Private Insurance |
| Under 6 | 3 (21.4%) | 11 (78.6%) |
| 6 to 18 Years | 28 (82.4%) | 7 (20.6%) |
| 19 to 25 Years | 3 (42.9%) | 7 (100.0%) |
| 25 to 34 Years | 9 (23.1%) | 5 (12.8%) |
| 35 to 44 Years | 10 (45.5%) | 12 (54.5%) |
| 45 to 54 Years | 2 (3.3%) | 53 (86.9%) |
| 55 to 64 Years | 13 (16.9%) | 64 (83.1%) |
| 65 to 74 Years | 140 (92.7%) | 104 (68.9%) |
| 75 Years and over | 59 (100.0%) | 38 (64.4%) |
| Total | 267 (57.5%) | 301 (64.9%) |
Disability Status by Sex by Age in Perdido Beach
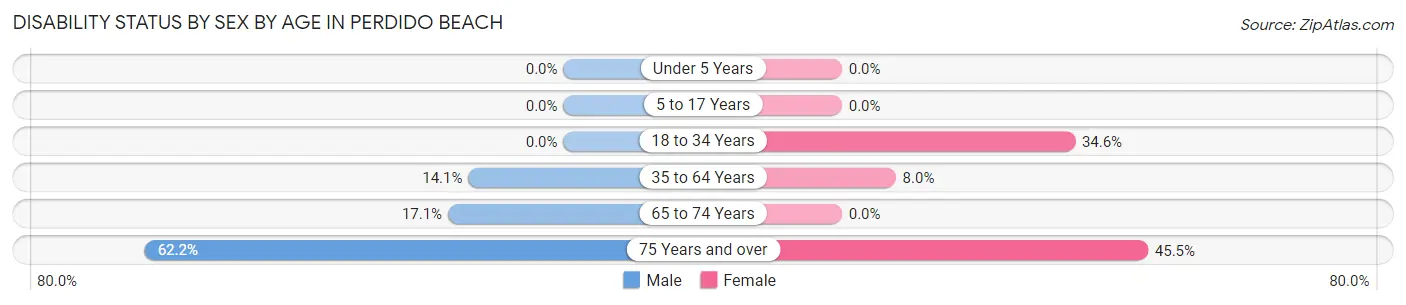
| Age Bracket | Male | Female |
| Under 5 Years | 0 (0.0%) | 0 (0.0%) |
| 5 to 17 Years | 0 (0.0%) | 0 (0.0%) |
| 18 to 34 Years | 0 (0.0%) | 9 (34.6%) |
| 35 to 64 Years | 12 (14.1%) | 6 (8.0%) |
| 65 to 74 Years | 12 (17.1%) | 0 (0.0%) |
| 75 Years and over | 23 (62.2%) | 10 (45.5%) |
Disability Class by Sex by Age in Perdido Beach
Disability Class: Hearing Difficulty
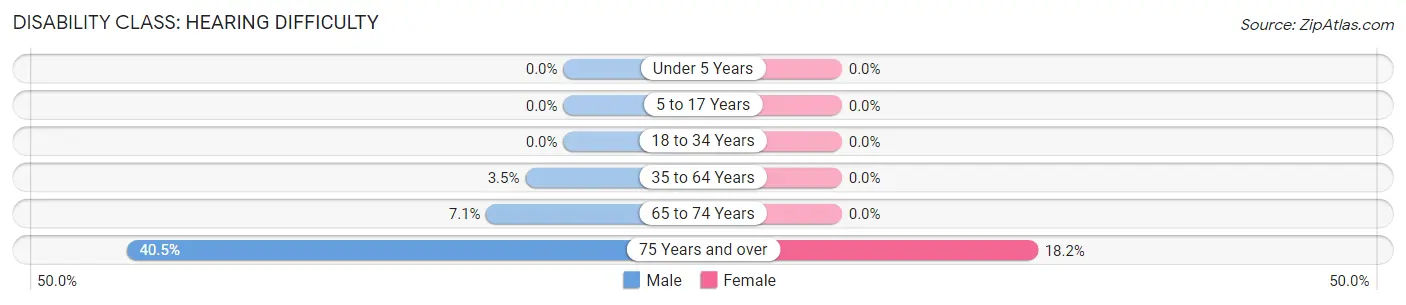
| Age Bracket | Male | Female |
| Under 5 Years | 0 (0.0%) | 0 (0.0%) |
| 5 to 17 Years | 0 (0.0%) | 0 (0.0%) |
| 18 to 34 Years | 0 (0.0%) | 0 (0.0%) |
| 35 to 64 Years | 3 (3.5%) | 0 (0.0%) |
| 65 to 74 Years | 5 (7.1%) | 0 (0.0%) |
| 75 Years and over | 15 (40.5%) | 4 (18.2%) |
Disability Class: Vision Difficulty
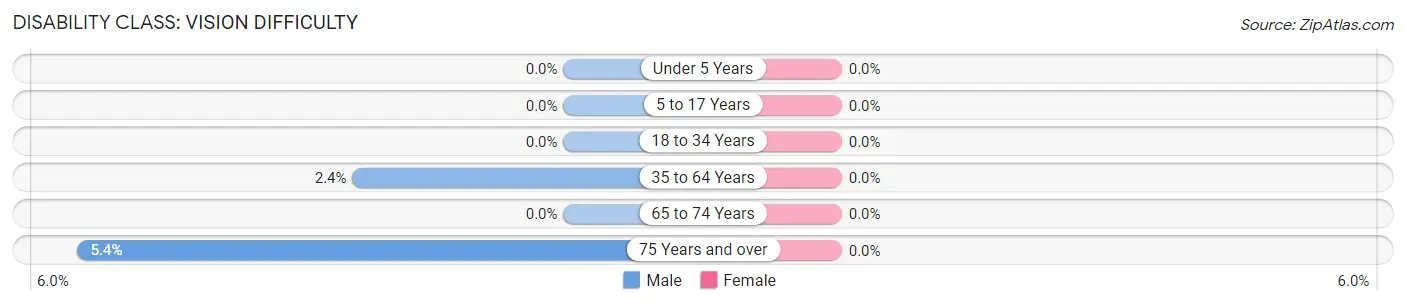
| Age Bracket | Male | Female |
| Under 5 Years | 0 (0.0%) | 0 (0.0%) |
| 5 to 17 Years | 0 (0.0%) | 0 (0.0%) |
| 18 to 34 Years | 0 (0.0%) | 0 (0.0%) |
| 35 to 64 Years | 2 (2.4%) | 0 (0.0%) |
| 65 to 74 Years | 0 (0.0%) | 0 (0.0%) |
| 75 Years and over | 2 (5.4%) | 0 (0.0%) |
Disability Class: Cognitive Difficulty
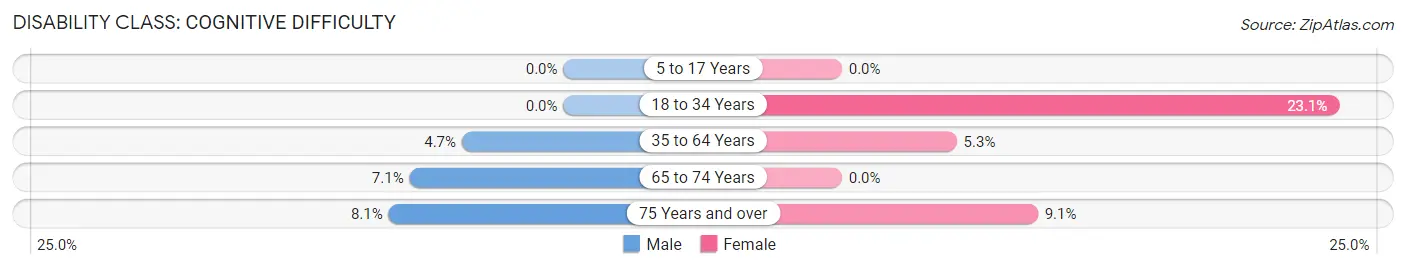
| Age Bracket | Male | Female |
| 5 to 17 Years | 0 (0.0%) | 0 (0.0%) |
| 18 to 34 Years | 0 (0.0%) | 6 (23.1%) |
| 35 to 64 Years | 4 (4.7%) | 4 (5.3%) |
| 65 to 74 Years | 5 (7.1%) | 0 (0.0%) |
| 75 Years and over | 3 (8.1%) | 2 (9.1%) |
Disability Class: Ambulatory Difficulty
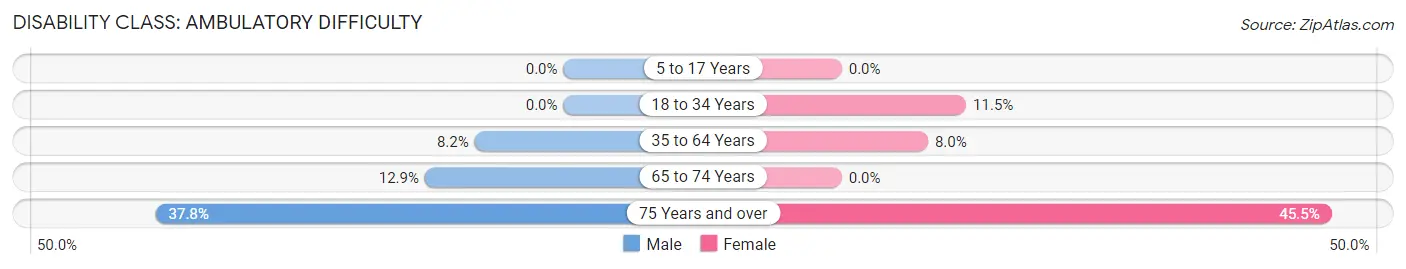
| Age Bracket | Male | Female |
| 5 to 17 Years | 0 (0.0%) | 0 (0.0%) |
| 18 to 34 Years | 0 (0.0%) | 3 (11.5%) |
| 35 to 64 Years | 7 (8.2%) | 6 (8.0%) |
| 65 to 74 Years | 9 (12.9%) | 0 (0.0%) |
| 75 Years and over | 14 (37.8%) | 10 (45.5%) |
Disability Class: Self-Care Difficulty
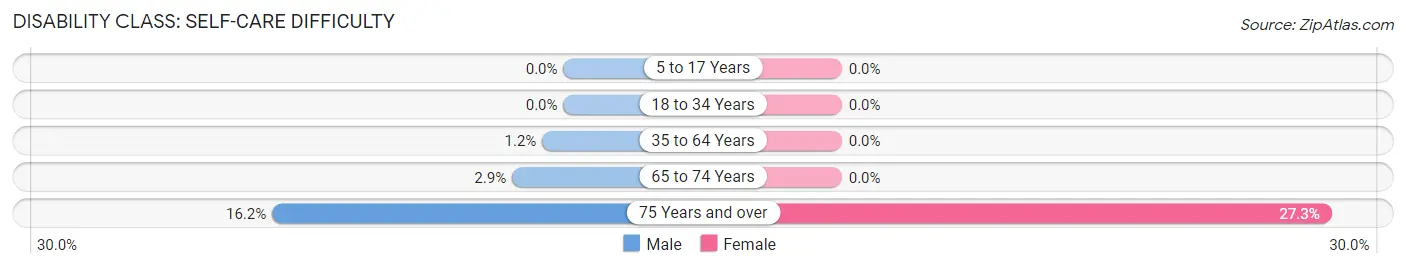
| Age Bracket | Male | Female |
| 5 to 17 Years | 0 (0.0%) | 0 (0.0%) |
| 18 to 34 Years | 0 (0.0%) | 0 (0.0%) |
| 35 to 64 Years | 1 (1.2%) | 0 (0.0%) |
| 65 to 74 Years | 2 (2.9%) | 0 (0.0%) |
| 75 Years and over | 6 (16.2%) | 6 (27.3%) |
Technology Access in Perdido Beach
Computing Device Access in Perdido Beach
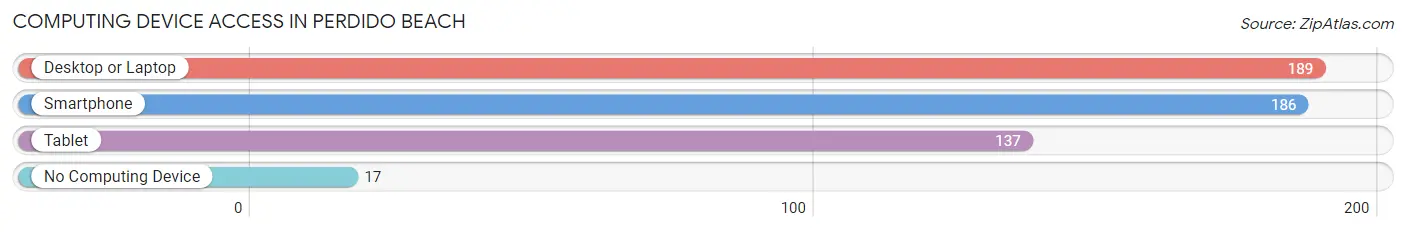
| Device Type | # Households | % Households |
| Desktop or Laptop | 189 | 82.9% |
| Smartphone | 186 | 81.6% |
| Tablet | 137 | 60.1% |
| No Computing Device | 17 | 7.5% |
| Total | 228 | 100.0% |
Internet Access in Perdido Beach
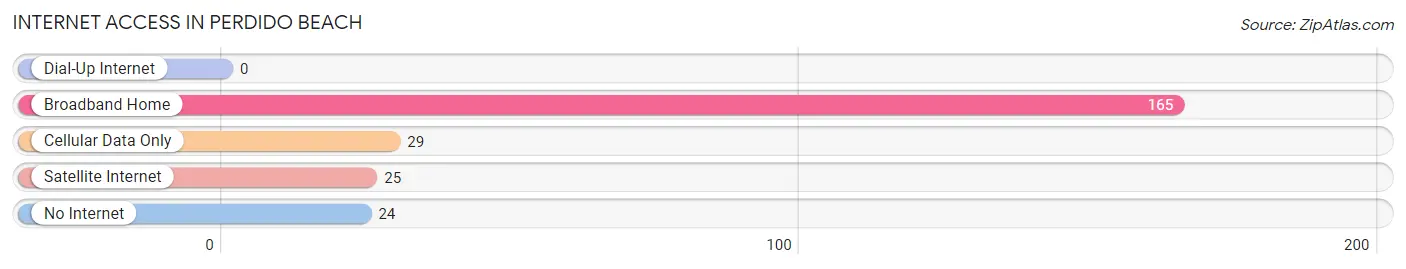
| Internet Type | # Households | % Households |
| Dial-Up Internet | 0 | 0.0% |
| Broadband Home | 165 | 72.4% |
| Cellular Data Only | 29 | 12.7% |
| Satellite Internet | 25 | 11.0% |
| No Internet | 24 | 10.5% |
| Total | 228 | 100.0% |
Perdido Beach Summary
Perdido Beach is a small town located in Baldwin County, Alabama, United States. It is situated on the Gulf of Mexico, just east of the Florida state line. The town is part of the Pensacola-Ferry Pass-Brent Metropolitan Statistical Area. As of the 2010 census, the population of Perdido Beach was 1,719.
History
Perdido Beach was originally inhabited by Native Americans, including the Creek and Choctaw tribes. The area was first explored by Europeans in the late 16th century, when Spanish explorers arrived in the region. The town was officially founded in 1821, when the United States acquired the land from Spain. The town was named after the nearby Perdido River, which was named by Spanish explorers who had lost their way in the area.
In the late 19th century, the town began to grow as a popular tourist destination. The first hotel was built in 1887, and the town was incorporated in 1901. The town was a popular destination for wealthy vacationers from the northern United States, and many of the town's original buildings were built in the Victorian style.
In the early 20th century, the town began to decline as a tourist destination. The Great Depression and World War II caused many of the town's wealthy visitors to stay away. The town's economy was further hurt by the construction of a bridge across the Perdido River in the 1950s, which diverted traffic away from the town.
In the late 20th century, the town began to experience a resurgence as a tourist destination. The town was featured in the movie "Forrest Gump" in 1994, and the town's economy has since been bolstered by tourism.
Geography
Perdido Beach is located at 30°20'N 87°30'W. The town is situated on the Gulf of Mexico, just east of the Florida state line. The town is bordered by the Perdido River to the north and the Gulf of Mexico to the south. The town is located in Baldwin County, and is part of the Pensacola-Ferry Pass-Brent Metropolitan Statistical Area.
The town has a total area of 1.3 square miles, all of which is land. The town is located on a barrier island, and is surrounded by the Gulf of Mexico and the Perdido River. The town is located in a humid subtropical climate zone, and has hot, humid summers and mild winters.
Economy
Perdido Beach's economy is largely based on tourism. The town is a popular destination for beachgoers, and the town's economy is bolstered by the many hotels, restaurants, and other businesses that cater to tourists. The town is also home to several marinas, which provide services to boaters.
The town is also home to several manufacturing companies, including a paper mill and a boat manufacturing plant. The town is also home to a number of retail stores, including a grocery store and several clothing stores.
Demographics
As of the 2010 census, the population of Perdido Beach was 1,719. The population is largely white (90.2%), with small percentages of African Americans (4.2%), Hispanics (2.7%), and Asians (1.2%). The median household income is $41,944, and the median age is 44.7 years. The town has a higher-than-average percentage of residents over the age of 65 (17.2%).
Conclusion
Perdido Beach is a small town located in Baldwin County, Alabama, United States. It is situated on the Gulf of Mexico, just east of the Florida state line. The town is part of the Pensacola-Ferry Pass-Brent Metropolitan Statistical Area. The town was originally inhabited by Native Americans, and was officially founded in 1821. The town has experienced a resurgence as a tourist destination in recent years, and its economy is largely based on tourism. As of the 2010 census, the population of Perdido Beach was 1,719. The population is largely white, with small percentages of African Americans, Hispanics, and Asians. The town has a higher-than-average percentage of residents over the age of 65.
Common Questions
What is Per Capita Income in Perdido Beach?
Per Capita income in Perdido Beach is $45,359.
What is the Median Family Income in Perdido Beach?
Median Family Income in Perdido Beach is $84,583.
What is the Median Household income in Perdido Beach?
Median Household Income in Perdido Beach is $76,389.
What is Income or Wage Gap in Perdido Beach?
Income or Wage Gap in Perdido Beach is 63.4%.
Women in Perdido Beach earn 36.6 cents for every dollar earned by a man.
What is Inequality or Gini Index in Perdido Beach?
Inequality or Gini Index in Perdido Beach is 0.40.
What is the Total Population of Perdido Beach?
Total Population of Perdido Beach is 464.
What is the Total Male Population of Perdido Beach?
Total Male Population of Perdido Beach is 244.
What is the Total Female Population of Perdido Beach?
Total Female Population of Perdido Beach is 220.
What is the Ratio of Males per 100 Females in Perdido Beach?
There are 110.91 Males per 100 Females in Perdido Beach.
What is the Ratio of Females per 100 Males in Perdido Beach?
There are 90.16 Females per 100 Males in Perdido Beach.
What is the Median Population Age in Perdido Beach?
Median Population Age in Perdido Beach is 62.4 Years.
What is the Average Family Size in Perdido Beach
Average Family Size in Perdido Beach is 2.4 People.
What is the Average Household Size in Perdido Beach
Average Household Size in Perdido Beach is 2.0 People.
How Large is the Labor Force in Perdido Beach?
There are 200 People in the Labor Forcein in Perdido Beach.
What is the Percentage of People in the Labor Force in Perdido Beach?
47.7% of People are in the Labor Force in Perdido Beach.
What is the Unemployment Rate in Perdido Beach?
Unemployment Rate in Perdido Beach is 3.0%.