Zip Codes with the Highest Percentage of Population Employed in Legal Services & Support in Phenix City, AL
RELATED REPORTS & OPTIONS
Legal Services & Support
Phenix City
Compare Zip Codes
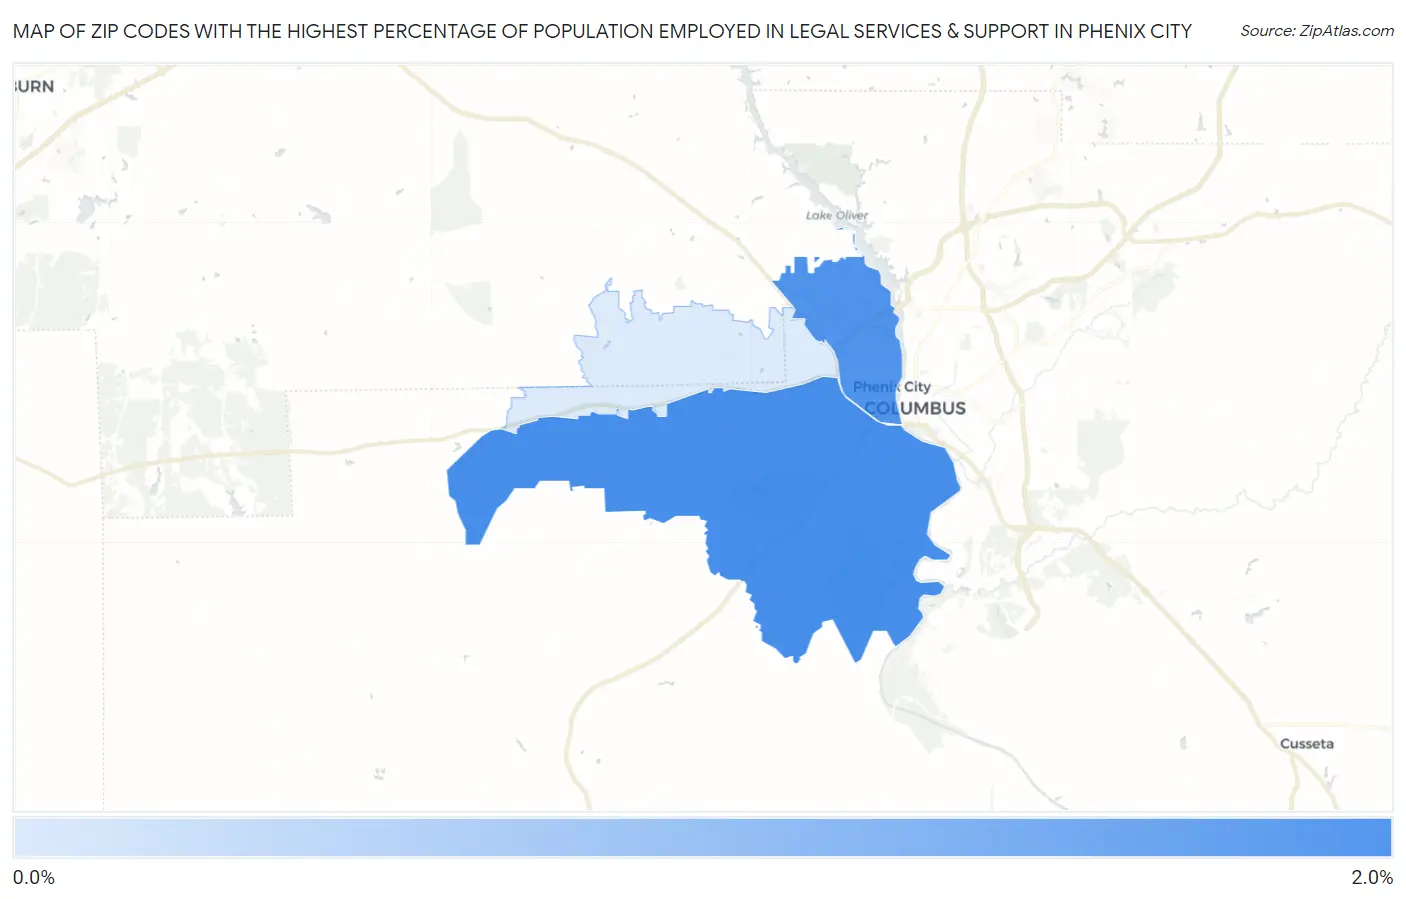
Map of Zip Codes with the Highest Percentage of Population Employed in Legal Services & Support in Phenix City
0.96%
1.9%
Zip Codes with the Highest Percentage of Population Employed in Legal Services & Support in Phenix City, AL
| Zip Code | % Employed | vs State | vs National | |
| 1. | 36869 | 1.9% | 0.90%(+1.01)#60 | 1.2%(+0.723)#3,714 |
| 2. | 36867 | 1.8% | 0.90%(+0.948)#61 | 1.2%(+0.661)#3,874 |
| 3. | 36870 | 0.96% | 0.90%(+0.068)#124 | 1.2%(-0.219)#8,081 |
1
Common Questions
What are the Top Zip Codes with the Highest Percentage of Population Employed in Legal Services & Support in Phenix City, AL?
Top Zip Codes with the Highest Percentage of Population Employed in Legal Services & Support in Phenix City, AL are:
What zip code has the Highest Percentage of Population Employed in Legal Services & Support in Phenix City, AL?
36869 has the Highest Percentage of Population Employed in Legal Services & Support in Phenix City, AL with 1.9%.
What is the Percentage of Population Employed in Legal Services & Support in Phenix City, AL?
Percentage of Population Employed in Legal Services & Support in Phenix City is 1.9%.
What is the Percentage of Population Employed in Legal Services & Support in Alabama?
Percentage of Population Employed in Legal Services & Support in Alabama is 0.90%.
What is the Percentage of Population Employed in Legal Services & Support in the United States?
Percentage of Population Employed in Legal Services & Support in the United States is 1.2%.