Vietnamese Married-Couple Family Poverty
COMPARE
Vietnamese
Select to Compare
Married-Couple Family Poverty
Vietnamese Married-Couple Family Poverty
7.4%
POVERTY | MARRIED-COUPLE FAMILIES
0.0/ 100
METRIC RATING
323rd/ 347
METRIC RANK
Vietnamese Married-Couple Family Poverty Correlation Chart
The statistical analysis conducted on geographies consisting of 170,138,931 people shows a moderate positive correlation between the proportion of Vietnamese and poverty level among married-couple families in the United States with a correlation coefficient (R) of 0.479 and weighted average of 7.4%. On average, for every 1% (one percent) increase in Vietnamese within a typical geography, there is an increase of 0.67% in poverty level among married-couple families.
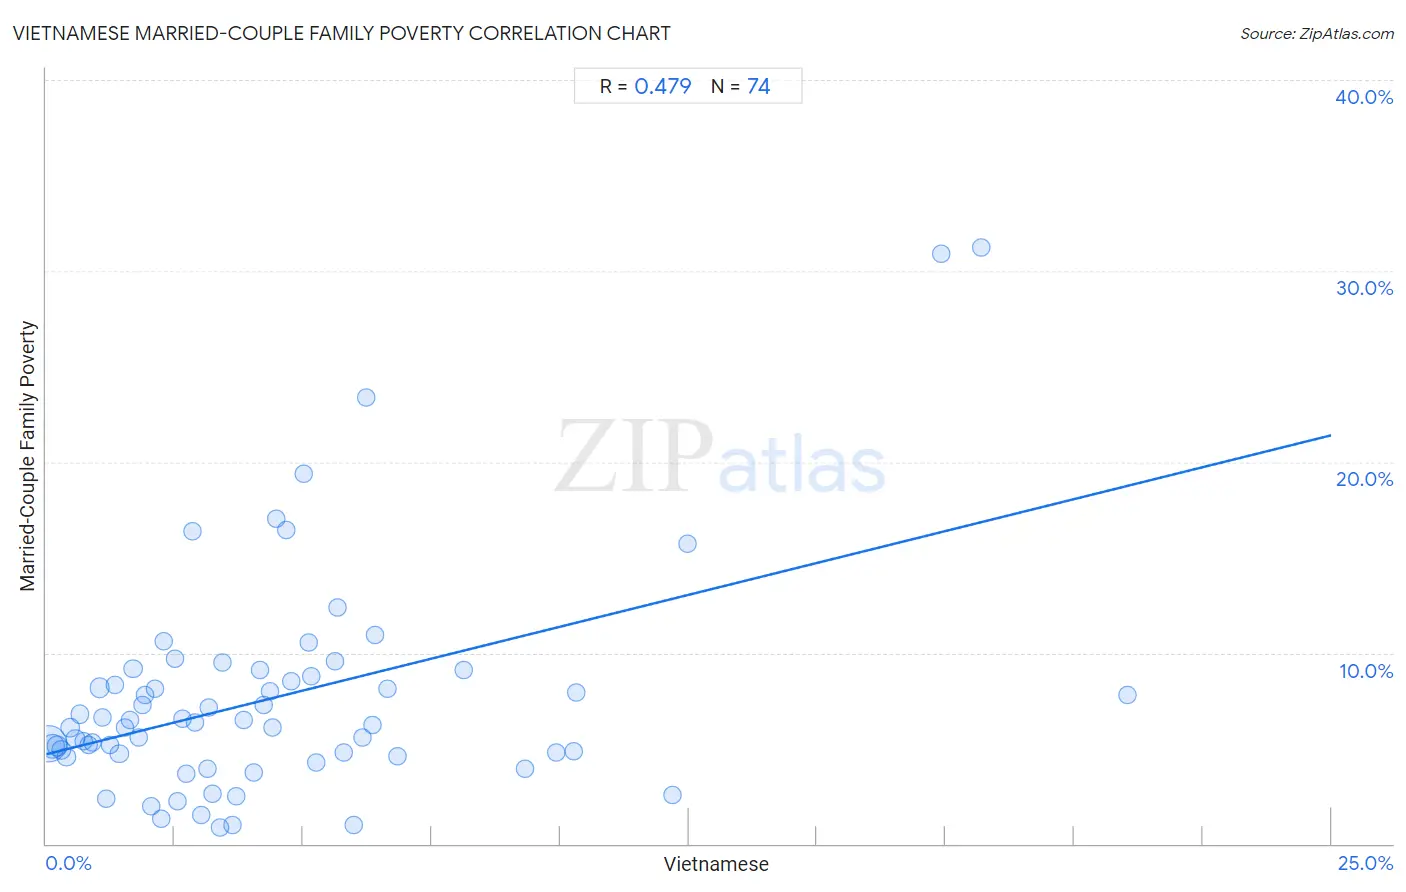
It is essential to understand that the correlation between the percentage of Vietnamese and poverty level among married-couple families does not imply a direct cause-and-effect relationship. It remains uncertain whether the presence of Vietnamese influences an upward or downward trend in the level of poverty level among married-couple families within an area, or if Vietnamese simply ended up residing in those areas with higher or lower levels of poverty level among married-couple families due to other factors.
Demographics Similar to Vietnamese by Married-Couple Family Poverty
In terms of married-couple family poverty, the demographic groups most similar to Vietnamese are Immigrants from Central America (7.4%, a difference of 0.090%), Immigrants from Cuba (7.5%, a difference of 0.63%), Immigrants from Bangladesh (7.5%, a difference of 0.82%), Hispanic or Latino (7.5%, a difference of 0.82%), and Immigrants from Honduras (7.3%, a difference of 1.1%).
| Demographics | Rating | Rank | Married-Couple Family Poverty |
| Hondurans | 0.0 /100 | #316 | Tragic 7.2% |
| Mexicans | 0.0 /100 | #317 | Tragic 7.2% |
| Immigrants from Guatemala | 0.0 /100 | #318 | Tragic 7.2% |
| Immigrants from Latin America | 0.0 /100 | #319 | Tragic 7.2% |
| Immigrants from Grenada | 0.0 /100 | #320 | Tragic 7.3% |
| Immigrants from Caribbean | 0.0 /100 | #321 | Tragic 7.3% |
| Immigrants from Honduras | 0.0 /100 | #322 | Tragic 7.3% |
| Vietnamese | 0.0 /100 | #323 | Tragic 7.4% |
| Immigrants from Central America | 0.0 /100 | #324 | Tragic 7.4% |
| Immigrants from Cuba | 0.0 /100 | #325 | Tragic 7.5% |
| Immigrants from Bangladesh | 0.0 /100 | #326 | Tragic 7.5% |
| Hispanics or Latinos | 0.0 /100 | #327 | Tragic 7.5% |
| Immigrants from Mexico | 0.0 /100 | #328 | Tragic 7.6% |
| Natives/Alaskans | 0.0 /100 | #329 | Tragic 8.2% |
| Paiute | 0.0 /100 | #330 | Tragic 8.3% |
Vietnamese Married-Couple Family Poverty Correlation Summary
| Measurement | Vietnamese Data | Married-Couple Family Poverty Data |
| Minimum | 0.038% | 0.87% |
| Maximum | 21.0% | 31.2% |
| Range | 21.0% | 30.4% |
| Mean | 4.4% | 7.6% |
| Median | 3.3% | 6.3% |
| Interquartile 25% (IQ1) | 1.6% | 4.7% |
| Interquartile 75% (IQ3) | 5.7% | 8.8% |
| Interquartile Range (IQR) | 4.0% | 4.1% |
| Standard Deviation (Sample) | 4.1% | 5.8% |
| Standard Deviation (Population) | 4.1% | 5.7% |
Correlation Details
| Vietnamese Percentile | Sample Size | Married-Couple Family Poverty |
[ 0.0% - 0.5% ] 0.038% | 90,623,257 | 5.3% |
[ 0.0% - 0.5% ] 0.12% | 29,613,797 | 5.1% |
[ 0.0% - 0.5% ] 0.21% | 15,062,281 | 5.1% |
[ 0.0% - 0.5% ] 0.30% | 6,413,470 | 4.9% |
[ 0.0% - 0.5% ] 0.39% | 4,425,944 | 4.5% |
[ 0.0% - 0.5% ] 0.47% | 4,227,286 | 6.1% |
[ 0.5% - 1.0% ] 0.57% | 2,001,732 | 5.5% |
[ 0.5% - 1.0% ] 0.64% | 1,377,706 | 6.8% |
[ 0.5% - 1.0% ] 0.73% | 744,615 | 5.4% |
[ 0.5% - 1.0% ] 0.83% | 979,870 | 5.2% |
[ 0.5% - 1.0% ] 0.91% | 598,484 | 5.3% |
[ 1.0% - 1.5% ] 1.04% | 9,311,060 | 8.2% |
[ 1.0% - 1.5% ] 1.09% | 309,952 | 6.6% |
[ 1.0% - 1.5% ] 1.16% | 297,900 | 2.3% |
[ 1.0% - 1.5% ] 1.24% | 257,197 | 5.2% |
[ 1.0% - 1.5% ] 1.34% | 756,584 | 8.3% |
[ 1.0% - 1.5% ] 1.42% | 282,102 | 4.7% |
[ 1.5% - 2.0% ] 1.54% | 43,867 | 6.1% |
[ 1.5% - 2.0% ] 1.62% | 196,395 | 6.5% |
[ 1.5% - 2.0% ] 1.69% | 191,958 | 9.2% |
[ 1.5% - 2.0% ] 1.81% | 118,217 | 5.6% |
[ 1.5% - 2.0% ] 1.88% | 126,008 | 7.3% |
[ 1.5% - 2.0% ] 1.93% | 8,334 | 7.8% |
[ 2.0% - 2.5% ] 2.04% | 85,753 | 2.0% |
[ 2.0% - 2.5% ] 2.13% | 136,610 | 8.1% |
[ 2.0% - 2.5% ] 2.23% | 53,029 | 1.3% |
[ 2.0% - 2.5% ] 2.29% | 195,433 | 10.6% |
[ 2.0% - 2.5% ] 2.50% | 9,960 | 9.7% |
[ 2.5% - 3.0% ] 2.57% | 2,300 | 2.2% |
[ 2.5% - 3.0% ] 2.64% | 138,588 | 6.5% |
[ 2.5% - 3.0% ] 2.72% | 14,685 | 3.7% |
[ 2.5% - 3.0% ] 2.85% | 77,213 | 16.4% |
[ 2.5% - 3.0% ] 2.89% | 25,324 | 6.4% |
[ 3.0% - 3.5% ] 3.02% | 5,095 | 1.5% |
[ 3.0% - 3.5% ] 3.13% | 45,881 | 3.9% |
[ 3.0% - 3.5% ] 3.17% | 54,323 | 7.1% |
[ 3.0% - 3.5% ] 3.24% | 15,503 | 2.6% |
[ 3.0% - 3.5% ] 3.38% | 8,879 | 0.87% |
[ 3.0% - 3.5% ] 3.43% | 186,165 | 9.5% |
[ 3.5% - 4.0% ] 3.61% | 7,775 | 0.98% |
[ 3.5% - 4.0% ] 3.69% | 7,692 | 2.5% |
[ 3.5% - 4.0% ] 3.84% | 44,898 | 6.5% |
[ 4.0% - 4.5% ] 4.04% | 18,727 | 3.8% |
[ 4.0% - 4.5% ] 4.16% | 28,164 | 9.1% |
[ 4.0% - 4.5% ] 4.24% | 69,256 | 7.3% |
[ 4.0% - 4.5% ] 4.34% | 67,001 | 8.0% |
[ 4.0% - 4.5% ] 4.40% | 19,554 | 6.1% |
[ 4.0% - 4.5% ] 4.47% | 2,841 | 17.0% |
[ 4.5% - 5.0% ] 4.67% | 65,283 | 16.5% |
[ 4.5% - 5.0% ] 4.75% | 27,848 | 8.5% |
[ 5.0% - 5.5% ] 5.01% | 46,520 | 19.4% |
[ 5.0% - 5.5% ] 5.10% | 77,230 | 10.6% |
[ 5.0% - 5.5% ] 5.15% | 6,510 | 8.8% |
[ 5.0% - 5.5% ] 5.25% | 6,965 | 4.3% |
[ 5.5% - 6.0% ] 5.62% | 30,063 | 9.6% |
[ 5.5% - 6.0% ] 5.67% | 43,216 | 12.4% |
[ 5.5% - 6.0% ] 5.78% | 25,187 | 4.8% |
[ 5.5% - 6.0% ] 5.99% | 3,958 | 1.00% |
[ 6.0% - 6.5% ] 6.16% | 86,977 | 5.6% |
[ 6.0% - 6.5% ] 6.23% | 1,460 | 23.4% |
[ 6.0% - 6.5% ] 6.34% | 102,618 | 6.2% |
[ 6.0% - 6.5% ] 6.39% | 10,691 | 11.0% |
[ 6.5% - 7.0% ] 6.64% | 28,277 | 8.1% |
[ 6.5% - 7.0% ] 6.83% | 26,939 | 4.6% |
[ 8.0% - 8.5% ] 8.12% | 4,064 | 9.1% |
[ 9.0% - 9.5% ] 9.30% | 344 | 3.9% |
[ 9.5% - 10.0% ] 9.92% | 1,633 | 4.8% |
[ 10.0% - 10.5% ] 10.27% | 38,865 | 4.9% |
[ 10.0% - 10.5% ] 10.32% | 59,961 | 7.9% |
[ 12.0% - 12.5% ] 12.18% | 3,006 | 2.6% |
[ 12.0% - 12.5% ] 12.48% | 17,328 | 15.7% |
[ 17.0% - 17.5% ] 17.42% | 27,842 | 30.9% |
[ 18.0% - 18.5% ] 18.18% | 43,213 | 31.2% |
[ 21.0% - 21.5% ] 21.03% | 64,268 | 7.8% |