Vietnamese Disability Age 5 to 17
COMPARE
Vietnamese
Select to Compare
Disability Age 5 to 17
Vietnamese Disability Age 5 to 17
5.1%
DISABILITY | AGE 5 TO 17
100.0/ 100
METRIC RATING
47th/ 347
METRIC RANK
Vietnamese Disability Age 5 to 17 Correlation Chart
The statistical analysis conducted on geographies consisting of 170,164,131 people shows a poor negative correlation between the proportion of Vietnamese and percentage of population with a disability between the ages 5 and 17 in the United States with a correlation coefficient (R) of -0.132 and weighted average of 5.1%. On average, for every 1% (one percent) increase in Vietnamese within a typical geography, there is a decrease of 0.092% in percentage of population with a disability between the ages 5 and 17.
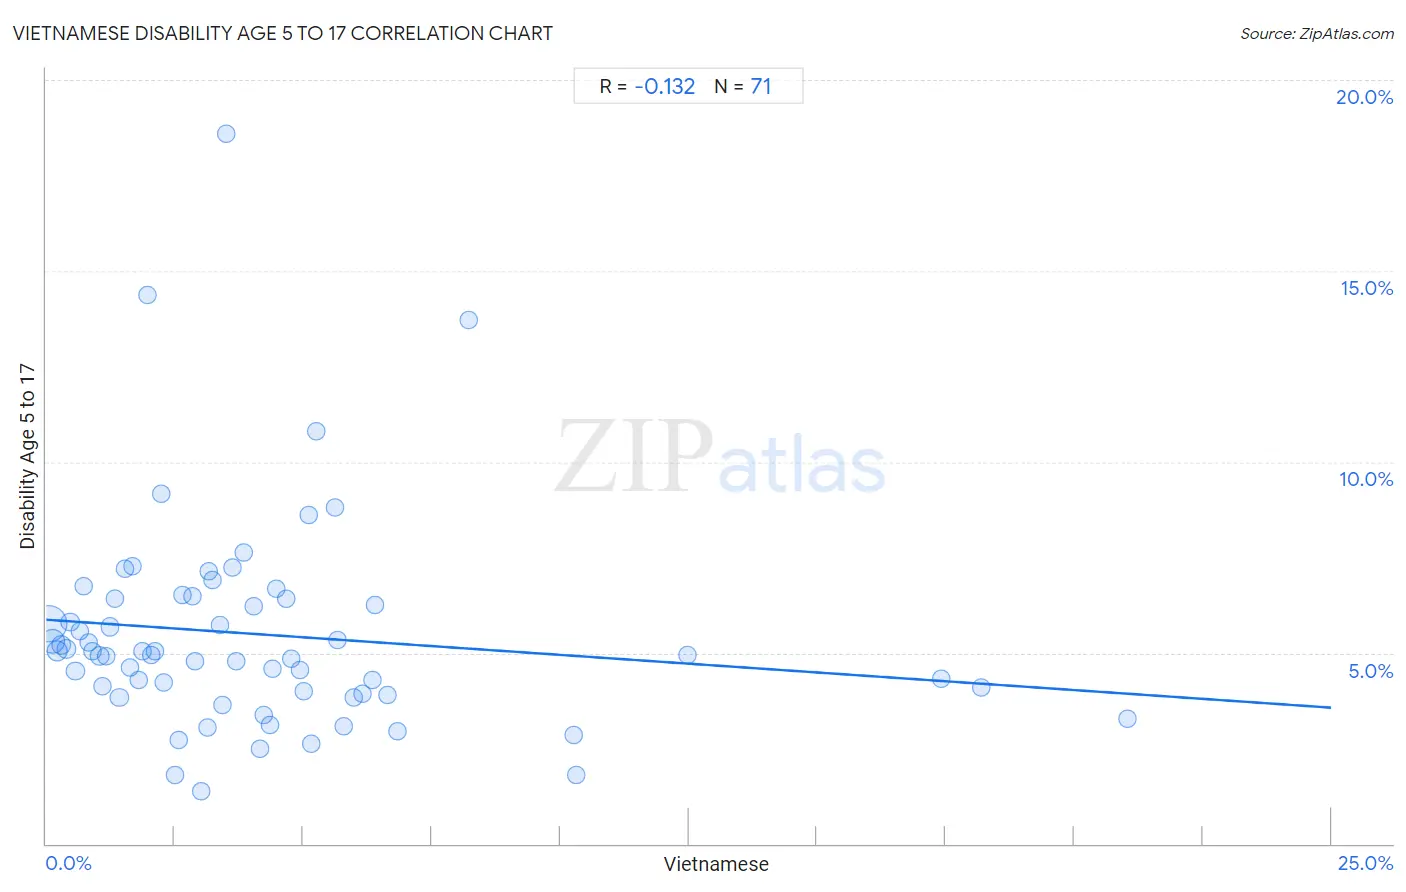
It is essential to understand that the correlation between the percentage of Vietnamese and percentage of population with a disability between the ages 5 and 17 does not imply a direct cause-and-effect relationship. It remains uncertain whether the presence of Vietnamese influences an upward or downward trend in the level of percentage of population with a disability between the ages 5 and 17 within an area, or if Vietnamese simply ended up residing in those areas with higher or lower levels of percentage of population with a disability between the ages 5 and 17 due to other factors.
Demographics Similar to Vietnamese by Disability Age 5 to 17
In terms of disability age 5 to 17, the demographic groups most similar to Vietnamese are Assyrian/Chaldean/Syriac (5.0%, a difference of 0.13%), Korean (5.1%, a difference of 0.18%), Tongan (5.0%, a difference of 0.19%), Egyptian (5.0%, a difference of 0.27%), and Immigrants from Western Asia (5.1%, a difference of 0.27%).
| Demographics | Rating | Rank | Disability Age 5 to 17 |
| Okinawans | 100.0 /100 | #40 | Exceptional 5.0% |
| Immigrants from Australia | 100.0 /100 | #41 | Exceptional 5.0% |
| Immigrants from Sri Lanka | 100.0 /100 | #42 | Exceptional 5.0% |
| Immigrants from Russia | 100.0 /100 | #43 | Exceptional 5.0% |
| Egyptians | 100.0 /100 | #44 | Exceptional 5.0% |
| Tongans | 100.0 /100 | #45 | Exceptional 5.0% |
| Assyrians/Chaldeans/Syriacs | 100.0 /100 | #46 | Exceptional 5.0% |
| Vietnamese | 100.0 /100 | #47 | Exceptional 5.1% |
| Koreans | 100.0 /100 | #48 | Exceptional 5.1% |
| Immigrants from Western Asia | 100.0 /100 | #49 | Exceptional 5.1% |
| Argentineans | 99.9 /100 | #50 | Exceptional 5.1% |
| Turks | 99.9 /100 | #51 | Exceptional 5.1% |
| Immigrants from Fiji | 99.9 /100 | #52 | Exceptional 5.1% |
| Immigrants from Lithuania | 99.9 /100 | #53 | Exceptional 5.1% |
| Paraguayans | 99.9 /100 | #54 | Exceptional 5.1% |
Vietnamese Disability Age 5 to 17 Correlation Summary
| Measurement | Vietnamese Data | Disability Age 5 to 17 Data |
| Minimum | 0.038% | 1.4% |
| Maximum | 21.0% | 18.6% |
| Range | 21.0% | 17.2% |
| Mean | 4.1% | 5.5% |
| Median | 3.2% | 5.0% |
| Interquartile 25% (IQ1) | 1.5% | 3.9% |
| Interquartile 75% (IQ3) | 5.1% | 6.4% |
| Interquartile Range (IQR) | 3.6% | 2.5% |
| Standard Deviation (Sample) | 4.0% | 2.8% |
| Standard Deviation (Population) | 4.0% | 2.8% |
Correlation Details
| Vietnamese Percentile | Sample Size | Disability Age 5 to 17 |
[ 0.0% - 0.5% ] 0.038% | 90,621,370 | 5.8% |
[ 0.0% - 0.5% ] 0.12% | 29,522,910 | 5.3% |
[ 0.0% - 0.5% ] 0.21% | 15,065,962 | 5.1% |
[ 0.0% - 0.5% ] 0.30% | 6,439,157 | 5.2% |
[ 0.0% - 0.5% ] 0.39% | 4,434,438 | 5.1% |
[ 0.0% - 0.5% ] 0.47% | 4,196,475 | 5.8% |
[ 0.5% - 1.0% ] 0.57% | 2,003,493 | 4.5% |
[ 0.5% - 1.0% ] 0.64% | 1,385,149 | 5.6% |
[ 0.5% - 1.0% ] 0.73% | 746,074 | 6.7% |
[ 0.5% - 1.0% ] 0.83% | 989,776 | 5.3% |
[ 0.5% - 1.0% ] 0.91% | 630,433 | 5.0% |
[ 1.0% - 1.5% ] 1.04% | 9,314,829 | 4.9% |
[ 1.0% - 1.5% ] 1.09% | 309,952 | 4.1% |
[ 1.0% - 1.5% ] 1.16% | 315,981 | 4.9% |
[ 1.0% - 1.5% ] 1.24% | 264,442 | 5.7% |
[ 1.0% - 1.5% ] 1.34% | 777,386 | 6.4% |
[ 1.0% - 1.5% ] 1.42% | 278,632 | 3.8% |
[ 1.5% - 2.0% ] 1.54% | 43,867 | 7.2% |
[ 1.5% - 2.0% ] 1.62% | 201,906 | 4.6% |
[ 1.5% - 2.0% ] 1.69% | 192,901 | 7.3% |
[ 1.5% - 2.0% ] 1.81% | 119,614 | 4.3% |
[ 1.5% - 2.0% ] 1.88% | 135,833 | 5.0% |
[ 1.5% - 2.0% ] 1.97% | 13,674 | 14.4% |
[ 2.0% - 2.5% ] 2.04% | 91,751 | 5.0% |
[ 2.0% - 2.5% ] 2.13% | 136,610 | 5.1% |
[ 2.0% - 2.5% ] 2.24% | 45,999 | 9.2% |
[ 2.0% - 2.5% ] 2.29% | 195,433 | 4.2% |
[ 2.0% - 2.5% ] 2.50% | 9,960 | 1.8% |
[ 2.5% - 3.0% ] 2.58% | 3,183 | 2.7% |
[ 2.5% - 3.0% ] 2.64% | 138,588 | 6.5% |
[ 2.5% - 3.0% ] 2.85% | 83,275 | 6.5% |
[ 2.5% - 3.0% ] 2.89% | 25,324 | 4.8% |
[ 3.0% - 3.5% ] 3.02% | 5,095 | 1.4% |
[ 3.0% - 3.5% ] 3.13% | 43,884 | 3.1% |
[ 3.0% - 3.5% ] 3.17% | 54,323 | 7.1% |
[ 3.0% - 3.5% ] 3.24% | 15,503 | 6.9% |
[ 3.0% - 3.5% ] 3.38% | 8,879 | 5.7% |
[ 3.0% - 3.5% ] 3.43% | 186,165 | 3.6% |
[ 3.0% - 3.5% ] 3.50% | 2,230 | 18.6% |
[ 3.5% - 4.0% ] 3.61% | 7,775 | 7.2% |
[ 3.5% - 4.0% ] 3.69% | 7,692 | 4.8% |
[ 3.5% - 4.0% ] 3.84% | 44,898 | 7.6% |
[ 4.0% - 4.5% ] 4.04% | 19,750 | 6.2% |
[ 4.0% - 4.5% ] 4.16% | 28,164 | 2.5% |
[ 4.0% - 4.5% ] 4.24% | 69,256 | 3.4% |
[ 4.0% - 4.5% ] 4.34% | 67,001 | 3.1% |
[ 4.0% - 4.5% ] 4.40% | 19,554 | 4.6% |
[ 4.0% - 4.5% ] 4.47% | 2,841 | 6.7% |
[ 4.5% - 5.0% ] 4.67% | 68,656 | 6.4% |
[ 4.5% - 5.0% ] 4.75% | 27,848 | 4.8% |
[ 4.5% - 5.0% ] 4.93% | 548 | 4.5% |
[ 5.0% - 5.5% ] 5.01% | 46,520 | 4.0% |
[ 5.0% - 5.5% ] 5.10% | 77,230 | 8.6% |
[ 5.0% - 5.5% ] 5.15% | 6,510 | 2.6% |
[ 5.0% - 5.5% ] 5.25% | 6,965 | 10.8% |
[ 5.5% - 6.0% ] 5.62% | 30,063 | 8.8% |
[ 5.5% - 6.0% ] 5.67% | 43,216 | 5.3% |
[ 5.5% - 6.0% ] 5.78% | 25,187 | 3.1% |
[ 5.5% - 6.0% ] 5.99% | 3,958 | 3.8% |
[ 6.0% - 6.5% ] 6.16% | 86,977 | 3.9% |
[ 6.0% - 6.5% ] 6.34% | 102,618 | 4.3% |
[ 6.0% - 6.5% ] 6.39% | 10,691 | 6.3% |
[ 6.5% - 7.0% ] 6.64% | 29,441 | 3.9% |
[ 6.5% - 7.0% ] 6.83% | 26,939 | 3.0% |
[ 8.0% - 8.5% ] 8.21% | 1,900 | 13.7% |
[ 10.0% - 10.5% ] 10.27% | 38,865 | 2.8% |
[ 10.0% - 10.5% ] 10.32% | 59,961 | 1.8% |
[ 12.0% - 12.5% ] 12.48% | 17,328 | 4.9% |
[ 17.0% - 17.5% ] 17.42% | 27,842 | 4.3% |
[ 18.0% - 18.5% ] 18.18% | 43,213 | 4.1% |
[ 21.0% - 21.5% ] 21.03% | 64,268 | 3.3% |