Vietnamese Wage/Income Gap
COMPARE
Vietnamese
Select to Compare
Wage/Income Gap
Vietnamese Wage/Income Gap
21.0%
WAGE/INCOME GAP
100.0/ 100
METRIC RATING
31st/ 347
METRIC RANK
Vietnamese Wage/Income Gap Correlation Chart
The statistical analysis conducted on geographies consisting of 170,722,757 people shows a poor negative correlation between the proportion of Vietnamese and wage/income gap percentage in the United States with a correlation coefficient (R) of -0.161 and weighted average of 21.0%. On average, for every 1% (one percent) increase in Vietnamese within a typical geography, there is a decrease of 0.38% in wage/income gap percentage.
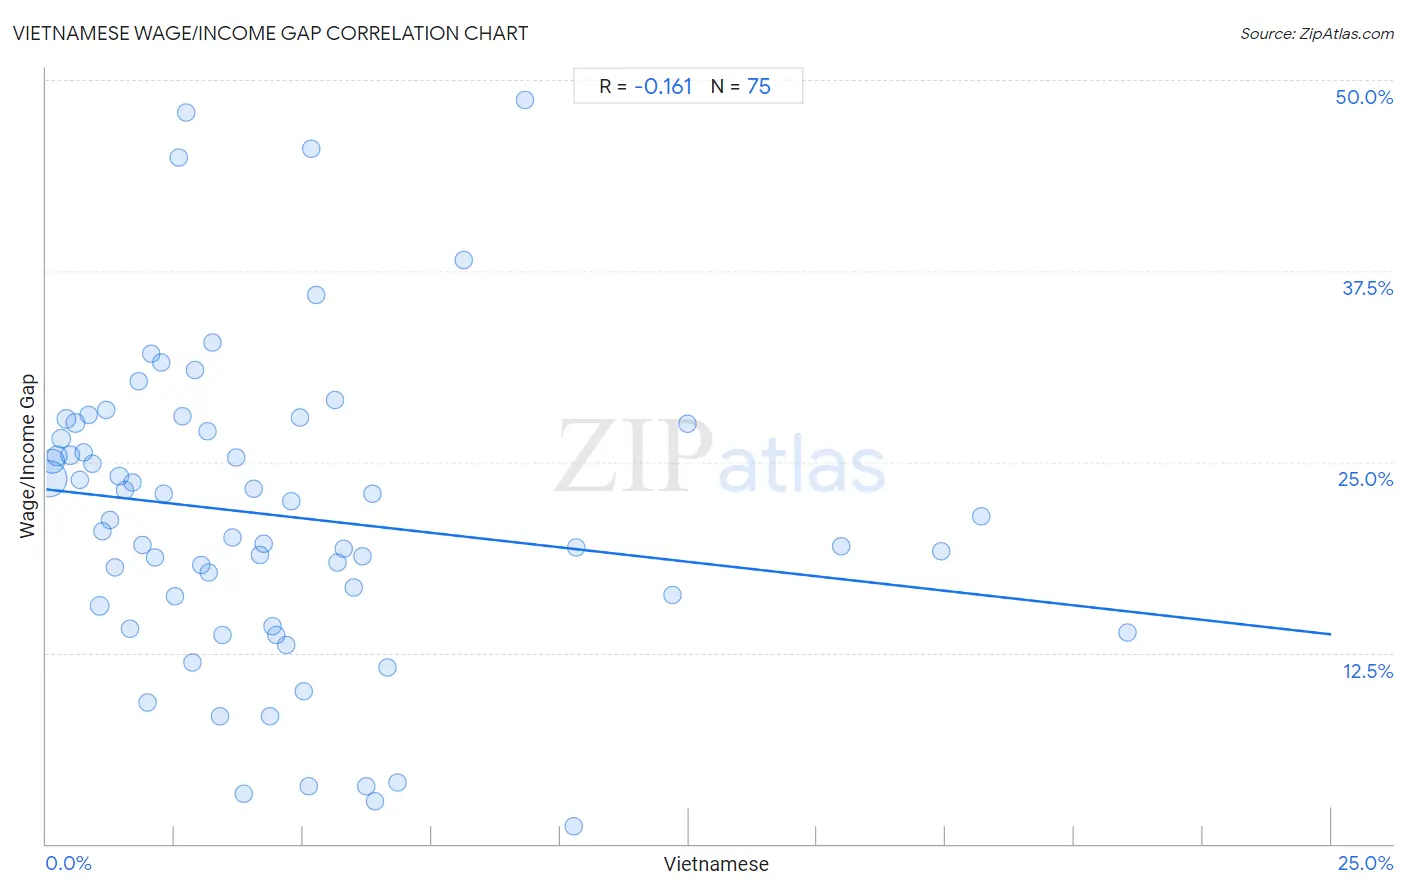
It is essential to understand that the correlation between the percentage of Vietnamese and wage/income gap percentage does not imply a direct cause-and-effect relationship. It remains uncertain whether the presence of Vietnamese influences an upward or downward trend in the level of wage/income gap percentage within an area, or if Vietnamese simply ended up residing in those areas with higher or lower levels of wage/income gap percentage due to other factors.
Demographics Similar to Vietnamese by Wage/Income Gap
In terms of wage/income gap, the demographic groups most similar to Vietnamese are Immigrants from Yemen (21.1%, a difference of 0.23%), Immigrants from Bahamas (21.1%, a difference of 0.25%), Immigrants from Bangladesh (20.9%, a difference of 0.28%), Immigrants from Senegal (20.9%, a difference of 0.49%), and Pima (21.1%, a difference of 0.53%).
| Demographics | Rating | Rank | Wage/Income Gap |
| Dominicans | 100.0 /100 | #24 | Exceptional 20.6% |
| Senegalese | 100.0 /100 | #25 | Exceptional 20.7% |
| Pueblo | 100.0 /100 | #26 | Exceptional 20.7% |
| Immigrants from Armenia | 100.0 /100 | #27 | Exceptional 20.7% |
| Inupiat | 100.0 /100 | #28 | Exceptional 20.8% |
| Immigrants from Senegal | 100.0 /100 | #29 | Exceptional 20.9% |
| Immigrants from Bangladesh | 100.0 /100 | #30 | Exceptional 20.9% |
| Vietnamese | 100.0 /100 | #31 | Exceptional 21.0% |
| Immigrants from Yemen | 100.0 /100 | #32 | Exceptional 21.1% |
| Immigrants from Bahamas | 100.0 /100 | #33 | Exceptional 21.1% |
| Pima | 100.0 /100 | #34 | Exceptional 21.1% |
| Somalis | 100.0 /100 | #35 | Exceptional 21.2% |
| Belizeans | 100.0 /100 | #36 | Exceptional 21.2% |
| Immigrants from Somalia | 100.0 /100 | #37 | Exceptional 21.2% |
| Immigrants from Belize | 100.0 /100 | #38 | Exceptional 21.3% |
Vietnamese Wage/Income Gap Correlation Summary
| Measurement | Vietnamese Data | Wage/Income Gap Data |
| Minimum | 0.038% | 1.1% |
| Maximum | 21.0% | 48.7% |
| Range | 21.0% | 47.5% |
| Mean | 4.5% | 21.5% |
| Median | 3.4% | 21.2% |
| Interquartile 25% (IQ1) | 1.6% | 15.6% |
| Interquartile 75% (IQ3) | 5.7% | 27.5% |
| Interquartile Range (IQR) | 4.0% | 11.9% |
| Standard Deviation (Sample) | 4.3% | 10.1% |
| Standard Deviation (Population) | 4.2% | 10.0% |
Correlation Details
| Vietnamese Percentile | Sample Size | Wage/Income Gap |
[ 0.0% - 0.5% ] 0.038% | 90,686,798 | 23.9% |
[ 0.0% - 0.5% ] 0.12% | 29,656,025 | 25.0% |
[ 0.0% - 0.5% ] 0.21% | 15,132,793 | 25.4% |
[ 0.0% - 0.5% ] 0.30% | 6,470,600 | 26.5% |
[ 0.0% - 0.5% ] 0.39% | 4,478,061 | 27.8% |
[ 0.0% - 0.5% ] 0.47% | 4,256,984 | 25.5% |
[ 0.5% - 1.0% ] 0.57% | 1,999,449 | 27.5% |
[ 0.5% - 1.0% ] 0.64% | 1,402,374 | 23.8% |
[ 0.5% - 1.0% ] 0.73% | 769,959 | 25.6% |
[ 0.5% - 1.0% ] 0.83% | 1,004,289 | 28.1% |
[ 0.5% - 1.0% ] 0.91% | 639,351 | 24.9% |
[ 1.0% - 1.5% ] 1.04% | 9,325,869 | 15.6% |
[ 1.0% - 1.5% ] 1.09% | 309,952 | 20.5% |
[ 1.0% - 1.5% ] 1.16% | 323,186 | 28.4% |
[ 1.0% - 1.5% ] 1.24% | 264,442 | 21.2% |
[ 1.0% - 1.5% ] 1.34% | 781,137 | 18.1% |
[ 1.0% - 1.5% ] 1.42% | 284,719 | 24.0% |
[ 1.5% - 2.0% ] 1.54% | 43,867 | 23.2% |
[ 1.5% - 2.0% ] 1.62% | 201,906 | 14.1% |
[ 1.5% - 2.0% ] 1.69% | 199,200 | 23.7% |
[ 1.5% - 2.0% ] 1.81% | 123,795 | 30.3% |
[ 1.5% - 2.0% ] 1.88% | 147,846 | 19.6% |
[ 1.5% - 2.0% ] 1.96% | 22,008 | 9.3% |
[ 2.0% - 2.5% ] 2.05% | 94,083 | 32.1% |
[ 2.0% - 2.5% ] 2.13% | 143,886 | 18.8% |
[ 2.0% - 2.5% ] 2.23% | 52,663 | 31.5% |
[ 2.0% - 2.5% ] 2.29% | 195,433 | 22.9% |
[ 2.5% - 3.0% ] 2.50% | 11,309 | 16.2% |
[ 2.5% - 3.0% ] 2.58% | 3,183 | 44.9% |
[ 2.5% - 3.0% ] 2.64% | 138,588 | 28.0% |
[ 2.5% - 3.0% ] 2.72% | 14,685 | 47.9% |
[ 2.5% - 3.0% ] 2.85% | 83,275 | 11.9% |
[ 2.5% - 3.0% ] 2.89% | 25,324 | 31.0% |
[ 3.0% - 3.5% ] 3.02% | 5,095 | 18.3% |
[ 3.0% - 3.5% ] 3.13% | 45,881 | 27.0% |
[ 3.0% - 3.5% ] 3.17% | 54,323 | 17.7% |
[ 3.0% - 3.5% ] 3.24% | 15,503 | 32.8% |
[ 3.0% - 3.5% ] 3.38% | 8,879 | 8.4% |
[ 3.0% - 3.5% ] 3.43% | 186,165 | 13.7% |
[ 3.5% - 4.0% ] 3.61% | 7,775 | 20.1% |
[ 3.5% - 4.0% ] 3.69% | 7,692 | 25.3% |
[ 3.5% - 4.0% ] 3.84% | 44,898 | 3.3% |
[ 4.0% - 4.5% ] 4.04% | 19,750 | 23.3% |
[ 4.0% - 4.5% ] 4.16% | 28,164 | 18.9% |
[ 4.0% - 4.5% ] 4.24% | 69,256 | 19.7% |
[ 4.0% - 4.5% ] 4.34% | 67,001 | 8.3% |
[ 4.0% - 4.5% ] 4.40% | 19,554 | 14.2% |
[ 4.0% - 4.5% ] 4.47% | 5,120 | 13.7% |
[ 4.5% - 5.0% ] 4.67% | 65,283 | 13.0% |
[ 4.5% - 5.0% ] 4.75% | 27,848 | 22.4% |
[ 4.5% - 5.0% ] 4.93% | 548 | 27.9% |
[ 5.0% - 5.5% ] 5.01% | 46,520 | 10.0% |
[ 5.0% - 5.5% ] 5.10% | 77,230 | 3.7% |
[ 5.0% - 5.5% ] 5.15% | 6,510 | 45.5% |
[ 5.0% - 5.5% ] 5.25% | 6,965 | 35.9% |
[ 5.5% - 6.0% ] 5.62% | 30,063 | 29.0% |
[ 5.5% - 6.0% ] 5.67% | 43,216 | 18.4% |
[ 5.5% - 6.0% ] 5.78% | 25,187 | 19.3% |
[ 5.5% - 6.0% ] 5.99% | 3,958 | 16.8% |
[ 6.0% - 6.5% ] 6.16% | 86,977 | 18.8% |
[ 6.0% - 6.5% ] 6.23% | 1,460 | 3.8% |
[ 6.0% - 6.5% ] 6.34% | 102,618 | 23.0% |
[ 6.0% - 6.5% ] 6.39% | 10,691 | 2.8% |
[ 6.5% - 7.0% ] 6.64% | 29,441 | 11.6% |
[ 6.5% - 7.0% ] 6.83% | 26,939 | 4.0% |
[ 8.0% - 8.5% ] 8.12% | 4,064 | 38.2% |
[ 9.0% - 9.5% ] 9.30% | 344 | 48.7% |
[ 10.0% - 10.5% ] 10.27% | 38,865 | 1.1% |
[ 10.0% - 10.5% ] 10.32% | 59,961 | 19.4% |
[ 12.0% - 12.5% ] 12.18% | 3,006 | 16.3% |
[ 12.0% - 12.5% ] 12.48% | 17,328 | 27.5% |
[ 15.0% - 15.5% ] 15.46% | 317 | 19.5% |
[ 17.0% - 17.5% ] 17.42% | 27,842 | 19.1% |
[ 18.0% - 18.5% ] 18.18% | 43,213 | 21.4% |
[ 21.0% - 21.5% ] 21.03% | 64,268 | 13.8% |