Tongan vs Immigrants from Kazakhstan Disability Age Under 5

COMPARE

Tongan
Race
Ancestry
AfghanAfricanAlaska NativeAlaskan AthabascanAlbanianAleutAlsatianAmericanApacheArabArapahoArgentineanArmenianAssyrian/Chaldean/SyriacAustralianAustrianBahamianBangladeshiBarbadianBasqueBelgianBelizeanBermudanBhutaneseBlackfeetBolivianBrazilianBritishBritish West IndianBulgarianBurmeseCajunCambodianCanadianCape VerdeanCarpatho RusynCelticCentral AmericanCentral American IndianCherokeeCheyenneChickasawChileanChineseChippewaChoctawColombianColvilleComancheCosta RicanCreeCreekCroatianCrowCubanCypriotCzechCzechoslovakianDanishDelawareDominicanDutchDutch West IndianEastern EuropeanEcuadorianEgyptianEnglishEstonianEthiopianEuropeanFijianFilipinoFinnishFrenchFrench American IndianFrench CanadianGermanGerman RussianGhanaianGreekGuamanian/ChamorroGuatemalanGuyaneseHaitianHmongHonduranHopiHoumaHungarianIcelanderIndian (Asian)IndonesianInupiatIranianIraqiIrishIroquoisIsraeliItalianJamaicanJapaneseJordanianKenyanKiowaKoreanLaotianLatvianLebaneseLiberianLithuanianLumbeeLuxembourgerMacedonianMalaysianMalteseMarshalleseMenomineeMexicanMexican American IndianMongolianMoroccanNative HawaiianNavajoNepaleseNew ZealanderNicaraguanNigerianNorthern EuropeanNorwegianOkinawanOsageOttawaPaiutePakistaniPalestinianPanamanianParaguayanPennsylvania GermanPeruvianPimaPolishPortuguesePotawatomiPuebloPuerto RicanPuget Sound SalishRomanianRussianSalvadoranSamoanScandinavianScotch-IrishScottishSeminoleSenegaleseSerbianShoshoneSierra LeoneanSiouxSlavicSlovakSloveneSomaliSouth AfricanSouth AmericanSouth American IndianSoviet UnionSpaniardSpanishSpanish AmericanSpanish American IndianSri LankanSubsaharan AfricanSudaneseSwedishSwissSyrianTaiwaneseThaiTlingit-HaidaTohono O'OdhamTonganTrinidadian and TobagonianTsimshianTurkishU.S. Virgin IslanderUgandanUkrainianUruguayanUteVenezuelanVietnameseWelshWest IndianYakamaYaquiYugoslavianYumanYup'ikZimbabwean
Immigration
NonimmigrantsImmigrantsAfghanistanAfricaAlbaniaArgentinaArmeniaAsiaAustraliaAustriaBahamasBangladeshBarbadosBelarusBelgiumBelizeBoliviaBosnia and HerzegovinaBrazilBulgariaBurma/MyanmarCabo VerdeCambodiaCameroonCanadaCaribbeanCentral AmericaChileChinaColombiaCongoCosta RicaCroatiaCubaCzechoslovakiaDenmarkDominicaDominican RepublicEastern AfricaEastern AsiaEastern EuropeEcuadorEgyptEl SalvadorEnglandEritreaEthiopiaEuropeFijiFranceGermanyGhanaGreeceGrenadaGuatemalaGuyanaHaitiHondurasHong KongHungaryIndiaIndonesiaIranIraqIrelandIsraelItalyJamaicaJapanJordanKenyaKoreaKuwaitLaosLatin AmericaLatviaLebanonLiberiaLithuaniaMalaysiaMexicoMicronesiaMiddle AfricaMoldovaMoroccoNepalNetherlandsNicaraguaNigeriaNorth AmericaNorth MacedoniaNorthern AfricaNorthern EuropeNorwayOceaniaPakistanPanamaPeruPhilippinesPolandPortugalRomaniaRussiaSaudi ArabiaScotlandSenegalSerbiaSierra LeoneSingaporeSomaliaSouth AfricaSouth AmericaSouth Central AsiaSouth Eastern AsiaSouthern EuropeSpainSri LankaSt. Vincent and the GrenadinesSudanSwedenSwitzerlandSyriaTaiwanThailandTrinidad and TobagoTurkeyUgandaUkraineUruguayUzbekistanVenezuelaVietnamWest IndiesWestern AfricaWestern AsiaWestern EuropeYemenZaireZimbabweAzores
Immigrants from Kazakhstan
Race
Ancestry
AfghanAfricanAlaska NativeAlaskan AthabascanAlbanianAleutAlsatianAmericanApacheArabArapahoArgentineanArmenianAssyrian/Chaldean/SyriacAustralianAustrianBahamianBangladeshiBarbadianBasqueBelgianBelizeanBermudanBhutaneseBlackfeetBolivianBrazilianBritishBritish West IndianBulgarianBurmeseCajunCambodianCanadianCape VerdeanCarpatho RusynCelticCentral AmericanCentral American IndianCherokeeCheyenneChickasawChileanChineseChippewaChoctawColombianColvilleComancheCosta RicanCreeCreekCroatianCrowCubanCypriotCzechCzechoslovakianDanishDelawareDominicanDutchDutch West IndianEastern EuropeanEcuadorianEgyptianEnglishEstonianEthiopianEuropeanFijianFilipinoFinnishFrenchFrench American IndianFrench CanadianGermanGerman RussianGhanaianGreekGuamanian/ChamorroGuatemalanGuyaneseHaitianHmongHonduranHopiHoumaHungarianIcelanderIndian (Asian)IndonesianInupiatIranianIraqiIrishIroquoisIsraeliItalianJamaicanJapaneseJordanianKenyanKiowaKoreanLaotianLatvianLebaneseLiberianLithuanianLumbeeLuxembourgerMacedonianMalaysianMalteseMarshalleseMenomineeMexicanMexican American IndianMongolianMoroccanNative HawaiianNavajoNepaleseNew ZealanderNicaraguanNigerianNorthern EuropeanNorwegianOkinawanOsageOttawaPaiutePakistaniPalestinianPanamanianParaguayanPennsylvania GermanPeruvianPimaPolishPortuguesePotawatomiPuebloPuerto RicanPuget Sound SalishRomanianRussianSalvadoranSamoanScandinavianScotch-IrishScottishSeminoleSenegaleseSerbianShoshoneSierra LeoneanSiouxSlavicSlovakSloveneSomaliSouth AfricanSouth AmericanSouth American IndianSoviet UnionSpaniardSpanishSpanish AmericanSpanish American IndianSri LankanSubsaharan AfricanSudaneseSwedishSwissSyrianTaiwaneseThaiTlingit-HaidaTohono O'OdhamTrinidadian and TobagonianTsimshianTurkishU.S. Virgin IslanderUgandanUkrainianUruguayanUteVenezuelanVietnameseWelshWest IndianYakamaYaquiYugoslavianYumanYup'ikZimbabwean
Immigration
NonimmigrantsImmigrantsAfghanistanAfricaAlbaniaArgentinaArmeniaAsiaAustraliaAustriaBahamasBangladeshBarbadosBelarusBelgiumBelizeBoliviaBosnia and HerzegovinaBrazilBulgariaBurma/MyanmarCabo VerdeCambodiaCameroonCanadaCaribbeanCentral AmericaChileChinaColombiaCongoCosta RicaCroatiaCubaCzechoslovakiaDenmarkDominicaDominican RepublicEastern AfricaEastern AsiaEastern EuropeEcuadorEgyptEl SalvadorEnglandEritreaEthiopiaEuropeFijiFranceGermanyGhanaGreeceGrenadaGuatemalaGuyanaHaitiHondurasHong KongHungaryIndiaIndonesiaIranIraqIrelandIsraelItalyJamaicaJapanJordanKazakhstanKenyaKoreaKuwaitLaosLatin AmericaLatviaLebanonLiberiaLithuaniaMalaysiaMexicoMicronesiaMiddle AfricaMoldovaMoroccoNepalNetherlandsNicaraguaNigeriaNorth AmericaNorth MacedoniaNorthern AfricaNorthern EuropeNorwayOceaniaPakistanPanamaPeruPhilippinesPolandPortugalRomaniaRussiaSaudi ArabiaScotlandSenegalSerbiaSierra LeoneSingaporeSomaliaSouth AfricaSouth AmericaSouth Central AsiaSouth Eastern AsiaSouthern EuropeSpainSri LankaSt. Vincent and the GrenadinesSudanSwedenSwitzerlandSyriaTaiwanThailandTrinidad and TobagoTurkeyUgandaUkraineUruguayUzbekistanVenezuelaVietnamWest IndiesWestern AfricaWestern AsiaWestern EuropeYemenZaireZimbabweAzores
Disability Age Under 5
Income
Poverty
Unemployment
Labor Participation
Family Structure
Vehicle Availability
Education Level
Disability

Disability Age Under 5 Comparison

Tongans

Immigrants from Kazakhstan

Tragic
Exceptional
1.3%
DISABILITY AGE UNDER 5
4.2/ 100
METRIC RATING
233rd/ 347
METRIC RANK
1.1%
DISABILITY AGE UNDER 5
99.7/ 100
METRIC RATING
51st/ 347
METRIC RANK

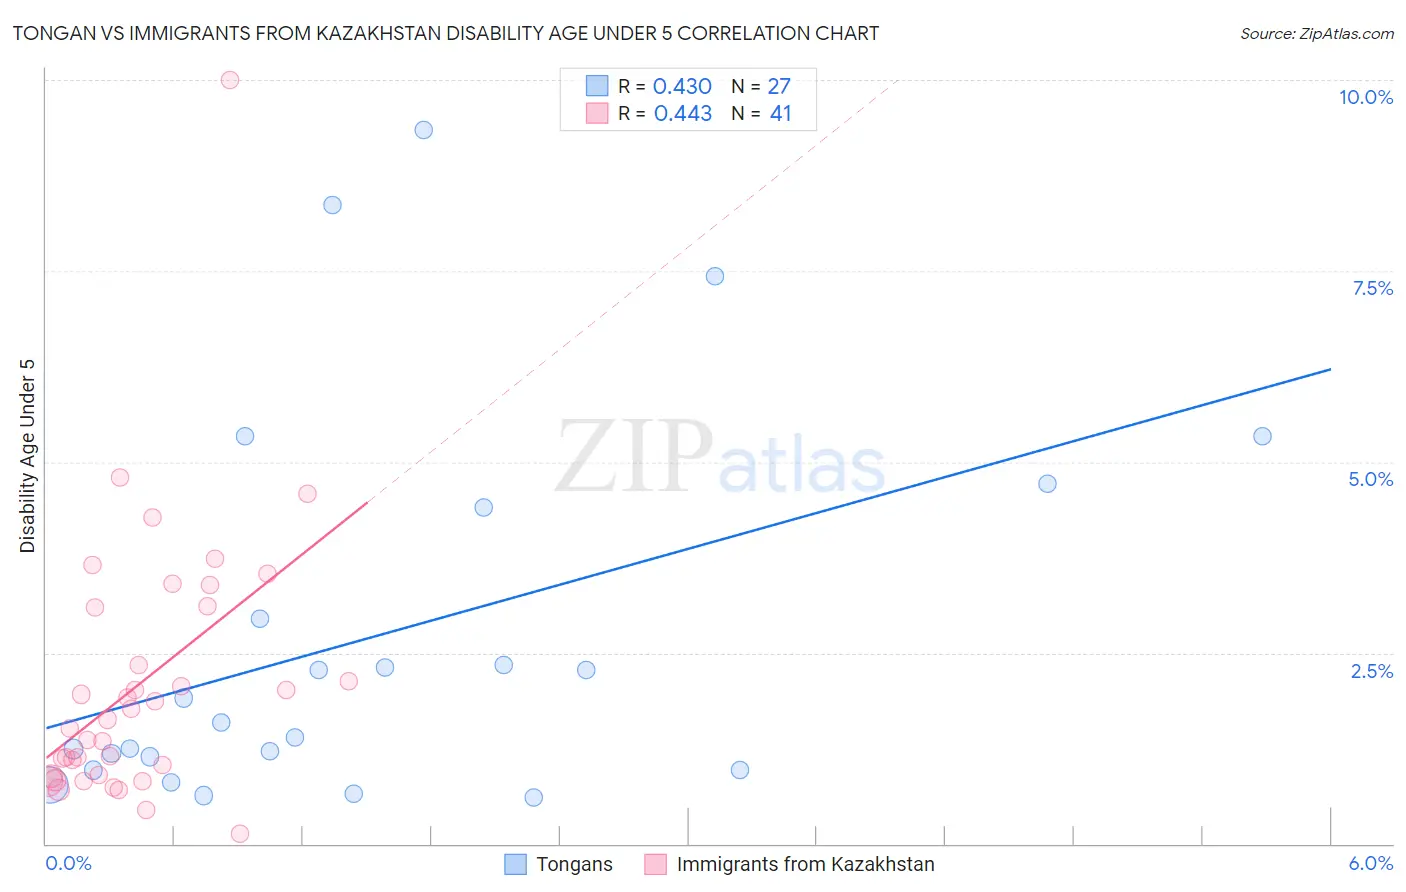
Tongan vs Immigrants from Kazakhstan Disability Age Under 5 Correlation Chart

The statistical analysis conducted on geographies consisting of 77,388,700 people shows a moderate positive correlation between the proportion of Tongans and percentage of population with a disability under the age of 5 in the United States with a correlation coefficient (R) of 0.430 and weighted average of 1.3%. Similarly, the statistical analysis conducted on geographies consisting of 91,439,887 people shows a moderate positive correlation between the proportion of Immigrants from Kazakhstan and percentage of population with a disability under the age of 5 in the United States with a correlation coefficient (R) of 0.443 and weighted average of 1.1%, a difference of 23.2%.
Tongan vs Immigrants from Kazakhstan Disability Age Under 5

Disability Age Under 5 Correlation Summary

MeasurementTonganImmigrants from Kazakhstan
Minimum0.61%0.14%
Maximum9.3%10.0%
Range8.7%9.9%
Mean2.7%2.1%
Median1.6%1.6%
Interquartile 25% (IQ1)0.97%0.89%
Interquartile 75% (IQ3)4.4%3.1%
Interquartile Range (IQR)3.4%2.2%
Standard Deviation (Sample)2.5%1.8%
Standard Deviation (Population)2.4%1.7%

Similar Demographics by Disability Age Under 5

Demographics Similar to Tongans by Disability Age Under 5

In terms of disability age under 5, the demographic groups most similar to Tongans are French American Indian (1.3%, a difference of 0.12%), Immigrants from Northern Europe (1.3%, a difference of 0.25%), Pueblo (1.3%, a difference of 0.26%), Central American Indian (1.3%, a difference of 0.33%), and Lebanese (1.3%, a difference of 0.49%).
DemographicsRating | RankDisability Age Under 5
Bahamians
7.1
/100
|
#226
Tragic
1.3%
Taiwanese
6.1
/100
|
#227
Tragic
1.3%
Luxembourgers
6.1
/100
|
#228
Tragic
1.3%
Immigrants | Costa Rica
5.5
/100
|
#229
Tragic
1.3%
Lebanese
5.3
/100
|
#230
Tragic
1.3%
Immigrants | Northern Europe
4.7
/100
|
#231
Tragic
1.3%
French American Indians
4.5
/100
|
#232
Tragic
1.3%
Tongans
4.2
/100
|
#233
Tragic
1.3%
Pueblo
3.8
/100
|
#234
Tragic
1.3%
Central American Indians
3.6
/100
|
#235
Tragic
1.3%
South American Indians
3.3
/100
|
#236
Tragic
1.3%
Basques
3.0
/100
|
#237
Tragic
1.3%
Spanish American Indians
2.4
/100
|
#238
Tragic
1.3%
Immigrants | Austria
2.3
/100
|
#239
Tragic
1.3%
Native Hawaiians
2.2
/100
|
#240
Tragic
1.3%

Demographics Similar to Immigrants from Kazakhstan by Disability Age Under 5

In terms of disability age under 5, the demographic groups most similar to Immigrants from Kazakhstan are Immigrants from Japan (1.1%, a difference of 0.19%), Immigrants from Russia (1.1%, a difference of 0.20%), Immigrants from Singapore (1.1%, a difference of 0.41%), Immigrants from Bolivia (1.1%, a difference of 0.42%), and Immigrants from Sweden (1.1%, a difference of 0.63%).
DemographicsRating | RankDisability Age Under 5
Immigrants | Asia
99.8
/100
|
#44
Exceptional
1.1%
Immigrants | Turkey
99.8
/100
|
#45
Exceptional
1.1%
Immigrants | Congo
99.8
/100
|
#46
Exceptional
1.1%
Immigrants | Sweden
99.8
/100
|
#47
Exceptional
1.1%
Immigrants | Singapore
99.7
/100
|
#48
Exceptional
1.1%
Immigrants | Russia
99.7
/100
|
#49
Exceptional
1.1%
Immigrants | Japan
99.7
/100
|
#50
Exceptional
1.1%
Immigrants | Kazakhstan
99.7
/100
|
#51
Exceptional
1.1%
Immigrants | Bolivia
99.6
/100
|
#52
Exceptional
1.1%
Asians
99.6
/100
|
#53
Exceptional
1.1%
Immigrants | El Salvador
99.6
/100
|
#54
Exceptional
1.1%
Salvadorans
99.5
/100
|
#55
Exceptional
1.1%
Ecuadorians
99.5
/100
|
#56
Exceptional
1.1%
Assyrians/Chaldeans/Syriacs
99.5
/100
|
#57
Exceptional
1.1%
Immigrants | Egypt
99.4
/100
|
#58
Exceptional
1.1%