Tongan Unemployment Among Women with Children Ages 6 to 17 years

COMPARE

Tongan
Race
Ancestry
AfghanAfricanAlaska NativeAlaskan AthabascanAlbanianAleutAlsatianAmericanApacheArabArapahoArgentineanArmenianAssyrian/Chaldean/SyriacAustralianAustrianBahamianBangladeshiBarbadianBasqueBelgianBelizeanBermudanBhutaneseBlackfeetBolivianBrazilianBritishBritish West IndianBulgarianBurmeseCajunCambodianCanadianCape VerdeanCarpatho RusynCelticCentral AmericanCentral American IndianCherokeeCheyenneChickasawChileanChineseChippewaChoctawColombianColvilleComancheCosta RicanCreeCreekCroatianCrowCubanCypriotCzechCzechoslovakianDanishDelawareDominicanDutchDutch West IndianEastern EuropeanEcuadorianEgyptianEnglishEstonianEthiopianEuropeanFijianFilipinoFinnishFrenchFrench American IndianFrench CanadianGermanGerman RussianGhanaianGreekGuamanian/ChamorroGuatemalanGuyaneseHaitianHmongHonduranHopiHoumaHungarianIcelanderIndian (Asian)IndonesianInupiatIranianIraqiIrishIroquoisIsraeliItalianJamaicanJapaneseJordanianKenyanKiowaKoreanLaotianLatvianLebaneseLiberianLithuanianLumbeeLuxembourgerMacedonianMalaysianMalteseMarshalleseMenomineeMexicanMexican American IndianMongolianMoroccanNative HawaiianNavajoNepaleseNew ZealanderNicaraguanNigerianNorthern EuropeanNorwegianOkinawanOsageOttawaPaiutePakistaniPalestinianPanamanianParaguayanPennsylvania GermanPeruvianPimaPolishPortuguesePotawatomiPuebloPuerto RicanPuget Sound SalishRomanianRussianSalvadoranSamoanScandinavianScotch-IrishScottishSeminoleSenegaleseSerbianShoshoneSierra LeoneanSiouxSlavicSlovakSloveneSomaliSouth AfricanSouth AmericanSouth American IndianSoviet UnionSpaniardSpanishSpanish AmericanSpanish American IndianSri LankanSubsaharan AfricanSudaneseSwedishSwissSyrianTaiwaneseThaiTlingit-HaidaTohono O'OdhamTonganTrinidadian and TobagonianTsimshianTurkishU.S. Virgin IslanderUgandanUkrainianUruguayanUteVenezuelanVietnameseWelshWest IndianYakamaYaquiYugoslavianYumanYup'ikZimbabwean
Immigration
NonimmigrantsImmigrantsAfghanistanAfricaAlbaniaArgentinaArmeniaAsiaAustraliaAustriaBahamasBangladeshBarbadosBelarusBelgiumBelizeBoliviaBosnia and HerzegovinaBrazilBulgariaBurma/MyanmarCabo VerdeCambodiaCameroonCanadaCaribbeanCentral AmericaChileChinaColombiaCongoCosta RicaCroatiaCubaCzechoslovakiaDenmarkDominicaDominican RepublicEastern AfricaEastern AsiaEastern EuropeEcuadorEgyptEl SalvadorEnglandEritreaEthiopiaEuropeFijiFranceGermanyGhanaGreeceGrenadaGuatemalaGuyanaHaitiHondurasHong KongHungaryIndiaIndonesiaIranIraqIrelandIsraelItalyJamaicaJapanJordanKazakhstanKenyaKoreaKuwaitLaosLatin AmericaLatviaLebanonLiberiaLithuaniaMalaysiaMexicoMicronesiaMiddle AfricaMoldovaMoroccoNepalNetherlandsNicaraguaNigeriaNorth AmericaNorth MacedoniaNorthern AfricaNorthern EuropeNorwayOceaniaPakistanPanamaPeruPhilippinesPolandPortugalRomaniaRussiaSaudi ArabiaScotlandSenegalSerbiaSierra LeoneSingaporeSomaliaSouth AfricaSouth AmericaSouth Central AsiaSouth Eastern AsiaSouthern EuropeSpainSri LankaSt. Vincent and the GrenadinesSudanSwedenSwitzerlandSyriaTaiwanThailandTrinidad and TobagoTurkeyUgandaUkraineUruguayUzbekistanVenezuelaVietnamWest IndiesWestern AfricaWestern AsiaWestern EuropeYemenZaireZimbabweAzores
Select to Compare
Race
Ancestry
AfghanAfricanAlaska NativeAlaskan AthabascanAlbanianAleutAlsatianAmericanApacheArabArapahoArgentineanArmenianAssyrian/Chaldean/SyriacAustralianAustrianBahamianBangladeshiBarbadianBasqueBelgianBelizeanBermudanBhutaneseBlackfeetBolivianBrazilianBritishBritish West IndianBulgarianBurmeseCajunCambodianCanadianCape VerdeanCarpatho RusynCelticCentral AmericanCentral American IndianCherokeeCheyenneChickasawChileanChineseChippewaChoctawColombianColvilleComancheCosta RicanCreeCreekCroatianCrowCubanCypriotCzechCzechoslovakianDanishDelawareDominicanDutchDutch West IndianEastern EuropeanEcuadorianEgyptianEnglishEstonianEthiopianEuropeanFijianFilipinoFinnishFrenchFrench American IndianFrench CanadianGermanGerman RussianGhanaianGreekGuamanian/ChamorroGuatemalanGuyaneseHaitianHmongHonduranHopiHoumaHungarianIcelanderIndian (Asian)IndonesianInupiatIranianIraqiIrishIroquoisIsraeliItalianJamaicanJapaneseJordanianKenyanKiowaKoreanLaotianLatvianLebaneseLiberianLithuanianLumbeeLuxembourgerMacedonianMalaysianMalteseMarshalleseMenomineeMexicanMexican American IndianMongolianMoroccanNative HawaiianNavajoNepaleseNew ZealanderNicaraguanNigerianNorthern EuropeanNorwegianOkinawanOsageOttawaPaiutePakistaniPalestinianPanamanianParaguayanPennsylvania GermanPeruvianPimaPolishPortuguesePotawatomiPuebloPuerto RicanPuget Sound SalishRomanianRussianSalvadoranSamoanScandinavianScotch-IrishScottishSeminoleSenegaleseSerbianShoshoneSierra LeoneanSiouxSlavicSlovakSloveneSomaliSouth AfricanSouth AmericanSouth American IndianSoviet UnionSpaniardSpanishSpanish AmericanSpanish American IndianSri LankanSubsaharan AfricanSudaneseSwedishSwissSyrianTaiwaneseThaiTlingit-HaidaTohono O'OdhamTrinidadian and TobagonianTsimshianTurkishU.S. Virgin IslanderUgandanUkrainianUruguayanUteVenezuelanVietnameseWelshWest IndianYakamaYaquiYugoslavianYumanYup'ikZimbabwean
Immigration
NonimmigrantsImmigrantsAfghanistanAfricaAlbaniaArgentinaArmeniaAsiaAustraliaAustriaBahamasBangladeshBarbadosBelarusBelgiumBelizeBoliviaBosnia and HerzegovinaBrazilBulgariaBurma/MyanmarCabo VerdeCambodiaCameroonCanadaCaribbeanCentral AmericaChileChinaColombiaCongoCosta RicaCroatiaCubaCzechoslovakiaDenmarkDominicaDominican RepublicEastern AfricaEastern AsiaEastern EuropeEcuadorEgyptEl SalvadorEnglandEritreaEthiopiaEuropeFijiFranceGermanyGhanaGreeceGrenadaGuatemalaGuyanaHaitiHondurasHong KongHungaryIndiaIndonesiaIranIraqIrelandIsraelItalyJamaicaJapanJordanKazakhstanKenyaKoreaKuwaitLaosLatin AmericaLatviaLebanonLiberiaLithuaniaMalaysiaMexicoMicronesiaMiddle AfricaMoldovaMoroccoNepalNetherlandsNicaraguaNigeriaNorth AmericaNorth MacedoniaNorthern AfricaNorthern EuropeNorwayOceaniaPakistanPanamaPeruPhilippinesPolandPortugalRomaniaRussiaSaudi ArabiaScotlandSenegalSerbiaSierra LeoneSingaporeSomaliaSouth AfricaSouth AmericaSouth Central AsiaSouth Eastern AsiaSouthern EuropeSpainSri LankaSt. Vincent and the GrenadinesSudanSwedenSwitzerlandSyriaTaiwanThailandTrinidad and TobagoTurkeyUgandaUkraineUruguayUzbekistanVenezuelaVietnamWest IndiesWestern AfricaWestern AsiaWestern EuropeYemenZaireZimbabweAzores
Unemployment Among Women with Children Ages 6 to 17 years
Income
Poverty
Unemployment
Labor Participation
Family Structure
Vehicle Availability
Education Level
Disability

Tongan Unemployment Among Women with Children Ages 6 to 17 years
Exceptional

6.7%
UNEMPLOYMENT | WOMEN W/ CHILDREN 6 TO 17
100.0/ 100
METRIC RATING
3rd/ 347
METRIC RANK

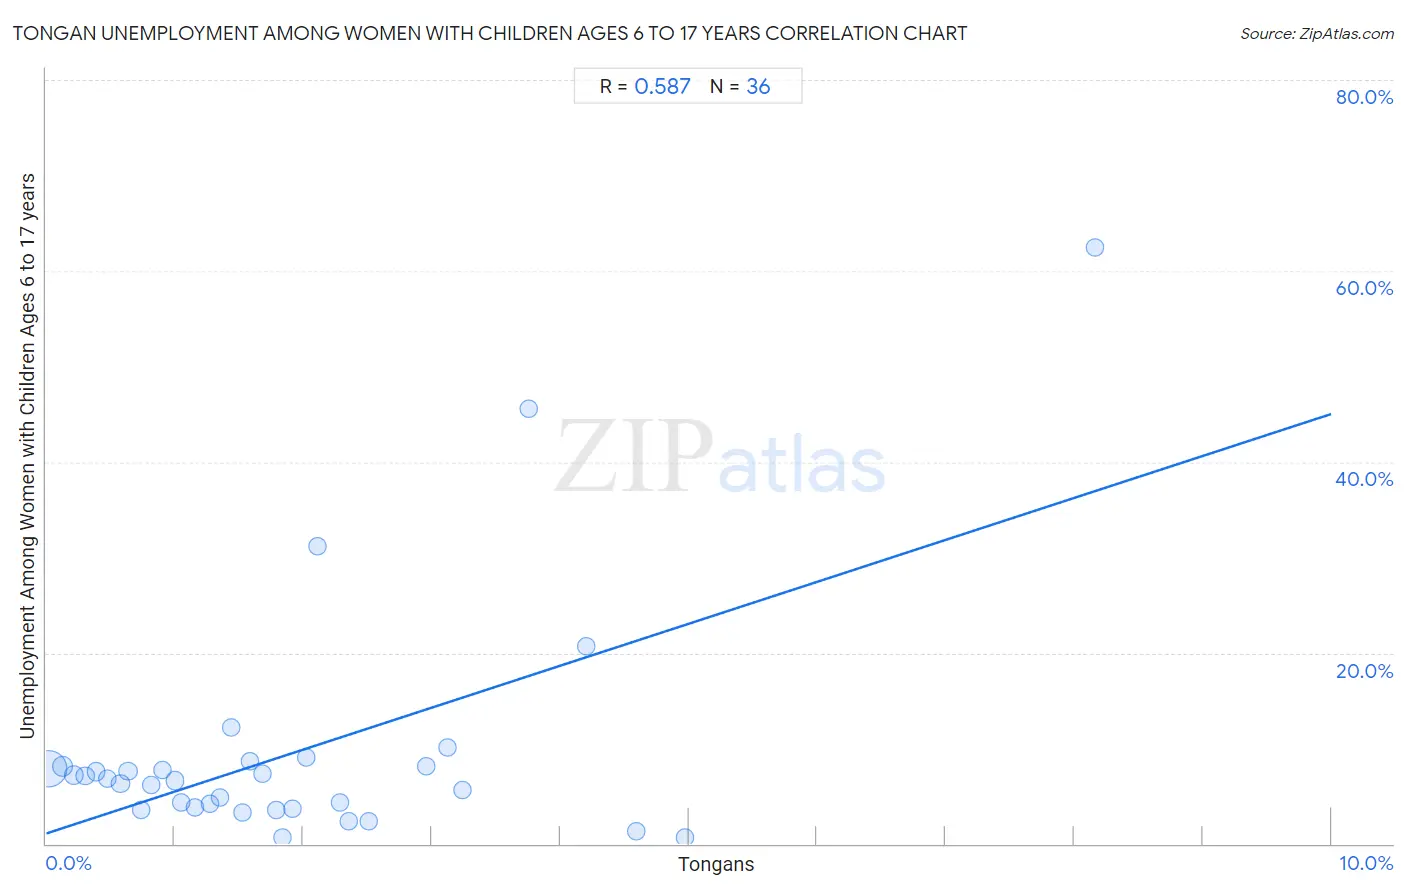
Tongan Unemployment Among Women with Children Ages 6 to 17 years Correlation Chart

The statistical analysis conducted on geographies consisting of 89,455,021 people shows a substantial positive correlation between the proportion of Tongans and unemployment rate among women with children between the ages 6 and 17 in the United States with a correlation coefficient (R) of 0.587 and weighted average of 6.7%. On average, for every 1% (one percent) increase in Tongans within a typical geography, there is an increase of 4.4% in unemployment rate among women with children between the ages 6 and 17.
Tongan Unemployment Among Women with Children Ages 6 to 17 years
It is essential to understand that the correlation between the percentage of Tongans and unemployment rate among women with children between the ages 6 and 17 does not imply a direct cause-and-effect relationship. It remains uncertain whether the presence of Tongans influences an upward or downward trend in the level of unemployment rate among women with children between the ages 6 and 17 within an area, or if Tongans simply ended up residing in those areas with higher or lower levels of unemployment rate among women with children between the ages 6 and 17 due to other factors.

Demographics Similar to Tongans by Unemployment Among Women with Children Ages 6 to 17 years

In terms of unemployment among women with children ages 6 to 17 years, the demographic groups most similar to Tongans are Fijian (6.6%, a difference of 1.2%), Taiwanese (6.5%, a difference of 3.8%), Ute (7.0%, a difference of 4.5%), Okinawan (7.0%, a difference of 5.1%), and Tlingit-Haida (7.1%, a difference of 5.6%).
DemographicsRating | RankUnemployment Among Women with Children Ages 6 to 17 years
Taiwanese
100.0
/100
|
#1
Exceptional
6.5%
Fijians
100.0
/100
|
#2
Exceptional
6.6%
Tongans
100.0
/100
|
#3
Exceptional
6.7%
Ute
100.0
/100
|
#4
Exceptional
7.0%
Okinawans
100.0
/100
|
#5
Exceptional
7.0%
Tlingit-Haida
100.0
/100
|
#6
Exceptional
7.1%
Soviet Union
100.0
/100
|
#7
Exceptional
7.1%
Immigrants from Hong Kong
100.0
/100
|
#8
Exceptional
7.2%
Assyrians/Chaldeans/Syriacs
100.0
/100
|
#9
Exceptional
7.2%
Immigrants from Fiji
100.0
/100
|
#10
Exceptional
7.3%
Immigrants from Taiwan
100.0
/100
|
#11
Exceptional
7.3%
Bangladeshis
100.0
/100
|
#12
Exceptional
7.4%
Indonesians
100.0
/100
|
#13
Exceptional
7.4%
Sudanese
100.0
/100
|
#14
Exceptional
7.4%
Puget Sound Salish
100.0
/100
|
#15
Exceptional
7.5%

Tongan Unemployment Among Women with Children Ages 6 to 17 years Correlation Summary

MeasurementTongan DataUnemployment Among Women with Children Ages 6 to 17 years Data
Minimum0.021%0.60%
Maximum8.2%62.5%
Range8.1%61.9%
Mean1.9%9.5%
Median1.6%6.7%
Interquartile 25% (IQ1)0.78%3.8%
Interquartile 75% (IQ3)2.4%8.1%
Interquartile Range (IQR)1.7%4.3%
Standard Deviation (Sample)1.7%12.4%
Standard Deviation (Population)1.6%12.2%

Correlation Details

Tongan PercentileSample SizeUnemployment Among Women with Children Ages 6 to 17 years
[
0.0%
-
0.5%
]
0.021%
68,282,1087.8%
[
0.0%
-
0.5%
]
0.13%
8,432,4828.1%
[
0.0%
-
0.5%
]
0.22%
3,839,9947.1%
[
0.0%
-
0.5%
]
0.30%
2,761,7507.1%
[
0.0%
-
0.5%
]
0.39%
1,228,9717.5%
[
0.0%
-
0.5%
]
0.48%
870,6266.8%
[
0.5%
-
1.0%
]
0.58%
981,0256.3%
[
0.5%
-
1.0%
]
0.64%
430,7197.6%
[
0.5%
-
1.0%
]
0.74%
491,9963.5%
[
0.5%
-
1.0%
]
0.81%
159,7706.1%
[
0.5%
-
1.0%
]
0.91%
193,9937.8%
[
1.0%
-
1.5%
]
1.00%
107,5966.6%
[
1.0%
-
1.5%
]
1.05%
342,7294.3%
[
1.0%
-
1.5%
]
1.16%
364,4203.8%
[
1.0%
-
1.5%
]
1.27%
72,1214.2%
[
1.0%
-
1.5%
]
1.35%
27,9714.9%
[
1.0%
-
1.5%
]
1.44%
149,31512.2%
[
1.5%
-
2.0%
]
1.53%
59,3103.2%
[
1.5%
-
2.0%
]
1.58%
80,1748.6%
[
1.5%
-
2.0%
]
1.68%
62,0197.3%
[
1.5%
-
2.0%
]
1.79%
38,4273.5%
[
1.5%
-
2.0%
]
1.84%
11,7310.70%
[
1.5%
-
2.0%
]
1.92%
12,3703.7%
[
2.0%
-
2.5%
]
2.02%
69,3839.1%
[
2.0%
-
2.5%
]
2.11%
8,52631.1%
[
2.0%
-
2.5%
]
2.29%
178,5834.4%
[
2.0%
-
2.5%
]
2.36%
41,3872.3%
[
2.5%
-
3.0%
]
2.51%
17,4002.4%
[
2.5%
-
3.0%
]
2.96%
4,6968.1%
[
3.0%
-
3.5%
]
3.12%
3,26410.1%
[
3.0%
-
3.5%
]
3.24%
88,0925.6%
[
3.5%
-
4.0%
]
3.75%
85345.5%
[
4.0%
-
4.5%
]
4.21%
4,70820.7%
[
4.5%
-
5.0%
]
4.59%
12,9061.3%
[
4.5%
-
5.0%
]
4.97%
23,2140.60%
[
8.0%
-
8.5%
]
8.16%
39262.5%