Tongan Married-Couple Family Poverty

COMPARE

Tongan
Race
Ancestry
AfghanAfricanAlaska NativeAlaskan AthabascanAlbanianAleutAlsatianAmericanApacheArabArapahoArgentineanArmenianAssyrian/Chaldean/SyriacAustralianAustrianBahamianBangladeshiBarbadianBasqueBelgianBelizeanBermudanBhutaneseBlackfeetBolivianBrazilianBritishBritish West IndianBulgarianBurmeseCajunCambodianCanadianCape VerdeanCarpatho RusynCelticCentral AmericanCentral American IndianCherokeeCheyenneChickasawChileanChineseChippewaChoctawColombianColvilleComancheCosta RicanCreeCreekCroatianCrowCubanCypriotCzechCzechoslovakianDanishDelawareDominicanDutchDutch West IndianEastern EuropeanEcuadorianEgyptianEnglishEstonianEthiopianEuropeanFijianFilipinoFinnishFrenchFrench American IndianFrench CanadianGermanGerman RussianGhanaianGreekGuamanian/ChamorroGuatemalanGuyaneseHaitianHmongHonduranHopiHoumaHungarianIcelanderIndian (Asian)IndonesianInupiatIranianIraqiIrishIroquoisIsraeliItalianJamaicanJapaneseJordanianKenyanKiowaKoreanLaotianLatvianLebaneseLiberianLithuanianLumbeeLuxembourgerMacedonianMalaysianMalteseMarshalleseMenomineeMexicanMexican American IndianMongolianMoroccanNative HawaiianNavajoNepaleseNew ZealanderNicaraguanNigerianNorthern EuropeanNorwegianOkinawanOsageOttawaPaiutePakistaniPalestinianPanamanianParaguayanPennsylvania GermanPeruvianPimaPolishPortuguesePotawatomiPuebloPuerto RicanPuget Sound SalishRomanianRussianSalvadoranSamoanScandinavianScotch-IrishScottishSeminoleSenegaleseSerbianShoshoneSierra LeoneanSiouxSlavicSlovakSloveneSomaliSouth AfricanSouth AmericanSouth American IndianSoviet UnionSpaniardSpanishSpanish AmericanSpanish American IndianSri LankanSubsaharan AfricanSudaneseSwedishSwissSyrianTaiwaneseThaiTlingit-HaidaTohono O'OdhamTonganTrinidadian and TobagonianTsimshianTurkishU.S. Virgin IslanderUgandanUkrainianUruguayanUteVenezuelanVietnameseWelshWest IndianYakamaYaquiYugoslavianYumanYup'ikZimbabwean
Immigration
NonimmigrantsImmigrantsAfghanistanAfricaAlbaniaArgentinaArmeniaAsiaAustraliaAustriaBahamasBangladeshBarbadosBelarusBelgiumBelizeBoliviaBosnia and HerzegovinaBrazilBulgariaBurma/MyanmarCabo VerdeCambodiaCameroonCanadaCaribbeanCentral AmericaChileChinaColombiaCongoCosta RicaCroatiaCubaCzechoslovakiaDenmarkDominicaDominican RepublicEastern AfricaEastern AsiaEastern EuropeEcuadorEgyptEl SalvadorEnglandEritreaEthiopiaEuropeFijiFranceGermanyGhanaGreeceGrenadaGuatemalaGuyanaHaitiHondurasHong KongHungaryIndiaIndonesiaIranIraqIrelandIsraelItalyJamaicaJapanJordanKazakhstanKenyaKoreaKuwaitLaosLatin AmericaLatviaLebanonLiberiaLithuaniaMalaysiaMexicoMicronesiaMiddle AfricaMoldovaMoroccoNepalNetherlandsNicaraguaNigeriaNorth AmericaNorth MacedoniaNorthern AfricaNorthern EuropeNorwayOceaniaPakistanPanamaPeruPhilippinesPolandPortugalRomaniaRussiaSaudi ArabiaScotlandSenegalSerbiaSierra LeoneSingaporeSomaliaSouth AfricaSouth AmericaSouth Central AsiaSouth Eastern AsiaSouthern EuropeSpainSri LankaSt. Vincent and the GrenadinesSudanSwedenSwitzerlandSyriaTaiwanThailandTrinidad and TobagoTurkeyUgandaUkraineUruguayUzbekistanVenezuelaVietnamWest IndiesWestern AfricaWestern AsiaWestern EuropeYemenZaireZimbabweAzores
Select to Compare
Race
Ancestry
AfghanAfricanAlaska NativeAlaskan AthabascanAlbanianAleutAlsatianAmericanApacheArabArapahoArgentineanArmenianAssyrian/Chaldean/SyriacAustralianAustrianBahamianBangladeshiBarbadianBasqueBelgianBelizeanBermudanBhutaneseBlackfeetBolivianBrazilianBritishBritish West IndianBulgarianBurmeseCajunCambodianCanadianCape VerdeanCarpatho RusynCelticCentral AmericanCentral American IndianCherokeeCheyenneChickasawChileanChineseChippewaChoctawColombianColvilleComancheCosta RicanCreeCreekCroatianCrowCubanCypriotCzechCzechoslovakianDanishDelawareDominicanDutchDutch West IndianEastern EuropeanEcuadorianEgyptianEnglishEstonianEthiopianEuropeanFijianFilipinoFinnishFrenchFrench American IndianFrench CanadianGermanGerman RussianGhanaianGreekGuamanian/ChamorroGuatemalanGuyaneseHaitianHmongHonduranHopiHoumaHungarianIcelanderIndian (Asian)IndonesianInupiatIranianIraqiIrishIroquoisIsraeliItalianJamaicanJapaneseJordanianKenyanKiowaKoreanLaotianLatvianLebaneseLiberianLithuanianLumbeeLuxembourgerMacedonianMalaysianMalteseMarshalleseMenomineeMexicanMexican American IndianMongolianMoroccanNative HawaiianNavajoNepaleseNew ZealanderNicaraguanNigerianNorthern EuropeanNorwegianOkinawanOsageOttawaPaiutePakistaniPalestinianPanamanianParaguayanPennsylvania GermanPeruvianPimaPolishPortuguesePotawatomiPuebloPuerto RicanPuget Sound SalishRomanianRussianSalvadoranSamoanScandinavianScotch-IrishScottishSeminoleSenegaleseSerbianShoshoneSierra LeoneanSiouxSlavicSlovakSloveneSomaliSouth AfricanSouth AmericanSouth American IndianSoviet UnionSpaniardSpanishSpanish AmericanSpanish American IndianSri LankanSubsaharan AfricanSudaneseSwedishSwissSyrianTaiwaneseThaiTlingit-HaidaTohono O'OdhamTrinidadian and TobagonianTsimshianTurkishU.S. Virgin IslanderUgandanUkrainianUruguayanUteVenezuelanVietnameseWelshWest IndianYakamaYaquiYugoslavianYumanYup'ikZimbabwean
Immigration
NonimmigrantsImmigrantsAfghanistanAfricaAlbaniaArgentinaArmeniaAsiaAustraliaAustriaBahamasBangladeshBarbadosBelarusBelgiumBelizeBoliviaBosnia and HerzegovinaBrazilBulgariaBurma/MyanmarCabo VerdeCambodiaCameroonCanadaCaribbeanCentral AmericaChileChinaColombiaCongoCosta RicaCroatiaCubaCzechoslovakiaDenmarkDominicaDominican RepublicEastern AfricaEastern AsiaEastern EuropeEcuadorEgyptEl SalvadorEnglandEritreaEthiopiaEuropeFijiFranceGermanyGhanaGreeceGrenadaGuatemalaGuyanaHaitiHondurasHong KongHungaryIndiaIndonesiaIranIraqIrelandIsraelItalyJamaicaJapanJordanKazakhstanKenyaKoreaKuwaitLaosLatin AmericaLatviaLebanonLiberiaLithuaniaMalaysiaMexicoMicronesiaMiddle AfricaMoldovaMoroccoNepalNetherlandsNicaraguaNigeriaNorth AmericaNorth MacedoniaNorthern AfricaNorthern EuropeNorwayOceaniaPakistanPanamaPeruPhilippinesPolandPortugalRomaniaRussiaSaudi ArabiaScotlandSenegalSerbiaSierra LeoneSingaporeSomaliaSouth AfricaSouth AmericaSouth Central AsiaSouth Eastern AsiaSouthern EuropeSpainSri LankaSt. Vincent and the GrenadinesSudanSwedenSwitzerlandSyriaTaiwanThailandTrinidad and TobagoTurkeyUgandaUkraineUruguayUzbekistanVenezuelaVietnamWest IndiesWestern AfricaWestern AsiaWestern EuropeYemenZaireZimbabweAzores
Married-Couple Family Poverty
Income
Poverty
Unemployment
Labor Participation
Family Structure
Vehicle Availability
Education Level
Disability

Tongan Married-Couple Family Poverty
Exceptional

4.7%
POVERTY | MARRIED-COUPLE FAMILIES
95.9/ 100
METRIC RATING
112th/ 347
METRIC RANK

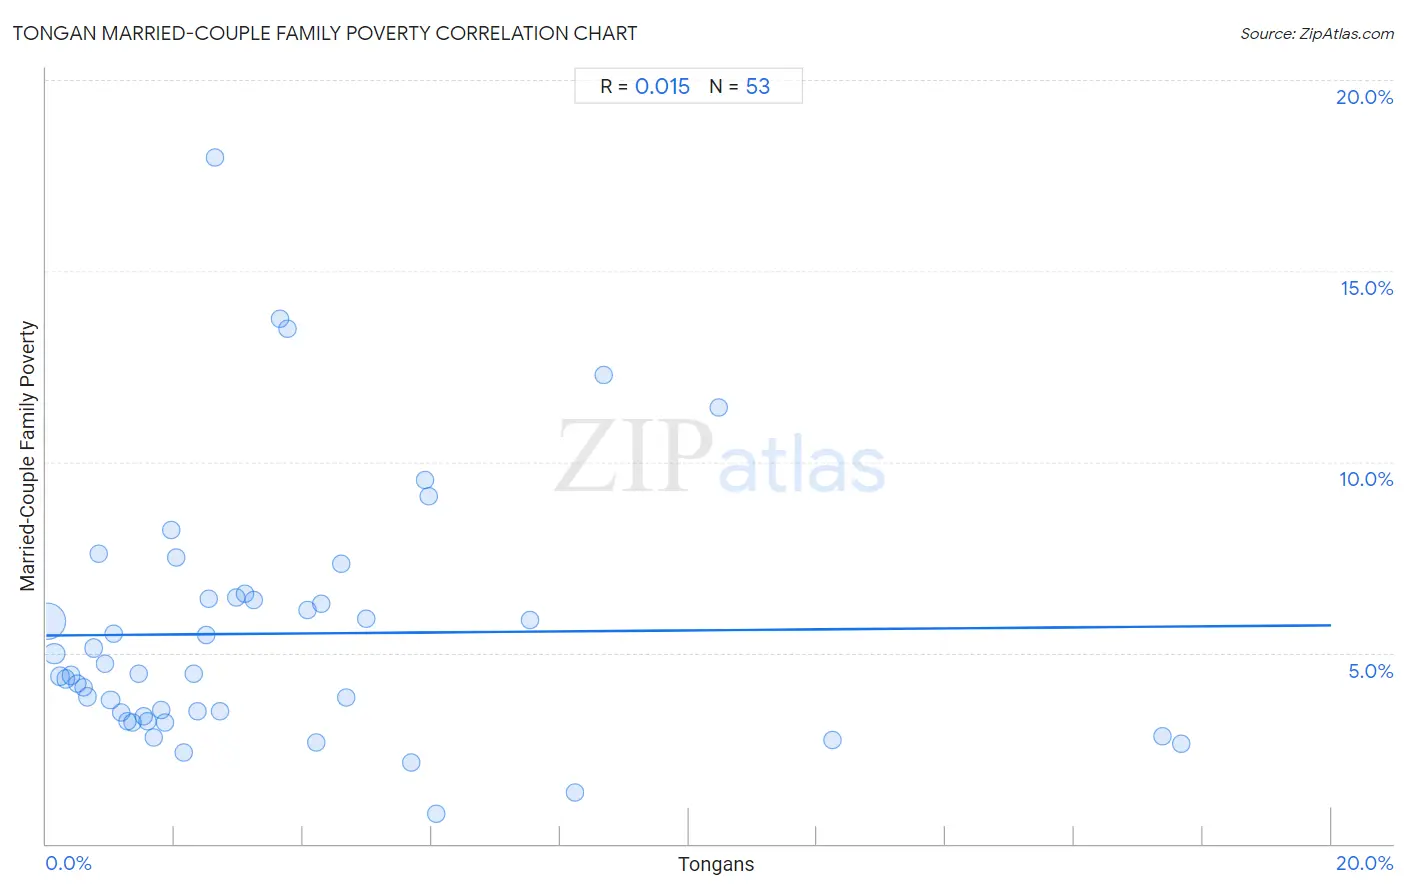
Tongan Married-Couple Family Poverty Correlation Chart

The statistical analysis conducted on geographies consisting of 102,697,029 people shows no correlation between the proportion of Tongans and poverty level among married-couple families in the United States with a correlation coefficient (R) of 0.015 and weighted average of 4.7%. On average, for every 1% (one percent) increase in Tongans within a typical geography, there is an increase of 0.013% in poverty level among married-couple families.
Tongan Married-Couple Family Poverty
It is essential to understand that the correlation between the percentage of Tongans and poverty level among married-couple families does not imply a direct cause-and-effect relationship. It remains uncertain whether the presence of Tongans influences an upward or downward trend in the level of poverty level among married-couple families within an area, or if Tongans simply ended up residing in those areas with higher or lower levels of poverty level among married-couple families due to other factors.

Demographics Similar to Tongans by Married-Couple Family Poverty

In terms of married-couple family poverty, the demographic groups most similar to Tongans are Immigrants from Nepal (4.7%, a difference of 0.070%), Pakistani (4.7%, a difference of 0.18%), Immigrants from Bolivia (4.7%, a difference of 0.22%), Immigrants from Hong Kong (4.7%, a difference of 0.38%), and Laotian (4.7%, a difference of 0.58%).
DemographicsRating | RankMarried-Couple Family Poverty
Aleuts
97.0
/100
|
#105
Exceptional
4.7%
Immigrants from France
96.9
/100
|
#106
Exceptional
4.7%
Immigrants from Germany
96.8
/100
|
#107
Exceptional
4.7%
Laotians
96.6
/100
|
#108
Exceptional
4.7%
Immigrants from Hong Kong
96.4
/100
|
#109
Exceptional
4.7%
Immigrants from Bolivia
96.2
/100
|
#110
Exceptional
4.7%
Pakistanis
96.2
/100
|
#111
Exceptional
4.7%
Tongans
95.9
/100
|
#112
Exceptional
4.7%
Immigrants from Nepal
95.9
/100
|
#113
Exceptional
4.7%
Immigrants from Indonesia
95.1
/100
|
#114
Exceptional
4.8%
Taiwanese
94.8
/100
|
#115
Exceptional
4.8%
Celtics
94.8
/100
|
#116
Exceptional
4.8%
Kenyans
94.7
/100
|
#117
Exceptional
4.8%
Immigrants from Philippines
94.6
/100
|
#118
Exceptional
4.8%
Immigrants from Eastern Asia
94.0
/100
|
#119
Exceptional
4.8%

Tongan Married-Couple Family Poverty Correlation Summary

MeasurementTongan DataMarried-Couple Family Poverty Data
Minimum0.023%0.80%
Maximum17.7%18.0%
Range17.6%17.2%
Mean3.6%5.5%
Median2.4%4.4%
Interquartile 25% (IQ1)1.1%3.3%
Interquartile 75% (IQ3)4.6%6.4%
Interquartile Range (IQR)3.5%3.2%
Standard Deviation (Sample)3.9%3.3%
Standard Deviation (Population)3.8%3.3%

Correlation Details

Tongan PercentileSample SizeMarried-Couple Family Poverty
[
0.0%
-
0.5%
]
0.023%
74,421,9915.8%
[
0.0%
-
0.5%
]
0.13%
10,573,1045.0%
[
0.0%
-
0.5%
]
0.22%
5,178,8404.4%
[
0.0%
-
0.5%
]
0.31%
3,560,0284.3%
[
0.0%
-
0.5%
]
0.39%
1,854,4384.4%
[
0.0%
-
0.5%
]
0.48%
1,275,4454.2%
[
0.5%
-
1.0%
]
0.58%
1,272,0754.1%
[
0.5%
-
1.0%
]
0.64%
651,5363.8%
[
0.5%
-
1.0%
]
0.74%
615,2085.1%
[
0.5%
-
1.0%
]
0.82%
302,3007.6%
[
0.5%
-
1.0%
]
0.91%
232,0254.7%
[
1.0%
-
1.5%
]
1.00%
226,1933.8%
[
1.0%
-
1.5%
]
1.05%
424,7875.5%
[
1.0%
-
1.5%
]
1.16%
586,5373.4%
[
1.0%
-
1.5%
]
1.27%
77,2703.2%
[
1.0%
-
1.5%
]
1.34%
76,4083.2%
[
1.0%
-
1.5%
]
1.43%
235,0034.4%
[
1.5%
-
2.0%
]
1.53%
70,7493.3%
[
1.5%
-
2.0%
]
1.58%
99,7293.2%
[
1.5%
-
2.0%
]
1.68%
62,0192.8%
[
1.5%
-
2.0%
]
1.79%
100,7303.5%
[
1.5%
-
2.0%
]
1.84%
11,9433.2%
[
1.5%
-
2.0%
]
1.94%
18,7898.2%
[
2.0%
-
2.5%
]
2.02%
73,2567.5%
[
2.0%
-
2.5%
]
2.13%
95,5992.4%
[
2.0%
-
2.5%
]
2.29%
179,9624.4%
[
2.0%
-
2.5%
]
2.36%
48,6923.5%
[
2.0%
-
2.5%
]
2.49%
23,7085.5%
[
2.5%
-
3.0%
]
2.52%
35,3926.4%
[
2.5%
-
3.0%
]
2.62%
3,39718.0%
[
2.5%
-
3.0%
]
2.70%
56,7093.5%
[
2.5%
-
3.0%
]
2.97%
13,2816.4%
[
3.0%
-
3.5%
]
3.09%
26,9546.5%
[
3.0%
-
3.5%
]
3.24%
92,1606.4%
[
3.5%
-
4.0%
]
3.63%
3,74613.8%
[
3.5%
-
4.0%
]
3.75%
85313.5%
[
4.0%
-
4.5%
]
4.08%
6,2576.1%
[
4.0%
-
4.5%
]
4.21%
4,7082.6%
[
4.0%
-
4.5%
]
4.29%
30,9836.3%
[
4.5%
-
5.0%
]
4.59%
12,9067.3%
[
4.5%
-
5.0%
]
4.68%
4,5553.8%
[
4.5%
-
5.0%
]
4.97%
23,2145.9%
[
5.5%
-
6.0%
]
5.68%
3,5932.1%
[
5.5%
-
6.0%
]
5.89%
1,6489.5%
[
5.5%
-
6.0%
]
5.95%
3,7349.1%
[
6.0%
-
6.5%
]
6.06%
6930.80%
[
7.5%
-
8.0%
]
7.54%
6,7795.9%
[
8.0%
-
8.5%
]
8.24%
5101.3%
[
8.5%
-
9.0%
]
8.68%
2,74212.3%
[
10.0%
-
10.5%
]
10.47%
2,27411.4%
[
12.0%
-
12.5%
]
12.24%
3922.7%
[
17.0%
-
17.5%
]
17.37%
5,4112.8%
[
17.5%
-
18.0%
]
17.67%
5,7742.6%