Sierra Leonean 2 or more Vehicles in Household
COMPARE
Sierra Leonean
Select to Compare
2 or more Vehicles in Household
Sierra Leonean 2 or more Vehicles in Household
52.9%
2+ VEHICLES AVAILABLE
1.2/ 100
METRIC RATING
247th/ 347
METRIC RANK
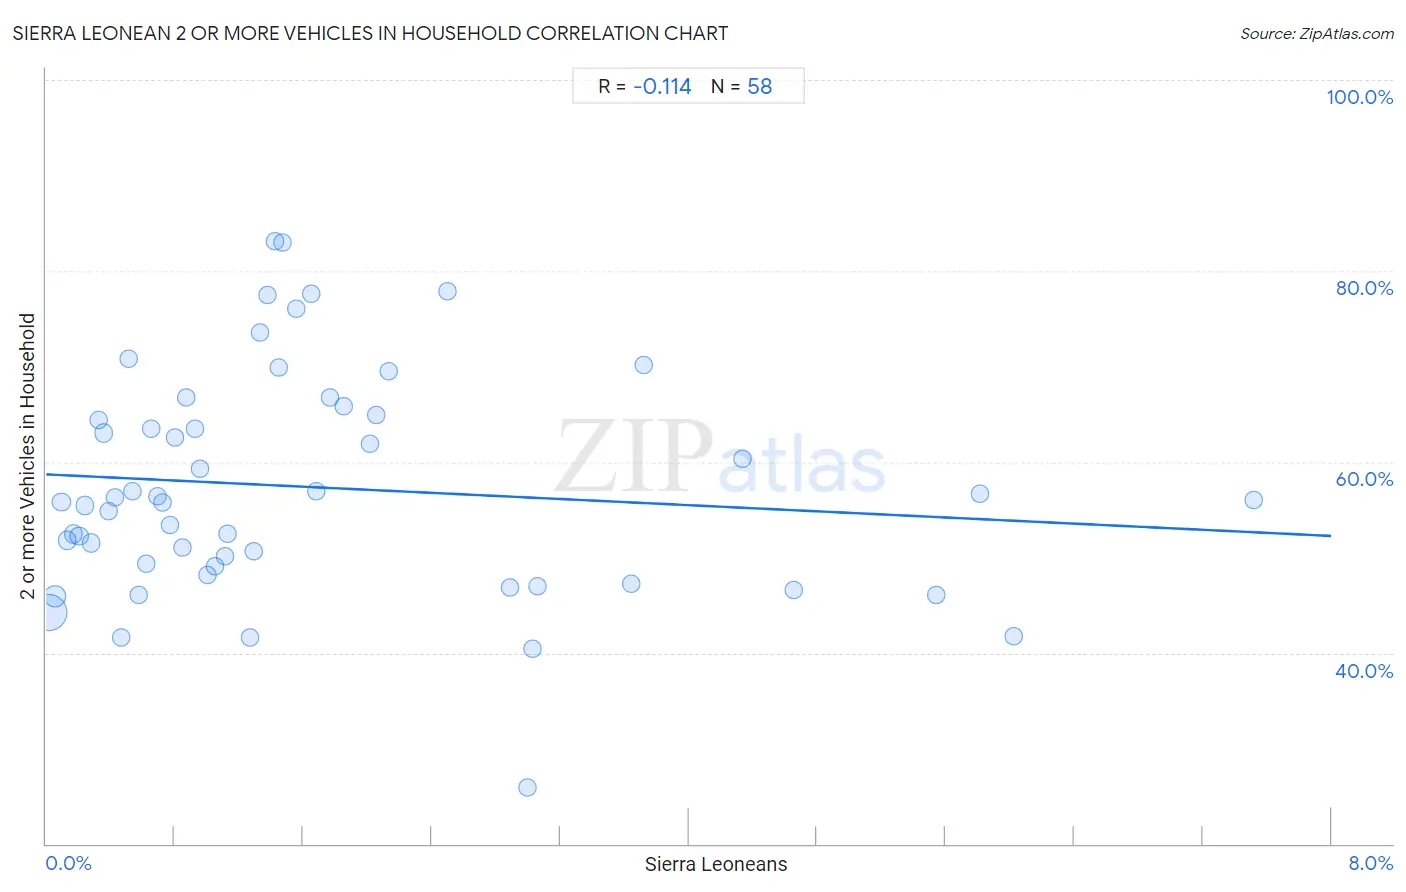
Sierra Leonean 2 or more Vehicles in Household Correlation Chart
The statistical analysis conducted on geographies consisting of 83,352,562 people shows a poor negative correlation between the proportion of Sierra Leoneans and percentage of households with 2 or more vehicles available in the United States with a correlation coefficient (R) of -0.114 and weighted average of 52.9%. On average, for every 1% (one percent) increase in Sierra Leoneans within a typical geography, there is a decrease of 0.81% in percentage of households with 2 or more vehicles available.
It is essential to understand that the correlation between the percentage of Sierra Leoneans and percentage of households with 2 or more vehicles available does not imply a direct cause-and-effect relationship. It remains uncertain whether the presence of Sierra Leoneans influences an upward or downward trend in the level of percentage of households with 2 or more vehicles available within an area, or if Sierra Leoneans simply ended up residing in those areas with higher or lower levels of percentage of households with 2 or more vehicles available due to other factors.
Demographics Similar to Sierra Leoneans by 2 or more Vehicles in Household
In terms of 2 or more vehicles in household, the demographic groups most similar to Sierra Leoneans are Immigrants from Nigeria (52.9%, a difference of 0.030%), Colombian (52.9%, a difference of 0.12%), Immigrants from Brazil (52.8%, a difference of 0.18%), Mongolian (52.8%, a difference of 0.18%), and Immigrants from Sudan (52.8%, a difference of 0.21%).
| Demographics | Rating | Rank | 2 or more Vehicles in Household |
| Immigrants from Europe | 2.1 /100 | #240 | Tragic 53.2% |
| Immigrants from Sierra Leone | 2.1 /100 | #241 | Tragic 53.2% |
| Immigrants from Eastern Asia | 2.1 /100 | #242 | Tragic 53.2% |
| Ethiopians | 1.7 /100 | #243 | Tragic 53.1% |
| Indians (Asian) | 1.7 /100 | #244 | Tragic 53.1% |
| Immigrants from Ethiopia | 1.5 /100 | #245 | Tragic 53.0% |
| Immigrants from Nigeria | 1.2 /100 | #246 | Tragic 52.9% |
| Sierra Leoneans | 1.2 /100 | #247 | Tragic 52.9% |
| Colombians | 1.1 /100 | #248 | Tragic 52.9% |
| Immigrants from Brazil | 1.0 /100 | #249 | Tragic 52.8% |
| Mongolians | 1.0 /100 | #250 | Tragic 52.8% |
| Immigrants from Sudan | 1.0 /100 | #251 | Tragic 52.8% |
| Immigrants from Portugal | 1.0 /100 | #252 | Tragic 52.8% |
| Nigerians | 0.9 /100 | #253 | Tragic 52.8% |
| Immigrants from Malaysia | 0.8 /100 | #254 | Tragic 52.7% |
Sierra Leonean 2 or more Vehicles in Household Correlation Summary
| Measurement | Sierra Leonean Data | 2 or more Vehicles in Household Data |
| Minimum | 0.013% | 25.9% |
| Maximum | 7.5% | 83.1% |
| Range | 7.5% | 57.3% |
| Mean | 1.7% | 57.3% |
| Median | 1.1% | 55.9% |
| Interquartile 25% (IQ1) | 0.54% | 49.0% |
| Interquartile 75% (IQ3) | 2.1% | 64.9% |
| Interquartile Range (IQR) | 1.5% | 15.8% |
| Standard Deviation (Sample) | 1.7% | 11.8% |
| Standard Deviation (Population) | 1.7% | 11.7% |
Correlation Details
| Sierra Leonean Percentile | Sample Size | 2 or more Vehicles in Household |
[ 0.0% - 0.5% ] 0.013% | 57,500,714 | 44.2% |
[ 0.0% - 0.5% ] 0.055% | 11,196,430 | 45.9% |
[ 0.0% - 0.5% ] 0.092% | 2,821,159 | 55.8% |
[ 0.0% - 0.5% ] 0.13% | 1,829,461 | 51.8% |
[ 0.0% - 0.5% ] 0.17% | 2,275,579 | 52.4% |
[ 0.0% - 0.5% ] 0.21% | 1,138,077 | 52.2% |
[ 0.0% - 0.5% ] 0.24% | 1,071,225 | 55.4% |
[ 0.0% - 0.5% ] 0.28% | 753,216 | 51.5% |
[ 0.0% - 0.5% ] 0.32% | 483,134 | 64.4% |
[ 0.0% - 0.5% ] 0.36% | 470,594 | 63.0% |
[ 0.0% - 0.5% ] 0.39% | 564,960 | 54.9% |
[ 0.0% - 0.5% ] 0.43% | 464,114 | 56.3% |
[ 0.0% - 0.5% ] 0.47% | 236,920 | 41.6% |
[ 0.5% - 1.0% ] 0.51% | 206,870 | 70.8% |
[ 0.5% - 1.0% ] 0.54% | 158,104 | 57.0% |
[ 0.5% - 1.0% ] 0.57% | 408,817 | 46.1% |
[ 0.5% - 1.0% ] 0.63% | 117,910 | 49.3% |
[ 0.5% - 1.0% ] 0.66% | 234,227 | 63.5% |
[ 0.5% - 1.0% ] 0.69% | 144,320 | 56.4% |
[ 0.5% - 1.0% ] 0.73% | 103,153 | 55.7% |
[ 0.5% - 1.0% ] 0.77% | 128,411 | 53.4% |
[ 0.5% - 1.0% ] 0.81% | 111,770 | 62.5% |
[ 0.5% - 1.0% ] 0.85% | 52,356 | 51.0% |
[ 0.5% - 1.0% ] 0.87% | 134,170 | 66.7% |
[ 0.5% - 1.0% ] 0.92% | 60,683 | 63.5% |
[ 0.5% - 1.0% ] 0.96% | 47,978 | 59.3% |
[ 1.0% - 1.5% ] 1.00% | 40,751 | 48.2% |
[ 1.0% - 1.5% ] 1.05% | 50,692 | 49.0% |
[ 1.0% - 1.5% ] 1.11% | 74,275 | 50.1% |
[ 1.0% - 1.5% ] 1.13% | 13,425 | 52.5% |
[ 1.0% - 1.5% ] 1.27% | 48,563 | 41.5% |
[ 1.0% - 1.5% ] 1.29% | 17,875 | 50.6% |
[ 1.0% - 1.5% ] 1.33% | 4,950 | 73.5% |
[ 1.0% - 1.5% ] 1.38% | 13,982 | 77.5% |
[ 1.0% - 1.5% ] 1.42% | 9,835 | 83.1% |
[ 1.0% - 1.5% ] 1.44% | 38,295 | 69.9% |
[ 1.0% - 1.5% ] 1.47% | 9,527 | 83.0% |
[ 1.5% - 2.0% ] 1.55% | 26,253 | 76.1% |
[ 1.5% - 2.0% ] 1.65% | 15,244 | 77.7% |
[ 1.5% - 2.0% ] 1.68% | 9,024 | 56.9% |
[ 1.5% - 2.0% ] 1.77% | 7,515 | 66.7% |
[ 1.5% - 2.0% ] 1.85% | 11,455 | 65.8% |
[ 2.0% - 2.5% ] 2.01% | 19,369 | 61.9% |
[ 2.0% - 2.5% ] 2.06% | 43,797 | 64.9% |
[ 2.0% - 2.5% ] 2.13% | 7,168 | 69.5% |
[ 2.5% - 3.0% ] 2.50% | 9,037 | 77.9% |
[ 2.5% - 3.0% ] 2.89% | 14,901 | 46.9% |
[ 2.5% - 3.0% ] 3.00% | 31,018 | 25.9% |
[ 3.0% - 3.5% ] 3.03% | 9,183 | 40.4% |
[ 3.0% - 3.5% ] 3.06% | 52,373 | 46.9% |
[ 3.5% - 4.0% ] 3.64% | 4,226 | 47.2% |
[ 3.5% - 4.0% ] 3.72% | 4,996 | 70.2% |
[ 4.0% - 4.5% ] 4.33% | 19,465 | 60.3% |
[ 4.5% - 5.0% ] 4.65% | 5,976 | 46.6% |
[ 5.5% - 6.0% ] 5.54% | 18,104 | 46.1% |
[ 5.5% - 6.0% ] 5.81% | 3,287 | 56.6% |
[ 6.0% - 6.5% ] 6.02% | 2,026 | 41.7% |
[ 7.5% - 8.0% ] 7.52% | 1,623 | 56.0% |