Sierra Leonean 4 or more Vehicles in Household

COMPARE

Sierra Leonean
Race
Ancestry
AfghanAfricanAlaska NativeAlaskan AthabascanAlbanianAleutAlsatianAmericanApacheArabArapahoArgentineanArmenianAssyrian/Chaldean/SyriacAustralianAustrianBahamianBangladeshiBarbadianBasqueBelgianBelizeanBermudanBhutaneseBlackfeetBolivianBrazilianBritishBritish West IndianBulgarianBurmeseCajunCambodianCanadianCape VerdeanCarpatho RusynCelticCentral AmericanCentral American IndianCherokeeCheyenneChickasawChileanChineseChippewaChoctawColombianColvilleComancheCosta RicanCreeCreekCroatianCrowCubanCypriotCzechCzechoslovakianDanishDelawareDominicanDutchDutch West IndianEastern EuropeanEcuadorianEgyptianEnglishEstonianEthiopianEuropeanFijianFilipinoFinnishFrenchFrench American IndianFrench CanadianGermanGerman RussianGhanaianGreekGuamanian/ChamorroGuatemalanGuyaneseHaitianHmongHonduranHopiHoumaHungarianIcelanderIndian (Asian)IndonesianInupiatIranianIraqiIrishIroquoisIsraeliItalianJamaicanJapaneseJordanianKenyanKiowaKoreanLaotianLatvianLebaneseLiberianLithuanianLumbeeLuxembourgerMacedonianMalaysianMalteseMarshalleseMenomineeMexicanMexican American IndianMongolianMoroccanNative HawaiianNavajoNepaleseNew ZealanderNicaraguanNigerianNorthern EuropeanNorwegianOkinawanOsageOttawaPaiutePakistaniPalestinianPanamanianParaguayanPennsylvania GermanPeruvianPimaPolishPortuguesePotawatomiPuebloPuerto RicanPuget Sound SalishRomanianRussianSalvadoranSamoanScandinavianScotch-IrishScottishSeminoleSenegaleseSerbianShoshoneSierra LeoneanSiouxSlavicSlovakSloveneSomaliSouth AfricanSouth AmericanSouth American IndianSoviet UnionSpaniardSpanishSpanish AmericanSpanish American IndianSri LankanSubsaharan AfricanSudaneseSwedishSwissSyrianTaiwaneseThaiTlingit-HaidaTohono O'OdhamTonganTrinidadian and TobagonianTsimshianTurkishU.S. Virgin IslanderUgandanUkrainianUruguayanUteVenezuelanVietnameseWelshWest IndianYakamaYaquiYugoslavianYumanYup'ikZimbabwean
Immigration
NonimmigrantsImmigrantsAfghanistanAfricaAlbaniaArgentinaArmeniaAsiaAustraliaAustriaBahamasBangladeshBarbadosBelarusBelgiumBelizeBoliviaBosnia and HerzegovinaBrazilBulgariaBurma/MyanmarCabo VerdeCambodiaCameroonCanadaCaribbeanCentral AmericaChileChinaColombiaCongoCosta RicaCroatiaCubaCzechoslovakiaDenmarkDominicaDominican RepublicEastern AfricaEastern AsiaEastern EuropeEcuadorEgyptEl SalvadorEnglandEritreaEthiopiaEuropeFijiFranceGermanyGhanaGreeceGrenadaGuatemalaGuyanaHaitiHondurasHong KongHungaryIndiaIndonesiaIranIraqIrelandIsraelItalyJamaicaJapanJordanKazakhstanKenyaKoreaKuwaitLaosLatin AmericaLatviaLebanonLiberiaLithuaniaMalaysiaMexicoMicronesiaMiddle AfricaMoldovaMoroccoNepalNetherlandsNicaraguaNigeriaNorth AmericaNorth MacedoniaNorthern AfricaNorthern EuropeNorwayOceaniaPakistanPanamaPeruPhilippinesPolandPortugalRomaniaRussiaSaudi ArabiaScotlandSenegalSerbiaSierra LeoneSingaporeSomaliaSouth AfricaSouth AmericaSouth Central AsiaSouth Eastern AsiaSouthern EuropeSpainSri LankaSt. Vincent and the GrenadinesSudanSwedenSwitzerlandSyriaTaiwanThailandTrinidad and TobagoTurkeyUgandaUkraineUruguayUzbekistanVenezuelaVietnamWest IndiesWestern AfricaWestern AsiaWestern EuropeYemenZaireZimbabweAzores
Select to Compare
Race
Ancestry
AfghanAfricanAlaska NativeAlaskan AthabascanAlbanianAleutAlsatianAmericanApacheArabArapahoArgentineanArmenianAssyrian/Chaldean/SyriacAustralianAustrianBahamianBangladeshiBarbadianBasqueBelgianBelizeanBermudanBhutaneseBlackfeetBolivianBrazilianBritishBritish West IndianBulgarianBurmeseCajunCambodianCanadianCape VerdeanCarpatho RusynCelticCentral AmericanCentral American IndianCherokeeCheyenneChickasawChileanChineseChippewaChoctawColombianColvilleComancheCosta RicanCreeCreekCroatianCrowCubanCypriotCzechCzechoslovakianDanishDelawareDominicanDutchDutch West IndianEastern EuropeanEcuadorianEgyptianEnglishEstonianEthiopianEuropeanFijianFilipinoFinnishFrenchFrench American IndianFrench CanadianGermanGerman RussianGhanaianGreekGuamanian/ChamorroGuatemalanGuyaneseHaitianHmongHonduranHopiHoumaHungarianIcelanderIndian (Asian)IndonesianInupiatIranianIraqiIrishIroquoisIsraeliItalianJamaicanJapaneseJordanianKenyanKiowaKoreanLaotianLatvianLebaneseLiberianLithuanianLumbeeLuxembourgerMacedonianMalaysianMalteseMarshalleseMenomineeMexicanMexican American IndianMongolianMoroccanNative HawaiianNavajoNepaleseNew ZealanderNicaraguanNigerianNorthern EuropeanNorwegianOkinawanOsageOttawaPaiutePakistaniPalestinianPanamanianParaguayanPennsylvania GermanPeruvianPimaPolishPortuguesePotawatomiPuebloPuerto RicanPuget Sound SalishRomanianRussianSalvadoranSamoanScandinavianScotch-IrishScottishSeminoleSenegaleseSerbianShoshoneSiouxSlavicSlovakSloveneSomaliSouth AfricanSouth AmericanSouth American IndianSoviet UnionSpaniardSpanishSpanish AmericanSpanish American IndianSri LankanSubsaharan AfricanSudaneseSwedishSwissSyrianTaiwaneseThaiTlingit-HaidaTohono O'OdhamTonganTrinidadian and TobagonianTsimshianTurkishU.S. Virgin IslanderUgandanUkrainianUruguayanUteVenezuelanVietnameseWelshWest IndianYakamaYaquiYugoslavianYumanYup'ikZimbabwean
Immigration
NonimmigrantsImmigrantsAfghanistanAfricaAlbaniaArgentinaArmeniaAsiaAustraliaAustriaBahamasBangladeshBarbadosBelarusBelgiumBelizeBoliviaBosnia and HerzegovinaBrazilBulgariaBurma/MyanmarCabo VerdeCambodiaCameroonCanadaCaribbeanCentral AmericaChileChinaColombiaCongoCosta RicaCroatiaCubaCzechoslovakiaDenmarkDominicaDominican RepublicEastern AfricaEastern AsiaEastern EuropeEcuadorEgyptEl SalvadorEnglandEritreaEthiopiaEuropeFijiFranceGermanyGhanaGreeceGrenadaGuatemalaGuyanaHaitiHondurasHong KongHungaryIndiaIndonesiaIranIraqIrelandIsraelItalyJamaicaJapanJordanKazakhstanKenyaKoreaKuwaitLaosLatin AmericaLatviaLebanonLiberiaLithuaniaMalaysiaMexicoMicronesiaMiddle AfricaMoldovaMoroccoNepalNetherlandsNicaraguaNigeriaNorth AmericaNorth MacedoniaNorthern AfricaNorthern EuropeNorwayOceaniaPakistanPanamaPeruPhilippinesPolandPortugalRomaniaRussiaSaudi ArabiaScotlandSenegalSerbiaSierra LeoneSingaporeSomaliaSouth AfricaSouth AmericaSouth Central AsiaSouth Eastern AsiaSouthern EuropeSpainSri LankaSt. Vincent and the GrenadinesSudanSwedenSwitzerlandSyriaTaiwanThailandTrinidad and TobagoTurkeyUgandaUkraineUruguayUzbekistanVenezuelaVietnamWest IndiesWestern AfricaWestern AsiaWestern EuropeYemenZaireZimbabweAzores
4 or more Vehicles in Household
Income
Poverty
Unemployment
Labor Participation
Family Structure
Vehicle Availability
Education Level
Disability

Sierra Leonean 4 or more Vehicles in Household
Tragic

5.9%
4+ VEHICLES AVAILABLE
6.0/ 100
METRIC RATING
233rd/ 347
METRIC RANK

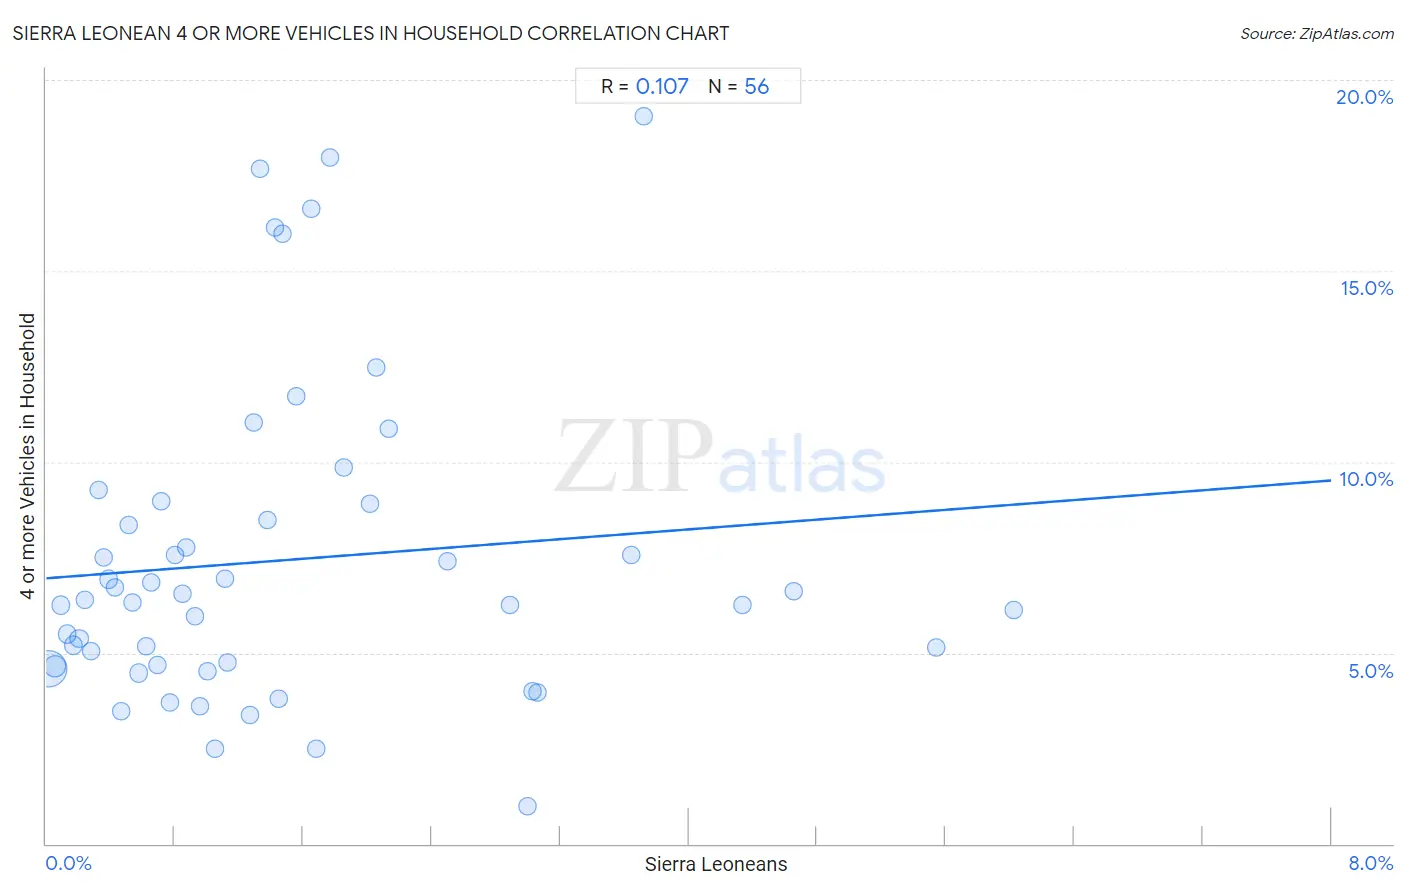
Sierra Leonean 4 or more Vehicles in Household Correlation Chart

The statistical analysis conducted on geographies consisting of 83,069,082 people shows a poor positive correlation between the proportion of Sierra Leoneans and percentage of households with 4 or more vehicles available in the United States with a correlation coefficient (R) of 0.107 and weighted average of 5.9%. On average, for every 1% (one percent) increase in Sierra Leoneans within a typical geography, there is an increase of 0.32% in percentage of households with 4 or more vehicles available.
Sierra Leonean 4 or more Vehicles in Household
It is essential to understand that the correlation between the percentage of Sierra Leoneans and percentage of households with 4 or more vehicles available does not imply a direct cause-and-effect relationship. It remains uncertain whether the presence of Sierra Leoneans influences an upward or downward trend in the level of percentage of households with 4 or more vehicles available within an area, or if Sierra Leoneans simply ended up residing in those areas with higher or lower levels of percentage of households with 4 or more vehicles available due to other factors.

Demographics Similar to Sierra Leoneans by 4 or more Vehicles in Household

In terms of 4 or more vehicles in household, the demographic groups most similar to Sierra Leoneans are Immigrants from Argentina (5.9%, a difference of 0.010%), Immigrants from Switzerland (5.9%, a difference of 0.20%), Immigrants from Malaysia (5.9%, a difference of 0.31%), Eastern European (5.9%, a difference of 0.38%), and Immigrants from Uganda (5.9%, a difference of 0.66%).
DemographicsRating | Rank4 or more Vehicles in Household
Immigrants from Singapore
7.9
/100
|
#226
Tragic
5.9%
Immigrants from Western Asia
7.8
/100
|
#227
Tragic
5.9%
Immigrants from Uganda
7.5
/100
|
#228
Tragic
5.9%
Eastern Europeans
6.8
/100
|
#229
Tragic
5.9%
Immigrants from Malaysia
6.7
/100
|
#230
Tragic
5.9%
Immigrants from Switzerland
6.4
/100
|
#231
Tragic
5.9%
Immigrants from Argentina
6.0
/100
|
#232
Tragic
5.9%
Sierra Leoneans
6.0
/100
|
#233
Tragic
5.9%
Africans
4.6
/100
|
#234
Tragic
5.8%
Immigrants from Hungary
4.6
/100
|
#235
Tragic
5.8%
Immigrants from Eritrea
4.5
/100
|
#236
Tragic
5.8%
Turks
4.1
/100
|
#237
Tragic
5.8%
Immigrants from Belgium
4.0
/100
|
#238
Tragic
5.8%
Immigrants from Australia
3.8
/100
|
#239
Tragic
5.8%
Immigrants from Poland
3.8
/100
|
#240
Tragic
5.8%

Sierra Leonean 4 or more Vehicles in Household Correlation Summary

MeasurementSierra Leonean Data4 or more Vehicles in Household Data
Minimum0.013%0.97%
Maximum6.0%19.1%
Range6.0%18.1%
Mean1.5%7.4%
Median1.1%6.4%
Interquartile 25% (IQ1)0.53%4.7%
Interquartile 75% (IQ3)1.9%8.7%
Interquartile Range (IQR)1.4%4.0%
Standard Deviation (Sample)1.4%4.1%
Standard Deviation (Population)1.4%4.1%

Correlation Details

Sierra Leonean PercentileSample Size4 or more Vehicles in Household
[
0.0%
-
0.5%
]
0.013%
57,419,3174.6%
[
0.0%
-
0.5%
]
0.055%
11,145,1194.6%
[
0.0%
-
0.5%
]
0.091%
2,773,4116.2%
[
0.0%
-
0.5%
]
0.13%
1,824,1395.5%
[
0.0%
-
0.5%
]
0.17%
2,272,8565.2%
[
0.0%
-
0.5%
]
0.21%
1,138,0775.4%
[
0.0%
-
0.5%
]
0.24%
1,071,2256.4%
[
0.0%
-
0.5%
]
0.28%
753,2165.0%
[
0.0%
-
0.5%
]
0.32%
472,0679.3%
[
0.0%
-
0.5%
]
0.36%
470,5947.5%
[
0.0%
-
0.5%
]
0.39%
514,6416.9%
[
0.0%
-
0.5%
]
0.43%
464,1146.7%
[
0.0%
-
0.5%
]
0.47%
236,9203.5%
[
0.5%
-
1.0%
]
0.51%
206,8708.4%
[
0.5%
-
1.0%
]
0.54%
156,1296.3%
[
0.5%
-
1.0%
]
0.57%
408,8174.5%
[
0.5%
-
1.0%
]
0.63%
117,9105.2%
[
0.5%
-
1.0%
]
0.66%
234,2276.9%
[
0.5%
-
1.0%
]
0.69%
144,3204.7%
[
0.5%
-
1.0%
]
0.72%
76,4459.0%
[
0.5%
-
1.0%
]
0.77%
128,4113.7%
[
0.5%
-
1.0%
]
0.81%
111,7707.5%
[
0.5%
-
1.0%
]
0.85%
52,3566.5%
[
0.5%
-
1.0%
]
0.87%
134,1707.8%
[
0.5%
-
1.0%
]
0.92%
60,6835.9%
[
0.5%
-
1.0%
]
0.96%
47,9783.6%
[
1.0%
-
1.5%
]
1.00%
40,7514.5%
[
1.0%
-
1.5%
]
1.05%
50,6922.5%
[
1.0%
-
1.5%
]
1.11%
74,2756.9%
[
1.0%
-
1.5%
]
1.13%
13,4254.8%
[
1.0%
-
1.5%
]
1.27%
48,5633.4%
[
1.0%
-
1.5%
]
1.29%
17,87511.0%
[
1.0%
-
1.5%
]
1.33%
4,95017.7%
[
1.0%
-
1.5%
]
1.38%
13,9828.5%
[
1.0%
-
1.5%
]
1.42%
9,83516.1%
[
1.0%
-
1.5%
]
1.44%
38,2953.8%
[
1.0%
-
1.5%
]
1.47%
9,52716.0%
[
1.5%
-
2.0%
]
1.55%
26,25311.7%
[
1.5%
-
2.0%
]
1.65%
15,24416.6%
[
1.5%
-
2.0%
]
1.68%
9,0242.5%
[
1.5%
-
2.0%
]
1.77%
7,51518.0%
[
1.5%
-
2.0%
]
1.85%
11,4559.9%
[
2.0%
-
2.5%
]
2.01%
19,3698.9%
[
2.0%
-
2.5%
]
2.06%
43,79712.5%
[
2.0%
-
2.5%
]
2.13%
7,16810.9%
[
2.5%
-
3.0%
]
2.50%
9,0377.4%
[
2.5%
-
3.0%
]
2.89%
14,9016.3%
[
2.5%
-
3.0%
]
3.00%
31,0180.97%
[
3.0%
-
3.5%
]
3.03%
9,1834.0%
[
3.0%
-
3.5%
]
3.06%
52,3734.0%
[
3.5%
-
4.0%
]
3.64%
4,2267.6%
[
3.5%
-
4.0%
]
3.72%
4,99619.1%
[
4.0%
-
4.5%
]
4.33%
19,4656.2%
[
4.5%
-
5.0%
]
4.65%
5,9766.6%
[
5.5%
-
6.0%
]
5.54%
18,1045.1%
[
6.0%
-
6.5%
]
6.02%
2,0266.1%