Immigrants from Norway 3 or more Vehicles in Household
COMPARE
Immigrants from Norway
Select to Compare
3 or more Vehicles in Household
Immigrants from Norway 3 or more Vehicles in Household
19.0%
3+ VEHICLES AVAILABLE
19.0/ 100
METRIC RATING
199th/ 347
METRIC RANK
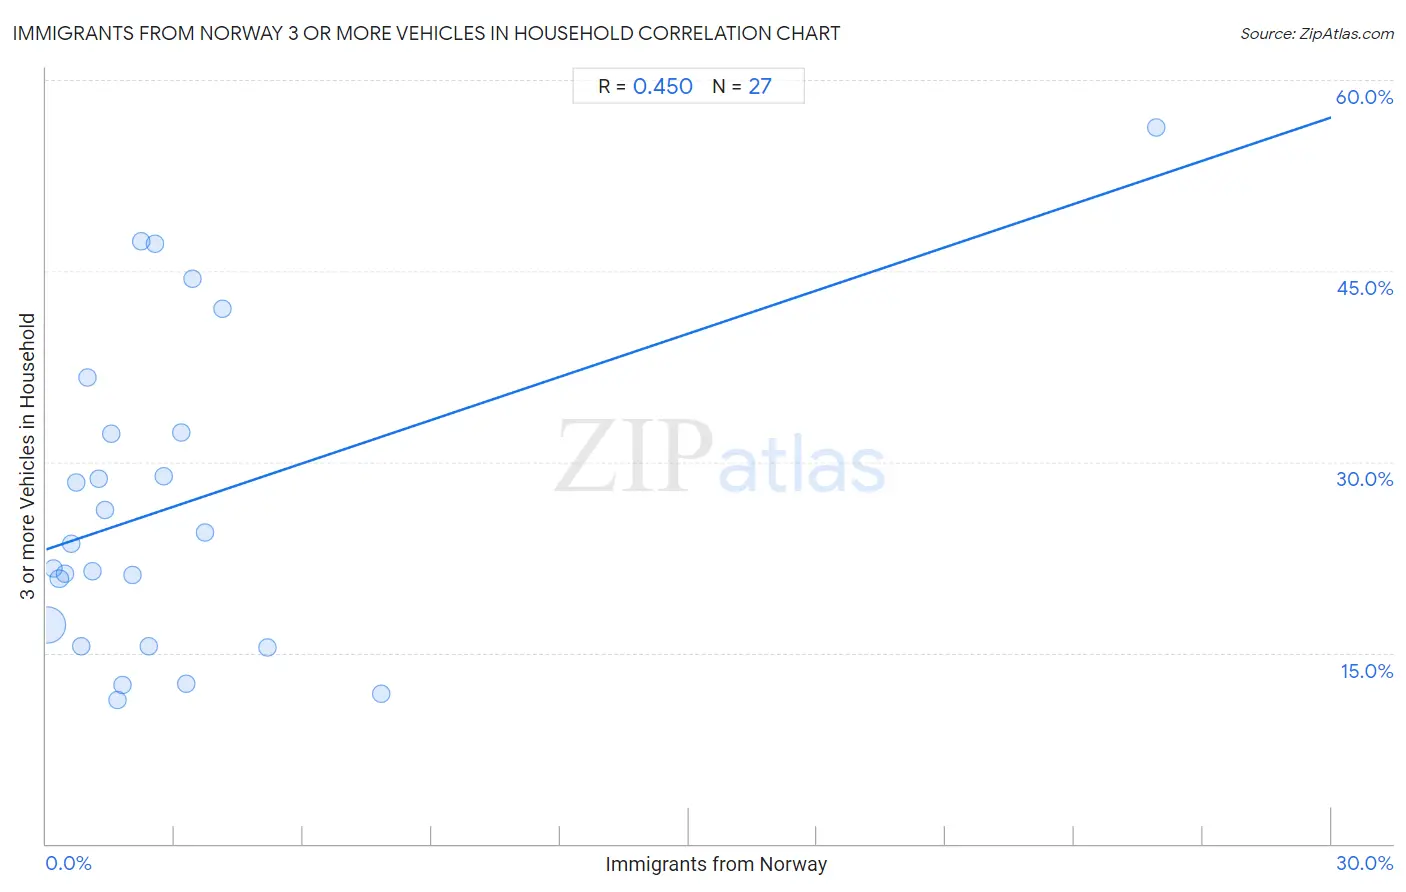
Immigrants from Norway 3 or more Vehicles in Household Correlation Chart
The statistical analysis conducted on geographies consisting of 116,675,464 people shows a moderate positive correlation between the proportion of Immigrants from Norway and percentage of households with 3 or more vehicles available in the United States with a correlation coefficient (R) of 0.450 and weighted average of 19.0%. On average, for every 1% (one percent) increase in Immigrants from Norway within a typical geography, there is an increase of 1.1% in percentage of households with 3 or more vehicles available.
It is essential to understand that the correlation between the percentage of Immigrants from Norway and percentage of households with 3 or more vehicles available does not imply a direct cause-and-effect relationship. It remains uncertain whether the presence of Immigrants from Norway influences an upward or downward trend in the level of percentage of households with 3 or more vehicles available within an area, or if Immigrants from Norway simply ended up residing in those areas with higher or lower levels of percentage of households with 3 or more vehicles available due to other factors.
Demographics Similar to Immigrants from Norway by 3 or more Vehicles in Household
In terms of 3 or more vehicles in household, the demographic groups most similar to Immigrants from Norway are Egyptian (19.0%, a difference of 0.060%), Argentinean (18.9%, a difference of 0.10%), Arab (18.9%, a difference of 0.16%), Immigrants from Japan (19.0%, a difference of 0.36%), and Central American Indian (19.0%, a difference of 0.39%).
| Demographics | Rating | Rank | 3 or more Vehicles in Household |
| Kenyans | 24.7 /100 | #192 | Fair 19.1% |
| Tsimshian | 24.4 /100 | #193 | Fair 19.1% |
| Serbians | 24.0 /100 | #194 | Fair 19.1% |
| Immigrants from Moldova | 23.6 /100 | #195 | Fair 19.1% |
| Central American Indians | 22.2 /100 | #196 | Fair 19.0% |
| Immigrants from Japan | 22.0 /100 | #197 | Fair 19.0% |
| Egyptians | 19.5 /100 | #198 | Poor 19.0% |
| Immigrants from Norway | 19.0 /100 | #199 | Poor 19.0% |
| Argentineans | 18.2 /100 | #200 | Poor 18.9% |
| Arabs | 17.7 /100 | #201 | Poor 18.9% |
| Immigrants from Austria | 15.4 /100 | #202 | Poor 18.9% |
| Tohono O'odham | 14.8 /100 | #203 | Poor 18.9% |
| Immigrants from Romania | 14.6 /100 | #204 | Poor 18.9% |
| Russians | 14.2 /100 | #205 | Poor 18.8% |
| Immigrants from Eastern Asia | 14.1 /100 | #206 | Poor 18.8% |
Immigrants from Norway 3 or more Vehicles in Household Correlation Summary
| Measurement | Immigrants from Norway Data | 3 or more Vehicles in Household Data |
| Minimum | 0.022% | 11.3% |
| Maximum | 25.9% | 56.2% |
| Range | 25.9% | 45.0% |
| Mean | 3.0% | 26.5% |
| Median | 1.8% | 23.6% |
| Interquartile 25% (IQ1) | 0.82% | 15.5% |
| Interquartile 75% (IQ3) | 3.3% | 32.3% |
| Interquartile Range (IQR) | 2.5% | 16.8% |
| Standard Deviation (Sample) | 4.9% | 12.3% |
| Standard Deviation (Population) | 4.8% | 12.1% |
Correlation Details
| Immigrants from Norway Percentile | Sample Size | 3 or more Vehicles in Household |
[ 0.0% - 0.5% ] 0.022% | 111,708,289 | 17.2% |
[ 0.0% - 0.5% ] 0.18% | 3,439,897 | 21.6% |
[ 0.0% - 0.5% ] 0.30% | 783,191 | 20.8% |
[ 0.0% - 0.5% ] 0.42% | 309,861 | 21.2% |
[ 0.5% - 1.0% ] 0.58% | 177,516 | 23.6% |
[ 0.5% - 1.0% ] 0.70% | 88,662 | 28.3% |
[ 0.5% - 1.0% ] 0.82% | 77,828 | 15.5% |
[ 0.5% - 1.0% ] 0.98% | 9,635 | 36.7% |
[ 1.0% - 1.5% ] 1.08% | 9,218 | 21.4% |
[ 1.0% - 1.5% ] 1.21% | 9,232 | 28.6% |
[ 1.0% - 1.5% ] 1.37% | 3,872 | 26.2% |
[ 1.5% - 2.0% ] 1.53% | 18,517 | 32.2% |
[ 1.5% - 2.0% ] 1.65% | 9,211 | 11.3% |
[ 1.5% - 2.0% ] 1.79% | 7,001 | 12.5% |
[ 2.0% - 2.5% ] 2.01% | 1,638 | 21.1% |
[ 2.0% - 2.5% ] 2.22% | 3,114 | 47.3% |
[ 2.0% - 2.5% ] 2.40% | 3,956 | 15.5% |
[ 2.5% - 3.0% ] 2.53% | 553 | 47.2% |
[ 2.5% - 3.0% ] 2.75% | 473 | 28.8% |
[ 3.0% - 3.5% ] 3.14% | 159 | 32.3% |
[ 3.0% - 3.5% ] 3.27% | 1,897 | 12.6% |
[ 3.0% - 3.5% ] 3.42% | 3,246 | 44.4% |
[ 3.5% - 4.0% ] 3.72% | 1,102 | 24.4% |
[ 4.0% - 4.5% ] 4.12% | 2,692 | 42.0% |
[ 5.0% - 5.5% ] 5.17% | 4,586 | 15.4% |
[ 7.5% - 8.0% ] 7.81% | 64 | 11.8% |
[ 25.5% - 26.0% ] 25.93% | 54 | 56.2% |