Immigrants from Norway Wage/Income Gap

COMPARE

Immigrants from Norway
Race
Ancestry
AfghanAfricanAlaska NativeAlaskan AthabascanAlbanianAleutAlsatianAmericanApacheArabArapahoArgentineanArmenianAssyrian/Chaldean/SyriacAustralianAustrianBahamianBangladeshiBarbadianBasqueBelgianBelizeanBermudanBhutaneseBlackfeetBolivianBrazilianBritishBritish West IndianBulgarianBurmeseCajunCambodianCanadianCape VerdeanCarpatho RusynCelticCentral AmericanCentral American IndianCherokeeCheyenneChickasawChileanChineseChippewaChoctawColombianColvilleComancheCosta RicanCreeCreekCroatianCrowCubanCypriotCzechCzechoslovakianDanishDelawareDominicanDutchDutch West IndianEastern EuropeanEcuadorianEgyptianEnglishEstonianEthiopianEuropeanFijianFilipinoFinnishFrenchFrench American IndianFrench CanadianGermanGerman RussianGhanaianGreekGuamanian/ChamorroGuatemalanGuyaneseHaitianHmongHonduranHopiHoumaHungarianIcelanderIndian (Asian)IndonesianInupiatIranianIraqiIrishIroquoisIsraeliItalianJamaicanJapaneseJordanianKenyanKiowaKoreanLaotianLatvianLebaneseLiberianLithuanianLumbeeLuxembourgerMacedonianMalaysianMalteseMarshalleseMenomineeMexicanMexican American IndianMongolianMoroccanNative HawaiianNavajoNepaleseNew ZealanderNicaraguanNigerianNorthern EuropeanNorwegianOkinawanOsageOttawaPaiutePakistaniPalestinianPanamanianParaguayanPennsylvania GermanPeruvianPimaPolishPortuguesePotawatomiPuebloPuerto RicanPuget Sound SalishRomanianRussianSalvadoranSamoanScandinavianScotch-IrishScottishSeminoleSenegaleseSerbianShoshoneSierra LeoneanSiouxSlavicSlovakSloveneSomaliSouth AfricanSouth AmericanSouth American IndianSoviet UnionSpaniardSpanishSpanish AmericanSpanish American IndianSri LankanSubsaharan AfricanSudaneseSwedishSwissSyrianTaiwaneseThaiTlingit-HaidaTohono O'OdhamTonganTrinidadian and TobagonianTsimshianTurkishU.S. Virgin IslanderUgandanUkrainianUruguayanUteVenezuelanVietnameseWelshWest IndianYakamaYaquiYugoslavianYumanYup'ikZimbabwean
Immigration
NonimmigrantsImmigrantsAfghanistanAfricaAlbaniaArgentinaArmeniaAsiaAustraliaAustriaBahamasBangladeshBarbadosBelarusBelgiumBelizeBoliviaBosnia and HerzegovinaBrazilBulgariaBurma/MyanmarCabo VerdeCambodiaCameroonCanadaCaribbeanCentral AmericaChileChinaColombiaCongoCosta RicaCroatiaCubaCzechoslovakiaDenmarkDominicaDominican RepublicEastern AfricaEastern AsiaEastern EuropeEcuadorEgyptEl SalvadorEnglandEritreaEthiopiaEuropeFijiFranceGermanyGhanaGreeceGrenadaGuatemalaGuyanaHaitiHondurasHong KongHungaryIndiaIndonesiaIranIraqIrelandIsraelItalyJamaicaJapanJordanKazakhstanKenyaKoreaKuwaitLaosLatin AmericaLatviaLebanonLiberiaLithuaniaMalaysiaMexicoMicronesiaMiddle AfricaMoldovaMoroccoNepalNetherlandsNicaraguaNigeriaNorth AmericaNorth MacedoniaNorthern AfricaNorthern EuropeNorwayOceaniaPakistanPanamaPeruPhilippinesPolandPortugalRomaniaRussiaSaudi ArabiaScotlandSenegalSerbiaSierra LeoneSingaporeSomaliaSouth AfricaSouth AmericaSouth Central AsiaSouth Eastern AsiaSouthern EuropeSpainSri LankaSt. Vincent and the GrenadinesSudanSwedenSwitzerlandSyriaTaiwanThailandTrinidad and TobagoTurkeyUgandaUkraineUruguayUzbekistanVenezuelaVietnamWest IndiesWestern AfricaWestern AsiaWestern EuropeYemenZaireZimbabweAzores
Select to Compare
Race
Ancestry
AfghanAfricanAlaska NativeAlaskan AthabascanAlbanianAleutAlsatianAmericanApacheArabArapahoArgentineanArmenianAssyrian/Chaldean/SyriacAustralianAustrianBahamianBangladeshiBarbadianBasqueBelgianBelizeanBermudanBhutaneseBlackfeetBolivianBrazilianBritishBritish West IndianBulgarianBurmeseCajunCambodianCanadianCape VerdeanCarpatho RusynCelticCentral AmericanCentral American IndianCherokeeCheyenneChickasawChileanChineseChippewaChoctawColombianColvilleComancheCosta RicanCreeCreekCroatianCrowCubanCypriotCzechCzechoslovakianDanishDelawareDominicanDutchDutch West IndianEastern EuropeanEcuadorianEgyptianEnglishEstonianEthiopianEuropeanFijianFilipinoFinnishFrenchFrench American IndianFrench CanadianGermanGerman RussianGhanaianGreekGuamanian/ChamorroGuatemalanGuyaneseHaitianHmongHonduranHopiHoumaHungarianIcelanderIndian (Asian)IndonesianInupiatIranianIraqiIrishIroquoisIsraeliItalianJamaicanJapaneseJordanianKenyanKiowaKoreanLaotianLatvianLebaneseLiberianLithuanianLumbeeLuxembourgerMacedonianMalaysianMalteseMarshalleseMenomineeMexicanMexican American IndianMongolianMoroccanNative HawaiianNavajoNepaleseNew ZealanderNicaraguanNigerianNorthern EuropeanNorwegianOkinawanOsageOttawaPaiutePakistaniPalestinianPanamanianParaguayanPennsylvania GermanPeruvianPimaPolishPortuguesePotawatomiPuebloPuerto RicanPuget Sound SalishRomanianRussianSalvadoranSamoanScandinavianScotch-IrishScottishSeminoleSenegaleseSerbianShoshoneSierra LeoneanSiouxSlavicSlovakSloveneSomaliSouth AfricanSouth AmericanSouth American IndianSoviet UnionSpaniardSpanishSpanish AmericanSpanish American IndianSri LankanSubsaharan AfricanSudaneseSwedishSwissSyrianTaiwaneseThaiTlingit-HaidaTohono O'OdhamTonganTrinidadian and TobagonianTsimshianTurkishU.S. Virgin IslanderUgandanUkrainianUruguayanUteVenezuelanVietnameseWelshWest IndianYakamaYaquiYugoslavianYumanYup'ikZimbabwean
Immigration
NonimmigrantsImmigrantsAfghanistanAfricaAlbaniaArgentinaArmeniaAsiaAustraliaAustriaBahamasBangladeshBarbadosBelarusBelgiumBelizeBoliviaBosnia and HerzegovinaBrazilBulgariaBurma/MyanmarCabo VerdeCambodiaCameroonCanadaCaribbeanCentral AmericaChileChinaColombiaCongoCosta RicaCroatiaCubaCzechoslovakiaDenmarkDominicaDominican RepublicEastern AfricaEastern AsiaEastern EuropeEcuadorEgyptEl SalvadorEnglandEritreaEthiopiaEuropeFijiFranceGermanyGhanaGreeceGrenadaGuatemalaGuyanaHaitiHondurasHong KongHungaryIndiaIndonesiaIranIraqIrelandIsraelItalyJamaicaJapanJordanKazakhstanKenyaKoreaKuwaitLaosLatin AmericaLatviaLebanonLiberiaLithuaniaMalaysiaMexicoMicronesiaMiddle AfricaMoldovaMoroccoNepalNetherlandsNicaraguaNigeriaNorth AmericaNorth MacedoniaNorthern AfricaNorthern EuropeOceaniaPakistanPanamaPeruPhilippinesPolandPortugalRomaniaRussiaSaudi ArabiaScotlandSenegalSerbiaSierra LeoneSingaporeSomaliaSouth AfricaSouth AmericaSouth Central AsiaSouth Eastern AsiaSouthern EuropeSpainSri LankaSt. Vincent and the GrenadinesSudanSwedenSwitzerlandSyriaTaiwanThailandTrinidad and TobagoTurkeyUgandaUkraineUruguayUzbekistanVenezuelaVietnamWest IndiesWestern AfricaWestern AsiaWestern EuropeYemenZaireZimbabweAzores
Wage/Income Gap
Income
Poverty
Unemployment
Labor Participation
Family Structure
Vehicle Availability
Education Level
Disability

Immigrants from Norway Wage/Income Gap
Tragic

27.3%
WAGE/INCOME GAP
2.5/ 100
METRIC RATING
251st/ 347
METRIC RANK

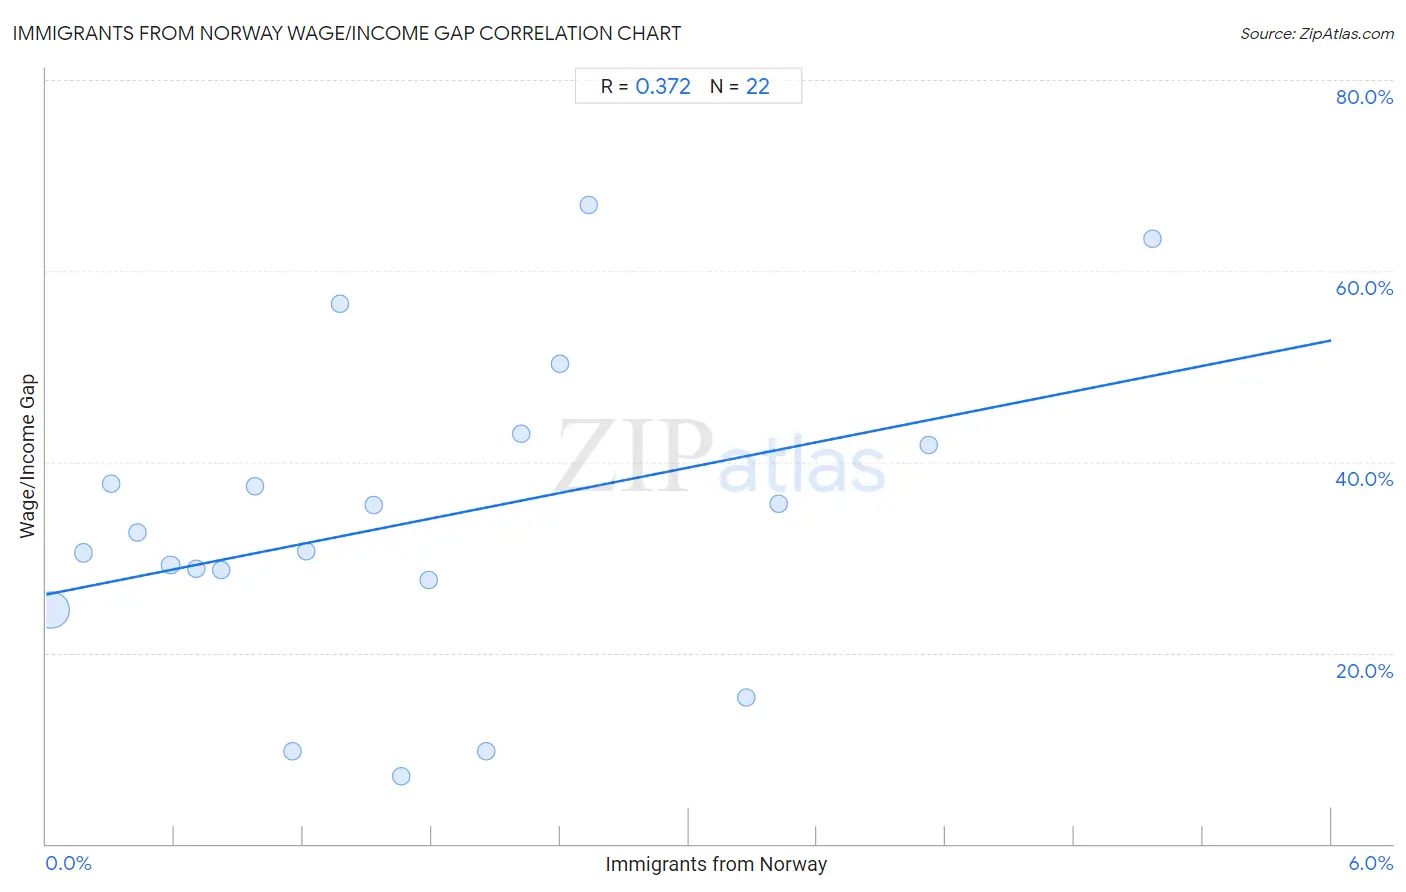
Immigrants from Norway Wage/Income Gap Correlation Chart

The statistical analysis conducted on geographies consisting of 116,688,062 people shows a mild positive correlation between the proportion of Immigrants from Norway and wage/income gap percentage in the United States with a correlation coefficient (R) of 0.372 and weighted average of 27.3%. On average, for every 1% (one percent) increase in Immigrants from Norway within a typical geography, there is an increase of 4.4% in wage/income gap percentage.
Immigrants from Norway Wage/Income Gap
It is essential to understand that the correlation between the percentage of Immigrants from Norway and wage/income gap percentage does not imply a direct cause-and-effect relationship. It remains uncertain whether the presence of Immigrants from Norway influences an upward or downward trend in the level of wage/income gap percentage within an area, or if Immigrants from Norway simply ended up residing in those areas with higher or lower levels of wage/income gap percentage due to other factors.

Demographics Similar to Immigrants from Norway by Wage/Income Gap

In terms of wage/income gap, the demographic groups most similar to Immigrants from Norway are Ukrainian (27.3%, a difference of 0.060%), Immigrants from Czechoslovakia (27.3%, a difference of 0.10%), Carpatho Rusyn (27.3%, a difference of 0.12%), Cypriot (27.3%, a difference of 0.13%), and Celtic (27.3%, a difference of 0.14%).
DemographicsRating | RankWage/Income Gap
Chickasaw
3.5
/100
|
#244
Tragic
27.2%
Immigrants from the Azores
3.5
/100
|
#245
Tragic
27.2%
Nonimmigrants
3.3
/100
|
#246
Tragic
27.2%
Celtics
2.8
/100
|
#247
Tragic
27.3%
Cypriots
2.8
/100
|
#248
Tragic
27.3%
Carpatho Rusyns
2.7
/100
|
#249
Tragic
27.3%
Immigrants from Czechoslovakia
2.7
/100
|
#250
Tragic
27.3%
Immigrants from Norway
2.5
/100
|
#251
Tragic
27.3%
Ukrainians
2.4
/100
|
#252
Tragic
27.3%
Portuguese
2.2
/100
|
#253
Tragic
27.4%
Israelis
2.1
/100
|
#254
Tragic
27.4%
Immigrants from France
2.1
/100
|
#255
Tragic
27.4%
Cherokee
1.9
/100
|
#256
Tragic
27.4%
Luxembourgers
1.9
/100
|
#257
Tragic
27.4%
Slavs
1.8
/100
|
#258
Tragic
27.4%

Immigrants from Norway Wage/Income Gap Correlation Summary

MeasurementImmigrants from Norway DataWage/Income Gap Data
Minimum0.022%7.1%
Maximum5.2%66.9%
Range5.1%59.8%
Mean1.7%33.7%
Median1.4%31.6%
Interquartile 25% (IQ1)0.70%27.6%
Interquartile 75% (IQ3)2.4%41.8%
Interquartile Range (IQR)1.7%14.2%
Standard Deviation (Sample)1.3%16.0%
Standard Deviation (Population)1.3%15.6%

Correlation Details

Immigrants from Norway PercentileSample SizeWage/Income Gap
[
0.0%
-
0.5%
]
0.022%
111,729,76224.5%
[
0.0%
-
0.5%
]
0.18%
3,450,61830.5%
[
0.0%
-
0.5%
]
0.30%
780,68637.7%
[
0.0%
-
0.5%
]
0.42%
310,58732.6%
[
0.5%
-
1.0%
]
0.58%
174,60929.2%
[
0.5%
-
1.0%
]
0.70%
87,71428.8%
[
0.5%
-
1.0%
]
0.82%
74,78928.6%
[
0.5%
-
1.0%
]
0.97%
8,74037.5%
[
1.0%
-
1.5%
]
1.15%
3,6619.7%
[
1.0%
-
1.5%
]
1.21%
9,23230.6%
[
1.0%
-
1.5%
]
1.37%
3,87256.6%
[
1.5%
-
2.0%
]
1.53%
17,92035.5%
[
1.5%
-
2.0%
]
1.66%
7,9517.1%
[
1.5%
-
2.0%
]
1.79%
7,00127.6%
[
2.0%
-
2.5%
]
2.05%
8769.7%
[
2.0%
-
2.5%
]
2.22%
3,11443.0%
[
2.0%
-
2.5%
]
2.40%
3,95650.2%
[
2.5%
-
3.0%
]
2.53%
55366.9%
[
3.0%
-
3.5%
]
3.27%
1,89715.3%
[
3.0%
-
3.5%
]
3.42%
3,24635.6%
[
4.0%
-
4.5%
]
4.12%
2,69241.8%
[
5.0%
-
5.5%
]
5.17%
4,58663.4%