Immigrants from Norway Disability Age 5 to 17
COMPARE
Immigrants from Norway
Select to Compare
Disability Age 5 to 17
Immigrants from Norway Disability Age 5 to 17
5.6%
DISABILITY | AGE 5 TO 17
55.7/ 100
METRIC RATING
169th/ 347
METRIC RANK
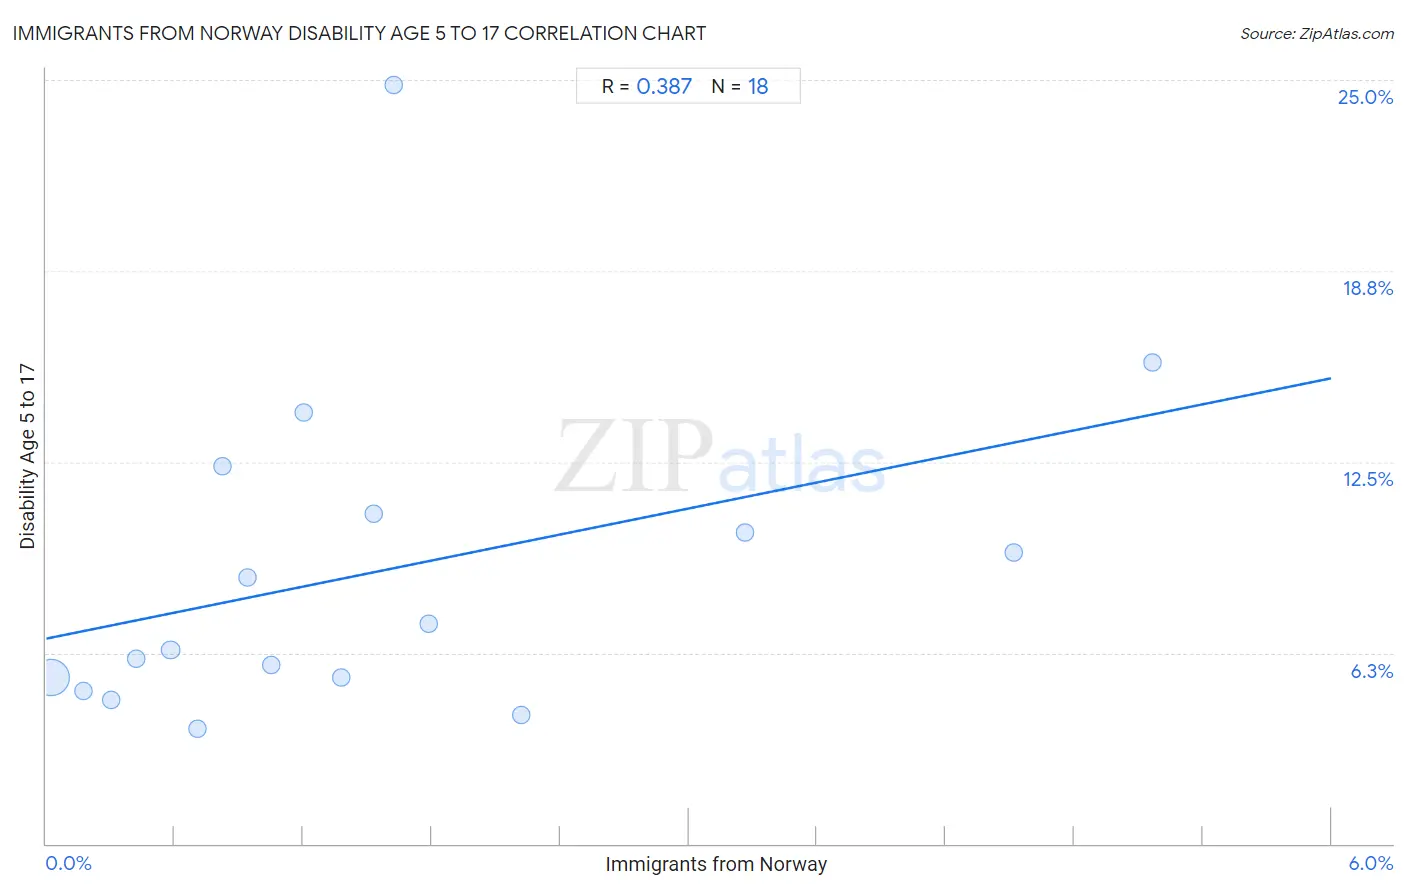
Immigrants from Norway Disability Age 5 to 17 Correlation Chart
The statistical analysis conducted on geographies consisting of 116,209,294 people shows a mild positive correlation between the proportion of Immigrants from Norway and percentage of population with a disability between the ages 5 and 17 in the United States with a correlation coefficient (R) of 0.387 and weighted average of 5.6%. On average, for every 1% (one percent) increase in Immigrants from Norway within a typical geography, there is an increase of 1.4% in percentage of population with a disability between the ages 5 and 17.
It is essential to understand that the correlation between the percentage of Immigrants from Norway and percentage of population with a disability between the ages 5 and 17 does not imply a direct cause-and-effect relationship. It remains uncertain whether the presence of Immigrants from Norway influences an upward or downward trend in the level of percentage of population with a disability between the ages 5 and 17 within an area, or if Immigrants from Norway simply ended up residing in those areas with higher or lower levels of percentage of population with a disability between the ages 5 and 17 due to other factors.
Demographics Similar to Immigrants from Norway by Disability Age 5 to 17
In terms of disability age 5 to 17, the demographic groups most similar to Immigrants from Norway are Iraqi (5.6%, a difference of 0.020%), Serbian (5.6%, a difference of 0.080%), Immigrants from Iraq (5.6%, a difference of 0.090%), Immigrants from Burma/Myanmar (5.6%, a difference of 0.18%), and Ukrainian (5.6%, a difference of 0.21%).
| Demographics | Rating | Rank | Disability Age 5 to 17 |
| Zimbabweans | 67.2 /100 | #162 | Good 5.5% |
| Immigrants from Southern Europe | 64.0 /100 | #163 | Good 5.6% |
| Immigrants from Scotland | 61.9 /100 | #164 | Good 5.6% |
| Lebanese | 61.4 /100 | #165 | Good 5.6% |
| Greeks | 60.6 /100 | #166 | Good 5.6% |
| Immigrants from Burma/Myanmar | 59.3 /100 | #167 | Average 5.6% |
| Iraqis | 56.0 /100 | #168 | Average 5.6% |
| Immigrants from Norway | 55.7 /100 | #169 | Average 5.6% |
| Serbians | 54.0 /100 | #170 | Average 5.6% |
| Immigrants from Iraq | 53.9 /100 | #171 | Average 5.6% |
| Ukrainians | 51.5 /100 | #172 | Average 5.6% |
| Uruguayans | 51.0 /100 | #173 | Average 5.6% |
| Costa Ricans | 50.0 /100 | #174 | Average 5.6% |
| Shoshone | 49.4 /100 | #175 | Average 5.6% |
| Immigrants from Central America | 49.4 /100 | #176 | Average 5.6% |
Immigrants from Norway Disability Age 5 to 17 Correlation Summary
| Measurement | Immigrants from Norway Data | Disability Age 5 to 17 Data |
| Minimum | 0.022% | 3.8% |
| Maximum | 5.2% | 24.8% |
| Range | 5.1% | 21.1% |
| Mean | 1.5% | 8.9% |
| Median | 1.1% | 6.8% |
| Interquartile 25% (IQ1) | 0.58% | 5.4% |
| Interquartile 75% (IQ3) | 1.8% | 10.8% |
| Interquartile Range (IQR) | 1.2% | 5.4% |
| Standard Deviation (Sample) | 1.4% | 5.3% |
| Standard Deviation (Population) | 1.4% | 5.1% |
Correlation Details
| Immigrants from Norway Percentile | Sample Size | Disability Age 5 to 17 |
[ 0.0% - 0.5% ] 0.022% | 111,471,553 | 5.4% |
[ 0.0% - 0.5% ] 0.18% | 3,357,820 | 5.0% |
[ 0.0% - 0.5% ] 0.30% | 736,083 | 4.7% |
[ 0.0% - 0.5% ] 0.42% | 300,538 | 6.0% |
[ 0.5% - 1.0% ] 0.58% | 166,170 | 6.3% |
[ 0.5% - 1.0% ] 0.71% | 64,108 | 3.8% |
[ 0.5% - 1.0% ] 0.82% | 66,338 | 12.4% |
[ 0.5% - 1.0% ] 0.94% | 4,902 | 8.7% |
[ 1.0% - 1.5% ] 1.05% | 1,143 | 5.8% |
[ 1.0% - 1.5% ] 1.20% | 4,819 | 14.1% |
[ 1.0% - 1.5% ] 1.38% | 2,320 | 5.5% |
[ 1.5% - 2.0% ] 1.53% | 15,522 | 10.8% |
[ 1.5% - 2.0% ] 1.62% | 1,293 | 24.8% |
[ 1.5% - 2.0% ] 1.79% | 7,001 | 7.2% |
[ 2.0% - 2.5% ] 2.22% | 3,114 | 4.2% |
[ 3.0% - 3.5% ] 3.27% | 1,807 | 10.2% |
[ 4.5% - 5.0% ] 4.52% | 177 | 9.5% |
[ 5.0% - 5.5% ] 5.17% | 4,586 | 15.7% |