Immigrants from Eastern Asia vs Slovene Disability Age Under 5

COMPARE

Immigrants from Eastern Asia
Race
Ancestry
AfghanAfricanAlaska NativeAlaskan AthabascanAlbanianAleutAlsatianAmericanApacheArabArapahoArgentineanArmenianAssyrian/Chaldean/SyriacAustralianAustrianBahamianBangladeshiBarbadianBasqueBelgianBelizeanBermudanBhutaneseBlackfeetBolivianBrazilianBritishBritish West IndianBulgarianBurmeseCajunCambodianCanadianCape VerdeanCarpatho RusynCelticCentral AmericanCentral American IndianCherokeeCheyenneChickasawChileanChineseChippewaChoctawColombianColvilleComancheCosta RicanCreeCreekCroatianCrowCubanCypriotCzechCzechoslovakianDanishDelawareDominicanDutchDutch West IndianEastern EuropeanEcuadorianEgyptianEnglishEstonianEthiopianEuropeanFijianFilipinoFinnishFrenchFrench American IndianFrench CanadianGermanGerman RussianGhanaianGreekGuamanian/ChamorroGuatemalanGuyaneseHaitianHmongHonduranHopiHoumaHungarianIcelanderIndian (Asian)IndonesianInupiatIranianIraqiIrishIroquoisIsraeliItalianJamaicanJapaneseJordanianKenyanKiowaKoreanLaotianLatvianLebaneseLiberianLithuanianLumbeeLuxembourgerMacedonianMalaysianMalteseMarshalleseMenomineeMexicanMexican American IndianMongolianMoroccanNative HawaiianNavajoNepaleseNew ZealanderNicaraguanNigerianNorthern EuropeanNorwegianOkinawanOsageOttawaPaiutePakistaniPalestinianPanamanianParaguayanPennsylvania GermanPeruvianPimaPolishPortuguesePotawatomiPuebloPuerto RicanPuget Sound SalishRomanianRussianSalvadoranSamoanScandinavianScotch-IrishScottishSeminoleSenegaleseSerbianShoshoneSierra LeoneanSiouxSlavicSlovakSomaliSouth AfricanSouth AmericanSouth American IndianSoviet UnionSpaniardSpanishSpanish AmericanSpanish American IndianSri LankanSubsaharan AfricanSudaneseSwedishSwissSyrianTaiwaneseThaiTlingit-HaidaTohono O'OdhamTonganTrinidadian and TobagonianTsimshianTurkishU.S. Virgin IslanderUgandanUkrainianUruguayanUteVenezuelanVietnameseWelshWest IndianYakamaYaquiYugoslavianYumanYup'ikZimbabwean
Immigration
NonimmigrantsImmigrantsAfghanistanAfricaAlbaniaArgentinaArmeniaAsiaAustraliaAustriaBahamasBangladeshBarbadosBelarusBelgiumBelizeBoliviaBosnia and HerzegovinaBrazilBulgariaBurma/MyanmarCabo VerdeCambodiaCameroonCanadaCaribbeanCentral AmericaChileChinaColombiaCongoCosta RicaCroatiaCubaCzechoslovakiaDenmarkDominicaDominican RepublicEastern AfricaEastern AsiaEastern EuropeEcuadorEgyptEl SalvadorEnglandEritreaEthiopiaEuropeFijiFranceGermanyGhanaGreeceGrenadaGuatemalaGuyanaHaitiHondurasHong KongHungaryIndiaIndonesiaIranIraqIrelandIsraelItalyJamaicaJapanJordanKazakhstanKenyaKoreaKuwaitLaosLatin AmericaLatviaLebanonLiberiaLithuaniaMalaysiaMexicoMicronesiaMiddle AfricaMoldovaMoroccoNepalNetherlandsNicaraguaNigeriaNorth AmericaNorth MacedoniaNorthern AfricaNorthern EuropeNorwayOceaniaPakistanPanamaPeruPhilippinesPolandPortugalRomaniaRussiaSaudi ArabiaScotlandSenegalSerbiaSierra LeoneSingaporeSomaliaSouth AfricaSouth AmericaSouth Central AsiaSouth Eastern AsiaSouthern EuropeSpainSri LankaSt. Vincent and the GrenadinesSudanSwedenSwitzerlandSyriaTaiwanThailandTrinidad and TobagoTurkeyUgandaUkraineUruguayUzbekistanVenezuelaVietnamWest IndiesWestern AfricaWestern AsiaWestern EuropeYemenZaireZimbabweAzores
Slovene
Race
Ancestry
AfghanAfricanAlaska NativeAlaskan AthabascanAlbanianAleutAlsatianAmericanApacheArabArapahoArgentineanArmenianAssyrian/Chaldean/SyriacAustralianAustrianBahamianBangladeshiBarbadianBasqueBelgianBelizeanBermudanBhutaneseBlackfeetBolivianBrazilianBritishBritish West IndianBulgarianBurmeseCajunCambodianCanadianCape VerdeanCarpatho RusynCelticCentral AmericanCentral American IndianCherokeeCheyenneChickasawChileanChineseChippewaChoctawColombianColvilleComancheCosta RicanCreeCreekCroatianCrowCubanCypriotCzechCzechoslovakianDanishDelawareDominicanDutchDutch West IndianEastern EuropeanEcuadorianEgyptianEnglishEstonianEthiopianEuropeanFijianFilipinoFinnishFrenchFrench American IndianFrench CanadianGermanGerman RussianGhanaianGreekGuamanian/ChamorroGuatemalanGuyaneseHaitianHmongHonduranHopiHoumaHungarianIcelanderIndian (Asian)IndonesianInupiatIranianIraqiIrishIroquoisIsraeliItalianJamaicanJapaneseJordanianKenyanKiowaKoreanLaotianLatvianLebaneseLiberianLithuanianLumbeeLuxembourgerMacedonianMalaysianMalteseMarshalleseMenomineeMexicanMexican American IndianMongolianMoroccanNative HawaiianNavajoNepaleseNew ZealanderNicaraguanNigerianNorthern EuropeanNorwegianOkinawanOsageOttawaPaiutePakistaniPalestinianPanamanianParaguayanPennsylvania GermanPeruvianPimaPolishPortuguesePotawatomiPuebloPuerto RicanPuget Sound SalishRomanianRussianSalvadoranSamoanScandinavianScotch-IrishScottishSeminoleSenegaleseSerbianShoshoneSierra LeoneanSiouxSlavicSlovakSloveneSomaliSouth AfricanSouth AmericanSouth American IndianSoviet UnionSpaniardSpanishSpanish AmericanSpanish American IndianSri LankanSubsaharan AfricanSudaneseSwedishSwissSyrianTaiwaneseThaiTlingit-HaidaTohono O'OdhamTonganTrinidadian and TobagonianTsimshianTurkishU.S. Virgin IslanderUgandanUkrainianUruguayanUteVenezuelanVietnameseWelshWest IndianYakamaYaquiYugoslavianYumanYup'ikZimbabwean
Immigration
NonimmigrantsImmigrantsAfghanistanAfricaAlbaniaArgentinaArmeniaAsiaAustraliaAustriaBahamasBangladeshBarbadosBelarusBelgiumBelizeBoliviaBosnia and HerzegovinaBrazilBulgariaBurma/MyanmarCabo VerdeCambodiaCameroonCanadaCaribbeanCentral AmericaChileChinaColombiaCongoCosta RicaCroatiaCubaCzechoslovakiaDenmarkDominicaDominican RepublicEastern AfricaEastern EuropeEcuadorEgyptEl SalvadorEnglandEritreaEthiopiaEuropeFijiFranceGermanyGhanaGreeceGrenadaGuatemalaGuyanaHaitiHondurasHong KongHungaryIndiaIndonesiaIranIraqIrelandIsraelItalyJamaicaJapanJordanKazakhstanKenyaKoreaKuwaitLaosLatin AmericaLatviaLebanonLiberiaLithuaniaMalaysiaMexicoMicronesiaMiddle AfricaMoldovaMoroccoNepalNetherlandsNicaraguaNigeriaNorth AmericaNorth MacedoniaNorthern AfricaNorthern EuropeNorwayOceaniaPakistanPanamaPeruPhilippinesPolandPortugalRomaniaRussiaSaudi ArabiaScotlandSenegalSerbiaSierra LeoneSingaporeSomaliaSouth AfricaSouth AmericaSouth Central AsiaSouth Eastern AsiaSouthern EuropeSpainSri LankaSt. Vincent and the GrenadinesSudanSwedenSwitzerlandSyriaTaiwanThailandTrinidad and TobagoTurkeyUgandaUkraineUruguayUzbekistanVenezuelaVietnamWest IndiesWestern AfricaWestern AsiaWestern EuropeYemenZaireZimbabweAzores
Disability Age Under 5
Income
Poverty
Unemployment
Labor Participation
Family Structure
Vehicle Availability
Education Level
Disability

Disability Age Under 5 Comparison

Immigrants from Eastern Asia

Slovenes

Exceptional
Tragic
1.0%
DISABILITY AGE UNDER 5
100.0/ 100
METRIC RATING
28th/ 347
METRIC RANK
1.4%
DISABILITY AGE UNDER 5
0.3/ 100
METRIC RATING
257th/ 347
METRIC RANK

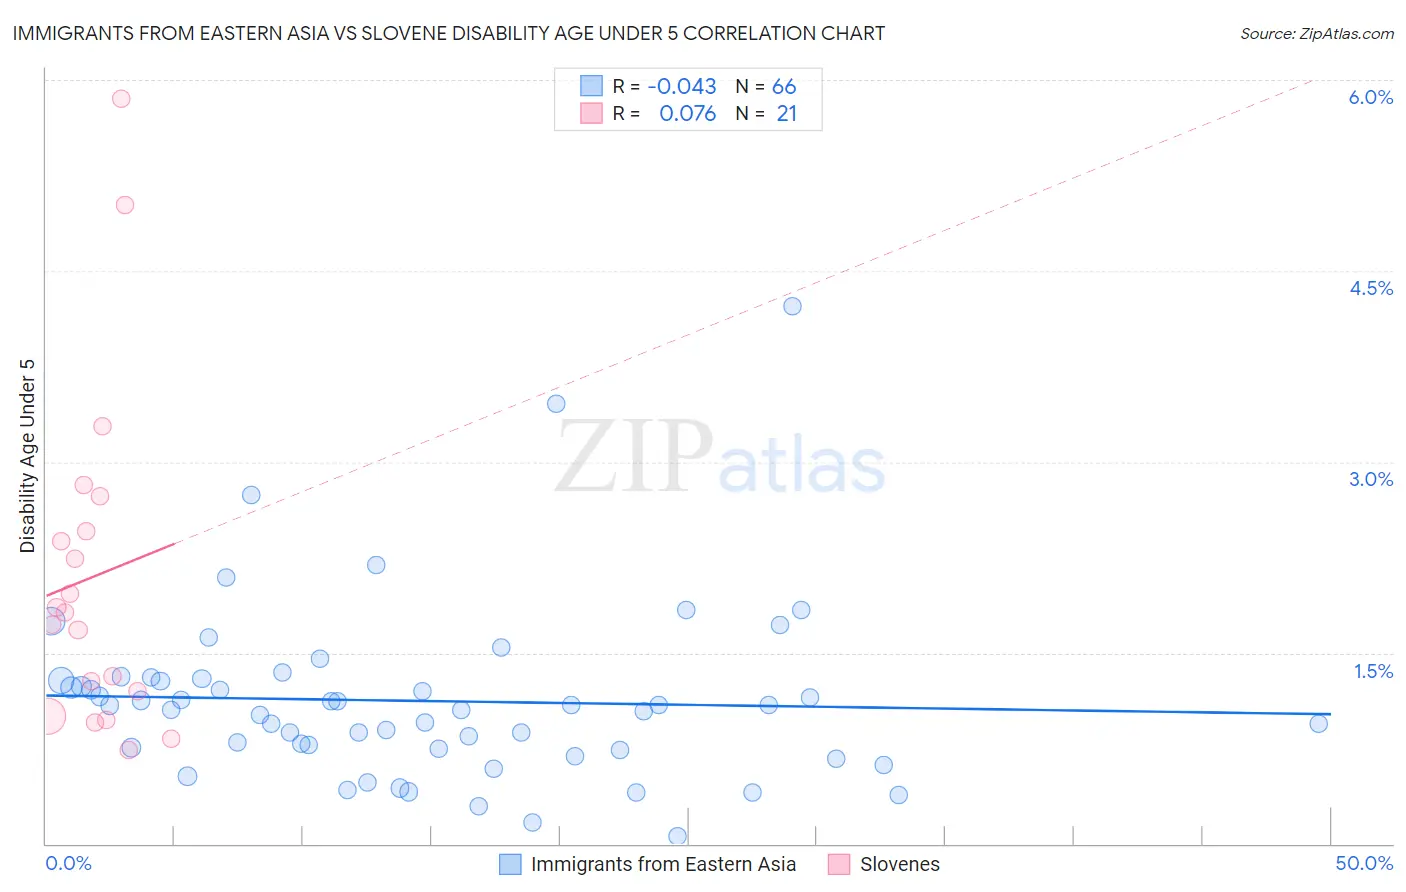
Immigrants from Eastern Asia vs Slovene Disability Age Under 5 Correlation Chart

The statistical analysis conducted on geographies consisting of 247,629,306 people shows no correlation between the proportion of Immigrants from Eastern Asia and percentage of population with a disability under the age of 5 in the United States with a correlation coefficient (R) of -0.043 and weighted average of 1.0%. Similarly, the statistical analysis conducted on geographies consisting of 155,245,072 people shows a slight positive correlation between the proportion of Slovenes and percentage of population with a disability under the age of 5 in the United States with a correlation coefficient (R) of 0.076 and weighted average of 1.4%, a difference of 37.1%.
Immigrants from Eastern Asia vs Slovene Disability Age Under 5

Disability Age Under 5 Correlation Summary

MeasurementImmigrants from Eastern AsiaSlovene
Minimum0.058%0.73%
Maximum4.2%5.9%
Range4.2%5.1%
Mean1.1%2.1%
Median1.1%1.8%
Interquartile 25% (IQ1)0.74%1.1%
Interquartile 75% (IQ3)1.3%2.6%
Interquartile Range (IQR)0.54%1.5%
Standard Deviation (Sample)0.69%1.3%
Standard Deviation (Population)0.69%1.3%

Similar Demographics by Disability Age Under 5

Demographics Similar to Immigrants from Eastern Asia by Disability Age Under 5

In terms of disability age under 5, the demographic groups most similar to Immigrants from Eastern Asia are Immigrants from Belarus (1.0%, a difference of 0.12%), Guyanese (1.0%, a difference of 0.63%), Immigrants from South Central Asia (1.0%, a difference of 0.65%), Armenian (1.0%, a difference of 0.93%), and Iranian (1.0%, a difference of 0.98%).
DemographicsRating | RankDisability Age Under 5
British West Indians
100.0
/100
|
#21
Exceptional
0.99%
Immigrants | Iran
100.0
/100
|
#22
Exceptional
1.00%
Yakama
100.0
/100
|
#23
Exceptional
1.00%
Indians (Asian)
100.0
/100
|
#24
Exceptional
1.0%
Immigrants | Micronesia
100.0
/100
|
#25
Exceptional
1.0%
Immigrants | Taiwan
100.0
/100
|
#26
Exceptional
1.0%
Guyanese
100.0
/100
|
#27
Exceptional
1.0%
Immigrants | Eastern Asia
100.0
/100
|
#28
Exceptional
1.0%
Immigrants | Belarus
100.0
/100
|
#29
Exceptional
1.0%
Immigrants | South Central Asia
99.9
/100
|
#30
Exceptional
1.0%
Armenians
99.9
/100
|
#31
Exceptional
1.0%
Iranians
99.9
/100
|
#32
Exceptional
1.0%
Bolivians
99.9
/100
|
#33
Exceptional
1.0%
Immigrants | Ukraine
99.9
/100
|
#34
Exceptional
1.0%
Barbadians
99.9
/100
|
#35
Exceptional
1.0%

Demographics Similar to Slovenes by Disability Age Under 5

In terms of disability age under 5, the demographic groups most similar to Slovenes are Costa Rican (1.4%, a difference of 0.19%), Immigrants from Southern Europe (1.4%, a difference of 0.34%), Slavic (1.4%, a difference of 0.55%), Immigrants from Western Europe (1.4%, a difference of 0.89%), and Immigrants from Netherlands (1.4%, a difference of 1.2%).
DemographicsRating | RankDisability Age Under 5
Africans
1.0
/100
|
#250
Tragic
1.4%
Immigrants | Hungary
1.0
/100
|
#251
Tragic
1.4%
Immigrants | Scotland
0.9
/100
|
#252
Tragic
1.4%
Australians
0.7
/100
|
#253
Tragic
1.4%
Immigrants | Brazil
0.7
/100
|
#254
Tragic
1.4%
Immigrants | Liberia
0.6
/100
|
#255
Tragic
1.4%
Immigrants | Western Europe
0.5
/100
|
#256
Tragic
1.4%
Slovenes
0.3
/100
|
#257
Tragic
1.4%
Costa Ricans
0.3
/100
|
#258
Tragic
1.4%
Immigrants | Southern Europe
0.3
/100
|
#259
Tragic
1.4%
Slavs
0.3
/100
|
#260
Tragic
1.4%
Immigrants | Netherlands
0.2
/100
|
#261
Tragic
1.4%
Immigrants | Dominica
0.2
/100
|
#262
Tragic
1.4%
Spanish
0.2
/100
|
#263
Tragic
1.4%
Yugoslavians
0.1
/100
|
#264
Tragic
1.4%