Immigrants from Eastern Asia Married-couple Households
COMPARE
Immigrants from Eastern Asia
Select to Compare
Married-couple Households
Immigrants from Eastern Asia Married-couple Households
48.8%
MARRIED-COUPLE HOUSEHOLDS
99.5/ 100
METRIC RATING
45th/ 347
METRIC RANK
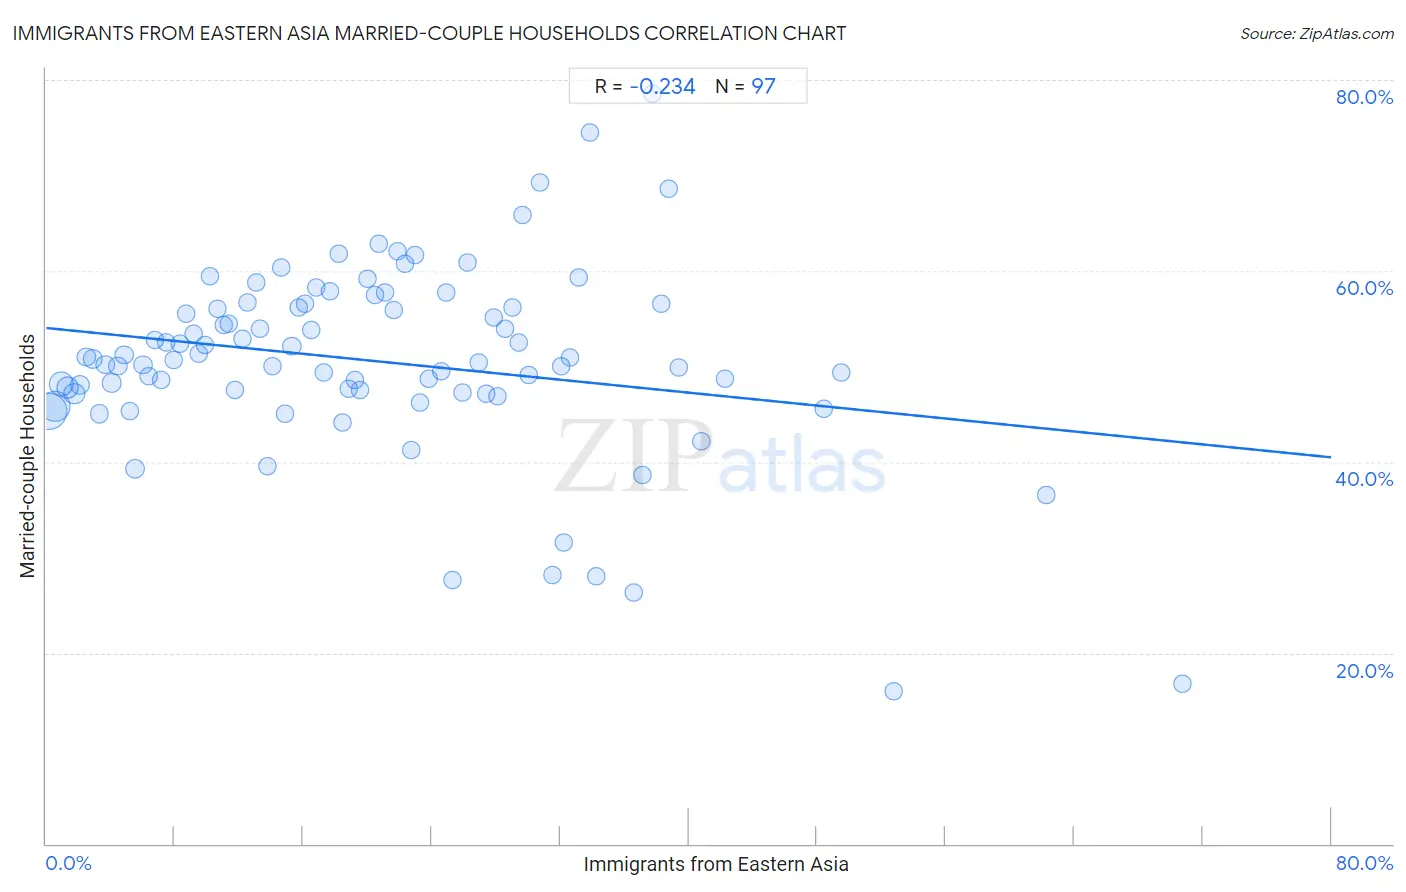
Immigrants from Eastern Asia Married-couple Households Correlation Chart
The statistical analysis conducted on geographies consisting of 499,367,501 people shows a weak negative correlation between the proportion of Immigrants from Eastern Asia and percentage of married-couple family households in the United States with a correlation coefficient (R) of -0.234 and weighted average of 48.8%. On average, for every 1% (one percent) increase in Immigrants from Eastern Asia within a typical geography, there is a decrease of 0.17% in percentage of married-couple family households.
It is essential to understand that the correlation between the percentage of Immigrants from Eastern Asia and percentage of married-couple family households does not imply a direct cause-and-effect relationship. It remains uncertain whether the presence of Immigrants from Eastern Asia influences an upward or downward trend in the level of percentage of married-couple family households within an area, or if Immigrants from Eastern Asia simply ended up residing in those areas with higher or lower levels of percentage of married-couple family households due to other factors.
Demographics Similar to Immigrants from Eastern Asia by Married-couple Households
In terms of married-couple households, the demographic groups most similar to Immigrants from Eastern Asia are Welsh (48.8%, a difference of 0.030%), Tsimshian (48.7%, a difference of 0.050%), British (48.7%, a difference of 0.060%), Immigrants from Iran (48.8%, a difference of 0.080%), and Indian (Asian) (48.7%, a difference of 0.12%).
| Demographics | Rating | Rank | Married-couple Households |
| Greeks | 99.7 /100 | #38 | Exceptional 48.9% |
| Lithuanians | 99.6 /100 | #39 | Exceptional 48.9% |
| Immigrants from Bolivia | 99.6 /100 | #40 | Exceptional 48.9% |
| Immigrants from Lebanon | 99.6 /100 | #41 | Exceptional 48.9% |
| Immigrants from Vietnam | 99.6 /100 | #42 | Exceptional 48.8% |
| Immigrants from Iran | 99.6 /100 | #43 | Exceptional 48.8% |
| Welsh | 99.5 /100 | #44 | Exceptional 48.8% |
| Immigrants from Eastern Asia | 99.5 /100 | #45 | Exceptional 48.8% |
| Tsimshian | 99.5 /100 | #46 | Exceptional 48.7% |
| British | 99.5 /100 | #47 | Exceptional 48.7% |
| Indians (Asian) | 99.4 /100 | #48 | Exceptional 48.7% |
| Immigrants from Sri Lanka | 99.4 /100 | #49 | Exceptional 48.7% |
| Samoans | 99.4 /100 | #50 | Exceptional 48.7% |
| Eastern Europeans | 99.3 /100 | #51 | Exceptional 48.6% |
| Irish | 99.3 /100 | #52 | Exceptional 48.6% |
Immigrants from Eastern Asia Married-couple Households Correlation Summary
| Measurement | Immigrants from Eastern Asia Data | Married-couple Households Data |
| Minimum | 0.19% | 16.0% |
| Maximum | 70.7% | 78.6% |
| Range | 70.6% | 62.6% |
| Mean | 20.4% | 50.6% |
| Median | 18.9% | 50.7% |
| Interquartile 25% (IQ1) | 9.3% | 47.2% |
| Interquartile 75% (IQ3) | 29.2% | 56.4% |
| Interquartile Range (IQR) | 19.9% | 9.2% |
| Standard Deviation (Sample) | 14.1% | 10.2% |
| Standard Deviation (Population) | 14.0% | 10.1% |
Correlation Details
| Immigrants from Eastern Asia Percentile | Sample Size | Married-couple Households |
[ 0.0% - 0.5% ] 0.19% | 172,793,723 | 45.4% |
[ 0.5% - 1.0% ] 0.56% | 114,482,512 | 45.9% |
[ 0.5% - 1.0% ] 0.95% | 56,373,918 | 48.2% |
[ 1.0% - 1.5% ] 1.35% | 32,944,493 | 47.8% |
[ 1.5% - 2.0% ] 1.75% | 24,212,985 | 47.1% |
[ 2.0% - 2.5% ] 2.10% | 13,099,420 | 48.1% |
[ 2.0% - 2.5% ] 2.49% | 9,686,722 | 51.0% |
[ 2.5% - 3.0% ] 2.89% | 7,364,808 | 50.8% |
[ 3.0% - 3.5% ] 3.31% | 11,048,326 | 45.1% |
[ 3.5% - 4.0% ] 3.68% | 6,224,340 | 50.2% |
[ 4.0% - 4.5% ] 4.08% | 3,704,609 | 48.3% |
[ 4.0% - 4.5% ] 4.45% | 4,381,567 | 50.0% |
[ 4.5% - 5.0% ] 4.86% | 3,373,299 | 51.3% |
[ 5.0% - 5.5% ] 5.23% | 2,557,281 | 45.3% |
[ 5.5% - 6.0% ] 5.50% | 10,933,055 | 39.3% |
[ 6.0% - 6.5% ] 6.02% | 2,466,108 | 50.2% |
[ 6.0% - 6.5% ] 6.37% | 1,421,359 | 49.0% |
[ 6.5% - 7.0% ] 6.78% | 1,250,162 | 52.7% |
[ 7.0% - 7.5% ] 7.13% | 1,049,580 | 48.5% |
[ 7.0% - 7.5% ] 7.44% | 1,677,847 | 52.6% |
[ 7.5% - 8.0% ] 7.94% | 1,133,230 | 50.7% |
[ 8.0% - 8.5% ] 8.35% | 1,323,414 | 52.4% |
[ 8.5% - 9.0% ] 8.72% | 1,071,220 | 55.6% |
[ 9.0% - 9.5% ] 9.17% | 1,272,025 | 53.4% |
[ 9.5% - 10.0% ] 9.50% | 624,836 | 51.4% |
[ 9.5% - 10.0% ] 9.86% | 1,009,662 | 52.3% |
[ 10.0% - 10.5% ] 10.21% | 890,903 | 59.4% |
[ 10.5% - 11.0% ] 10.64% | 532,697 | 56.0% |
[ 11.0% - 11.5% ] 11.04% | 315,339 | 54.3% |
[ 11.0% - 11.5% ] 11.39% | 475,420 | 54.5% |
[ 11.5% - 12.0% ] 11.76% | 1,051,763 | 47.5% |
[ 12.0% - 12.5% ] 12.21% | 538,042 | 52.9% |
[ 12.5% - 13.0% ] 12.52% | 591,857 | 56.7% |
[ 13.0% - 13.5% ] 13.04% | 129,501 | 58.8% |
[ 13.0% - 13.5% ] 13.32% | 551,534 | 54.0% |
[ 13.5% - 14.0% ] 13.76% | 1,187,187 | 39.5% |
[ 14.0% - 14.5% ] 14.12% | 473,151 | 50.0% |
[ 14.5% - 15.0% ] 14.61% | 126,598 | 60.3% |
[ 14.5% - 15.0% ] 14.89% | 111,011 | 45.1% |
[ 15.0% - 15.5% ] 15.29% | 275,032 | 52.2% |
[ 15.5% - 16.0% ] 15.73% | 172,210 | 56.1% |
[ 16.0% - 16.5% ] 16.09% | 179,266 | 56.6% |
[ 16.0% - 16.5% ] 16.47% | 180,691 | 53.8% |
[ 16.5% - 17.0% ] 16.83% | 589,295 | 58.2% |
[ 17.0% - 17.5% ] 17.31% | 230,337 | 49.4% |
[ 17.5% - 18.0% ] 17.67% | 82,641 | 57.9% |
[ 18.0% - 18.5% ] 18.18% | 341 | 61.8% |
[ 18.0% - 18.5% ] 18.44% | 110,342 | 44.2% |
[ 18.5% - 19.0% ] 18.85% | 157,042 | 47.6% |
[ 19.0% - 19.5% ] 19.23% | 118,464 | 48.6% |
[ 19.5% - 20.0% ] 19.55% | 100,680 | 47.5% |
[ 19.5% - 20.0% ] 19.99% | 73,691 | 59.1% |
[ 20.0% - 20.5% ] 20.45% | 346,399 | 57.4% |
[ 20.5% - 21.0% ] 20.67% | 156,580 | 62.8% |
[ 21.0% - 21.5% ] 21.10% | 100,512 | 57.7% |
[ 21.5% - 22.0% ] 21.63% | 34,604 | 55.8% |
[ 21.5% - 22.0% ] 21.86% | 61,110 | 62.1% |
[ 22.0% - 22.5% ] 22.31% | 90,420 | 60.7% |
[ 22.5% - 23.0% ] 22.69% | 94,696 | 41.3% |
[ 22.5% - 23.0% ] 22.94% | 128,109 | 61.7% |
[ 23.0% - 23.5% ] 23.27% | 82,295 | 46.2% |
[ 23.5% - 24.0% ] 23.83% | 104,647 | 48.8% |
[ 24.5% - 25.0% ] 24.60% | 83,601 | 49.5% |
[ 24.5% - 25.0% ] 24.88% | 70,110 | 57.7% |
[ 25.0% - 25.5% ] 25.31% | 76,518 | 27.6% |
[ 25.5% - 26.0% ] 25.88% | 93,232 | 47.3% |
[ 26.0% - 26.5% ] 26.24% | 58,223 | 60.8% |
[ 26.5% - 27.0% ] 26.96% | 1,250 | 50.4% |
[ 27.0% - 27.5% ] 27.42% | 123,259 | 47.1% |
[ 27.5% - 28.0% ] 27.83% | 78,835 | 55.1% |
[ 28.0% - 28.5% ] 28.13% | 33,937 | 46.8% |
[ 28.5% - 29.0% ] 28.57% | 69,291 | 53.9% |
[ 29.0% - 29.5% ] 29.01% | 120,290 | 56.2% |
[ 29.0% - 29.5% ] 29.38% | 44,582 | 52.5% |
[ 29.5% - 30.0% ] 29.63% | 82,746 | 65.9% |
[ 30.0% - 30.5% ] 30.04% | 40,738 | 49.1% |
[ 30.5% - 31.0% ] 30.72% | 42,523 | 69.2% |
[ 31.0% - 31.5% ] 31.50% | 889 | 28.2% |
[ 32.0% - 32.5% ] 32.09% | 430 | 50.0% |
[ 32.0% - 32.5% ] 32.18% | 25,460 | 31.6% |
[ 32.5% - 33.0% ] 32.57% | 61,891 | 51.0% |
[ 33.0% - 33.5% ] 33.18% | 91,177 | 59.4% |
[ 33.5% - 34.0% ] 33.88% | 242 | 74.5% |
[ 34.0% - 34.5% ] 34.23% | 222 | 28.0% |
[ 36.5% - 37.0% ] 36.60% | 12,070 | 26.3% |
[ 37.0% - 37.5% ] 37.10% | 283 | 38.6% |
[ 37.5% - 38.0% ] 37.70% | 183 | 78.6% |
[ 38.0% - 38.5% ] 38.31% | 26,418 | 56.6% |
[ 38.5% - 39.0% ] 38.75% | 25,001 | 68.6% |
[ 39.0% - 39.5% ] 39.36% | 1,255 | 49.8% |
[ 40.5% - 41.0% ] 40.74% | 27 | 42.1% |
[ 42.0% - 42.5% ] 42.24% | 40,462 | 48.7% |
[ 48.0% - 48.5% ] 48.39% | 57,556 | 45.5% |
[ 49.0% - 49.5% ] 49.50% | 79,495 | 49.4% |
[ 52.5% - 53.0% ] 52.78% | 144 | 16.0% |
[ 62.0% - 62.5% ] 62.26% | 106 | 36.5% |
[ 70.5% - 71.0% ] 70.75% | 147 | 16.8% |