Immigrants from Eastern Asia Disability Age 5 to 17
COMPARE
Immigrants from Eastern Asia
Select to Compare
Disability Age 5 to 17
Immigrants from Eastern Asia Disability Age 5 to 17
4.6%
DISABILITY | AGE 5 TO 17
100.0/ 100
METRIC RATING
9th/ 347
METRIC RANK
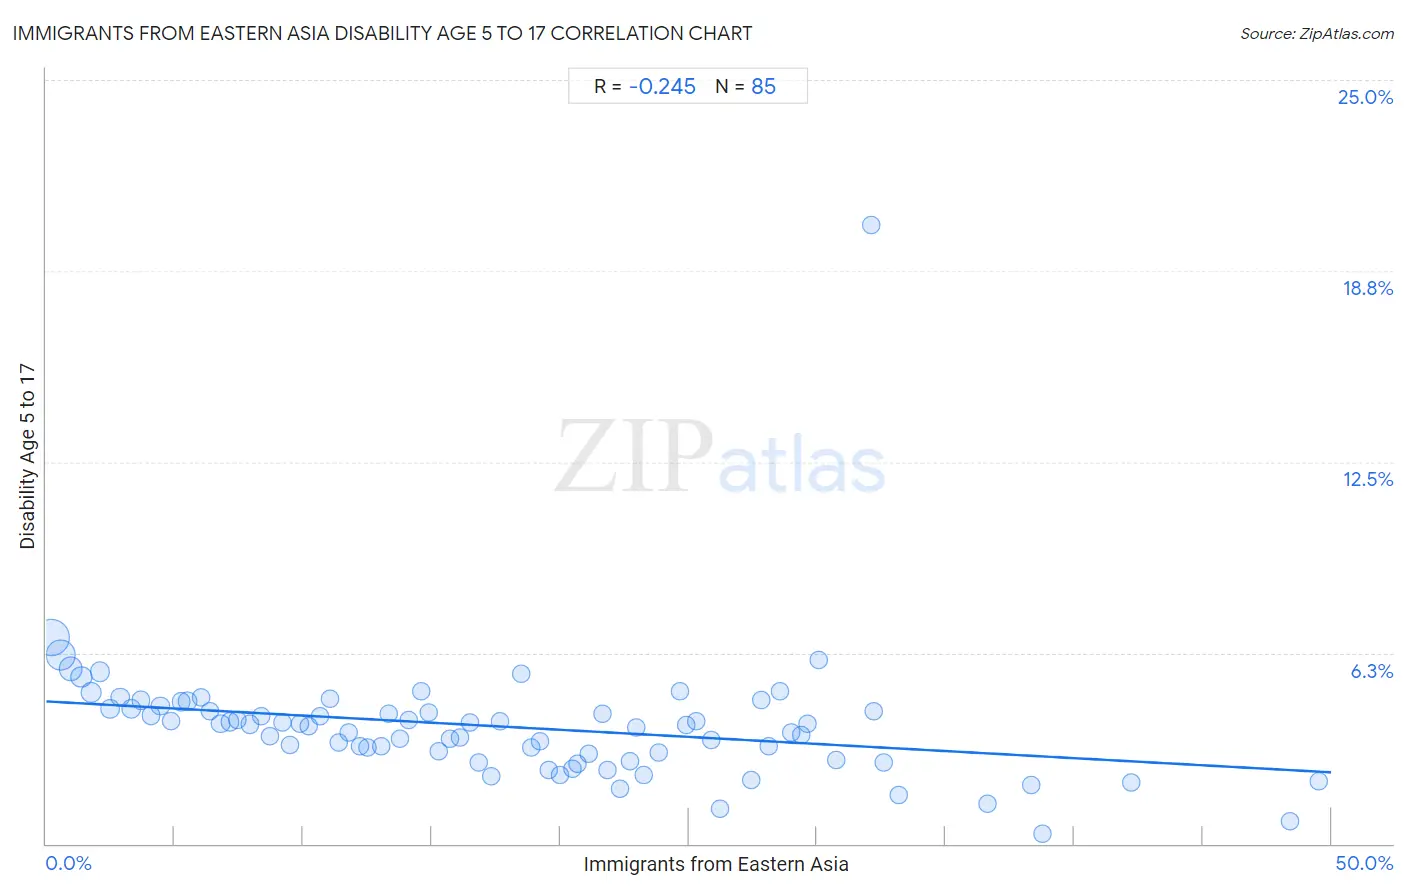
Immigrants from Eastern Asia Disability Age 5 to 17 Correlation Chart
The statistical analysis conducted on geographies consisting of 493,323,478 people shows a weak negative correlation between the proportion of Immigrants from Eastern Asia and percentage of population with a disability between the ages 5 and 17 in the United States with a correlation coefficient (R) of -0.245 and weighted average of 4.6%. On average, for every 1% (one percent) increase in Immigrants from Eastern Asia within a typical geography, there is a decrease of 0.046% in percentage of population with a disability between the ages 5 and 17.
It is essential to understand that the correlation between the percentage of Immigrants from Eastern Asia and percentage of population with a disability between the ages 5 and 17 does not imply a direct cause-and-effect relationship. It remains uncertain whether the presence of Immigrants from Eastern Asia influences an upward or downward trend in the level of percentage of population with a disability between the ages 5 and 17 within an area, or if Immigrants from Eastern Asia simply ended up residing in those areas with higher or lower levels of percentage of population with a disability between the ages 5 and 17 due to other factors.
Demographics Similar to Immigrants from Eastern Asia by Disability Age 5 to 17
In terms of disability age 5 to 17, the demographic groups most similar to Immigrants from Eastern Asia are Immigrants from India (4.6%, a difference of 0.070%), Armenian (4.6%, a difference of 0.23%), Indian (Asian) (4.6%, a difference of 0.33%), Iranian (4.6%, a difference of 0.47%), and Immigrants from China (4.5%, a difference of 1.3%).
| Demographics | Rating | Rank | Disability Age 5 to 17 |
| Immigrants from Taiwan | 100.0 /100 | #2 | Exceptional 4.2% |
| Immigrants from Hong Kong | 100.0 /100 | #3 | Exceptional 4.3% |
| Filipinos | 100.0 /100 | #4 | Exceptional 4.3% |
| Immigrants from Iran | 100.0 /100 | #5 | Exceptional 4.4% |
| Immigrants from Israel | 100.0 /100 | #6 | Exceptional 4.5% |
| Immigrants from China | 100.0 /100 | #7 | Exceptional 4.5% |
| Indians (Asian) | 100.0 /100 | #8 | Exceptional 4.6% |
| Immigrants from Eastern Asia | 100.0 /100 | #9 | Exceptional 4.6% |
| Immigrants from India | 100.0 /100 | #10 | Exceptional 4.6% |
| Armenians | 100.0 /100 | #11 | Exceptional 4.6% |
| Iranians | 100.0 /100 | #12 | Exceptional 4.6% |
| Thais | 100.0 /100 | #13 | Exceptional 4.7% |
| Immigrants from Korea | 100.0 /100 | #14 | Exceptional 4.7% |
| Chinese | 100.0 /100 | #15 | Exceptional 4.7% |
| Immigrants from Singapore | 100.0 /100 | #16 | Exceptional 4.7% |
Immigrants from Eastern Asia Disability Age 5 to 17 Correlation Summary
| Measurement | Immigrants from Eastern Asia Data | Disability Age 5 to 17 Data |
| Minimum | 0.19% | 0.35% |
| Maximum | 49.5% | 20.3% |
| Range | 49.3% | 19.9% |
| Mean | 17.6% | 3.8% |
| Median | 16.5% | 3.9% |
| Interquartile 25% (IQ1) | 8.1% | 2.8% |
| Interquartile 75% (IQ3) | 25.6% | 4.4% |
| Interquartile Range (IQR) | 17.5% | 1.6% |
| Standard Deviation (Sample) | 11.5% | 2.2% |
| Standard Deviation (Population) | 11.4% | 2.2% |
Correlation Details
| Immigrants from Eastern Asia Percentile | Sample Size | Disability Age 5 to 17 |
[ 0.0% - 0.5% ] 0.19% | 171,102,448 | 6.7% |
[ 0.5% - 1.0% ] 0.56% | 113,127,078 | 6.2% |
[ 0.5% - 1.0% ] 0.95% | 55,745,180 | 5.7% |
[ 1.0% - 1.5% ] 1.35% | 32,467,637 | 5.5% |
[ 1.5% - 2.0% ] 1.75% | 23,910,306 | 4.9% |
[ 2.0% - 2.5% ] 2.10% | 12,867,872 | 5.6% |
[ 2.0% - 2.5% ] 2.49% | 9,555,377 | 4.4% |
[ 2.5% - 3.0% ] 2.89% | 7,235,737 | 4.8% |
[ 3.0% - 3.5% ] 3.31% | 10,953,400 | 4.4% |
[ 3.5% - 4.0% ] 3.68% | 6,162,529 | 4.7% |
[ 4.0% - 4.5% ] 4.08% | 3,591,262 | 4.2% |
[ 4.0% - 4.5% ] 4.45% | 4,328,036 | 4.5% |
[ 4.5% - 5.0% ] 4.86% | 3,304,707 | 4.0% |
[ 5.0% - 5.5% ] 5.23% | 2,466,242 | 4.6% |
[ 5.5% - 6.0% ] 5.50% | 10,902,171 | 4.6% |
[ 6.0% - 6.5% ] 6.02% | 2,441,306 | 4.8% |
[ 6.0% - 6.5% ] 6.37% | 1,364,799 | 4.3% |
[ 6.5% - 7.0% ] 6.78% | 1,233,356 | 3.9% |
[ 7.0% - 7.5% ] 7.14% | 987,500 | 4.0% |
[ 7.0% - 7.5% ] 7.43% | 1,640,018 | 4.1% |
[ 7.5% - 8.0% ] 7.94% | 1,095,186 | 3.9% |
[ 8.0% - 8.5% ] 8.35% | 1,305,627 | 4.2% |
[ 8.5% - 9.0% ] 8.72% | 1,052,668 | 3.5% |
[ 9.0% - 9.5% ] 9.17% | 1,261,651 | 4.0% |
[ 9.5% - 10.0% ] 9.51% | 617,118 | 3.2% |
[ 9.5% - 10.0% ] 9.86% | 1,004,664 | 3.9% |
[ 10.0% - 10.5% ] 10.21% | 874,248 | 3.9% |
[ 10.5% - 11.0% ] 10.64% | 500,303 | 4.2% |
[ 11.0% - 11.5% ] 11.04% | 308,723 | 4.8% |
[ 11.0% - 11.5% ] 11.39% | 465,071 | 3.3% |
[ 11.5% - 12.0% ] 11.76% | 1,048,844 | 3.6% |
[ 12.0% - 12.5% ] 12.22% | 527,043 | 3.2% |
[ 12.5% - 13.0% ] 12.51% | 563,782 | 3.1% |
[ 13.0% - 13.5% ] 13.04% | 138,131 | 3.2% |
[ 13.0% - 13.5% ] 13.32% | 551,254 | 4.3% |
[ 13.5% - 14.0% ] 13.76% | 1,142,883 | 3.5% |
[ 14.0% - 14.5% ] 14.12% | 470,350 | 4.0% |
[ 14.5% - 15.0% ] 14.61% | 126,598 | 5.0% |
[ 14.5% - 15.0% ] 14.89% | 110,521 | 4.3% |
[ 15.0% - 15.5% ] 15.29% | 272,575 | 3.0% |
[ 15.5% - 16.0% ] 15.73% | 166,130 | 3.5% |
[ 16.0% - 16.5% ] 16.09% | 178,503 | 3.5% |
[ 16.0% - 16.5% ] 16.47% | 180,691 | 4.0% |
[ 16.5% - 17.0% ] 16.83% | 584,133 | 2.7% |
[ 17.0% - 17.5% ] 17.31% | 228,552 | 2.2% |
[ 17.5% - 18.0% ] 17.67% | 82,360 | 4.0% |
[ 18.0% - 18.5% ] 18.49% | 75,421 | 5.6% |
[ 18.5% - 19.0% ] 18.85% | 157,005 | 3.1% |
[ 19.0% - 19.5% ] 19.23% | 118,464 | 3.4% |
[ 19.5% - 20.0% ] 19.53% | 88,672 | 2.4% |
[ 19.5% - 20.0% ] 19.99% | 73,691 | 2.3% |
[ 20.0% - 20.5% ] 20.45% | 346,015 | 2.5% |
[ 20.5% - 21.0% ] 20.67% | 145,886 | 2.6% |
[ 21.0% - 21.5% ] 21.10% | 99,200 | 2.9% |
[ 21.5% - 22.0% ] 21.63% | 34,244 | 4.3% |
[ 21.5% - 22.0% ] 21.86% | 61,110 | 2.4% |
[ 22.0% - 22.5% ] 22.31% | 90,420 | 1.8% |
[ 22.5% - 23.0% ] 22.72% | 76,892 | 2.7% |
[ 22.5% - 23.0% ] 22.94% | 128,109 | 3.8% |
[ 23.0% - 23.5% ] 23.27% | 82,295 | 2.2% |
[ 23.5% - 24.0% ] 23.83% | 104,218 | 3.0% |
[ 24.5% - 25.0% ] 24.68% | 53,713 | 5.0% |
[ 24.5% - 25.0% ] 24.88% | 70,110 | 3.9% |
[ 25.0% - 25.5% ] 25.31% | 76,518 | 4.0% |
[ 25.5% - 26.0% ] 25.88% | 93,008 | 3.4% |
[ 26.0% - 26.5% ] 26.24% | 58,223 | 1.1% |
[ 27.0% - 27.5% ] 27.43% | 118,791 | 2.1% |
[ 27.5% - 28.0% ] 27.83% | 78,835 | 4.7% |
[ 28.0% - 28.5% ] 28.13% | 33,937 | 3.2% |
[ 28.5% - 29.0% ] 28.57% | 69,291 | 5.0% |
[ 29.0% - 29.5% ] 29.01% | 120,290 | 3.6% |
[ 29.0% - 29.5% ] 29.38% | 44,582 | 3.6% |
[ 29.5% - 30.0% ] 29.63% | 82,746 | 3.9% |
[ 30.0% - 30.5% ] 30.04% | 40,738 | 6.0% |
[ 30.5% - 31.0% ] 30.72% | 42,331 | 2.7% |
[ 32.0% - 32.5% ] 32.09% | 430 | 20.3% |
[ 32.0% - 32.5% ] 32.18% | 25,460 | 4.4% |
[ 32.5% - 33.0% ] 32.57% | 60,386 | 2.6% |
[ 33.0% - 33.5% ] 33.18% | 91,060 | 1.6% |
[ 36.5% - 37.0% ] 36.60% | 12,070 | 1.3% |
[ 38.0% - 38.5% ] 38.31% | 26,418 | 1.9% |
[ 38.5% - 39.0% ] 38.75% | 25,001 | 0.35% |
[ 42.0% - 42.5% ] 42.24% | 40,462 | 2.0% |
[ 48.0% - 48.5% ] 48.40% | 53,371 | 0.75% |
[ 49.0% - 49.5% ] 49.50% | 79,495 | 2.0% |