Immigrants from Denmark Disability Age 5 to 17
COMPARE
Immigrants from Denmark
Select to Compare
Disability Age 5 to 17
Immigrants from Denmark Disability Age 5 to 17
5.4%
DISABILITY | AGE 5 TO 17
91.4/ 100
METRIC RATING
136th/ 347
METRIC RANK
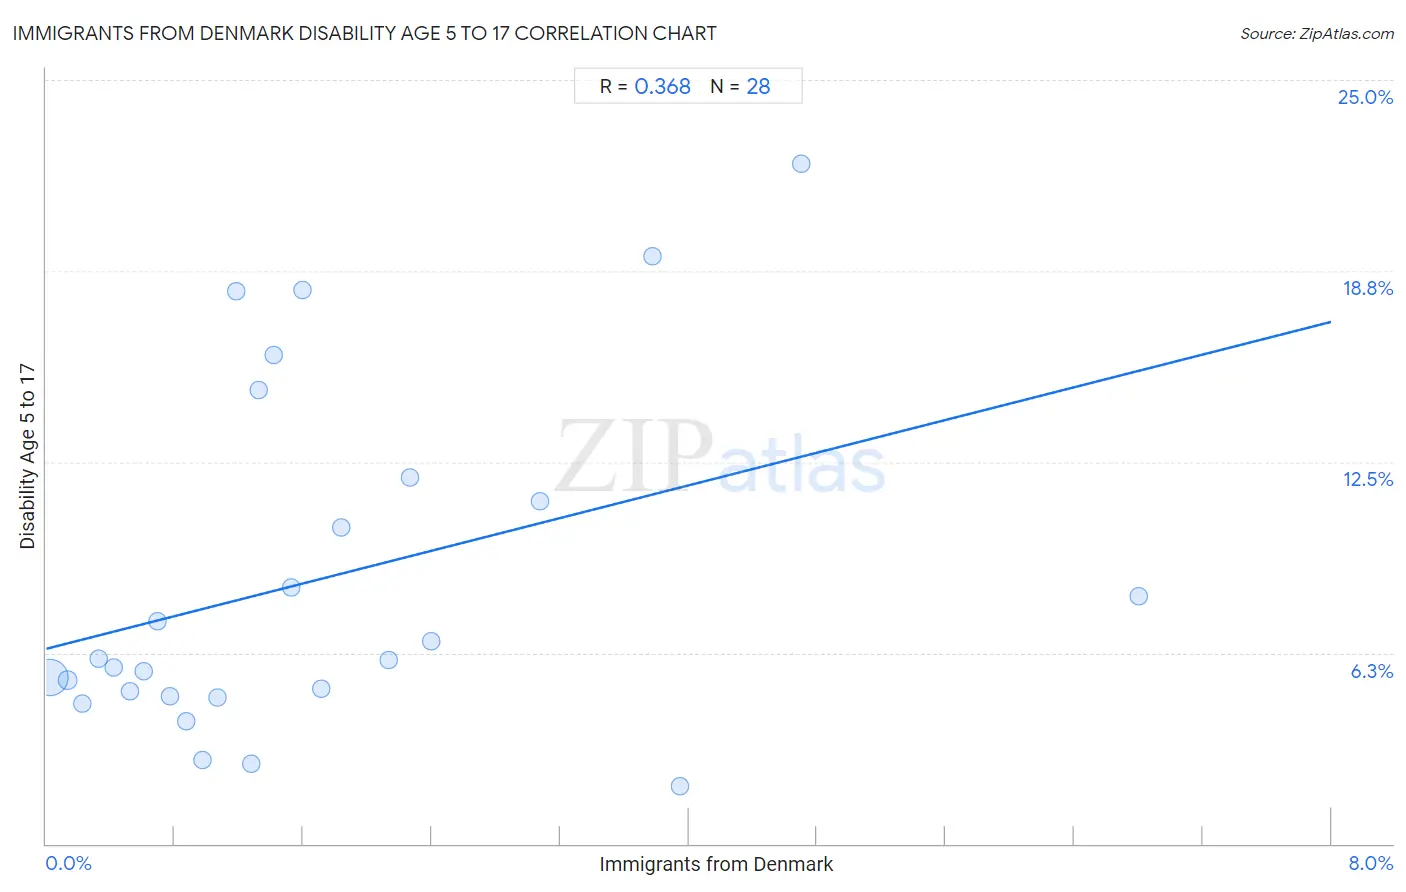
Immigrants from Denmark Disability Age 5 to 17 Correlation Chart
The statistical analysis conducted on geographies consisting of 135,667,320 people shows a mild positive correlation between the proportion of Immigrants from Denmark and percentage of population with a disability between the ages 5 and 17 in the United States with a correlation coefficient (R) of 0.368 and weighted average of 5.4%. On average, for every 1% (one percent) increase in Immigrants from Denmark within a typical geography, there is an increase of 1.3% in percentage of population with a disability between the ages 5 and 17.
It is essential to understand that the correlation between the percentage of Immigrants from Denmark and percentage of population with a disability between the ages 5 and 17 does not imply a direct cause-and-effect relationship. It remains uncertain whether the presence of Immigrants from Denmark influences an upward or downward trend in the level of percentage of population with a disability between the ages 5 and 17 within an area, or if Immigrants from Denmark simply ended up residing in those areas with higher or lower levels of percentage of population with a disability between the ages 5 and 17 due to other factors.
Demographics Similar to Immigrants from Denmark by Disability Age 5 to 17
In terms of disability age 5 to 17, the demographic groups most similar to Immigrants from Denmark are Immigrants from Belize (5.4%, a difference of 0.050%), Navajo (5.4%, a difference of 0.080%), Immigrants from Oceania (5.4%, a difference of 0.090%), Belizean (5.4%, a difference of 0.090%), and Immigrants from Netherlands (5.4%, a difference of 0.14%).
| Demographics | Rating | Rank | Disability Age 5 to 17 |
| Romanians | 94.1 /100 | #129 | Exceptional 5.4% |
| Immigrants from Bulgaria | 94.0 /100 | #130 | Exceptional 5.4% |
| Arabs | 92.9 /100 | #131 | Exceptional 5.4% |
| Immigrants from Colombia | 92.9 /100 | #132 | Exceptional 5.4% |
| Venezuelans | 92.7 /100 | #133 | Exceptional 5.4% |
| Yuman | 92.3 /100 | #134 | Exceptional 5.4% |
| Immigrants from Belize | 91.7 /100 | #135 | Exceptional 5.4% |
| Immigrants from Denmark | 91.4 /100 | #136 | Exceptional 5.4% |
| Navajo | 90.9 /100 | #137 | Exceptional 5.4% |
| Immigrants from Oceania | 90.8 /100 | #138 | Exceptional 5.4% |
| Belizeans | 90.8 /100 | #139 | Exceptional 5.4% |
| Immigrants from Netherlands | 90.5 /100 | #140 | Exceptional 5.4% |
| South American Indians | 89.3 /100 | #141 | Excellent 5.5% |
| Colombians | 88.0 /100 | #142 | Excellent 5.5% |
| Immigrants from Hungary | 87.9 /100 | #143 | Excellent 5.5% |
Immigrants from Denmark Disability Age 5 to 17 Correlation Summary
| Measurement | Immigrants from Denmark Data | Disability Age 5 to 17 Data |
| Minimum | 0.022% | 1.9% |
| Maximum | 6.8% | 22.3% |
| Range | 6.8% | 20.4% |
| Mean | 1.7% | 8.7% |
| Median | 1.3% | 6.0% |
| Interquartile 25% (IQ1) | 0.65% | 4.9% |
| Interquartile 75% (IQ3) | 2.2% | 11.6% |
| Interquartile Range (IQR) | 1.5% | 6.7% |
| Standard Deviation (Sample) | 1.6% | 5.6% |
| Standard Deviation (Population) | 1.5% | 5.5% |
Correlation Details
| Immigrants from Denmark Percentile | Sample Size | Disability Age 5 to 17 |
[ 0.0% - 0.5% ] 0.022% | 125,075,993 | 5.4% |
[ 0.0% - 0.5% ] 0.13% | 6,686,209 | 5.3% |
[ 0.0% - 0.5% ] 0.23% | 2,305,935 | 4.6% |
[ 0.0% - 0.5% ] 0.32% | 582,043 | 6.0% |
[ 0.0% - 0.5% ] 0.42% | 349,031 | 5.8% |
[ 0.5% - 1.0% ] 0.52% | 239,957 | 5.0% |
[ 0.5% - 1.0% ] 0.60% | 214,341 | 5.6% |
[ 0.5% - 1.0% ] 0.69% | 61,703 | 7.3% |
[ 0.5% - 1.0% ] 0.77% | 11,978 | 4.8% |
[ 0.5% - 1.0% ] 0.87% | 22,107 | 4.0% |
[ 0.5% - 1.0% ] 0.98% | 3,075 | 2.8% |
[ 1.0% - 1.5% ] 1.07% | 48,134 | 4.8% |
[ 1.0% - 1.5% ] 1.18% | 2,288 | 18.1% |
[ 1.0% - 1.5% ] 1.28% | 24,183 | 2.6% |
[ 1.0% - 1.5% ] 1.33% | 2,037 | 14.9% |
[ 1.0% - 1.5% ] 1.42% | 5,863 | 16.0% |
[ 1.5% - 2.0% ] 1.52% | 9,255 | 8.4% |
[ 1.5% - 2.0% ] 1.59% | 753 | 18.1% |
[ 1.5% - 2.0% ] 1.71% | 8,118 | 5.1% |
[ 1.5% - 2.0% ] 1.84% | 544 | 10.3% |
[ 2.0% - 2.5% ] 2.13% | 2,489 | 6.0% |
[ 2.0% - 2.5% ] 2.26% | 619 | 12.0% |
[ 2.0% - 2.5% ] 2.40% | 2,211 | 6.6% |
[ 3.0% - 3.5% ] 3.07% | 1,335 | 11.2% |
[ 3.5% - 4.0% ] 3.77% | 2,040 | 19.2% |
[ 3.5% - 4.0% ] 3.94% | 2,714 | 1.9% |
[ 4.5% - 5.0% ] 4.70% | 1,233 | 22.3% |
[ 6.5% - 7.0% ] 6.80% | 1,132 | 8.1% |