Immigrants from Denmark 1 or more Vehicles in Household
COMPARE
Immigrants from Denmark
Select to Compare
1 or more Vehicles in Household
Immigrants from Denmark 1 or more Vehicles in Household
89.1%
1+ VEHICLES AVAILABLE
14.8/ 100
METRIC RATING
207th/ 347
METRIC RANK
Immigrants from Denmark 1 or more Vehicles in Household Correlation Chart
The statistical analysis conducted on geographies consisting of 136,405,039 people shows a weak positive correlation between the proportion of Immigrants from Denmark and percentage of households with 1 or more vehicles available in the United States with a correlation coefficient (R) of 0.207 and weighted average of 89.1%. On average, for every 1% (one percent) increase in Immigrants from Denmark within a typical geography, there is an increase of 0.36% in percentage of households with 1 or more vehicles available.
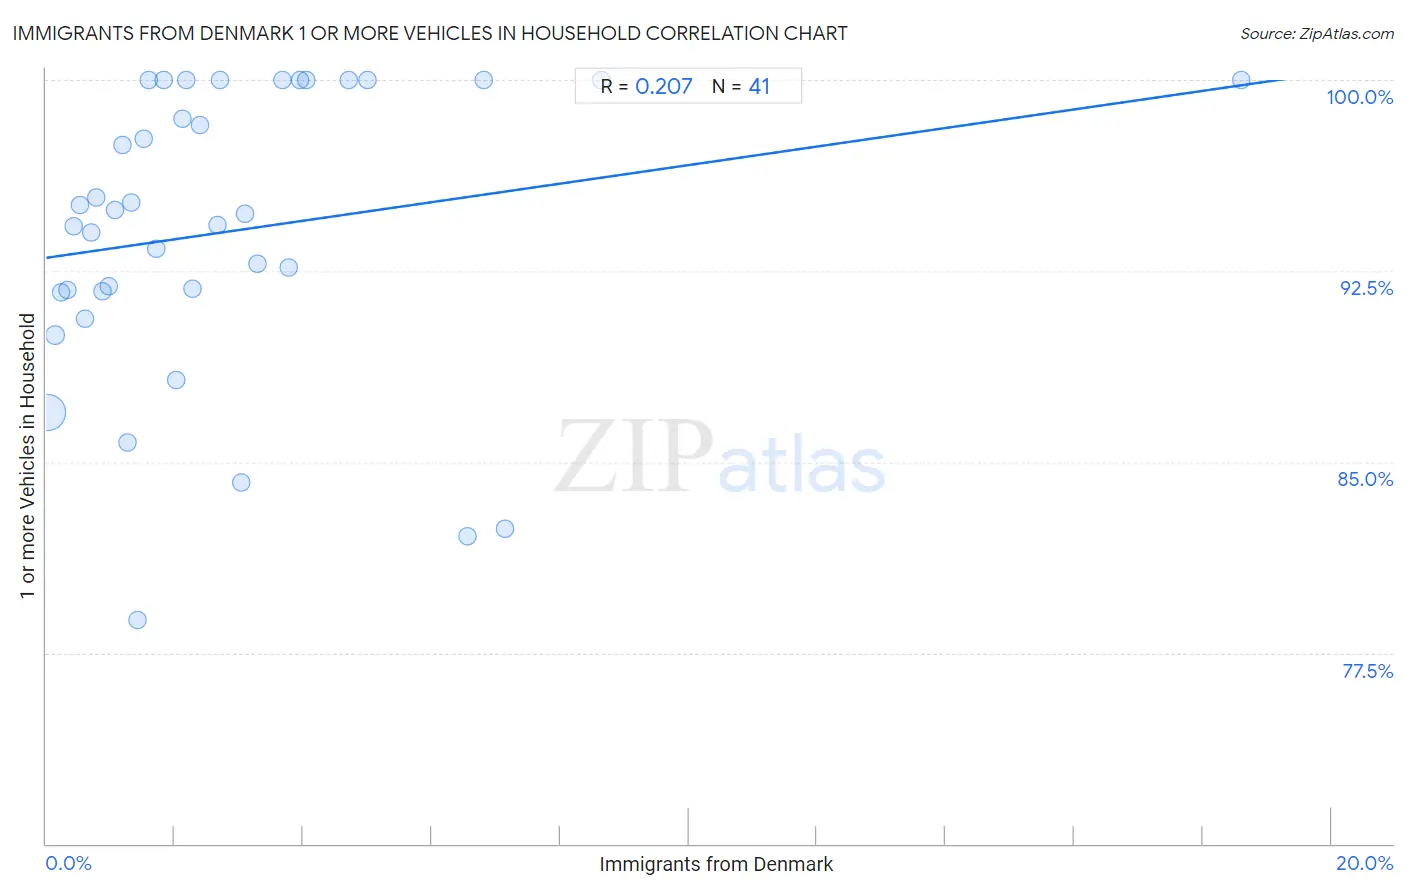
It is essential to understand that the correlation between the percentage of Immigrants from Denmark and percentage of households with 1 or more vehicles available does not imply a direct cause-and-effect relationship. It remains uncertain whether the presence of Immigrants from Denmark influences an upward or downward trend in the level of percentage of households with 1 or more vehicles available within an area, or if Immigrants from Denmark simply ended up residing in those areas with higher or lower levels of percentage of households with 1 or more vehicles available due to other factors.
Demographics Similar to Immigrants from Denmark by 1 or more Vehicles in Household
In terms of 1 or more vehicles in household, the demographic groups most similar to Immigrants from Denmark are Immigrants from Chile (89.1%, a difference of 0.010%), Immigrants from Italy (89.1%, a difference of 0.030%), Apache (89.1%, a difference of 0.040%), Dutch West Indian (89.0%, a difference of 0.040%), and Sierra Leonean (89.0%, a difference of 0.060%).
| Demographics | Rating | Rank | 1 or more Vehicles in Household |
| Central Americans | 21.4 /100 | #200 | Fair 89.2% |
| Immigrants from Western Europe | 20.5 /100 | #201 | Fair 89.2% |
| Iroquois | 19.8 /100 | #202 | Poor 89.2% |
| Cambodians | 18.9 /100 | #203 | Poor 89.2% |
| Romanians | 18.2 /100 | #204 | Poor 89.2% |
| Guatemalans | 17.8 /100 | #205 | Poor 89.2% |
| Apache | 16.2 /100 | #206 | Poor 89.1% |
| Immigrants from Denmark | 14.8 /100 | #207 | Poor 89.1% |
| Immigrants from Chile | 14.4 /100 | #208 | Poor 89.1% |
| Immigrants from Italy | 14.0 /100 | #209 | Poor 89.1% |
| Dutch West Indians | 13.5 /100 | #210 | Poor 89.0% |
| Sierra Leoneans | 13.0 /100 | #211 | Poor 89.0% |
| Somalis | 12.8 /100 | #212 | Poor 89.0% |
| Immigrants from Western Asia | 12.3 /100 | #213 | Poor 89.0% |
| Immigrants from Hungary | 11.9 /100 | #214 | Poor 89.0% |
Immigrants from Denmark 1 or more Vehicles in Household Correlation Summary
| Measurement | Immigrants from Denmark Data | 1 or more Vehicles in Household Data |
| Minimum | 0.022% | 78.8% |
| Maximum | 18.6% | 100.0% |
| Range | 18.6% | 21.2% |
| Mean | 2.9% | 94.1% |
| Median | 2.0% | 94.8% |
| Interquartile 25% (IQ1) | 0.92% | 91.7% |
| Interquartile 75% (IQ3) | 3.7% | 100.0% |
| Interquartile Range (IQR) | 2.8% | 8.3% |
| Standard Deviation (Sample) | 3.3% | 5.7% |
| Standard Deviation (Population) | 3.2% | 5.7% |
Correlation Details
| Immigrants from Denmark Percentile | Sample Size | 1 or more Vehicles in Household |
[ 0.0% - 0.5% ] 0.022% | 125,394,530 | 86.9% |
[ 0.0% - 0.5% ] 0.13% | 6,846,348 | 90.0% |
[ 0.0% - 0.5% ] 0.23% | 2,338,296 | 91.7% |
[ 0.0% - 0.5% ] 0.32% | 663,233 | 91.8% |
[ 0.0% - 0.5% ] 0.42% | 361,795 | 94.3% |
[ 0.5% - 1.0% ] 0.52% | 259,815 | 95.1% |
[ 0.5% - 1.0% ] 0.60% | 245,419 | 90.6% |
[ 0.5% - 1.0% ] 0.69% | 64,226 | 94.0% |
[ 0.5% - 1.0% ] 0.78% | 27,818 | 95.4% |
[ 0.5% - 1.0% ] 0.88% | 28,971 | 91.7% |
[ 0.5% - 1.0% ] 0.97% | 17,063 | 91.9% |
[ 1.0% - 1.5% ] 1.07% | 55,566 | 94.9% |
[ 1.0% - 1.5% ] 1.19% | 6,665 | 97.5% |
[ 1.0% - 1.5% ] 1.27% | 30,871 | 85.8% |
[ 1.0% - 1.5% ] 1.33% | 8,333 | 95.2% |
[ 1.0% - 1.5% ] 1.43% | 10,233 | 78.8% |
[ 1.5% - 2.0% ] 1.52% | 11,231 | 97.7% |
[ 1.5% - 2.0% ] 1.60% | 2,505 | 100.0% |
[ 1.5% - 2.0% ] 1.71% | 8,118 | 93.4% |
[ 1.5% - 2.0% ] 1.84% | 544 | 100.0% |
[ 2.0% - 2.5% ] 2.02% | 99 | 88.2% |
[ 2.0% - 2.5% ] 2.13% | 2,489 | 98.5% |
[ 2.0% - 2.5% ] 2.18% | 1,377 | 100.0% |
[ 2.0% - 2.5% ] 2.28% | 3,896 | 91.8% |
[ 2.0% - 2.5% ] 2.40% | 2,211 | 98.3% |
[ 2.5% - 3.0% ] 2.67% | 561 | 94.3% |
[ 2.5% - 3.0% ] 2.70% | 296 | 100.0% |
[ 3.0% - 3.5% ] 3.03% | 66 | 84.2% |
[ 3.0% - 3.5% ] 3.09% | 3,749 | 94.8% |
[ 3.0% - 3.5% ] 3.28% | 396 | 92.8% |
[ 3.5% - 4.0% ] 3.69% | 217 | 100.0% |
[ 3.5% - 4.0% ] 3.77% | 2,040 | 92.6% |
[ 3.5% - 4.0% ] 3.94% | 2,714 | 100.0% |
[ 4.0% - 4.5% ] 4.04% | 99 | 100.0% |
[ 4.5% - 5.0% ] 4.70% | 1,233 | 100.0% |
[ 5.0% - 5.5% ] 5.00% | 40 | 100.0% |
[ 6.5% - 7.0% ] 6.56% | 122 | 82.1% |
[ 6.5% - 7.0% ] 6.80% | 1,132 | 100.0% |
[ 7.0% - 7.5% ] 7.14% | 378 | 82.4% |
[ 8.5% - 9.0% ] 8.64% | 301 | 100.0% |
[ 18.5% - 19.0% ] 18.60% | 43 | 100.0% |