Immigrants from Denmark Married-Couple Family Poverty

COMPARE

Immigrants from Denmark
Race
Ancestry
AfghanAfricanAlaska NativeAlaskan AthabascanAlbanianAleutAlsatianAmericanApacheArabArapahoArgentineanArmenianAssyrian/Chaldean/SyriacAustralianAustrianBahamianBangladeshiBarbadianBasqueBelgianBelizeanBermudanBhutaneseBlackfeetBolivianBrazilianBritishBritish West IndianBulgarianBurmeseCajunCambodianCanadianCape VerdeanCarpatho RusynCelticCentral AmericanCentral American IndianCherokeeCheyenneChickasawChileanChineseChippewaChoctawColombianColvilleComancheCosta RicanCreeCreekCroatianCrowCubanCypriotCzechCzechoslovakianDanishDelawareDominicanDutchDutch West IndianEastern EuropeanEcuadorianEgyptianEnglishEstonianEthiopianEuropeanFijianFilipinoFinnishFrenchFrench American IndianFrench CanadianGermanGerman RussianGhanaianGreekGuamanian/ChamorroGuatemalanGuyaneseHaitianHmongHonduranHopiHoumaHungarianIcelanderIndian (Asian)IndonesianInupiatIranianIraqiIrishIroquoisIsraeliItalianJamaicanJapaneseJordanianKenyanKiowaKoreanLaotianLatvianLebaneseLiberianLithuanianLumbeeLuxembourgerMacedonianMalaysianMalteseMarshalleseMenomineeMexicanMexican American IndianMongolianMoroccanNative HawaiianNavajoNepaleseNew ZealanderNicaraguanNigerianNorthern EuropeanNorwegianOkinawanOsageOttawaPaiutePakistaniPalestinianPanamanianParaguayanPennsylvania GermanPeruvianPimaPolishPortuguesePotawatomiPuebloPuerto RicanPuget Sound SalishRomanianRussianSalvadoranSamoanScandinavianScotch-IrishScottishSeminoleSenegaleseSerbianShoshoneSierra LeoneanSiouxSlavicSlovakSloveneSomaliSouth AfricanSouth AmericanSouth American IndianSoviet UnionSpaniardSpanishSpanish AmericanSpanish American IndianSri LankanSubsaharan AfricanSudaneseSwedishSwissSyrianTaiwaneseThaiTlingit-HaidaTohono O'OdhamTonganTrinidadian and TobagonianTsimshianTurkishU.S. Virgin IslanderUgandanUkrainianUruguayanUteVenezuelanVietnameseWelshWest IndianYakamaYaquiYugoslavianYumanYup'ikZimbabwean
Immigration
NonimmigrantsImmigrantsAfghanistanAfricaAlbaniaArgentinaArmeniaAsiaAustraliaAustriaBahamasBangladeshBarbadosBelarusBelgiumBelizeBoliviaBosnia and HerzegovinaBrazilBulgariaBurma/MyanmarCabo VerdeCambodiaCameroonCanadaCaribbeanCentral AmericaChileChinaColombiaCongoCosta RicaCroatiaCubaCzechoslovakiaDenmarkDominicaDominican RepublicEastern AfricaEastern AsiaEastern EuropeEcuadorEgyptEl SalvadorEnglandEritreaEthiopiaEuropeFijiFranceGermanyGhanaGreeceGrenadaGuatemalaGuyanaHaitiHondurasHong KongHungaryIndiaIndonesiaIranIraqIrelandIsraelItalyJamaicaJapanJordanKazakhstanKenyaKoreaKuwaitLaosLatin AmericaLatviaLebanonLiberiaLithuaniaMalaysiaMexicoMicronesiaMiddle AfricaMoldovaMoroccoNepalNetherlandsNicaraguaNigeriaNorth AmericaNorth MacedoniaNorthern AfricaNorthern EuropeNorwayOceaniaPakistanPanamaPeruPhilippinesPolandPortugalRomaniaRussiaSaudi ArabiaScotlandSenegalSerbiaSierra LeoneSingaporeSomaliaSouth AfricaSouth AmericaSouth Central AsiaSouth Eastern AsiaSouthern EuropeSpainSri LankaSt. Vincent and the GrenadinesSudanSwedenSwitzerlandSyriaTaiwanThailandTrinidad and TobagoTurkeyUgandaUkraineUruguayUzbekistanVenezuelaVietnamWest IndiesWestern AfricaWestern AsiaWestern EuropeYemenZaireZimbabweAzores
Select to Compare
Race
Ancestry
AfghanAfricanAlaska NativeAlaskan AthabascanAlbanianAleutAlsatianAmericanApacheArabArapahoArgentineanArmenianAssyrian/Chaldean/SyriacAustralianAustrianBahamianBangladeshiBarbadianBasqueBelgianBelizeanBermudanBhutaneseBlackfeetBolivianBrazilianBritishBritish West IndianBulgarianBurmeseCajunCambodianCanadianCape VerdeanCarpatho RusynCelticCentral AmericanCentral American IndianCherokeeCheyenneChickasawChileanChineseChippewaChoctawColombianColvilleComancheCosta RicanCreeCreekCroatianCrowCubanCypriotCzechCzechoslovakianDanishDelawareDominicanDutchDutch West IndianEastern EuropeanEcuadorianEgyptianEnglishEstonianEthiopianEuropeanFijianFilipinoFinnishFrenchFrench American IndianFrench CanadianGermanGerman RussianGhanaianGreekGuamanian/ChamorroGuatemalanGuyaneseHaitianHmongHonduranHopiHoumaHungarianIcelanderIndian (Asian)IndonesianInupiatIranianIraqiIrishIroquoisIsraeliItalianJamaicanJapaneseJordanianKenyanKiowaKoreanLaotianLatvianLebaneseLiberianLithuanianLumbeeLuxembourgerMacedonianMalaysianMalteseMarshalleseMenomineeMexicanMexican American IndianMongolianMoroccanNative HawaiianNavajoNepaleseNew ZealanderNicaraguanNigerianNorthern EuropeanNorwegianOkinawanOsageOttawaPaiutePakistaniPalestinianPanamanianParaguayanPennsylvania GermanPeruvianPimaPolishPortuguesePotawatomiPuebloPuerto RicanPuget Sound SalishRomanianRussianSalvadoranSamoanScandinavianScotch-IrishScottishSeminoleSenegaleseSerbianShoshoneSierra LeoneanSiouxSlavicSlovakSloveneSomaliSouth AfricanSouth AmericanSouth American IndianSoviet UnionSpaniardSpanishSpanish AmericanSpanish American IndianSri LankanSubsaharan AfricanSudaneseSwedishSwissSyrianTaiwaneseThaiTlingit-HaidaTohono O'OdhamTonganTrinidadian and TobagonianTsimshianTurkishU.S. Virgin IslanderUgandanUkrainianUruguayanUteVenezuelanVietnameseWelshWest IndianYakamaYaquiYugoslavianYumanYup'ikZimbabwean
Immigration
NonimmigrantsImmigrantsAfghanistanAfricaAlbaniaArgentinaArmeniaAsiaAustraliaAustriaBahamasBangladeshBarbadosBelarusBelgiumBelizeBoliviaBosnia and HerzegovinaBrazilBulgariaBurma/MyanmarCabo VerdeCambodiaCameroonCanadaCaribbeanCentral AmericaChileChinaColombiaCongoCosta RicaCroatiaCubaCzechoslovakiaDominicaDominican RepublicEastern AfricaEastern AsiaEastern EuropeEcuadorEgyptEl SalvadorEnglandEritreaEthiopiaEuropeFijiFranceGermanyGhanaGreeceGrenadaGuatemalaGuyanaHaitiHondurasHong KongHungaryIndiaIndonesiaIranIraqIrelandIsraelItalyJamaicaJapanJordanKazakhstanKenyaKoreaKuwaitLaosLatin AmericaLatviaLebanonLiberiaLithuaniaMalaysiaMexicoMicronesiaMiddle AfricaMoldovaMoroccoNepalNetherlandsNicaraguaNigeriaNorth AmericaNorth MacedoniaNorthern AfricaNorthern EuropeNorwayOceaniaPakistanPanamaPeruPhilippinesPolandPortugalRomaniaRussiaSaudi ArabiaScotlandSenegalSerbiaSierra LeoneSingaporeSomaliaSouth AfricaSouth AmericaSouth Central AsiaSouth Eastern AsiaSouthern EuropeSpainSri LankaSt. Vincent and the GrenadinesSudanSwedenSwitzerlandSyriaTaiwanThailandTrinidad and TobagoTurkeyUgandaUkraineUruguayUzbekistanVenezuelaVietnamWest IndiesWestern AfricaWestern AsiaWestern EuropeYemenZaireZimbabweAzores
Married-Couple Family Poverty
Income
Poverty
Unemployment
Labor Participation
Family Structure
Vehicle Availability
Education Level
Disability

Immigrants from Denmark Married-Couple Family Poverty
Exceptional

4.6%
POVERTY | MARRIED-COUPLE FAMILIES
98.8/ 100
METRIC RATING
83rd/ 347
METRIC RANK

Immigrants from Denmark Married-Couple Family Poverty Correlation Chart

The statistical analysis conducted on geographies consisting of 135,843,951 people shows a strong positive correlation between the proportion of Immigrants from Denmark and poverty level among married-couple families in the United States with a correlation coefficient (R) of 0.755 and weighted average of 4.6%. On average, for every 1% (one percent) increase in Immigrants from Denmark within a typical geography, there is an increase of 4.3% in poverty level among married-couple families.
Immigrants from Denmark Married-Couple Family Poverty
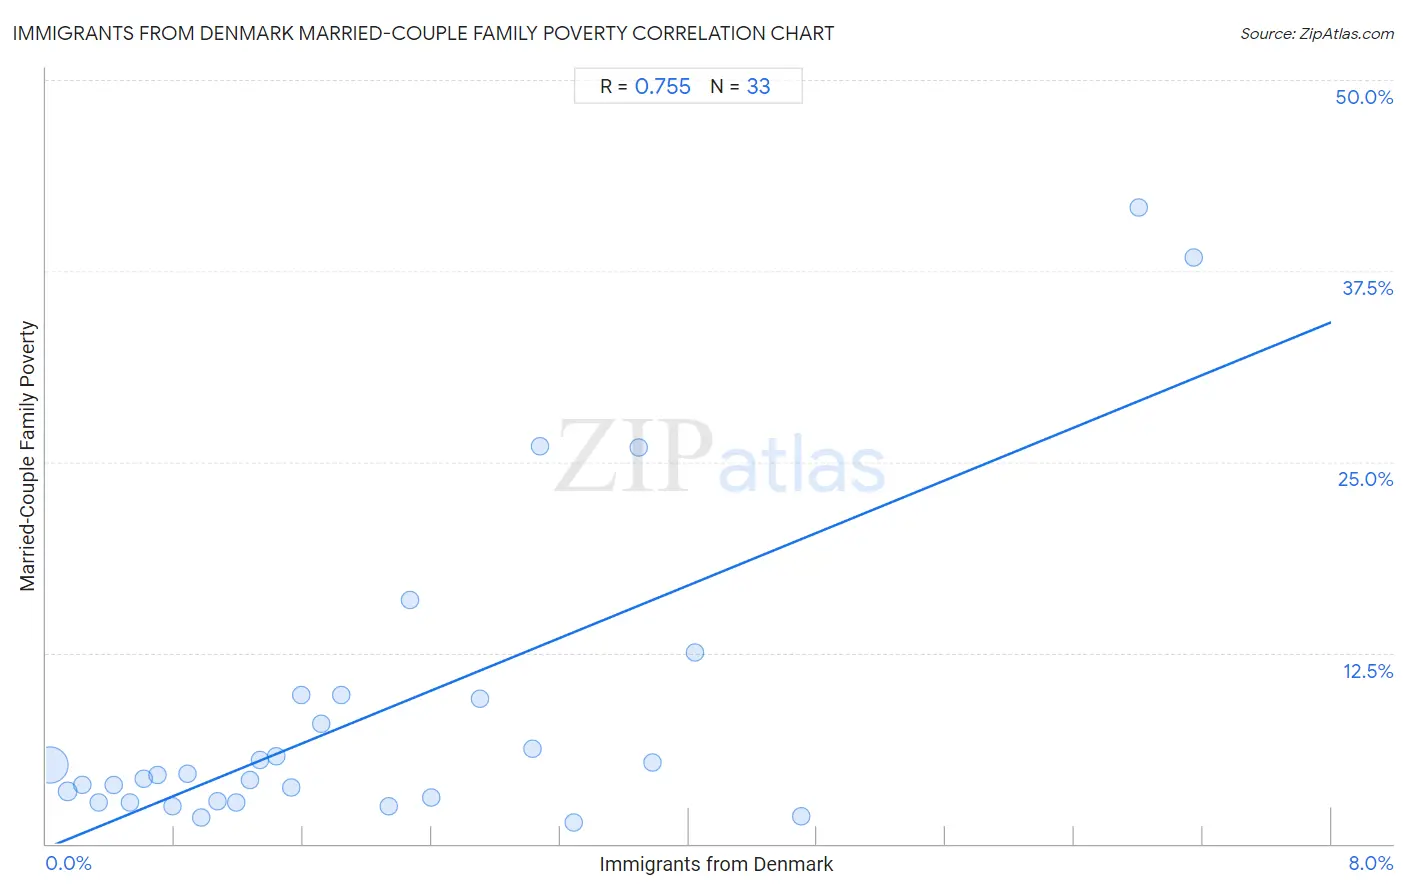
It is essential to understand that the correlation between the percentage of Immigrants from Denmark and poverty level among married-couple families does not imply a direct cause-and-effect relationship. It remains uncertain whether the presence of Immigrants from Denmark influences an upward or downward trend in the level of poverty level among married-couple families within an area, or if Immigrants from Denmark simply ended up residing in those areas with higher or lower levels of poverty level among married-couple families due to other factors.

Demographics Similar to Immigrants from Denmark by Married-Couple Family Poverty

In terms of married-couple family poverty, the demographic groups most similar to Immigrants from Denmark are Immigrants from Croatia (4.6%, a difference of 0.13%), Canadian (4.5%, a difference of 0.16%), South African (4.6%, a difference of 0.36%), Immigrants from Turkey (4.6%, a difference of 0.40%), and Immigrants from Greece (4.5%, a difference of 0.41%).
DemographicsRating | RankMarried-Couple Family Poverty
Immigrants from South Africa
99.1
/100
|
#76
Exceptional
4.5%
Immigrants from Latvia
99.1
/100
|
#77
Exceptional
4.5%
Scotch-Irish
99.1
/100
|
#78
Exceptional
4.5%
Immigrants from Iran
99.0
/100
|
#79
Exceptional
4.5%
Icelanders
99.0
/100
|
#80
Exceptional
4.5%
Immigrants from Greece
98.9
/100
|
#81
Exceptional
4.5%
Canadians
98.8
/100
|
#82
Exceptional
4.5%
Immigrants from Denmark
98.8
/100
|
#83
Exceptional
4.6%
Immigrants from Croatia
98.7
/100
|
#84
Exceptional
4.6%
South Africans
98.7
/100
|
#85
Exceptional
4.6%
Immigrants from Turkey
98.6
/100
|
#86
Exceptional
4.6%
Immigrants from North Macedonia
98.6
/100
|
#87
Exceptional
4.6%
Bolivians
98.6
/100
|
#88
Exceptional
4.6%
Immigrants from Czechoslovakia
98.5
/100
|
#89
Exceptional
4.6%
Immigrants from Switzerland
98.5
/100
|
#90
Exceptional
4.6%

Immigrants from Denmark Married-Couple Family Poverty Correlation Summary

MeasurementImmigrants from Denmark DataMarried-Couple Family Poverty Data
Minimum0.022%1.4%
Maximum7.1%41.7%
Range7.1%40.3%
Mean2.0%8.5%
Median1.5%4.5%
Interquartile 25% (IQ1)0.74%2.8%
Interquartile 75% (IQ3)3.1%9.6%
Interquartile Range (IQR)2.3%6.8%
Standard Deviation (Sample)1.8%10.1%
Standard Deviation (Population)1.7%9.9%

Correlation Details

Immigrants from Denmark PercentileSample SizeMarried-Couple Family Poverty
[
0.0%
-
0.5%
]
0.022%
125,289,3575.2%
[
0.0%
-
0.5%
]
0.13%
6,676,2123.4%
[
0.0%
-
0.5%
]
0.23%
2,231,1853.9%
[
0.0%
-
0.5%
]
0.32%
604,8552.7%
[
0.0%
-
0.5%
]
0.42%
321,3813.8%
[
0.5%
-
1.0%
]
0.52%
240,4952.7%
[
0.5%
-
1.0%
]
0.60%
236,0624.3%
[
0.5%
-
1.0%
]
0.69%
52,9784.5%
[
0.5%
-
1.0%
]
0.78%
18,0272.5%
[
0.5%
-
1.0%
]
0.88%
26,3554.6%
[
0.5%
-
1.0%
]
0.97%
11,1581.7%
[
1.0%
-
1.5%
]
1.07%
49,1502.8%
[
1.0%
-
1.5%
]
1.19%
6,6652.7%
[
1.0%
-
1.5%
]
1.27%
30,7154.1%
[
1.0%
-
1.5%
]
1.33%
8,2605.5%
[
1.0%
-
1.5%
]
1.43%
8,4485.8%
[
1.5%
-
2.0%
]
1.52%
10,3743.7%
[
1.5%
-
2.0%
]
1.59%
2,2659.7%
[
1.5%
-
2.0%
]
1.71%
7,7687.8%
[
1.5%
-
2.0%
]
1.84%
5449.8%
[
2.0%
-
2.5%
]
2.13%
2,4892.5%
[
2.0%
-
2.5%
]
2.26%
61916.0%
[
2.0%
-
2.5%
]
2.40%
2,2113.0%
[
2.5%
-
3.0%
]
2.70%
2969.5%
[
3.0%
-
3.5%
]
3.03%
666.2%
[
3.0%
-
3.5%
]
3.07%
52126.0%
[
3.0%
-
3.5%
]
3.28%
3961.4%
[
3.5%
-
4.0%
]
3.69%
21725.9%
[
3.5%
-
4.0%
]
3.77%
2,0405.3%
[
4.0%
-
4.5%
]
4.04%
9912.5%
[
4.5%
-
5.0%
]
4.70%
1,2331.8%
[
6.5%
-
7.0%
]
6.80%
1,13241.7%
[
7.0%
-
7.5%
]
7.14%
37838.4%