Immigrants from Congo Disability Age 5 to 17
COMPARE
Immigrants from Congo
Select to Compare
Disability Age 5 to 17
Immigrants from Congo Disability Age 5 to 17
6.2%
DISABILITY | AGE 5 TO 17
0.0/ 100
METRIC RATING
290th/ 347
METRIC RANK
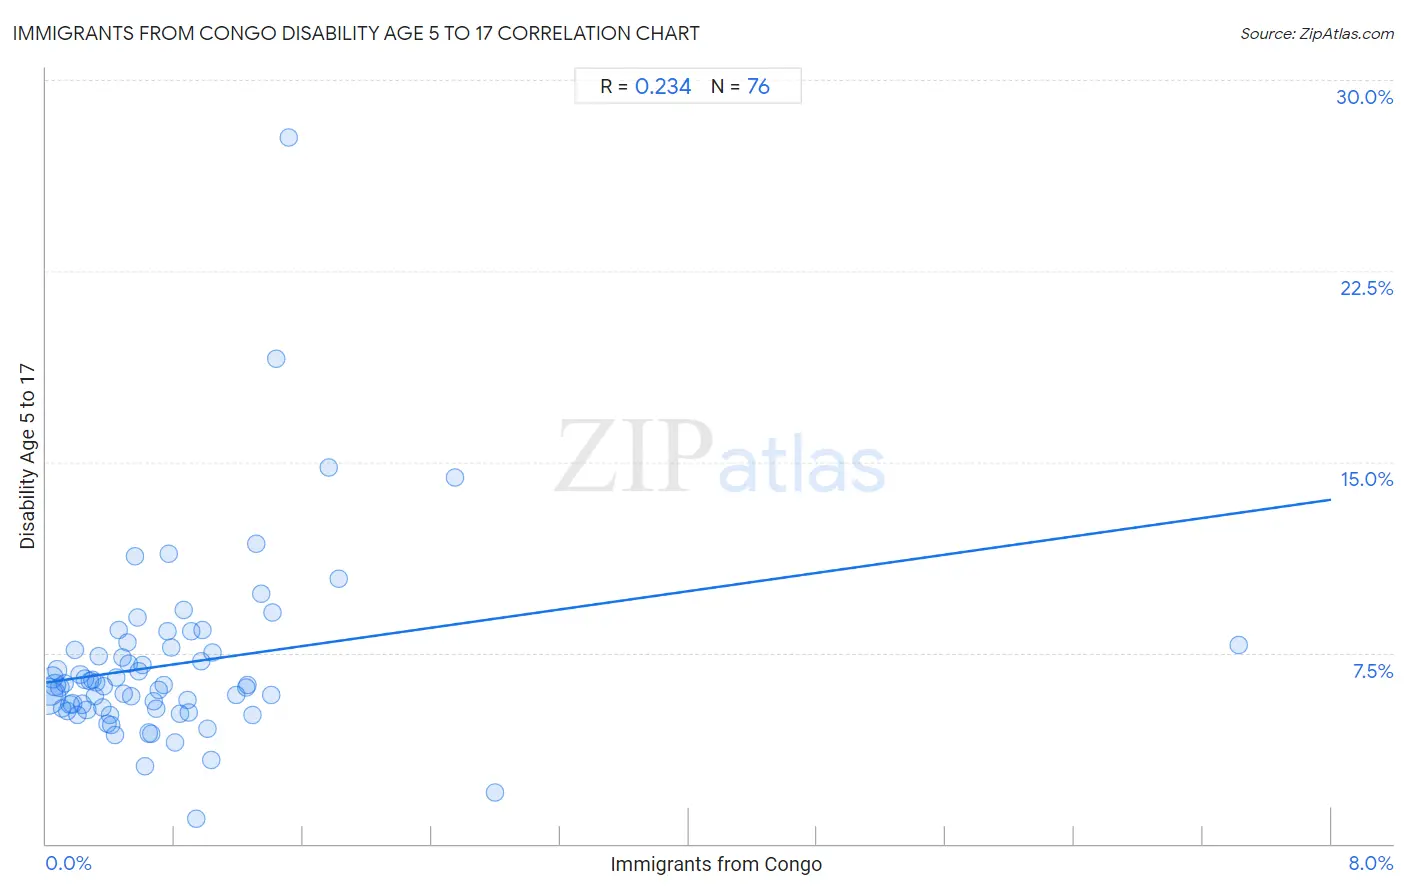
Immigrants from Congo Disability Age 5 to 17 Correlation Chart
The statistical analysis conducted on geographies consisting of 91,997,133 people shows a weak positive correlation between the proportion of Immigrants from Congo and percentage of population with a disability between the ages 5 and 17 in the United States with a correlation coefficient (R) of 0.234 and weighted average of 6.2%. On average, for every 1% (one percent) increase in Immigrants from Congo within a typical geography, there is an increase of 0.90% in percentage of population with a disability between the ages 5 and 17.
It is essential to understand that the correlation between the percentage of Immigrants from Congo and percentage of population with a disability between the ages 5 and 17 does not imply a direct cause-and-effect relationship. It remains uncertain whether the presence of Immigrants from Congo influences an upward or downward trend in the level of percentage of population with a disability between the ages 5 and 17 within an area, or if Immigrants from Congo simply ended up residing in those areas with higher or lower levels of percentage of population with a disability between the ages 5 and 17 due to other factors.
Demographics Similar to Immigrants from Congo by Disability Age 5 to 17
In terms of disability age 5 to 17, the demographic groups most similar to Immigrants from Congo are Yaqui (6.2%, a difference of 0.0%), Jamaican (6.2%, a difference of 0.010%), White/Caucasian (6.2%, a difference of 0.15%), Pima (6.2%, a difference of 0.27%), and Immigrants from Senegal (6.2%, a difference of 0.39%).
| Demographics | Rating | Rank | Disability Age 5 to 17 |
| Ugandans | 0.0 /100 | #283 | Tragic 6.2% |
| Sub-Saharan Africans | 0.0 /100 | #284 | Tragic 6.2% |
| English | 0.0 /100 | #285 | Tragic 6.2% |
| Colville | 0.0 /100 | #286 | Tragic 6.2% |
| Pima | 0.0 /100 | #287 | Tragic 6.2% |
| Jamaicans | 0.0 /100 | #288 | Tragic 6.2% |
| Yaqui | 0.0 /100 | #289 | Tragic 6.2% |
| Immigrants from Congo | 0.0 /100 | #290 | Tragic 6.2% |
| Whites/Caucasians | 0.0 /100 | #291 | Tragic 6.2% |
| Immigrants from Senegal | 0.0 /100 | #292 | Tragic 6.2% |
| Central American Indians | 0.0 /100 | #293 | Tragic 6.2% |
| Irish | 0.0 /100 | #294 | Tragic 6.2% |
| Cree | 0.0 /100 | #295 | Tragic 6.2% |
| Spanish Americans | 0.0 /100 | #296 | Tragic 6.2% |
| Immigrants from Bahamas | 0.0 /100 | #297 | Tragic 6.2% |
Immigrants from Congo Disability Age 5 to 17 Correlation Summary
| Measurement | Immigrants from Congo Data | Disability Age 5 to 17 Data |
| Minimum | 0.0062% | 0.97% |
| Maximum | 7.4% | 27.7% |
| Range | 7.4% | 26.7% |
| Mean | 0.78% | 7.0% |
| Median | 0.59% | 6.2% |
| Interquartile 25% (IQ1) | 0.29% | 5.3% |
| Interquartile 75% (IQ3) | 0.97% | 7.7% |
| Interquartile Range (IQR) | 0.68% | 2.3% |
| Standard Deviation (Sample) | 0.95% | 3.6% |
| Standard Deviation (Population) | 0.94% | 3.6% |
Correlation Details
| Immigrants from Congo Percentile | Sample Size | Disability Age 5 to 17 |
[ 0.0% - 0.5% ] 0.0062% | 37,721,903 | 5.8% |
[ 0.0% - 0.5% ] 0.023% | 14,247,878 | 5.9% |
[ 0.0% - 0.5% ] 0.036% | 7,786,427 | 6.6% |
[ 0.0% - 0.5% ] 0.054% | 7,578,815 | 6.2% |
[ 0.0% - 0.5% ] 0.069% | 3,537,633 | 6.8% |
[ 0.0% - 0.5% ] 0.084% | 3,247,218 | 6.1% |
[ 0.0% - 0.5% ] 0.099% | 1,384,333 | 5.3% |
[ 0.0% - 0.5% ] 0.12% | 1,443,078 | 6.3% |
[ 0.0% - 0.5% ] 0.13% | 722,416 | 5.2% |
[ 0.0% - 0.5% ] 0.14% | 2,319,840 | 5.5% |
[ 0.0% - 0.5% ] 0.16% | 2,345,221 | 5.5% |
[ 0.0% - 0.5% ] 0.18% | 358,173 | 7.6% |
[ 0.0% - 0.5% ] 0.19% | 291,198 | 5.1% |
[ 0.0% - 0.5% ] 0.21% | 1,888,580 | 6.7% |
[ 0.0% - 0.5% ] 0.22% | 434,808 | 5.5% |
[ 0.0% - 0.5% ] 0.24% | 760,186 | 6.5% |
[ 0.0% - 0.5% ] 0.25% | 494,504 | 5.3% |
[ 0.0% - 0.5% ] 0.27% | 585,341 | 6.4% |
[ 0.0% - 0.5% ] 0.28% | 531,490 | 6.4% |
[ 0.0% - 0.5% ] 0.30% | 401,793 | 5.8% |
[ 0.0% - 0.5% ] 0.31% | 383,162 | 6.3% |
[ 0.0% - 0.5% ] 0.33% | 213,823 | 7.4% |
[ 0.0% - 0.5% ] 0.35% | 286,907 | 5.4% |
[ 0.0% - 0.5% ] 0.36% | 139,418 | 6.2% |
[ 0.0% - 0.5% ] 0.38% | 157,310 | 4.7% |
[ 0.0% - 0.5% ] 0.40% | 191,448 | 5.0% |
[ 0.0% - 0.5% ] 0.41% | 123,241 | 4.7% |
[ 0.0% - 0.5% ] 0.42% | 101,543 | 4.3% |
[ 0.0% - 0.5% ] 0.44% | 38,403 | 6.5% |
[ 0.0% - 0.5% ] 0.45% | 26,580 | 8.4% |
[ 0.0% - 0.5% ] 0.47% | 129,375 | 7.3% |
[ 0.0% - 0.5% ] 0.48% | 179,621 | 5.9% |
[ 0.5% - 1.0% ] 0.50% | 9,536 | 7.9% |
[ 0.5% - 1.0% ] 0.51% | 22,546 | 7.0% |
[ 0.5% - 1.0% ] 0.53% | 131,929 | 5.8% |
[ 0.5% - 1.0% ] 0.55% | 27,636 | 11.3% |
[ 0.5% - 1.0% ] 0.56% | 93,317 | 8.9% |
[ 0.5% - 1.0% ] 0.58% | 27,652 | 6.8% |
[ 0.5% - 1.0% ] 0.60% | 38,225 | 7.0% |
[ 0.5% - 1.0% ] 0.62% | 71,065 | 3.1% |
[ 0.5% - 1.0% ] 0.64% | 119,806 | 4.3% |
[ 0.5% - 1.0% ] 0.66% | 24,398 | 4.3% |
[ 0.5% - 1.0% ] 0.67% | 69,456 | 5.6% |
[ 0.5% - 1.0% ] 0.68% | 89,464 | 5.3% |
[ 0.5% - 1.0% ] 0.70% | 63,508 | 6.0% |
[ 0.5% - 1.0% ] 0.74% | 37,809 | 6.2% |
[ 0.5% - 1.0% ] 0.75% | 60,937 | 8.4% |
[ 0.5% - 1.0% ] 0.76% | 96,559 | 11.4% |
[ 0.5% - 1.0% ] 0.78% | 82,734 | 7.7% |
[ 0.5% - 1.0% ] 0.80% | 91,037 | 4.0% |
[ 0.5% - 1.0% ] 0.83% | 26,837 | 5.1% |
[ 0.5% - 1.0% ] 0.86% | 92,643 | 9.2% |
[ 0.5% - 1.0% ] 0.88% | 56,935 | 5.6% |
[ 0.5% - 1.0% ] 0.89% | 27,865 | 5.1% |
[ 0.5% - 1.0% ] 0.90% | 45,419 | 8.4% |
[ 0.5% - 1.0% ] 0.93% | 9,217 | 0.97% |
[ 0.5% - 1.0% ] 0.96% | 90,227 | 7.2% |
[ 0.5% - 1.0% ] 0.97% | 11,081 | 8.4% |
[ 1.0% - 1.5% ] 1.01% | 43,653 | 4.5% |
[ 1.0% - 1.5% ] 1.03% | 64,713 | 3.3% |
[ 1.0% - 1.5% ] 1.04% | 12,355 | 7.5% |
[ 1.0% - 1.5% ] 1.18% | 54,017 | 5.8% |
[ 1.0% - 1.5% ] 1.25% | 40,527 | 6.1% |
[ 1.0% - 1.5% ] 1.26% | 80,672 | 6.2% |
[ 1.0% - 1.5% ] 1.28% | 24,892 | 5.1% |
[ 1.0% - 1.5% ] 1.31% | 13,510 | 11.8% |
[ 1.0% - 1.5% ] 1.34% | 14,363 | 9.8% |
[ 1.0% - 1.5% ] 1.40% | 38,441 | 5.8% |
[ 1.0% - 1.5% ] 1.41% | 13,295 | 9.1% |
[ 1.0% - 1.5% ] 1.43% | 7,666 | 19.0% |
[ 1.5% - 2.0% ] 1.51% | 2,912 | 27.7% |
[ 1.5% - 2.0% ] 1.76% | 2,846 | 14.8% |
[ 1.5% - 2.0% ] 1.82% | 1,483 | 10.4% |
[ 2.5% - 3.0% ] 2.55% | 1,885 | 14.4% |
[ 2.5% - 3.0% ] 2.79% | 5,590 | 2.0% |
[ 7.0% - 7.5% ] 7.42% | 4,809 | 7.8% |