Immigrants from Congo Married-Couple Family Poverty
COMPARE
Immigrants from Congo
Select to Compare
Married-Couple Family Poverty
Immigrants from Congo Married-Couple Family Poverty
6.1%
POVERTY | MARRIED-COUPLE FAMILIES
0.2/ 100
METRIC RATING
264th/ 347
METRIC RANK
Immigrants from Congo Married-Couple Family Poverty Correlation Chart
The statistical analysis conducted on geographies consisting of 91,968,062 people shows a moderate positive correlation between the proportion of Immigrants from Congo and poverty level among married-couple families in the United States with a correlation coefficient (R) of 0.407 and weighted average of 6.1%. On average, for every 1% (one percent) increase in Immigrants from Congo within a typical geography, there is an increase of 3.6% in poverty level among married-couple families.
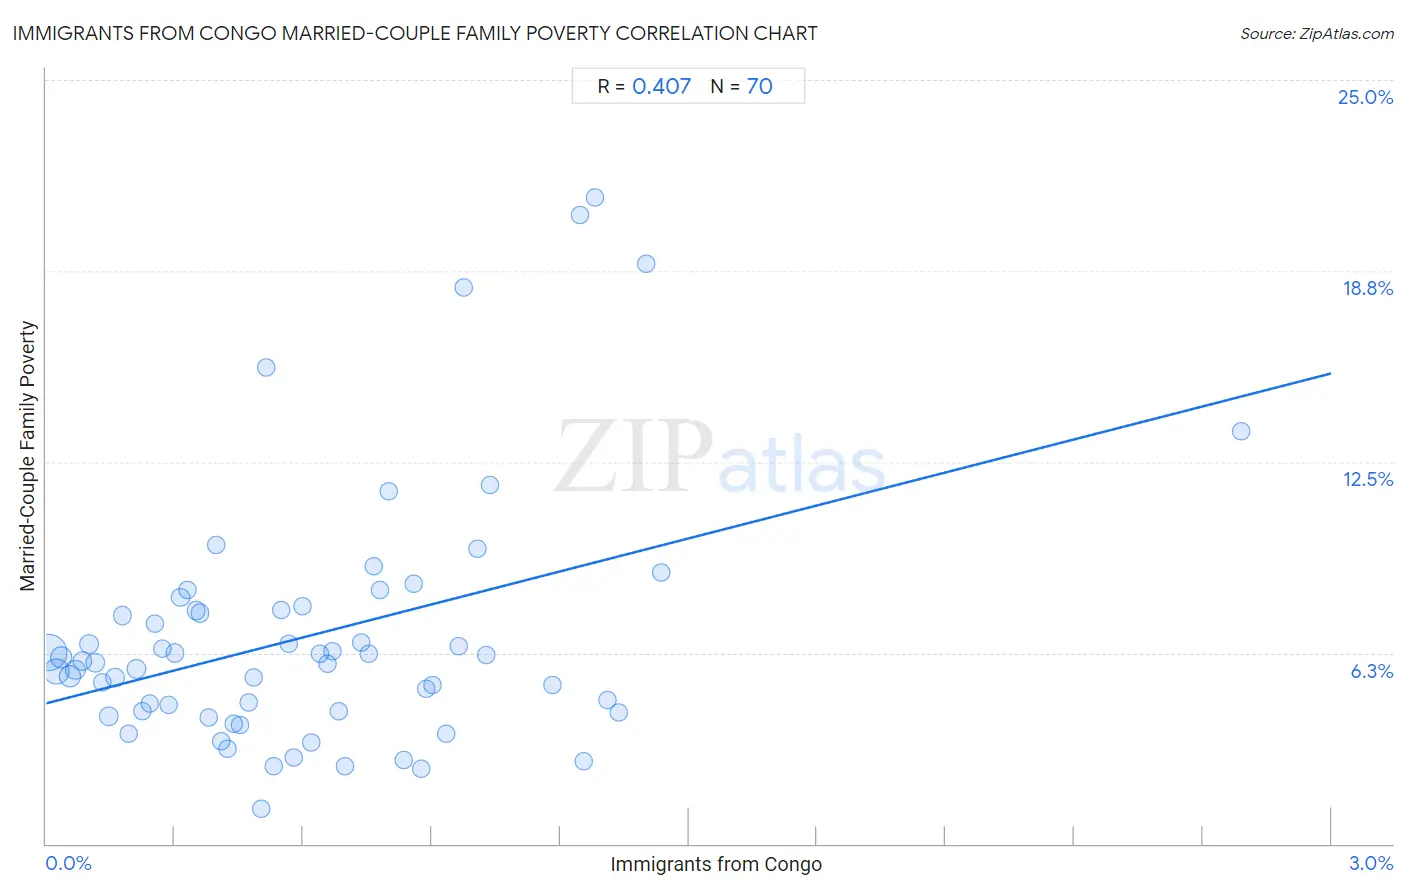
It is essential to understand that the correlation between the percentage of Immigrants from Congo and poverty level among married-couple families does not imply a direct cause-and-effect relationship. It remains uncertain whether the presence of Immigrants from Congo influences an upward or downward trend in the level of poverty level among married-couple families within an area, or if Immigrants from Congo simply ended up residing in those areas with higher or lower levels of poverty level among married-couple families due to other factors.
Demographics Similar to Immigrants from Congo by Married-Couple Family Poverty
In terms of married-couple family poverty, the demographic groups most similar to Immigrants from Congo are Immigrants from Senegal (6.1%, a difference of 0.22%), Blackfeet (6.2%, a difference of 0.43%), Creek (6.2%, a difference of 0.51%), Spanish American (6.2%, a difference of 0.56%), and Shoshone (6.1%, a difference of 0.62%).
| Demographics | Rating | Rank | Married-Couple Family Poverty |
| Immigrants from Burma/Myanmar | 0.5 /100 | #257 | Tragic 6.0% |
| Immigrants | 0.5 /100 | #258 | Tragic 6.0% |
| Alaskan Athabascans | 0.4 /100 | #259 | Tragic 6.1% |
| Jamaicans | 0.3 /100 | #260 | Tragic 6.1% |
| Senegalese | 0.3 /100 | #261 | Tragic 6.1% |
| Shoshone | 0.3 /100 | #262 | Tragic 6.1% |
| Immigrants from Senegal | 0.3 /100 | #263 | Tragic 6.1% |
| Immigrants from Congo | 0.2 /100 | #264 | Tragic 6.1% |
| Blackfeet | 0.2 /100 | #265 | Tragic 6.2% |
| Creek | 0.2 /100 | #266 | Tragic 6.2% |
| Spanish Americans | 0.2 /100 | #267 | Tragic 6.2% |
| Alaska Natives | 0.2 /100 | #268 | Tragic 6.2% |
| Immigrants from West Indies | 0.1 /100 | #269 | Tragic 6.2% |
| Immigrants from Jamaica | 0.1 /100 | #270 | Tragic 6.2% |
| Immigrants from Bahamas | 0.1 /100 | #271 | Tragic 6.2% |
Immigrants from Congo Married-Couple Family Poverty Correlation Summary
| Measurement | Immigrants from Congo Data | Married-Couple Family Poverty Data |
| Minimum | 0.0062% | 1.1% |
| Maximum | 2.8% | 21.1% |
| Range | 2.8% | 20.0% |
| Mean | 0.62% | 6.8% |
| Median | 0.54% | 6.0% |
| Interquartile 25% (IQ1) | 0.27% | 4.3% |
| Interquartile 75% (IQ3) | 0.88% | 7.7% |
| Interquartile Range (IQR) | 0.61% | 3.3% |
| Standard Deviation (Sample) | 0.47% | 4.1% |
| Standard Deviation (Population) | 0.46% | 4.1% |
Correlation Details
| Immigrants from Congo Percentile | Sample Size | Married-Couple Family Poverty |
[ 0.0% - 0.5% ] 0.0062% | 37,711,743 | 6.3% |
[ 0.0% - 0.5% ] 0.023% | 14,262,825 | 5.6% |
[ 0.0% - 0.5% ] 0.036% | 7,808,956 | 6.1% |
[ 0.0% - 0.5% ] 0.054% | 7,580,812 | 5.5% |
[ 0.0% - 0.5% ] 0.069% | 3,527,985 | 5.7% |
[ 0.0% - 0.5% ] 0.084% | 3,247,218 | 6.0% |
[ 0.0% - 0.5% ] 0.099% | 1,373,848 | 6.5% |
[ 0.0% - 0.5% ] 0.12% | 1,443,078 | 5.9% |
[ 0.0% - 0.5% ] 0.13% | 722,416 | 5.3% |
[ 0.0% - 0.5% ] 0.14% | 2,336,142 | 4.2% |
[ 0.0% - 0.5% ] 0.16% | 2,347,600 | 5.4% |
[ 0.0% - 0.5% ] 0.18% | 351,077 | 7.5% |
[ 0.0% - 0.5% ] 0.19% | 291,198 | 3.6% |
[ 0.0% - 0.5% ] 0.21% | 1,888,580 | 5.7% |
[ 0.0% - 0.5% ] 0.22% | 418,382 | 4.3% |
[ 0.0% - 0.5% ] 0.24% | 760,186 | 4.6% |
[ 0.0% - 0.5% ] 0.25% | 496,880 | 7.2% |
[ 0.0% - 0.5% ] 0.27% | 585,341 | 6.4% |
[ 0.0% - 0.5% ] 0.28% | 531,490 | 4.5% |
[ 0.0% - 0.5% ] 0.30% | 398,729 | 6.2% |
[ 0.0% - 0.5% ] 0.31% | 383,162 | 8.0% |
[ 0.0% - 0.5% ] 0.33% | 213,823 | 8.3% |
[ 0.0% - 0.5% ] 0.35% | 286,907 | 7.6% |
[ 0.0% - 0.5% ] 0.36% | 146,758 | 7.5% |
[ 0.0% - 0.5% ] 0.38% | 157,310 | 4.1% |
[ 0.0% - 0.5% ] 0.40% | 181,010 | 9.8% |
[ 0.0% - 0.5% ] 0.41% | 123,241 | 3.4% |
[ 0.0% - 0.5% ] 0.42% | 101,543 | 3.1% |
[ 0.0% - 0.5% ] 0.44% | 38,403 | 3.9% |
[ 0.0% - 0.5% ] 0.45% | 28,970 | 3.9% |
[ 0.0% - 0.5% ] 0.47% | 129,375 | 4.6% |
[ 0.0% - 0.5% ] 0.48% | 179,621 | 5.4% |
[ 0.5% - 1.0% ] 0.50% | 7,766 | 1.1% |
[ 0.5% - 1.0% ] 0.51% | 22,546 | 15.6% |
[ 0.5% - 1.0% ] 0.53% | 131,929 | 2.5% |
[ 0.5% - 1.0% ] 0.55% | 27,636 | 7.7% |
[ 0.5% - 1.0% ] 0.56% | 94,019 | 6.5% |
[ 0.5% - 1.0% ] 0.58% | 27,652 | 2.8% |
[ 0.5% - 1.0% ] 0.60% | 38,225 | 7.8% |
[ 0.5% - 1.0% ] 0.62% | 71,872 | 3.3% |
[ 0.5% - 1.0% ] 0.64% | 119,806 | 6.2% |
[ 0.5% - 1.0% ] 0.66% | 23,636 | 5.9% |
[ 0.5% - 1.0% ] 0.67% | 69,456 | 6.3% |
[ 0.5% - 1.0% ] 0.68% | 88,307 | 4.4% |
[ 0.5% - 1.0% ] 0.70% | 63,508 | 2.5% |
[ 0.5% - 1.0% ] 0.74% | 37,809 | 6.6% |
[ 0.5% - 1.0% ] 0.75% | 60,937 | 6.2% |
[ 0.5% - 1.0% ] 0.76% | 96,559 | 9.1% |
[ 0.5% - 1.0% ] 0.78% | 82,734 | 8.3% |
[ 0.5% - 1.0% ] 0.80% | 88,147 | 11.5% |
[ 0.5% - 1.0% ] 0.83% | 26,837 | 2.7% |
[ 0.5% - 1.0% ] 0.86% | 92,643 | 8.5% |
[ 0.5% - 1.0% ] 0.88% | 56,935 | 2.5% |
[ 0.5% - 1.0% ] 0.89% | 27,865 | 5.1% |
[ 0.5% - 1.0% ] 0.90% | 45,419 | 5.2% |
[ 0.5% - 1.0% ] 0.93% | 9,217 | 3.6% |
[ 0.5% - 1.0% ] 0.96% | 90,227 | 6.5% |
[ 0.5% - 1.0% ] 0.97% | 11,081 | 18.2% |
[ 1.0% - 1.5% ] 1.01% | 43,653 | 9.6% |
[ 1.0% - 1.5% ] 1.03% | 64,713 | 6.2% |
[ 1.0% - 1.5% ] 1.04% | 12,355 | 11.7% |
[ 1.0% - 1.5% ] 1.18% | 54,017 | 5.2% |
[ 1.0% - 1.5% ] 1.25% | 40,527 | 20.6% |
[ 1.0% - 1.5% ] 1.26% | 80,672 | 2.7% |
[ 1.0% - 1.5% ] 1.28% | 24,892 | 21.1% |
[ 1.0% - 1.5% ] 1.31% | 13,510 | 4.7% |
[ 1.0% - 1.5% ] 1.34% | 14,363 | 4.3% |
[ 1.0% - 1.5% ] 1.40% | 38,441 | 19.0% |
[ 1.0% - 1.5% ] 1.43% | 7,666 | 8.9% |
[ 2.5% - 3.0% ] 2.79% | 5,876 | 13.5% |