Immigrants from Congo Self-Care Disability
COMPARE
Immigrants from Congo
Select to Compare
Self-Care Disability
Immigrants from Congo Self-Care Disability
2.4%
SELF-CARE DISABILITY
98.0/ 100
METRIC RATING
89th/ 347
METRIC RANK
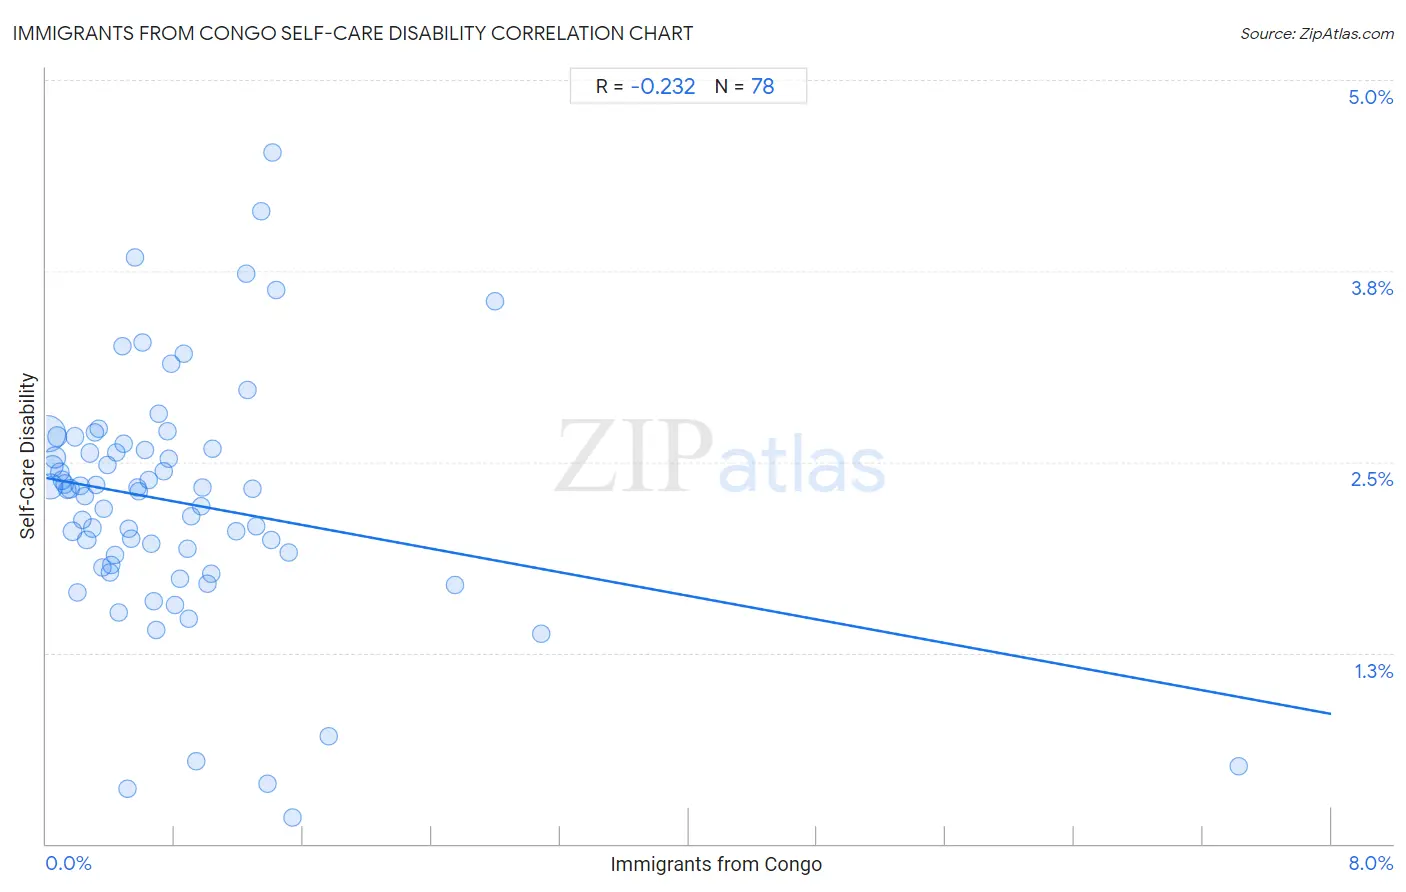
Immigrants from Congo Self-Care Disability Correlation Chart
The statistical analysis conducted on geographies consisting of 92,100,672 people shows a weak negative correlation between the proportion of Immigrants from Congo and percentage of population with self-care disability in the United States with a correlation coefficient (R) of -0.232 and weighted average of 2.4%. On average, for every 1% (one percent) increase in Immigrants from Congo within a typical geography, there is a decrease of 0.19% in percentage of population with self-care disability.
It is essential to understand that the correlation between the percentage of Immigrants from Congo and percentage of population with self-care disability does not imply a direct cause-and-effect relationship. It remains uncertain whether the presence of Immigrants from Congo influences an upward or downward trend in the level of percentage of population with self-care disability within an area, or if Immigrants from Congo simply ended up residing in those areas with higher or lower levels of percentage of population with self-care disability due to other factors.
Demographics Similar to Immigrants from Congo by Self-Care Disability
In terms of self-care disability, the demographic groups most similar to Immigrants from Congo are Sierra Leonean (2.4%, a difference of 0.050%), Lithuanian (2.4%, a difference of 0.050%), Immigrants from Czechoslovakia (2.4%, a difference of 0.14%), Immigrants from Jordan (2.4%, a difference of 0.15%), and Immigrants from Northern Africa (2.3%, a difference of 0.19%).
| Demographics | Rating | Rank | Self-Care Disability |
| Immigrants from Denmark | 98.8 /100 | #82 | Exceptional 2.3% |
| Indians (Asian) | 98.7 /100 | #83 | Exceptional 2.3% |
| Immigrants from Spain | 98.7 /100 | #84 | Exceptional 2.3% |
| Estonians | 98.3 /100 | #85 | Exceptional 2.3% |
| Immigrants from Northern Africa | 98.2 /100 | #86 | Exceptional 2.3% |
| Sierra Leoneans | 98.0 /100 | #87 | Exceptional 2.4% |
| Lithuanians | 98.0 /100 | #88 | Exceptional 2.4% |
| Immigrants from Congo | 98.0 /100 | #89 | Exceptional 2.4% |
| Immigrants from Czechoslovakia | 97.7 /100 | #90 | Exceptional 2.4% |
| Immigrants from Jordan | 97.7 /100 | #91 | Exceptional 2.4% |
| Icelanders | 97.4 /100 | #92 | Exceptional 2.4% |
| Immigrants from Latvia | 97.0 /100 | #93 | Exceptional 2.4% |
| Macedonians | 96.9 /100 | #94 | Exceptional 2.4% |
| Immigrants from Asia | 96.9 /100 | #95 | Exceptional 2.4% |
| Immigrants from Chile | 96.7 /100 | #96 | Exceptional 2.4% |
Immigrants from Congo Self-Care Disability Correlation Summary
| Measurement | Immigrants from Congo Data | Self-Care Disability Data |
| Minimum | 0.0062% | 0.17% |
| Maximum | 7.4% | 4.5% |
| Range | 7.4% | 4.4% |
| Mean | 0.82% | 2.2% |
| Median | 0.61% | 2.3% |
| Interquartile 25% (IQ1) | 0.30% | 1.8% |
| Interquartile 75% (IQ3) | 1.0% | 2.6% |
| Interquartile Range (IQR) | 0.71% | 0.76% |
| Standard Deviation (Sample) | 0.97% | 0.81% |
| Standard Deviation (Population) | 0.96% | 0.80% |
Correlation Details
| Immigrants from Congo Percentile | Sample Size | Self-Care Disability |
[ 0.0% - 0.5% ] 0.0062% | 37,721,903 | 2.7% |
[ 0.0% - 0.5% ] 0.023% | 14,273,728 | 2.3% |
[ 0.0% - 0.5% ] 0.036% | 7,808,956 | 2.5% |
[ 0.0% - 0.5% ] 0.054% | 7,580,812 | 2.5% |
[ 0.0% - 0.5% ] 0.069% | 3,537,633 | 2.7% |
[ 0.0% - 0.5% ] 0.084% | 3,247,218 | 2.4% |
[ 0.0% - 0.5% ] 0.099% | 1,384,333 | 2.4% |
[ 0.0% - 0.5% ] 0.12% | 1,443,078 | 2.4% |
[ 0.0% - 0.5% ] 0.13% | 728,227 | 2.3% |
[ 0.0% - 0.5% ] 0.14% | 2,336,142 | 2.3% |
[ 0.0% - 0.5% ] 0.16% | 2,348,236 | 2.0% |
[ 0.0% - 0.5% ] 0.18% | 367,442 | 2.7% |
[ 0.0% - 0.5% ] 0.19% | 291,198 | 1.6% |
[ 0.0% - 0.5% ] 0.21% | 1,888,580 | 2.3% |
[ 0.0% - 0.5% ] 0.22% | 434,808 | 2.1% |
[ 0.0% - 0.5% ] 0.24% | 760,186 | 2.3% |
[ 0.0% - 0.5% ] 0.25% | 496,880 | 2.0% |
[ 0.0% - 0.5% ] 0.27% | 585,341 | 2.6% |
[ 0.0% - 0.5% ] 0.28% | 531,836 | 2.1% |
[ 0.0% - 0.5% ] 0.30% | 401,793 | 2.7% |
[ 0.0% - 0.5% ] 0.31% | 383,162 | 2.3% |
[ 0.0% - 0.5% ] 0.33% | 212,045 | 2.7% |
[ 0.0% - 0.5% ] 0.35% | 286,907 | 1.8% |
[ 0.0% - 0.5% ] 0.36% | 146,758 | 2.2% |
[ 0.0% - 0.5% ] 0.38% | 159,165 | 2.5% |
[ 0.0% - 0.5% ] 0.40% | 191,448 | 1.8% |
[ 0.0% - 0.5% ] 0.41% | 123,241 | 1.8% |
[ 0.0% - 0.5% ] 0.42% | 101,543 | 1.9% |
[ 0.0% - 0.5% ] 0.44% | 38,403 | 2.6% |
[ 0.0% - 0.5% ] 0.45% | 28,970 | 1.5% |
[ 0.0% - 0.5% ] 0.47% | 129,375 | 3.3% |
[ 0.0% - 0.5% ] 0.48% | 179,621 | 2.6% |
[ 0.5% - 1.0% ] 0.50% | 9,536 | 0.36% |
[ 0.5% - 1.0% ] 0.51% | 22,546 | 2.1% |
[ 0.5% - 1.0% ] 0.53% | 131,929 | 2.0% |
[ 0.5% - 1.0% ] 0.55% | 27,636 | 3.8% |
[ 0.5% - 1.0% ] 0.56% | 94,019 | 2.3% |
[ 0.5% - 1.0% ] 0.58% | 27,652 | 2.3% |
[ 0.5% - 1.0% ] 0.60% | 38,225 | 3.3% |
[ 0.5% - 1.0% ] 0.62% | 76,182 | 2.6% |
[ 0.5% - 1.0% ] 0.64% | 119,806 | 2.4% |
[ 0.5% - 1.0% ] 0.66% | 24,398 | 2.0% |
[ 0.5% - 1.0% ] 0.67% | 69,456 | 1.6% |
[ 0.5% - 1.0% ] 0.68% | 89,464 | 1.4% |
[ 0.5% - 1.0% ] 0.70% | 63,508 | 2.8% |
[ 0.5% - 1.0% ] 0.74% | 37,809 | 2.4% |
[ 0.5% - 1.0% ] 0.75% | 60,937 | 2.7% |
[ 0.5% - 1.0% ] 0.76% | 96,559 | 2.5% |
[ 0.5% - 1.0% ] 0.78% | 82,734 | 3.1% |
[ 0.5% - 1.0% ] 0.80% | 91,037 | 1.6% |
[ 0.5% - 1.0% ] 0.83% | 26,837 | 1.7% |
[ 0.5% - 1.0% ] 0.86% | 92,643 | 3.2% |
[ 0.5% - 1.0% ] 0.88% | 56,935 | 1.9% |
[ 0.5% - 1.0% ] 0.89% | 27,865 | 1.5% |
[ 0.5% - 1.0% ] 0.90% | 45,419 | 2.1% |
[ 0.5% - 1.0% ] 0.93% | 9,217 | 0.54% |
[ 0.5% - 1.0% ] 0.96% | 90,227 | 2.2% |
[ 0.5% - 1.0% ] 0.97% | 11,081 | 2.3% |
[ 1.0% - 1.5% ] 1.01% | 43,653 | 1.7% |
[ 1.0% - 1.5% ] 1.03% | 64,713 | 1.8% |
[ 1.0% - 1.5% ] 1.04% | 12,355 | 2.6% |
[ 1.0% - 1.5% ] 1.18% | 54,017 | 2.0% |
[ 1.0% - 1.5% ] 1.25% | 40,527 | 3.7% |
[ 1.0% - 1.5% ] 1.26% | 80,672 | 3.0% |
[ 1.0% - 1.5% ] 1.28% | 24,892 | 2.3% |
[ 1.0% - 1.5% ] 1.31% | 13,510 | 2.1% |
[ 1.0% - 1.5% ] 1.34% | 14,363 | 4.1% |
[ 1.0% - 1.5% ] 1.38% | 509 | 0.39% |
[ 1.0% - 1.5% ] 1.40% | 38,441 | 2.0% |
[ 1.0% - 1.5% ] 1.41% | 13,295 | 4.5% |
[ 1.0% - 1.5% ] 1.43% | 7,666 | 3.6% |
[ 1.5% - 2.0% ] 1.51% | 2,912 | 1.9% |
[ 1.5% - 2.0% ] 1.53% | 587 | 0.17% |
[ 1.5% - 2.0% ] 1.76% | 2,846 | 0.70% |
[ 2.5% - 3.0% ] 2.55% | 1,885 | 1.7% |
[ 2.5% - 3.0% ] 2.79% | 5,876 | 3.6% |
[ 3.0% - 3.5% ] 3.08% | 519 | 1.4% |
[ 7.0% - 7.5% ] 7.42% | 4,809 | 0.51% |