Immigrants from Belarus Self-Care Disability
COMPARE
Immigrants from Belarus
Select to Compare
Self-Care Disability
Immigrants from Belarus Self-Care Disability
2.6%
SELF-CARE DISABILITY
0.2/ 100
METRIC RATING
259th/ 347
METRIC RANK
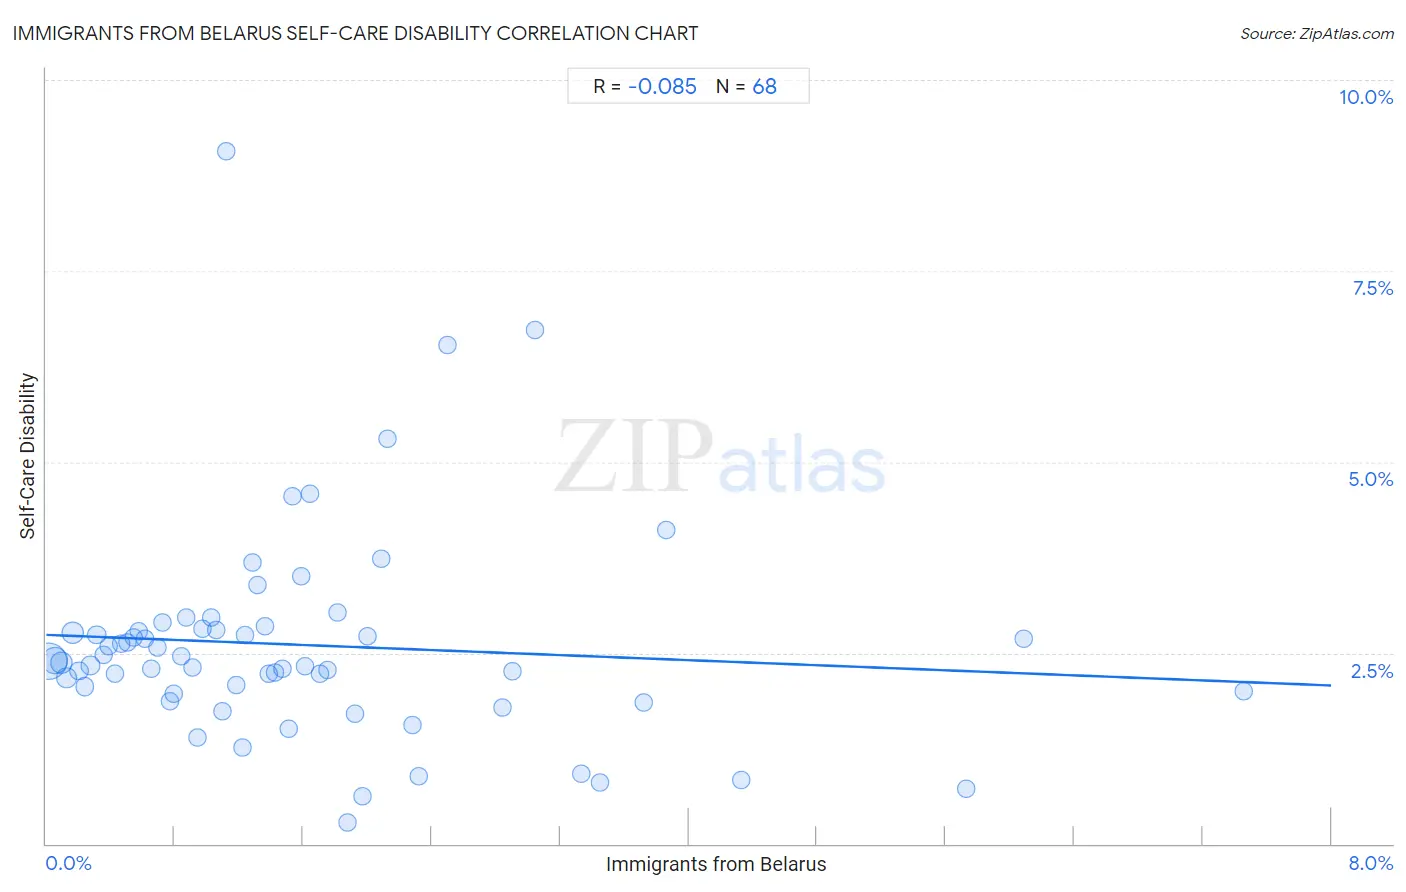
Immigrants from Belarus Self-Care Disability Correlation Chart
The statistical analysis conducted on geographies consisting of 150,167,349 people shows a slight negative correlation between the proportion of Immigrants from Belarus and percentage of population with self-care disability in the United States with a correlation coefficient (R) of -0.085 and weighted average of 2.6%. On average, for every 1% (one percent) increase in Immigrants from Belarus within a typical geography, there is a decrease of 0.083% in percentage of population with self-care disability.
It is essential to understand that the correlation between the percentage of Immigrants from Belarus and percentage of population with self-care disability does not imply a direct cause-and-effect relationship. It remains uncertain whether the presence of Immigrants from Belarus influences an upward or downward trend in the level of percentage of population with self-care disability within an area, or if Immigrants from Belarus simply ended up residing in those areas with higher or lower levels of percentage of population with self-care disability due to other factors.
Demographics Similar to Immigrants from Belarus by Self-Care Disability
In terms of self-care disability, the demographic groups most similar to Immigrants from Belarus are Chippewa (2.6%, a difference of 0.040%), Arapaho (2.6%, a difference of 0.060%), Nonimmigrants (2.6%, a difference of 0.070%), Potawatomi (2.6%, a difference of 0.14%), and Shoshone (2.7%, a difference of 0.20%).
| Demographics | Rating | Rank | Self-Care Disability |
| Immigrants from Bangladesh | 0.4 /100 | #252 | Tragic 2.6% |
| Immigrants from Haiti | 0.3 /100 | #253 | Tragic 2.6% |
| Haitians | 0.3 /100 | #254 | Tragic 2.6% |
| Tsimshian | 0.3 /100 | #255 | Tragic 2.6% |
| Immigrants from Central America | 0.3 /100 | #256 | Tragic 2.6% |
| Potawatomi | 0.3 /100 | #257 | Tragic 2.6% |
| Nonimmigrants | 0.3 /100 | #258 | Tragic 2.6% |
| Immigrants from Belarus | 0.2 /100 | #259 | Tragic 2.6% |
| Chippewa | 0.2 /100 | #260 | Tragic 2.6% |
| Arapaho | 0.2 /100 | #261 | Tragic 2.6% |
| Shoshone | 0.2 /100 | #262 | Tragic 2.7% |
| Immigrants from Latin America | 0.2 /100 | #263 | Tragic 2.7% |
| Immigrants from Iran | 0.2 /100 | #264 | Tragic 2.7% |
| Immigrants from Nicaragua | 0.2 /100 | #265 | Tragic 2.7% |
| Immigrants from Cambodia | 0.1 /100 | #266 | Tragic 2.7% |
Immigrants from Belarus Self-Care Disability Correlation Summary
| Measurement | Immigrants from Belarus Data | Self-Care Disability Data |
| Minimum | 0.017% | 0.28% |
| Maximum | 7.5% | 9.1% |
| Range | 7.4% | 8.8% |
| Mean | 1.6% | 2.6% |
| Median | 1.3% | 2.4% |
| Interquartile 25% (IQ1) | 0.63% | 2.0% |
| Interquartile 75% (IQ3) | 2.0% | 2.8% |
| Interquartile Range (IQR) | 1.4% | 0.83% |
| Standard Deviation (Sample) | 1.4% | 1.4% |
| Standard Deviation (Population) | 1.4% | 1.4% |
Correlation Details
| Immigrants from Belarus Percentile | Sample Size | Self-Care Disability |
[ 0.0% - 0.5% ] 0.017% | 73,539,397 | 2.4% |
[ 0.0% - 0.5% ] 0.051% | 30,041,480 | 2.4% |
[ 0.0% - 0.5% ] 0.092% | 13,098,569 | 2.4% |
[ 0.0% - 0.5% ] 0.13% | 7,152,149 | 2.2% |
[ 0.0% - 0.5% ] 0.17% | 12,799,629 | 2.8% |
[ 0.0% - 0.5% ] 0.20% | 2,668,944 | 2.3% |
[ 0.0% - 0.5% ] 0.24% | 1,905,571 | 2.1% |
[ 0.0% - 0.5% ] 0.28% | 1,555,350 | 2.3% |
[ 0.0% - 0.5% ] 0.31% | 1,294,773 | 2.7% |
[ 0.0% - 0.5% ] 0.36% | 881,639 | 2.5% |
[ 0.0% - 0.5% ] 0.39% | 694,450 | 2.6% |
[ 0.0% - 0.5% ] 0.43% | 481,191 | 2.2% |
[ 0.0% - 0.5% ] 0.46% | 590,199 | 2.6% |
[ 0.5% - 1.0% ] 0.50% | 293,044 | 2.6% |
[ 0.5% - 1.0% ] 0.54% | 429,011 | 2.7% |
[ 0.5% - 1.0% ] 0.58% | 246,233 | 2.8% |
[ 0.5% - 1.0% ] 0.61% | 188,782 | 2.7% |
[ 0.5% - 1.0% ] 0.65% | 68,620 | 2.3% |
[ 0.5% - 1.0% ] 0.69% | 167,369 | 2.6% |
[ 0.5% - 1.0% ] 0.72% | 277,118 | 2.9% |
[ 0.5% - 1.0% ] 0.77% | 28,245 | 1.9% |
[ 0.5% - 1.0% ] 0.79% | 116,556 | 2.0% |
[ 0.5% - 1.0% ] 0.84% | 37,752 | 2.5% |
[ 0.5% - 1.0% ] 0.87% | 110,930 | 3.0% |
[ 0.5% - 1.0% ] 0.91% | 96,125 | 2.3% |
[ 0.5% - 1.0% ] 0.94% | 62,956 | 1.4% |
[ 0.5% - 1.0% ] 0.98% | 106,421 | 2.8% |
[ 1.0% - 1.5% ] 1.03% | 47,330 | 3.0% |
[ 1.0% - 1.5% ] 1.06% | 35,302 | 2.8% |
[ 1.0% - 1.5% ] 1.09% | 102,293 | 1.7% |
[ 1.0% - 1.5% ] 1.12% | 16,808 | 9.1% |
[ 1.0% - 1.5% ] 1.18% | 8,356 | 2.1% |
[ 1.0% - 1.5% ] 1.22% | 12,200 | 1.3% |
[ 1.0% - 1.5% ] 1.23% | 40,324 | 2.7% |
[ 1.0% - 1.5% ] 1.29% | 84,999 | 3.7% |
[ 1.0% - 1.5% ] 1.31% | 205,243 | 3.4% |
[ 1.0% - 1.5% ] 1.36% | 32,491 | 2.8% |
[ 1.0% - 1.5% ] 1.39% | 77,576 | 2.2% |
[ 1.0% - 1.5% ] 1.43% | 4,350 | 2.3% |
[ 1.0% - 1.5% ] 1.47% | 4,621 | 2.3% |
[ 1.5% - 2.0% ] 1.51% | 4,575 | 1.5% |
[ 1.5% - 2.0% ] 1.54% | 41,127 | 4.5% |
[ 1.5% - 2.0% ] 1.59% | 130,592 | 3.5% |
[ 1.5% - 2.0% ] 1.61% | 6,575 | 2.3% |
[ 1.5% - 2.0% ] 1.65% | 80,113 | 4.6% |
[ 1.5% - 2.0% ] 1.71% | 4,689 | 2.2% |
[ 1.5% - 2.0% ] 1.75% | 23,676 | 2.3% |
[ 1.5% - 2.0% ] 1.82% | 4,184 | 3.0% |
[ 1.5% - 2.0% ] 1.87% | 1,121 | 0.28% |
[ 1.5% - 2.0% ] 1.93% | 88,776 | 1.7% |
[ 1.5% - 2.0% ] 1.97% | 11,513 | 0.62% |
[ 1.5% - 2.0% ] 2.00% | 2,552 | 2.7% |
[ 2.0% - 2.5% ] 2.08% | 5,379 | 3.7% |
[ 2.0% - 2.5% ] 2.13% | 1,975 | 5.3% |
[ 2.0% - 2.5% ] 2.28% | 2,498 | 1.5% |
[ 2.0% - 2.5% ] 2.32% | 1,379 | 0.88% |
[ 2.0% - 2.5% ] 2.50% | 47,893 | 6.5% |
[ 2.5% - 3.0% ] 2.84% | 8,162 | 1.8% |
[ 2.5% - 3.0% ] 2.91% | 585 | 2.3% |
[ 3.0% - 3.5% ] 3.04% | 83,069 | 6.7% |
[ 3.0% - 3.5% ] 3.33% | 5,518 | 0.92% |
[ 3.0% - 3.5% ] 3.45% | 1,074 | 0.80% |
[ 3.5% - 4.0% ] 3.72% | 726 | 1.9% |
[ 3.5% - 4.0% ] 3.86% | 984 | 4.1% |
[ 4.0% - 4.5% ] 4.33% | 2,933 | 0.83% |
[ 5.5% - 6.0% ] 5.73% | 419 | 0.73% |
[ 6.0% - 6.5% ] 6.09% | 115 | 2.7% |
[ 7.0% - 7.5% ] 7.46% | 751 | 2.0% |