Immigrants from Belarus GED/Equivalency
COMPARE
Immigrants from Belarus
Select to Compare
GED/Equivalency
Immigrants from Belarus GED/Equivalency
87.3%
GED/EQUIVALENCY
96.9/ 100
METRIC RATING
99th/ 347
METRIC RANK
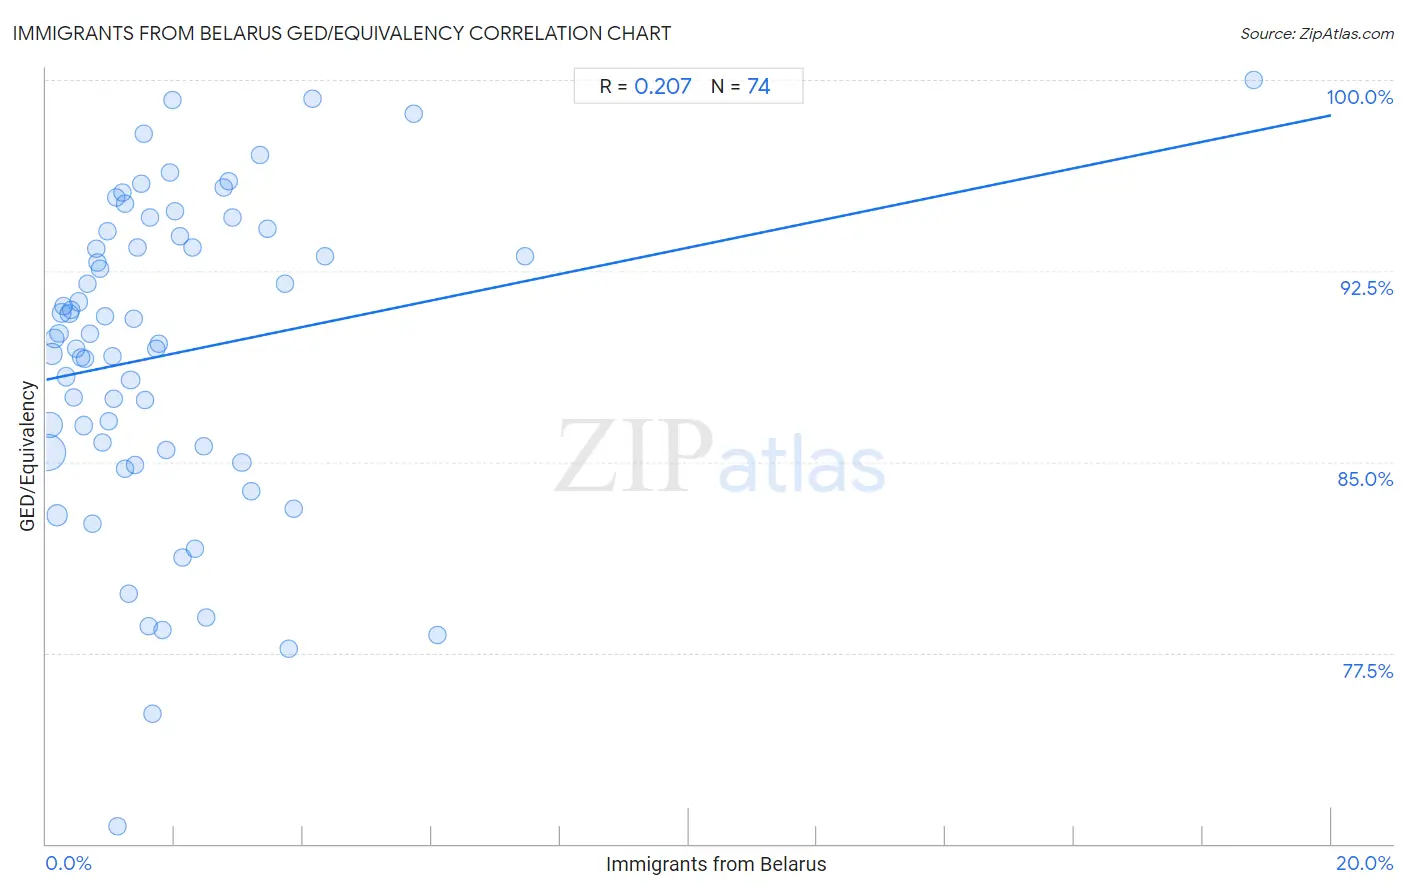
Immigrants from Belarus GED/Equivalency Correlation Chart
The statistical analysis conducted on geographies consisting of 150,205,158 people shows a weak positive correlation between the proportion of Immigrants from Belarus and percentage of population with at least ged/equivalency education in the United States with a correlation coefficient (R) of 0.207 and weighted average of 87.3%. On average, for every 1% (one percent) increase in Immigrants from Belarus within a typical geography, there is an increase of 0.52% in percentage of population with at least ged/equivalency education.
It is essential to understand that the correlation between the percentage of Immigrants from Belarus and percentage of population with at least ged/equivalency education does not imply a direct cause-and-effect relationship. It remains uncertain whether the presence of Immigrants from Belarus influences an upward or downward trend in the level of percentage of population with at least ged/equivalency education within an area, or if Immigrants from Belarus simply ended up residing in those areas with higher or lower levels of percentage of population with at least ged/equivalency education due to other factors.
Demographics Similar to Immigrants from Belarus by GED/Equivalency
In terms of ged/equivalency, the demographic groups most similar to Immigrants from Belarus are Immigrants from Croatia (87.3%, a difference of 0.010%), Palestinian (87.3%, a difference of 0.020%), Syrian (87.2%, a difference of 0.050%), Immigrants from Western Europe (87.3%, a difference of 0.070%), and Lebanese (87.2%, a difference of 0.11%).
| Demographics | Rating | Rank | GED/Equivalency |
| Israelis | 97.8 /100 | #92 | Exceptional 87.4% |
| Immigrants from North Macedonia | 97.8 /100 | #93 | Exceptional 87.4% |
| Immigrants from Russia | 97.8 /100 | #94 | Exceptional 87.4% |
| Immigrants from Greece | 97.7 /100 | #95 | Exceptional 87.4% |
| Czechoslovakians | 97.6 /100 | #96 | Exceptional 87.4% |
| Immigrants from Western Europe | 97.3 /100 | #97 | Exceptional 87.3% |
| Immigrants from Croatia | 96.9 /100 | #98 | Exceptional 87.3% |
| Immigrants from Belarus | 96.9 /100 | #99 | Exceptional 87.3% |
| Palestinians | 96.8 /100 | #100 | Exceptional 87.3% |
| Syrians | 96.6 /100 | #101 | Exceptional 87.2% |
| Lebanese | 96.2 /100 | #102 | Exceptional 87.2% |
| Jordanians | 96.1 /100 | #103 | Exceptional 87.2% |
| Immigrants from Hungary | 96.0 /100 | #104 | Exceptional 87.2% |
| Indians (Asian) | 95.9 /100 | #105 | Exceptional 87.1% |
| Immigrants from Zimbabwe | 95.8 /100 | #106 | Exceptional 87.1% |
Immigrants from Belarus GED/Equivalency Correlation Summary
| Measurement | Immigrants from Belarus Data | GED/Equivalency Data |
| Minimum | 0.017% | 70.7% |
| Maximum | 18.8% | 100.0% |
| Range | 18.8% | 29.3% |
| Mean | 1.9% | 89.2% |
| Median | 1.4% | 89.9% |
| Interquartile 25% (IQ1) | 0.69% | 85.4% |
| Interquartile 75% (IQ3) | 2.3% | 93.9% |
| Interquartile Range (IQR) | 1.6% | 8.4% |
| Standard Deviation (Sample) | 2.5% | 6.2% |
| Standard Deviation (Population) | 2.4% | 6.1% |
Correlation Details
| Immigrants from Belarus Percentile | Sample Size | GED/Equivalency |
[ 0.0% - 0.5% ] 0.017% | 73,543,198 | 85.4% |
[ 0.0% - 0.5% ] 0.051% | 30,041,480 | 86.5% |
[ 0.0% - 0.5% ] 0.092% | 13,098,569 | 89.2% |
[ 0.0% - 0.5% ] 0.13% | 7,152,149 | 89.8% |
[ 0.0% - 0.5% ] 0.17% | 12,800,286 | 82.9% |
[ 0.0% - 0.5% ] 0.20% | 2,669,456 | 90.0% |
[ 0.0% - 0.5% ] 0.24% | 1,905,571 | 90.9% |
[ 0.0% - 0.5% ] 0.28% | 1,564,193 | 91.1% |
[ 0.0% - 0.5% ] 0.31% | 1,294,773 | 88.3% |
[ 0.0% - 0.5% ] 0.36% | 881,639 | 90.8% |
[ 0.0% - 0.5% ] 0.39% | 694,450 | 91.0% |
[ 0.0% - 0.5% ] 0.43% | 481,191 | 87.5% |
[ 0.0% - 0.5% ] 0.46% | 590,199 | 89.4% |
[ 0.5% - 1.0% ] 0.50% | 293,044 | 91.3% |
[ 0.5% - 1.0% ] 0.54% | 429,011 | 89.1% |
[ 0.5% - 1.0% ] 0.58% | 246,233 | 86.4% |
[ 0.5% - 1.0% ] 0.61% | 188,782 | 89.0% |
[ 0.5% - 1.0% ] 0.65% | 68,620 | 92.0% |
[ 0.5% - 1.0% ] 0.69% | 168,226 | 90.0% |
[ 0.5% - 1.0% ] 0.72% | 277,118 | 82.6% |
[ 0.5% - 1.0% ] 0.77% | 38,863 | 93.4% |
[ 0.5% - 1.0% ] 0.79% | 116,556 | 92.9% |
[ 0.5% - 1.0% ] 0.84% | 37,752 | 92.6% |
[ 0.5% - 1.0% ] 0.87% | 110,930 | 85.8% |
[ 0.5% - 1.0% ] 0.91% | 96,125 | 90.7% |
[ 0.5% - 1.0% ] 0.94% | 64,930 | 94.1% |
[ 0.5% - 1.0% ] 0.98% | 106,421 | 86.6% |
[ 1.0% - 1.5% ] 1.03% | 47,330 | 89.1% |
[ 1.0% - 1.5% ] 1.06% | 35,302 | 87.5% |
[ 1.0% - 1.5% ] 1.09% | 102,293 | 95.4% |
[ 1.0% - 1.5% ] 1.12% | 16,808 | 70.7% |
[ 1.0% - 1.5% ] 1.18% | 8,356 | 95.6% |
[ 1.0% - 1.5% ] 1.22% | 12,200 | 95.1% |
[ 1.0% - 1.5% ] 1.23% | 40,324 | 84.8% |
[ 1.0% - 1.5% ] 1.29% | 86,628 | 79.8% |
[ 1.0% - 1.5% ] 1.31% | 205,243 | 88.2% |
[ 1.0% - 1.5% ] 1.36% | 32,491 | 90.6% |
[ 1.0% - 1.5% ] 1.39% | 77,576 | 84.9% |
[ 1.0% - 1.5% ] 1.43% | 6,174 | 93.4% |
[ 1.0% - 1.5% ] 1.47% | 4,621 | 95.9% |
[ 1.5% - 2.0% ] 1.51% | 4,575 | 97.9% |
[ 1.5% - 2.0% ] 1.54% | 41,127 | 87.4% |
[ 1.5% - 2.0% ] 1.59% | 131,728 | 78.6% |
[ 1.5% - 2.0% ] 1.61% | 6,575 | 94.6% |
[ 1.5% - 2.0% ] 1.65% | 80,113 | 75.1% |
[ 1.5% - 2.0% ] 1.71% | 4,689 | 89.5% |
[ 1.5% - 2.0% ] 1.75% | 23,676 | 89.7% |
[ 1.5% - 2.0% ] 1.82% | 4,184 | 78.4% |
[ 1.5% - 2.0% ] 1.87% | 1,121 | 85.4% |
[ 1.5% - 2.0% ] 1.93% | 88,776 | 96.4% |
[ 1.5% - 2.0% ] 1.97% | 11,513 | 99.2% |
[ 1.5% - 2.0% ] 2.00% | 2,552 | 94.8% |
[ 2.0% - 2.5% ] 2.08% | 5,379 | 93.9% |
[ 2.0% - 2.5% ] 2.13% | 1,975 | 81.2% |
[ 2.0% - 2.5% ] 2.28% | 2,498 | 93.4% |
[ 2.0% - 2.5% ] 2.32% | 1,379 | 81.6% |
[ 2.0% - 2.5% ] 2.45% | 1,224 | 85.6% |
[ 2.0% - 2.5% ] 2.50% | 47,893 | 78.9% |
[ 2.5% - 3.0% ] 2.77% | 3,074 | 95.8% |
[ 2.5% - 3.0% ] 2.84% | 8,162 | 96.0% |
[ 2.5% - 3.0% ] 2.91% | 585 | 94.6% |
[ 3.0% - 3.5% ] 3.04% | 83,233 | 85.0% |
[ 3.0% - 3.5% ] 3.18% | 628 | 83.8% |
[ 3.0% - 3.5% ] 3.33% | 5,518 | 97.1% |
[ 3.0% - 3.5% ] 3.45% | 1,074 | 94.2% |
[ 3.5% - 4.0% ] 3.72% | 726 | 92.0% |
[ 3.5% - 4.0% ] 3.77% | 398 | 77.7% |
[ 3.5% - 4.0% ] 3.86% | 984 | 83.1% |
[ 4.0% - 4.5% ] 4.15% | 289 | 99.2% |
[ 4.0% - 4.5% ] 4.33% | 2,933 | 93.1% |
[ 5.5% - 6.0% ] 5.73% | 419 | 98.7% |
[ 6.0% - 6.5% ] 6.09% | 115 | 78.2% |
[ 7.0% - 7.5% ] 7.46% | 751 | 93.1% |
[ 18.5% - 19.0% ] 18.78% | 181 | 100.0% |