Immigrants from Belarus Disability Age 5 to 17
COMPARE
Immigrants from Belarus
Select to Compare
Disability Age 5 to 17
Immigrants from Belarus Disability Age 5 to 17
5.0%
DISABILITY | AGE 5 TO 17
100.0/ 100
METRIC RATING
37th/ 347
METRIC RANK
Immigrants from Belarus Disability Age 5 to 17 Correlation Chart
The statistical analysis conducted on geographies consisting of 149,676,434 people shows a weak positive correlation between the proportion of Immigrants from Belarus and percentage of population with a disability between the ages 5 and 17 in the United States with a correlation coefficient (R) of 0.262 and weighted average of 5.0%. On average, for every 1% (one percent) increase in Immigrants from Belarus within a typical geography, there is an increase of 0.99% in percentage of population with a disability between the ages 5 and 17.
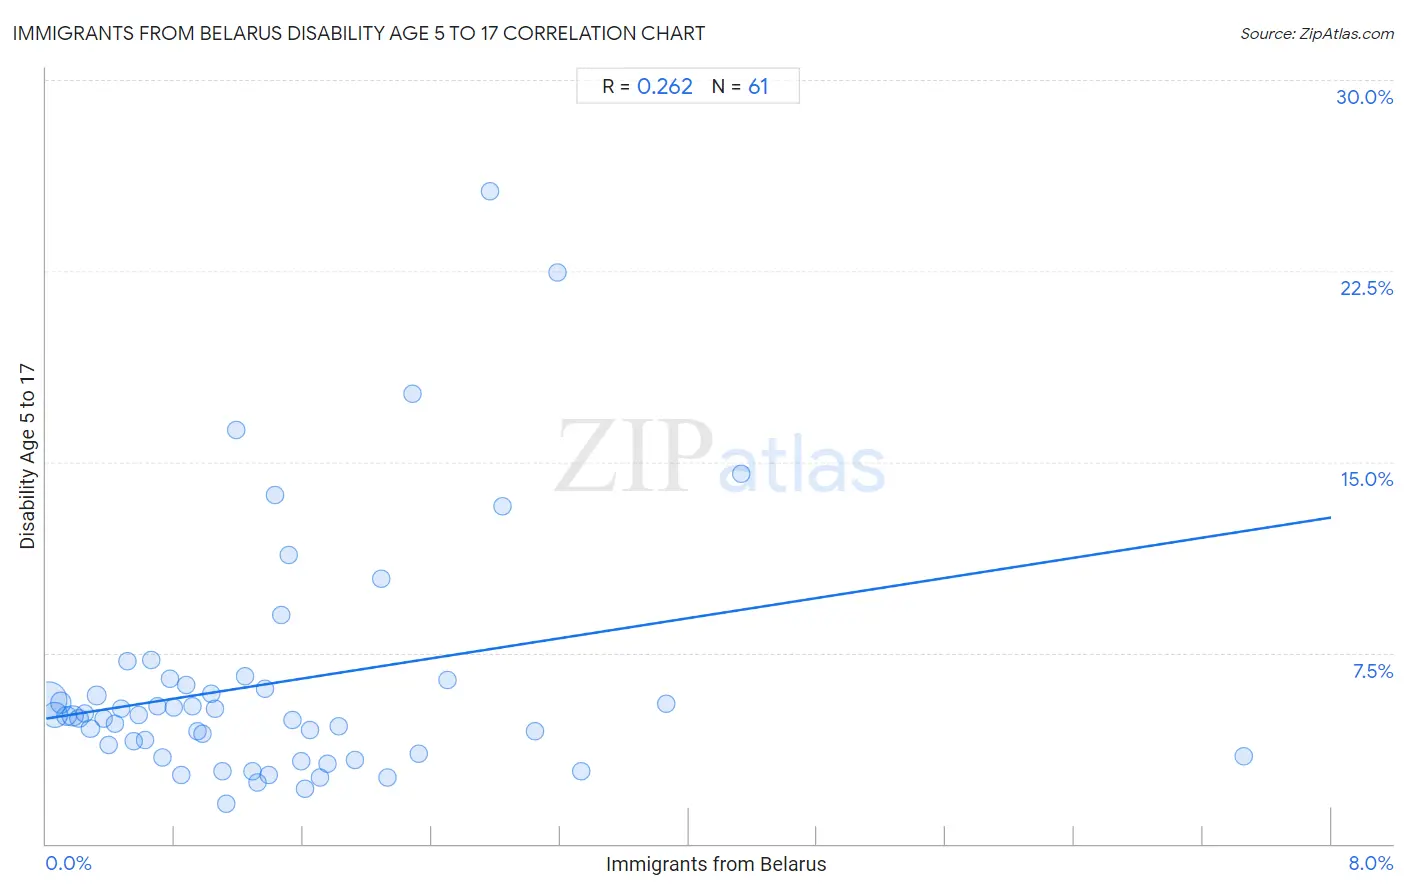
It is essential to understand that the correlation between the percentage of Immigrants from Belarus and percentage of population with a disability between the ages 5 and 17 does not imply a direct cause-and-effect relationship. It remains uncertain whether the presence of Immigrants from Belarus influences an upward or downward trend in the level of percentage of population with a disability between the ages 5 and 17 within an area, or if Immigrants from Belarus simply ended up residing in those areas with higher or lower levels of percentage of population with a disability between the ages 5 and 17 due to other factors.
Demographics Similar to Immigrants from Belarus by Disability Age 5 to 17
In terms of disability age 5 to 17, the demographic groups most similar to Immigrants from Belarus are Immigrants from Egypt (5.0%, a difference of 0.030%), Immigrants from Philippines (5.0%, a difference of 0.040%), Immigrants from Argentina (5.0%, a difference of 0.050%), Bolivian (5.0%, a difference of 0.070%), and Okinawan (5.0%, a difference of 0.13%).
| Demographics | Rating | Rank | Disability Age 5 to 17 |
| Immigrants from Malaysia | 100.0 /100 | #30 | Exceptional 5.0% |
| Immigrants from Pakistan | 100.0 /100 | #31 | Exceptional 5.0% |
| Soviet Union | 100.0 /100 | #32 | Exceptional 5.0% |
| Immigrants from Indonesia | 100.0 /100 | #33 | Exceptional 5.0% |
| Israelis | 100.0 /100 | #34 | Exceptional 5.0% |
| Bolivians | 100.0 /100 | #35 | Exceptional 5.0% |
| Immigrants from Egypt | 100.0 /100 | #36 | Exceptional 5.0% |
| Immigrants from Belarus | 100.0 /100 | #37 | Exceptional 5.0% |
| Immigrants from Philippines | 100.0 /100 | #38 | Exceptional 5.0% |
| Immigrants from Argentina | 100.0 /100 | #39 | Exceptional 5.0% |
| Okinawans | 100.0 /100 | #40 | Exceptional 5.0% |
| Immigrants from Australia | 100.0 /100 | #41 | Exceptional 5.0% |
| Immigrants from Sri Lanka | 100.0 /100 | #42 | Exceptional 5.0% |
| Immigrants from Russia | 100.0 /100 | #43 | Exceptional 5.0% |
| Egyptians | 100.0 /100 | #44 | Exceptional 5.0% |
Immigrants from Belarus Disability Age 5 to 17 Correlation Summary
| Measurement | Immigrants from Belarus Data | Disability Age 5 to 17 Data |
| Minimum | 0.017% | 1.6% |
| Maximum | 7.5% | 25.7% |
| Range | 7.4% | 24.1% |
| Mean | 1.4% | 6.3% |
| Median | 1.1% | 5.0% |
| Interquartile 25% (IQ1) | 0.56% | 3.5% |
| Interquartile 75% (IQ3) | 1.8% | 6.3% |
| Interquartile Range (IQR) | 1.2% | 2.9% |
| Standard Deviation (Sample) | 1.3% | 4.7% |
| Standard Deviation (Population) | 1.2% | 4.7% |
Correlation Details
| Immigrants from Belarus Percentile | Sample Size | Disability Age 5 to 17 |
[ 0.0% - 0.5% ] 0.017% | 73,504,150 | 5.7% |
[ 0.0% - 0.5% ] 0.051% | 30,013,839 | 5.1% |
[ 0.0% - 0.5% ] 0.092% | 13,002,685 | 5.5% |
[ 0.0% - 0.5% ] 0.13% | 7,111,257 | 5.0% |
[ 0.0% - 0.5% ] 0.17% | 12,799,629 | 5.0% |
[ 0.0% - 0.5% ] 0.20% | 2,628,628 | 4.9% |
[ 0.0% - 0.5% ] 0.24% | 1,873,870 | 5.1% |
[ 0.0% - 0.5% ] 0.28% | 1,560,055 | 4.5% |
[ 0.0% - 0.5% ] 0.31% | 1,280,005 | 5.8% |
[ 0.0% - 0.5% ] 0.36% | 864,813 | 4.9% |
[ 0.0% - 0.5% ] 0.39% | 689,985 | 3.9% |
[ 0.0% - 0.5% ] 0.43% | 453,537 | 4.7% |
[ 0.0% - 0.5% ] 0.46% | 588,265 | 5.3% |
[ 0.5% - 1.0% ] 0.50% | 288,941 | 7.2% |
[ 0.5% - 1.0% ] 0.55% | 388,523 | 4.0% |
[ 0.5% - 1.0% ] 0.58% | 234,813 | 5.1% |
[ 0.5% - 1.0% ] 0.61% | 183,480 | 4.1% |
[ 0.5% - 1.0% ] 0.65% | 61,421 | 7.2% |
[ 0.5% - 1.0% ] 0.69% | 167,369 | 5.4% |
[ 0.5% - 1.0% ] 0.72% | 271,258 | 3.4% |
[ 0.5% - 1.0% ] 0.77% | 28,245 | 6.5% |
[ 0.5% - 1.0% ] 0.79% | 114,809 | 5.3% |
[ 0.5% - 1.0% ] 0.84% | 30,977 | 2.7% |
[ 0.5% - 1.0% ] 0.87% | 110,930 | 6.2% |
[ 0.5% - 1.0% ] 0.91% | 96,125 | 5.4% |
[ 0.5% - 1.0% ] 0.94% | 63,972 | 4.4% |
[ 0.5% - 1.0% ] 0.98% | 98,708 | 4.3% |
[ 1.0% - 1.5% ] 1.03% | 47,330 | 5.9% |
[ 1.0% - 1.5% ] 1.05% | 29,810 | 5.3% |
[ 1.0% - 1.5% ] 1.10% | 80,091 | 2.8% |
[ 1.0% - 1.5% ] 1.12% | 16,808 | 1.6% |
[ 1.0% - 1.5% ] 1.18% | 8,356 | 16.2% |
[ 1.0% - 1.5% ] 1.23% | 40,324 | 6.6% |
[ 1.0% - 1.5% ] 1.29% | 84,999 | 2.8% |
[ 1.0% - 1.5% ] 1.31% | 199,550 | 2.4% |
[ 1.0% - 1.5% ] 1.36% | 32,491 | 6.1% |
[ 1.0% - 1.5% ] 1.39% | 77,576 | 2.7% |
[ 1.0% - 1.5% ] 1.43% | 5,051 | 13.7% |
[ 1.0% - 1.5% ] 1.46% | 1,232 | 9.0% |
[ 1.5% - 2.0% ] 1.51% | 4,575 | 11.3% |
[ 1.5% - 2.0% ] 1.54% | 41,127 | 4.8% |
[ 1.5% - 2.0% ] 1.59% | 130,592 | 3.2% |
[ 1.5% - 2.0% ] 1.61% | 6,575 | 2.2% |
[ 1.5% - 2.0% ] 1.65% | 80,113 | 4.5% |
[ 1.5% - 2.0% ] 1.71% | 4,689 | 2.6% |
[ 1.5% - 2.0% ] 1.75% | 23,676 | 3.1% |
[ 1.5% - 2.0% ] 1.82% | 822 | 4.6% |
[ 1.5% - 2.0% ] 1.93% | 86,115 | 3.3% |
[ 2.0% - 2.5% ] 2.08% | 5,379 | 10.4% |
[ 2.0% - 2.5% ] 2.13% | 1,975 | 2.6% |
[ 2.0% - 2.5% ] 2.28% | 2,498 | 17.7% |
[ 2.0% - 2.5% ] 2.32% | 1,379 | 3.5% |
[ 2.0% - 2.5% ] 2.50% | 47,893 | 6.4% |
[ 2.5% - 3.0% ] 2.77% | 3,074 | 25.7% |
[ 2.5% - 3.0% ] 2.84% | 8,162 | 13.2% |
[ 3.0% - 3.5% ] 3.04% | 83,069 | 4.4% |
[ 3.0% - 3.5% ] 3.18% | 628 | 22.4% |
[ 3.0% - 3.5% ] 3.33% | 5,518 | 2.8% |
[ 3.5% - 4.0% ] 3.86% | 984 | 5.5% |
[ 4.0% - 4.5% ] 4.33% | 2,933 | 14.5% |
[ 7.0% - 7.5% ] 7.46% | 751 | 3.4% |