Yup'ik vs Immigrants from Kazakhstan 3 or more Vehicles in Household
COMPARE
Yup'ik
Immigrants from Kazakhstan
3 or more Vehicles in Household
3 or more Vehicles in Household Comparison
Yup'ik
Immigrants from Kazakhstan
14.8%
3 OR MORE VEHICLES IN HOUSEHOLD
0.0/ 100
METRIC RATING
320th/ 347
METRIC RANK
17.4%
3 OR MORE VEHICLES IN HOUSEHOLD
0.3/ 100
METRIC RATING
279th/ 347
METRIC RANK
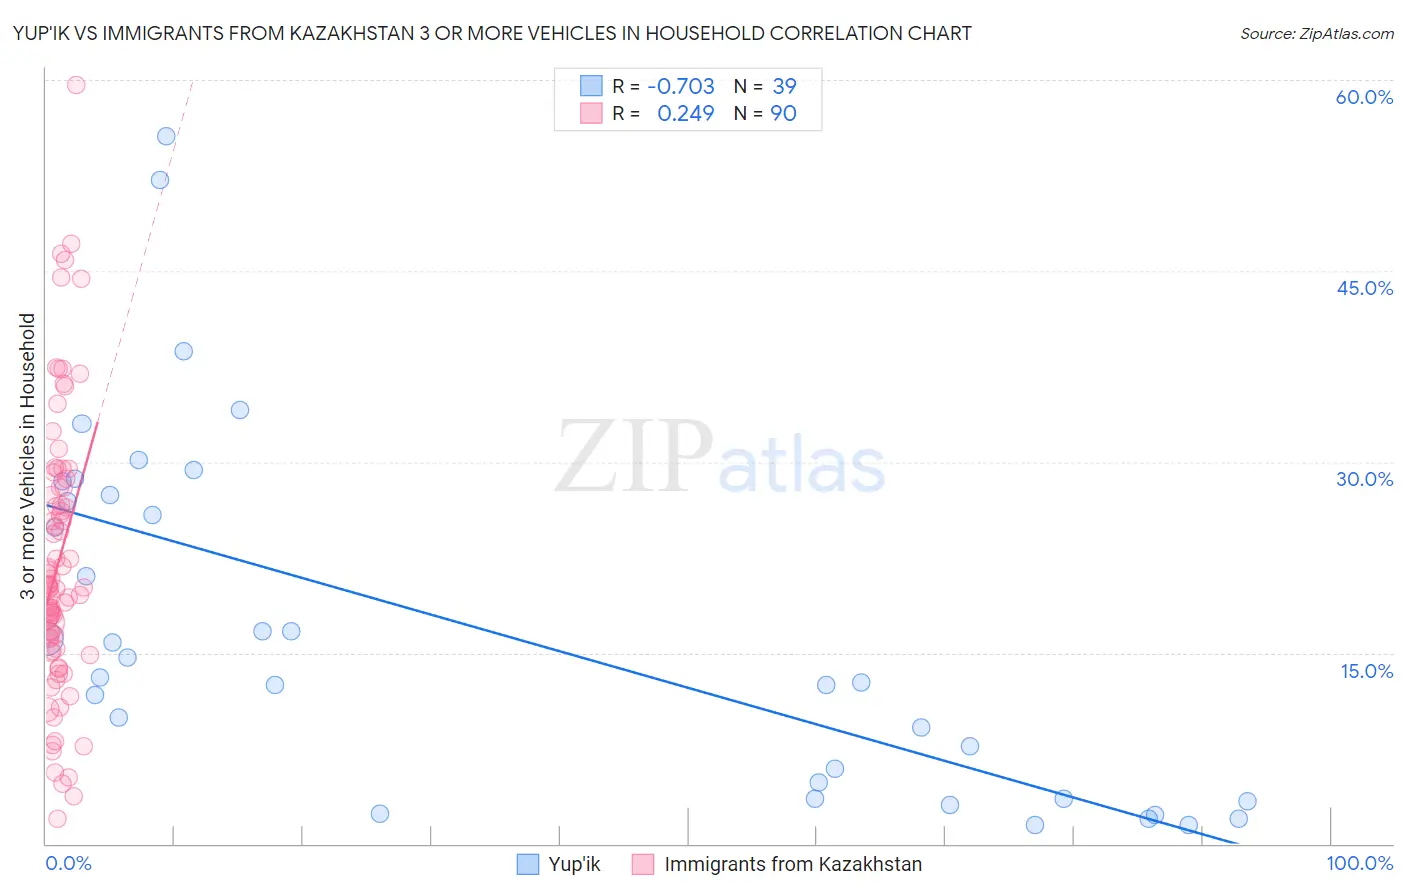
Yup'ik vs Immigrants from Kazakhstan 3 or more Vehicles in Household Correlation Chart
The statistical analysis conducted on geographies consisting of 39,914,717 people shows a strong negative correlation between the proportion of Yup'ik and percentage of households with 3 or more vehicles available in the United States with a correlation coefficient (R) of -0.703 and weighted average of 14.8%. Similarly, the statistical analysis conducted on geographies consisting of 124,422,099 people shows a weak positive correlation between the proportion of Immigrants from Kazakhstan and percentage of households with 3 or more vehicles available in the United States with a correlation coefficient (R) of 0.249 and weighted average of 17.4%, a difference of 17.3%.
3 or more Vehicles in Household Correlation Summary
| Measurement | Yup'ik | Immigrants from Kazakhstan |
| Minimum | 1.4% | 1.9% |
| Maximum | 55.6% | 59.6% |
| Range | 54.1% | 57.7% |
| Mean | 16.9% | 22.1% |
| Median | 13.1% | 20.1% |
| Interquartile 25% (IQ1) | 3.6% | 15.3% |
| Interquartile 75% (IQ3) | 27.4% | 27.9% |
| Interquartile Range (IQR) | 23.9% | 12.7% |
| Standard Deviation (Sample) | 13.9% | 10.8% |
| Standard Deviation (Population) | 13.8% | 10.7% |
Similar Demographics by 3 or more Vehicles in Household
Demographics Similar to Yup'ik by 3 or more Vehicles in Household
In terms of 3 or more vehicles in household, the demographic groups most similar to Yup'ik are Cape Verdean (15.0%, a difference of 1.1%), Immigrants from Jamaica (14.7%, a difference of 1.1%), Immigrants from West Indies (14.6%, a difference of 1.4%), Immigrants from Caribbean (14.6%, a difference of 1.9%), and Immigrants from Haiti (15.2%, a difference of 2.3%).
| Demographics | Rating | Rank | 3 or more Vehicles in Household |
| Immigrants | Israel | 0.0 /100 | #313 | Tragic 15.6% |
| Immigrants | Belarus | 0.0 /100 | #314 | Tragic 15.5% |
| Haitians | 0.0 /100 | #315 | Tragic 15.5% |
| U.S. Virgin Islanders | 0.0 /100 | #316 | Tragic 15.4% |
| Jamaicans | 0.0 /100 | #317 | Tragic 15.2% |
| Immigrants | Haiti | 0.0 /100 | #318 | Tragic 15.2% |
| Cape Verdeans | 0.0 /100 | #319 | Tragic 15.0% |
| Yup'ik | 0.0 /100 | #320 | Tragic 14.8% |
| Immigrants | Jamaica | 0.0 /100 | #321 | Tragic 14.7% |
| Immigrants | West Indies | 0.0 /100 | #322 | Tragic 14.6% |
| Immigrants | Caribbean | 0.0 /100 | #323 | Tragic 14.6% |
| Immigrants | Yemen | 0.0 /100 | #324 | Tragic 14.2% |
| Senegalese | 0.0 /100 | #325 | Tragic 14.2% |
| Soviet Union | 0.0 /100 | #326 | Tragic 14.2% |
| Ecuadorians | 0.0 /100 | #327 | Tragic 14.1% |
Demographics Similar to Immigrants from Kazakhstan by 3 or more Vehicles in Household
In terms of 3 or more vehicles in household, the demographic groups most similar to Immigrants from Kazakhstan are Immigrants from Bahamas (17.4%, a difference of 0.010%), Immigrants from Eastern Europe (17.4%, a difference of 0.040%), Immigrants from Latvia (17.4%, a difference of 0.080%), Brazilian (17.4%, a difference of 0.10%), and Okinawan (17.4%, a difference of 0.25%).
| Demographics | Rating | Rank | 3 or more Vehicles in Household |
| Immigrants | Africa | 0.5 /100 | #272 | Tragic 17.6% |
| Immigrants | Sudan | 0.5 /100 | #273 | Tragic 17.6% |
| Immigrants | Bosnia and Herzegovina | 0.5 /100 | #274 | Tragic 17.5% |
| Immigrants | Ukraine | 0.4 /100 | #275 | Tragic 17.5% |
| Okinawans | 0.4 /100 | #276 | Tragic 17.4% |
| Brazilians | 0.4 /100 | #277 | Tragic 17.4% |
| Immigrants | Bahamas | 0.3 /100 | #278 | Tragic 17.4% |
| Immigrants | Kazakhstan | 0.3 /100 | #279 | Tragic 17.4% |
| Immigrants | Eastern Europe | 0.3 /100 | #280 | Tragic 17.4% |
| Immigrants | Latvia | 0.3 /100 | #281 | Tragic 17.4% |
| Immigrants | Ireland | 0.3 /100 | #282 | Tragic 17.3% |
| Blacks/African Americans | 0.3 /100 | #283 | Tragic 17.3% |
| Immigrants | Colombia | 0.3 /100 | #284 | Tragic 17.3% |
| Immigrants | Croatia | 0.2 /100 | #285 | Tragic 17.2% |
| Menominee | 0.2 /100 | #286 | Tragic 17.2% |