Yup'ik vs Immigrants from West Indies 3 or more Vehicles in Household
COMPARE
Yup'ik
Immigrants from West Indies
3 or more Vehicles in Household
3 or more Vehicles in Household Comparison
Yup'ik
Immigrants from West Indies
14.8%
3 OR MORE VEHICLES IN HOUSEHOLD
0.0/ 100
METRIC RATING
320th/ 347
METRIC RANK
14.6%
3 OR MORE VEHICLES IN HOUSEHOLD
0.0/ 100
METRIC RATING
322nd/ 347
METRIC RANK
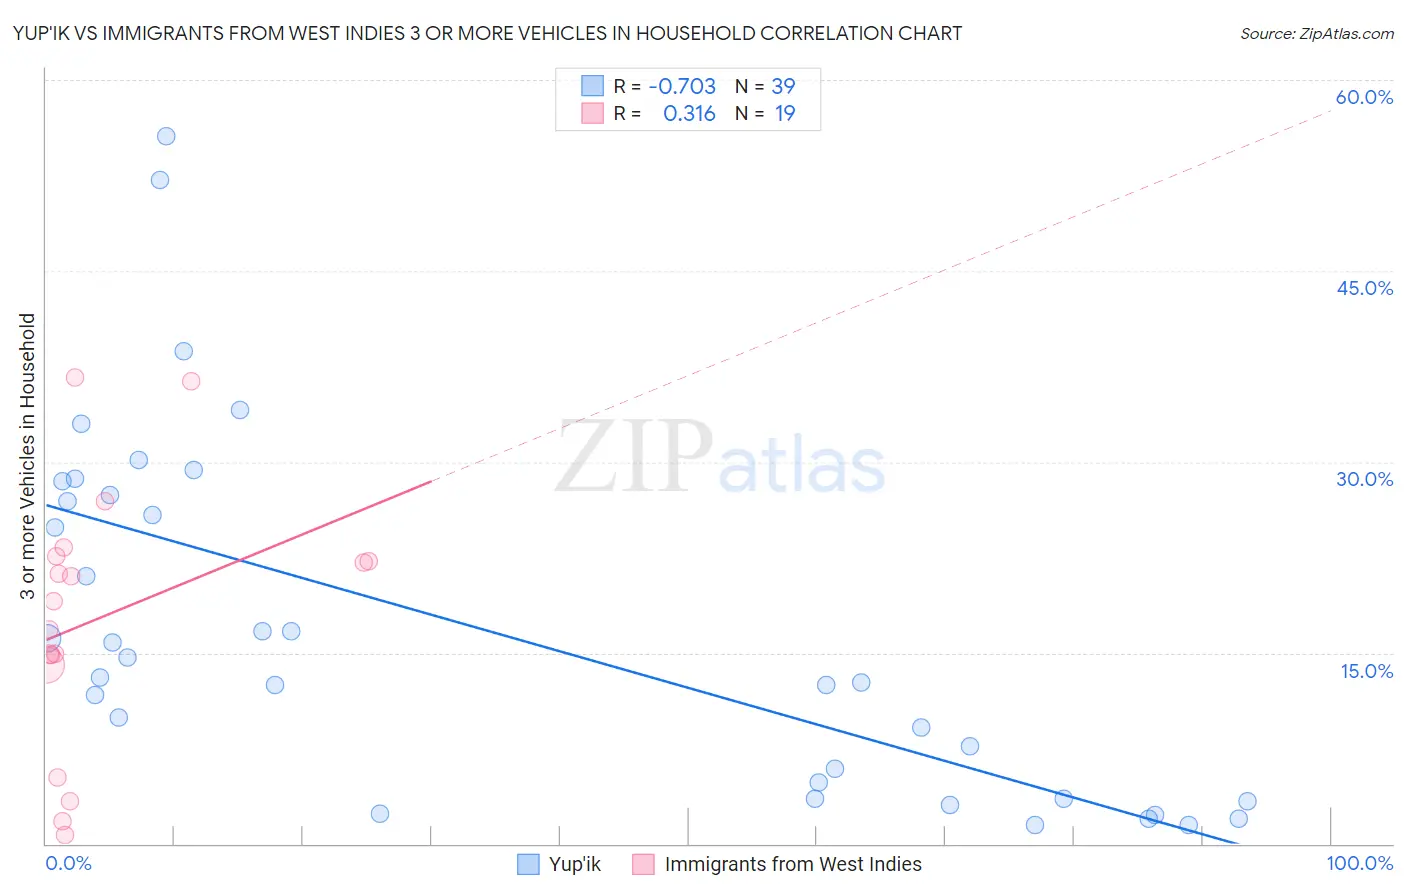
Yup'ik vs Immigrants from West Indies 3 or more Vehicles in Household Correlation Chart
The statistical analysis conducted on geographies consisting of 39,914,717 people shows a strong negative correlation between the proportion of Yup'ik and percentage of households with 3 or more vehicles available in the United States with a correlation coefficient (R) of -0.703 and weighted average of 14.8%. Similarly, the statistical analysis conducted on geographies consisting of 72,454,628 people shows a mild positive correlation between the proportion of Immigrants from West Indies and percentage of households with 3 or more vehicles available in the United States with a correlation coefficient (R) of 0.316 and weighted average of 14.6%, a difference of 1.4%.
3 or more Vehicles in Household Correlation Summary
| Measurement | Yup'ik | Immigrants from West Indies |
| Minimum | 1.4% | 0.69% |
| Maximum | 55.6% | 36.6% |
| Range | 54.1% | 35.9% |
| Mean | 16.9% | 17.8% |
| Median | 13.1% | 19.1% |
| Interquartile 25% (IQ1) | 3.6% | 14.0% |
| Interquartile 75% (IQ3) | 27.4% | 22.6% |
| Interquartile Range (IQR) | 23.9% | 8.5% |
| Standard Deviation (Sample) | 13.9% | 10.1% |
| Standard Deviation (Population) | 13.8% | 9.9% |
Demographics Similar to Yup'ik and Immigrants from West Indies by 3 or more Vehicles in Household
In terms of 3 or more vehicles in household, the demographic groups most similar to Yup'ik are Cape Verdean (15.0%, a difference of 1.1%), Immigrants from Jamaica (14.7%, a difference of 1.1%), Immigrants from Caribbean (14.6%, a difference of 1.9%), Immigrants from Haiti (15.2%, a difference of 2.3%), and Jamaican (15.2%, a difference of 2.5%). Similarly, the demographic groups most similar to Immigrants from West Indies are Immigrants from Jamaica (14.7%, a difference of 0.31%), Immigrants from Caribbean (14.6%, a difference of 0.44%), Cape Verdean (15.0%, a difference of 2.5%), Immigrants from Yemen (14.2%, a difference of 2.8%), and Senegalese (14.2%, a difference of 2.8%).
| Demographics | Rating | Rank | 3 or more Vehicles in Household |
| Albanians | 0.0 /100 | #311 | Tragic 15.8% |
| Puerto Ricans | 0.0 /100 | #312 | Tragic 15.6% |
| Immigrants | Israel | 0.0 /100 | #313 | Tragic 15.6% |
| Immigrants | Belarus | 0.0 /100 | #314 | Tragic 15.5% |
| Haitians | 0.0 /100 | #315 | Tragic 15.5% |
| U.S. Virgin Islanders | 0.0 /100 | #316 | Tragic 15.4% |
| Jamaicans | 0.0 /100 | #317 | Tragic 15.2% |
| Immigrants | Haiti | 0.0 /100 | #318 | Tragic 15.2% |
| Cape Verdeans | 0.0 /100 | #319 | Tragic 15.0% |
| Yup'ik | 0.0 /100 | #320 | Tragic 14.8% |
| Immigrants | Jamaica | 0.0 /100 | #321 | Tragic 14.7% |
| Immigrants | West Indies | 0.0 /100 | #322 | Tragic 14.6% |
| Immigrants | Caribbean | 0.0 /100 | #323 | Tragic 14.6% |
| Immigrants | Yemen | 0.0 /100 | #324 | Tragic 14.2% |
| Senegalese | 0.0 /100 | #325 | Tragic 14.2% |
| Soviet Union | 0.0 /100 | #326 | Tragic 14.2% |
| Ecuadorians | 0.0 /100 | #327 | Tragic 14.1% |
| Immigrants | Albania | 0.0 /100 | #328 | Tragic 14.0% |
| Immigrants | Senegal | 0.0 /100 | #329 | Tragic 13.8% |
| West Indians | 0.0 /100 | #330 | Tragic 13.7% |
| Immigrants | Dominica | 0.0 /100 | #331 | Tragic 13.7% |