Yup'ik vs Immigrants from Panama 3 or more Vehicles in Household
COMPARE
Yup'ik
Immigrants from Panama
3 or more Vehicles in Household
3 or more Vehicles in Household Comparison
Yup'ik
Immigrants from Panama
14.8%
3 OR MORE VEHICLES IN HOUSEHOLD
0.0/ 100
METRIC RATING
320th/ 347
METRIC RANK
17.7%
3 OR MORE VEHICLES IN HOUSEHOLD
0.8/ 100
METRIC RATING
265th/ 347
METRIC RANK
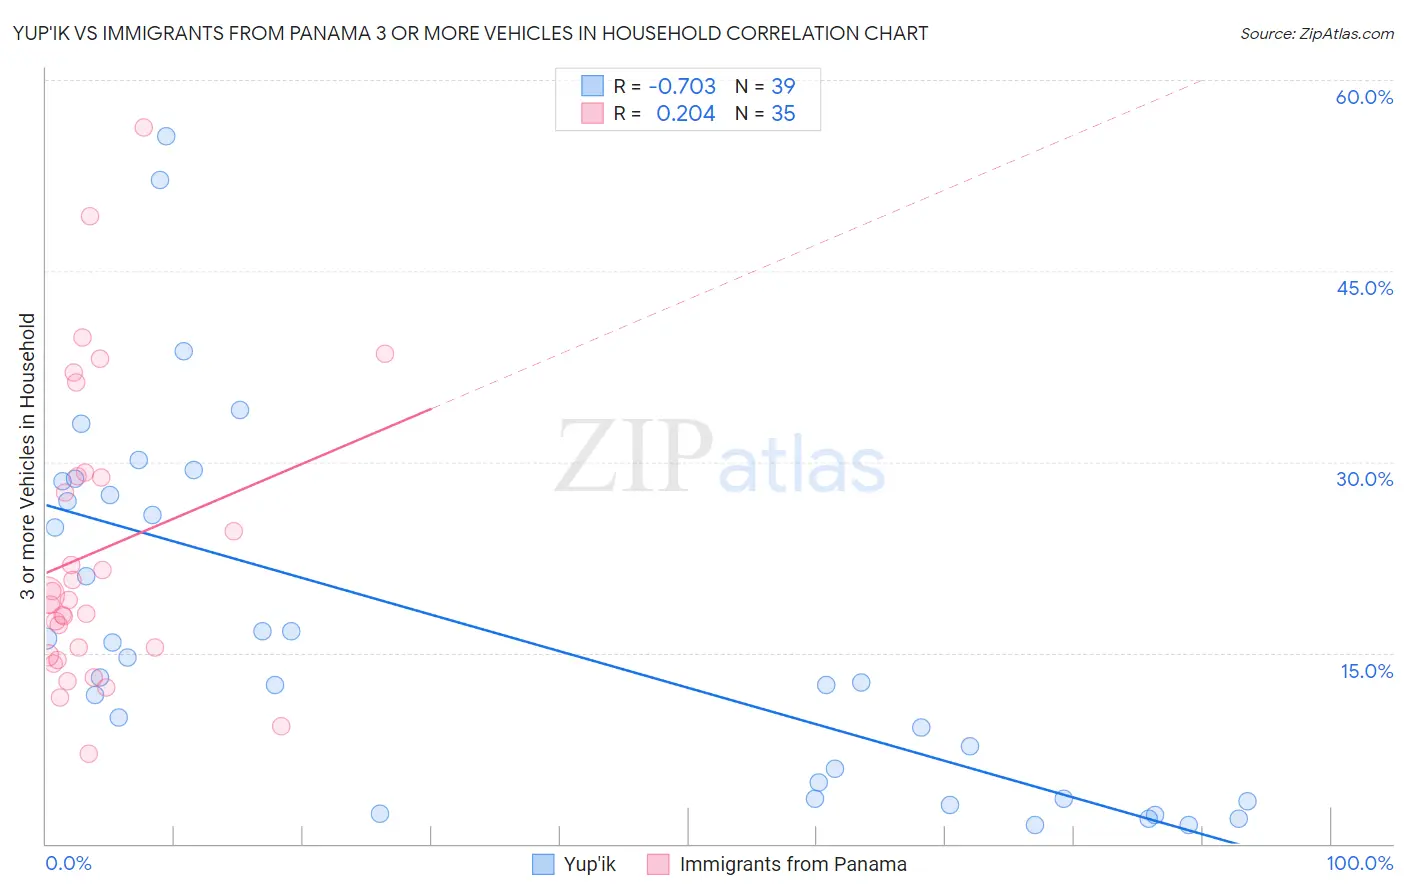
Yup'ik vs Immigrants from Panama 3 or more Vehicles in Household Correlation Chart
The statistical analysis conducted on geographies consisting of 39,914,717 people shows a strong negative correlation between the proportion of Yup'ik and percentage of households with 3 or more vehicles available in the United States with a correlation coefficient (R) of -0.703 and weighted average of 14.8%. Similarly, the statistical analysis conducted on geographies consisting of 221,149,487 people shows a weak positive correlation between the proportion of Immigrants from Panama and percentage of households with 3 or more vehicles available in the United States with a correlation coefficient (R) of 0.204 and weighted average of 17.7%, a difference of 19.5%.
3 or more Vehicles in Household Correlation Summary
| Measurement | Yup'ik | Immigrants from Panama |
| Minimum | 1.4% | 7.1% |
| Maximum | 55.6% | 56.2% |
| Range | 54.1% | 49.1% |
| Mean | 16.9% | 23.0% |
| Median | 13.1% | 19.1% |
| Interquartile 25% (IQ1) | 3.6% | 14.8% |
| Interquartile 75% (IQ3) | 27.4% | 28.9% |
| Interquartile Range (IQR) | 23.9% | 14.1% |
| Standard Deviation (Sample) | 13.9% | 11.5% |
| Standard Deviation (Population) | 13.8% | 11.3% |
Similar Demographics by 3 or more Vehicles in Household
Demographics Similar to Yup'ik by 3 or more Vehicles in Household
In terms of 3 or more vehicles in household, the demographic groups most similar to Yup'ik are Cape Verdean (15.0%, a difference of 1.1%), Immigrants from Jamaica (14.7%, a difference of 1.1%), Immigrants from West Indies (14.6%, a difference of 1.4%), Immigrants from Caribbean (14.6%, a difference of 1.9%), and Immigrants from Haiti (15.2%, a difference of 2.3%).
| Demographics | Rating | Rank | 3 or more Vehicles in Household |
| Immigrants | Israel | 0.0 /100 | #313 | Tragic 15.6% |
| Immigrants | Belarus | 0.0 /100 | #314 | Tragic 15.5% |
| Haitians | 0.0 /100 | #315 | Tragic 15.5% |
| U.S. Virgin Islanders | 0.0 /100 | #316 | Tragic 15.4% |
| Jamaicans | 0.0 /100 | #317 | Tragic 15.2% |
| Immigrants | Haiti | 0.0 /100 | #318 | Tragic 15.2% |
| Cape Verdeans | 0.0 /100 | #319 | Tragic 15.0% |
| Yup'ik | 0.0 /100 | #320 | Tragic 14.8% |
| Immigrants | Jamaica | 0.0 /100 | #321 | Tragic 14.7% |
| Immigrants | West Indies | 0.0 /100 | #322 | Tragic 14.6% |
| Immigrants | Caribbean | 0.0 /100 | #323 | Tragic 14.6% |
| Immigrants | Yemen | 0.0 /100 | #324 | Tragic 14.2% |
| Senegalese | 0.0 /100 | #325 | Tragic 14.2% |
| Soviet Union | 0.0 /100 | #326 | Tragic 14.2% |
| Ecuadorians | 0.0 /100 | #327 | Tragic 14.1% |
Demographics Similar to Immigrants from Panama by 3 or more Vehicles in Household
In terms of 3 or more vehicles in household, the demographic groups most similar to Immigrants from Panama are Macedonian (17.7%, a difference of 0.020%), Immigrants from Venezuela (17.7%, a difference of 0.080%), Immigrants from Bulgaria (17.7%, a difference of 0.090%), Cambodian (17.8%, a difference of 0.14%), and Bermudan (17.8%, a difference of 0.16%).
| Demographics | Rating | Rank | 3 or more Vehicles in Household |
| Sudanese | 1.1 /100 | #258 | Tragic 17.8% |
| Uruguayans | 1.0 /100 | #259 | Tragic 17.8% |
| Ugandans | 0.9 /100 | #260 | Tragic 17.8% |
| Immigrants | Northern Africa | 0.9 /100 | #261 | Tragic 17.8% |
| Colombians | 0.9 /100 | #262 | Tragic 17.8% |
| Bermudans | 0.9 /100 | #263 | Tragic 17.8% |
| Cambodians | 0.9 /100 | #264 | Tragic 17.8% |
| Immigrants | Panama | 0.8 /100 | #265 | Tragic 17.7% |
| Macedonians | 0.8 /100 | #266 | Tragic 17.7% |
| Immigrants | Venezuela | 0.8 /100 | #267 | Tragic 17.7% |
| Immigrants | Bulgaria | 0.8 /100 | #268 | Tragic 17.7% |
| Immigrants | France | 0.6 /100 | #269 | Tragic 17.6% |
| Immigrants | Nepal | 0.6 /100 | #270 | Tragic 17.6% |
| South Americans | 0.6 /100 | #271 | Tragic 17.6% |
| Immigrants | Africa | 0.5 /100 | #272 | Tragic 17.6% |