Laureles, TX Map & Demographics
Laureles Map
Laureles Overview
$13,945
PER CAPITA INCOME
$46,483
AVG FAMILY INCOME
$43,500
AVG HOUSEHOLD INCOME
40.4%
WAGE / INCOME GAP [ % ]
59.6¢/ $1
WAGE / INCOME GAP [ $ ]
0.42
INEQUALITY / GINI INDEX
3,818
TOTAL POPULATION
1,919
MALE POPULATION
1,899
FEMALE POPULATION
101.05
MALES / 100 FEMALES
98.96
FEMALES / 100 MALES
28.2
MEDIAN AGE
4.2
AVG FAMILY SIZE
3.9
AVG HOUSEHOLD SIZE
1,458
LABOR FORCE [ PEOPLE ]
53.0%
PERCENT IN LABOR FORCE
9.0%
UNEMPLOYMENT RATE
Income in Laureles
Income Overview in Laureles
Per Capita Income in Laureles is $13,945, while median incomes of families and households are $46,483 and $43,500 respectively.
| Characteristic | Number | Measure |
| Per Capita Income | 3,818 | $13,945 |
| Median Family Income | 842 | $46,483 |
| Mean Family Income | 842 | $55,271 |
| Median Household Income | 990 | $43,500 |
| Mean Household Income | 990 | $49,954 |
| Income Deficit | 842 | $0 |
| Wage / Income Gap (%) | 3,818 | 40.38% |
| Wage / Income Gap ($) | 3,818 | 59.62¢ per $1 |
| Gini / Inequality Index | 3,818 | 0.42 |
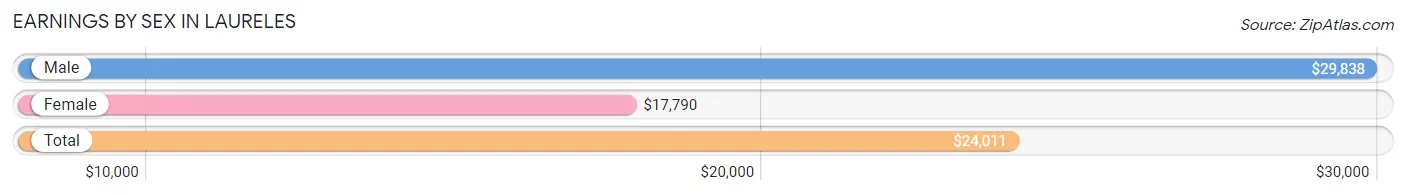
Earnings by Sex in Laureles
Average Earnings in Laureles are $24,011, $29,838 for men and $17,790 for women, a difference of 40.4%.
| Sex | Number | Average Earnings |
| Male | 911 (61.3%) | $29,838 |
| Female | 575 (38.7%) | $17,790 |
| Total | 1,486 (100.0%) | $24,011 |
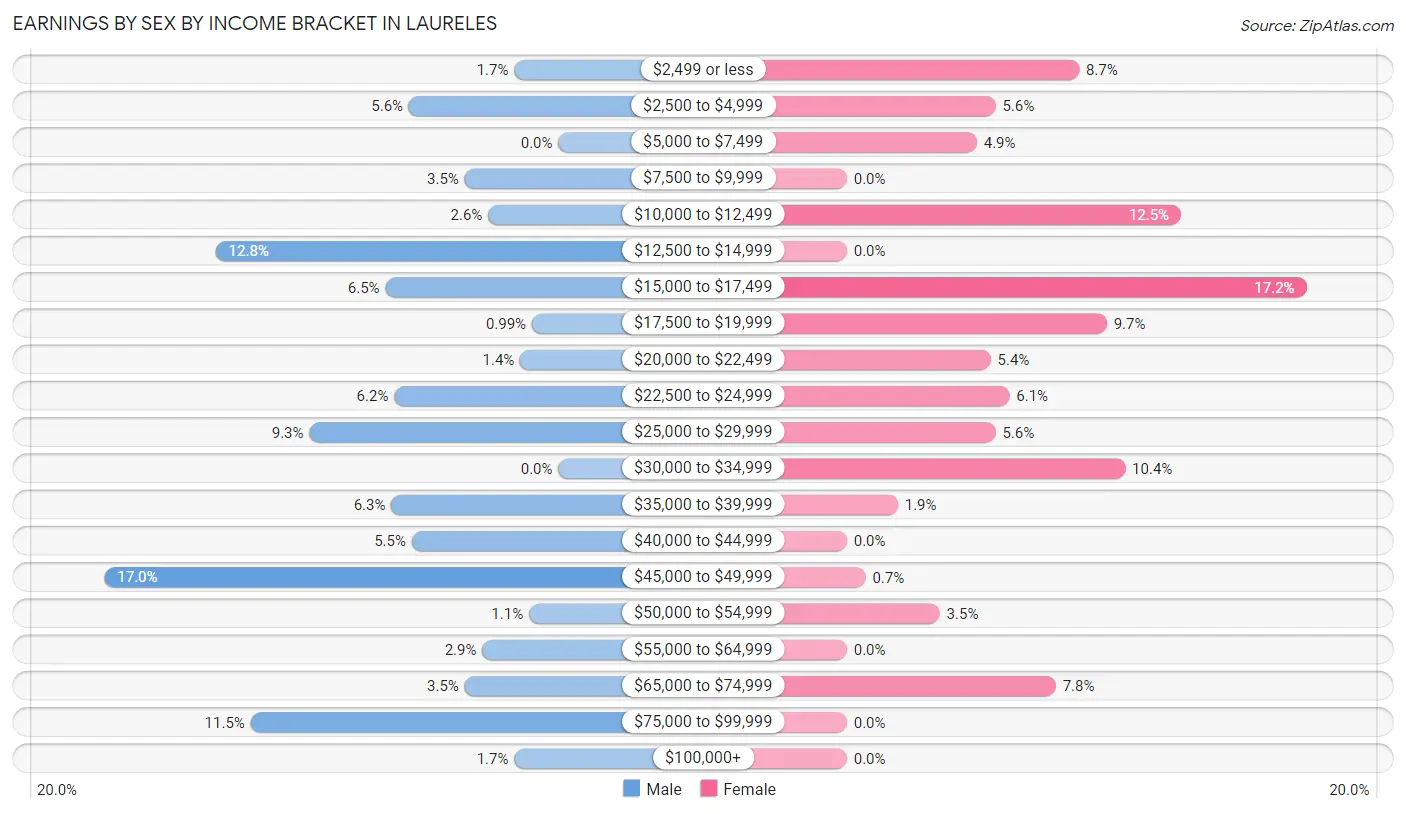
Earnings by Sex by Income Bracket in Laureles
The most common earnings brackets in Laureles are $45,000 to $49,999 for men (155 | 17.0%) and $15,000 to $17,499 for women (99 | 17.2%).
| Income | Male | Female |
| $2,499 or less | 15 (1.7%) | 50 (8.7%) |
| $2,500 to $4,999 | 51 (5.6%) | 32 (5.6%) |
| $5,000 to $7,499 | 0 (0.0%) | 28 (4.9%) |
| $7,500 to $9,999 | 32 (3.5%) | 0 (0.0%) |
| $10,000 to $12,499 | 24 (2.6%) | 72 (12.5%) |
| $12,500 to $14,999 | 117 (12.8%) | 0 (0.0%) |
| $15,000 to $17,499 | 59 (6.5%) | 99 (17.2%) |
| $17,500 to $19,999 | 9 (1.0%) | 56 (9.7%) |
| $20,000 to $22,499 | 13 (1.4%) | 31 (5.4%) |
| $22,500 to $24,999 | 56 (6.1%) | 35 (6.1%) |
| $25,000 to $29,999 | 85 (9.3%) | 32 (5.6%) |
| $30,000 to $34,999 | 0 (0.0%) | 60 (10.4%) |
| $35,000 to $39,999 | 57 (6.3%) | 11 (1.9%) |
| $40,000 to $44,999 | 50 (5.5%) | 0 (0.0%) |
| $45,000 to $49,999 | 155 (17.0%) | 4 (0.7%) |
| $50,000 to $54,999 | 10 (1.1%) | 20 (3.5%) |
| $55,000 to $64,999 | 26 (2.9%) | 0 (0.0%) |
| $65,000 to $74,999 | 32 (3.5%) | 45 (7.8%) |
| $75,000 to $99,999 | 105 (11.5%) | 0 (0.0%) |
| $100,000+ | 15 (1.7%) | 0 (0.0%) |
| Total | 911 (100.0%) | 575 (100.0%) |
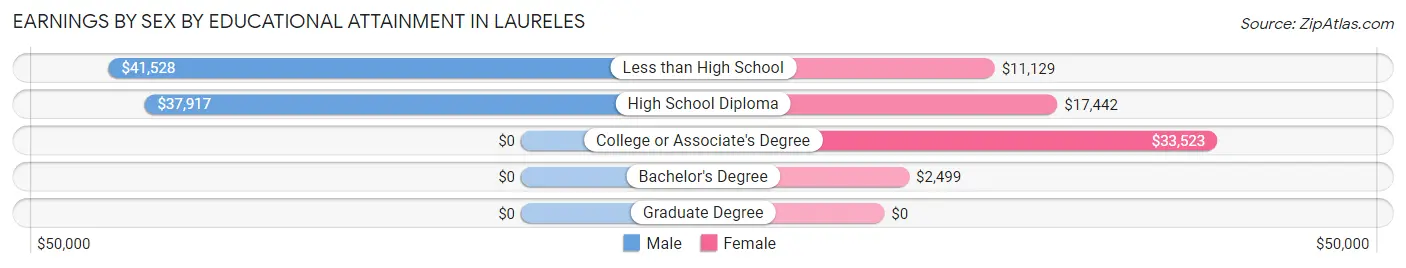
Earnings by Sex by Educational Attainment in Laureles
Average earnings in Laureles are $39,053 for men and $18,636 for women, a difference of 52.3%. Men with an educational attainment of less than high school enjoy the highest average annual earnings of $41,528, while those with high school diploma education earn the least with $37,917. Women with an educational attainment of college or associate's degree earn the most with the average annual earnings of $33,523, while those with bachelor's degree education have the smallest earnings of $2,499.
| Educational Attainment | Male Income | Female Income |
| Less than High School | $41,528 | $11,129 |
| High School Diploma | $37,917 | $17,442 |
| College or Associate's Degree | - | - |
| Bachelor's Degree | - | - |
| Graduate Degree | - | - |
| Total | $39,053 | $18,636 |
Family Income in Laureles
Family Income Brackets in Laureles
According to the Laureles family income data, there are 173 families falling into the $50,000 to $74,999 income range, which is the most common income bracket and makes up 20.5% of all families.
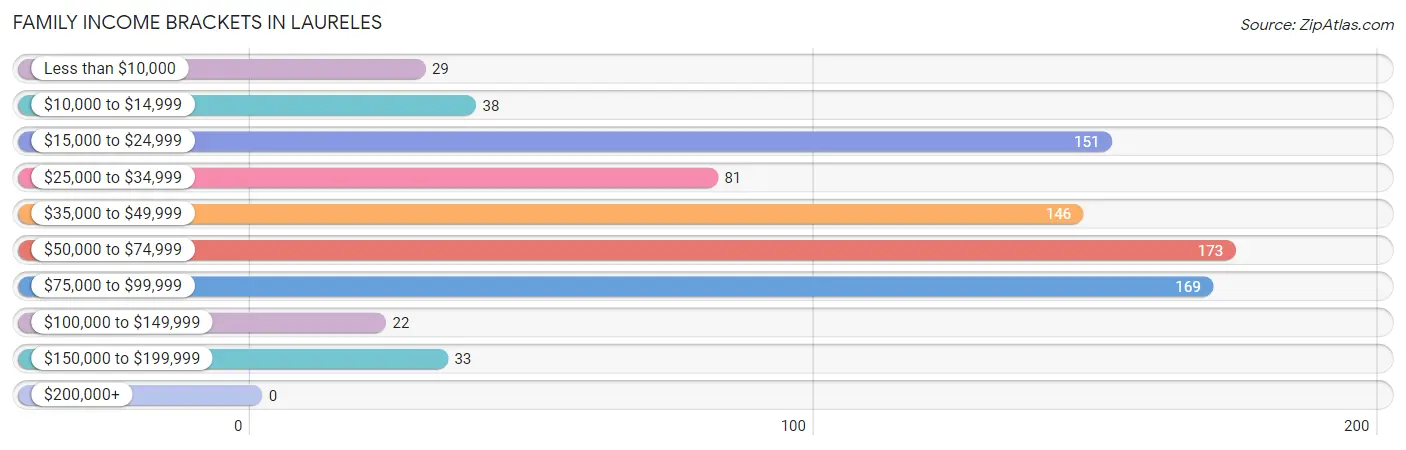
| Income Bracket | # Families | % Families |
| Less than $10,000 | 29 | 3.4% |
| $10,000 to $14,999 | 38 | 4.5% |
| $15,000 to $24,999 | 151 | 17.9% |
| $25,000 to $34,999 | 81 | 9.6% |
| $35,000 to $49,999 | 146 | 17.3% |
| $50,000 to $74,999 | 173 | 20.5% |
| $75,000 to $99,999 | 169 | 20.1% |
| $100,000 to $149,999 | 22 | 2.6% |
| $150,000 to $199,999 | 33 | 3.9% |
| $200,000+ | 0 | 0.0% |
Family Income by Famaliy Size in Laureles
5-person families (141 | 16.8%) account for the highest median family income in Laureles with $93,250 per family, while 5-person families (141 | 16.8%) have the highest median income of $18,650 per family member.
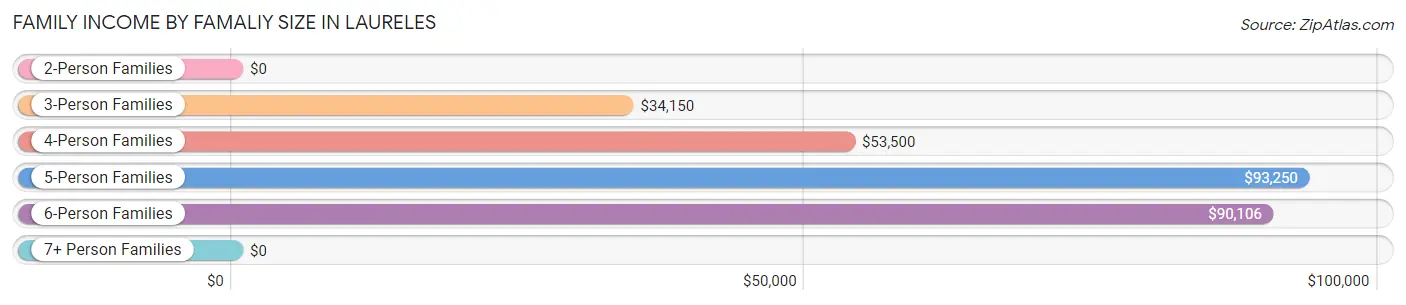
| Income Bracket | # Families | Median Income |
| 2-Person Families | 198 (23.5%) | $0 |
| 3-Person Families | 217 (25.8%) | $34,150 |
| 4-Person Families | 126 (15.0%) | $53,500 |
| 5-Person Families | 141 (16.8%) | $93,250 |
| 6-Person Families | 149 (17.7%) | $90,106 |
| 7+ Person Families | 11 (1.3%) | $0 |
| Total | 842 (100.0%) | $46,483 |
Family Income by Number of Earners in Laureles
The median family income in Laureles is $46,483, with families comprising 3+ earners (101) having the highest median family income of $82,813, while families with no earners (108) have the lowest median family income of $15,614, accounting for 12.0% and 12.8% of families, respectively.
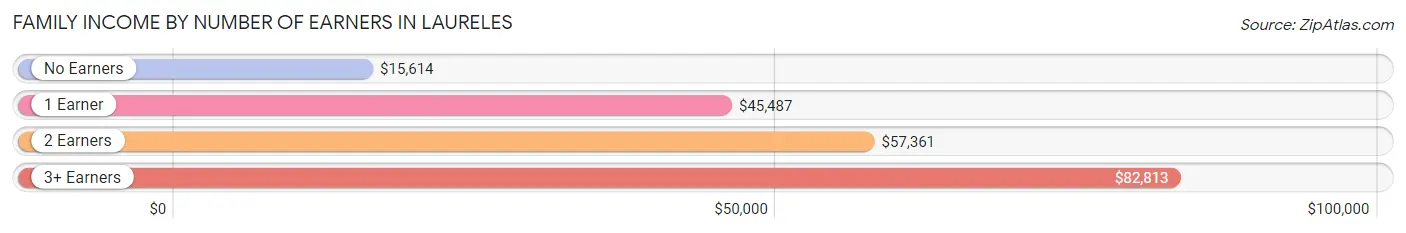
| Number of Earners | # Families | Median Income |
| No Earners | 108 (12.8%) | $15,614 |
| 1 Earner | 337 (40.0%) | $45,487 |
| 2 Earners | 296 (35.1%) | $57,361 |
| 3+ Earners | 101 (12.0%) | $82,813 |
| Total | 842 (100.0%) | $46,483 |
Household Income in Laureles
Household Income Brackets in Laureles
With 214 households falling in the category, the $50,000 to $74,999 income range is the most frequent in Laureles, accounting for 21.6% of all households.
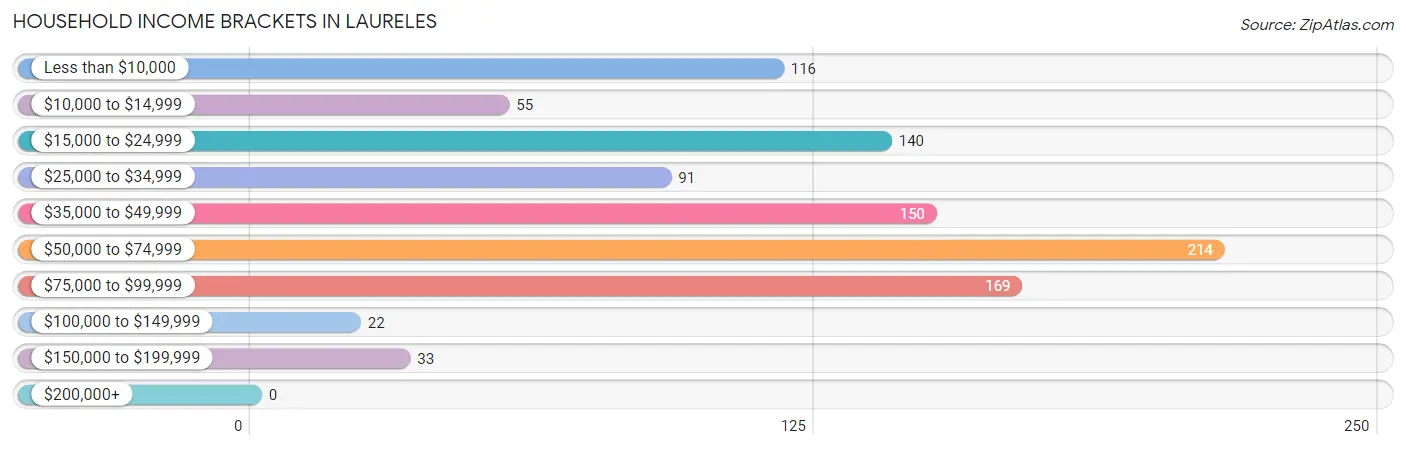
| Income Bracket | # Households | % Households |
| Less than $10,000 | 116 | 11.7% |
| $10,000 to $14,999 | 55 | 5.6% |
| $15,000 to $24,999 | 140 | 14.1% |
| $25,000 to $34,999 | 91 | 9.2% |
| $35,000 to $49,999 | 150 | 15.2% |
| $50,000 to $74,999 | 214 | 21.6% |
| $75,000 to $99,999 | 169 | 17.1% |
| $100,000 to $149,999 | 22 | 2.2% |
| $150,000 to $199,999 | 33 | 3.3% |
| $200,000+ | 0 | 0.0% |
Household Income by Householder Age in Laureles
The median household income in Laureles is $43,500, with the highest median household income of $64,950 found in the 25 to 44 years age bracket for the primary householder. A total of 300 households (30.3%) fall into this category. Meanwhile, the 15 to 24 years age bracket for the primary householder has the lowest median household income of $0, with 45 households (4.5%) in this group.
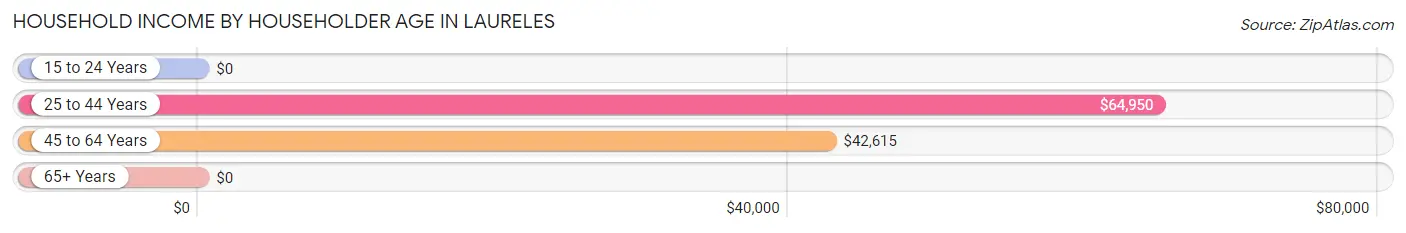
| Income Bracket | # Households | Median Income |
| 15 to 24 Years | 45 (4.5%) | $0 |
| 25 to 44 Years | 300 (30.3%) | $64,950 |
| 45 to 64 Years | 490 (49.5%) | $42,615 |
| 65+ Years | 155 (15.7%) | $0 |
| Total | 990 (100.0%) | $43,500 |
Poverty in Laureles
Income Below Poverty by Sex and Age in Laureles
With 24.6% poverty level for males and 30.6% for females among the residents of Laureles, 75 year old and over males and 15 year old females are the most vulnerable to poverty, with 17 males (80.9%) and 25 females (100.0%) in their respective age groups living below the poverty level.
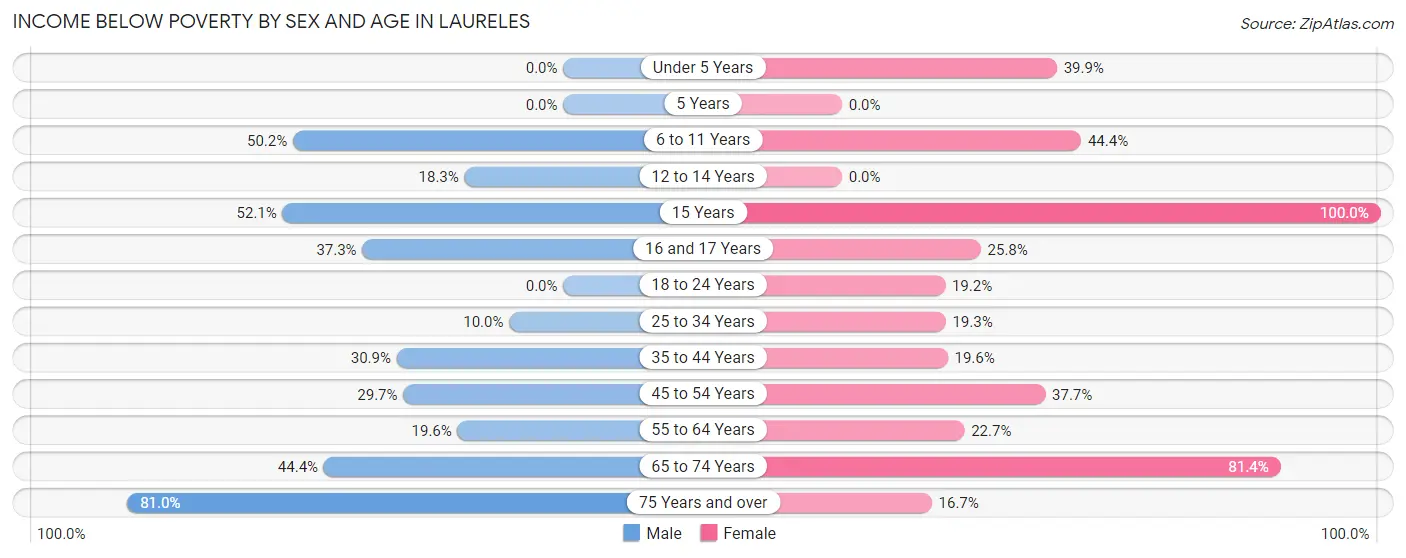
| Age Bracket | Male | Female |
| Under 5 Years | 0 (0.0%) | 71 (39.9%) |
| 5 Years | 0 (0.0%) | 0 (0.0%) |
| 6 to 11 Years | 138 (50.2%) | 107 (44.4%) |
| 12 to 14 Years | 11 (18.3%) | 0 (0.0%) |
| 15 Years | 37 (52.1%) | 25 (100.0%) |
| 16 and 17 Years | 22 (37.3%) | 25 (25.8%) |
| 18 to 24 Years | 0 (0.0%) | 45 (19.2%) |
| 25 to 34 Years | 28 (10.0%) | 31 (19.3%) |
| 35 to 44 Years | 85 (30.9%) | 63 (19.6%) |
| 45 to 54 Years | 60 (29.7%) | 80 (37.7%) |
| 55 to 64 Years | 42 (19.6%) | 45 (22.7%) |
| 65 to 74 Years | 32 (44.4%) | 79 (81.4%) |
| 75 Years and over | 17 (80.9%) | 11 (16.7%) |
| Total | 472 (24.6%) | 582 (30.6%) |
Income Above Poverty by Sex and Age in Laureles
According to the poverty statistics in Laureles, males aged under 5 years and females aged 12 to 14 years are the age groups that are most secure financially, with 100.0% of males and 100.0% of females in these age groups living above the poverty line.
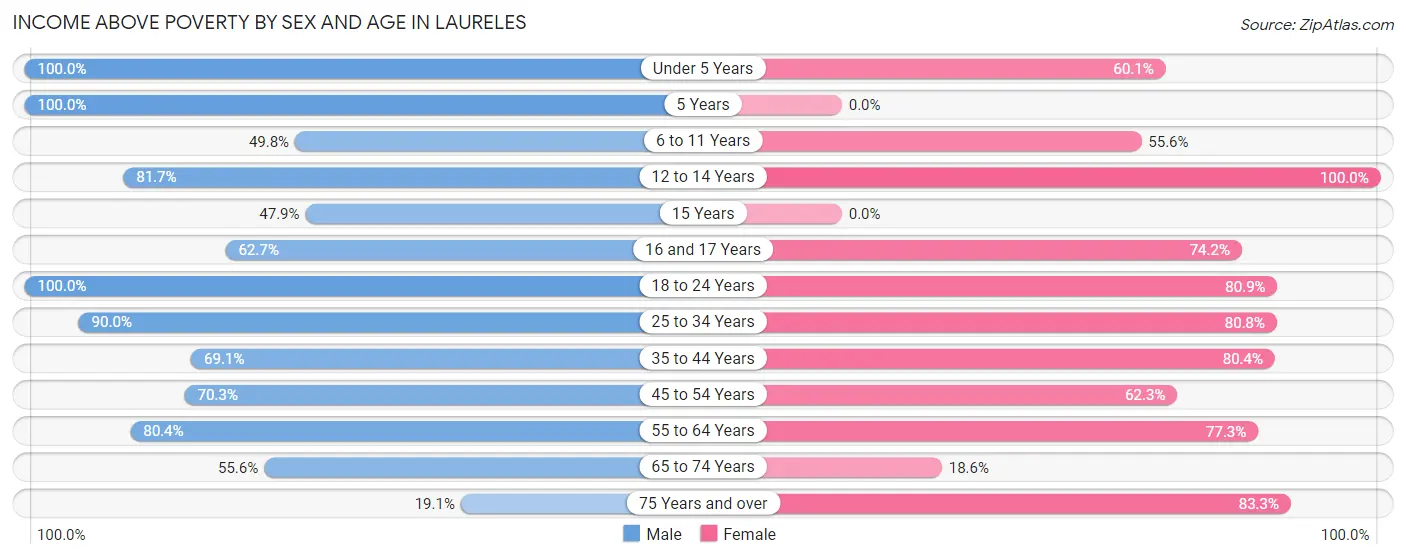
| Age Bracket | Male | Female |
| Under 5 Years | 122 (100.0%) | 107 (60.1%) |
| 5 Years | 27 (100.0%) | 0 (0.0%) |
| 6 to 11 Years | 137 (49.8%) | 134 (55.6%) |
| 12 to 14 Years | 49 (81.7%) | 68 (100.0%) |
| 15 Years | 34 (47.9%) | 0 (0.0%) |
| 16 and 17 Years | 37 (62.7%) | 72 (74.2%) |
| 18 to 24 Years | 242 (100.0%) | 190 (80.8%) |
| 25 to 34 Years | 251 (90.0%) | 130 (80.7%) |
| 35 to 44 Years | 190 (69.1%) | 258 (80.4%) |
| 45 to 54 Years | 142 (70.3%) | 132 (62.3%) |
| 55 to 64 Years | 172 (80.4%) | 153 (77.3%) |
| 65 to 74 Years | 40 (55.6%) | 18 (18.6%) |
| 75 Years and over | 4 (19.1%) | 55 (83.3%) |
| Total | 1,447 (75.4%) | 1,317 (69.4%) |
Income Below Poverty Among Married-Couple Families in Laureles
The poverty statistics for married-couple families in Laureles show that 15.2% or 70 of the total 460 families live below the poverty line. Families with 3 or 4 children have the highest poverty rate of 53.9%, comprising of 41 families. On the other hand, families with 1 or 2 children have the lowest poverty rate of 0.0%, which includes 0 families.
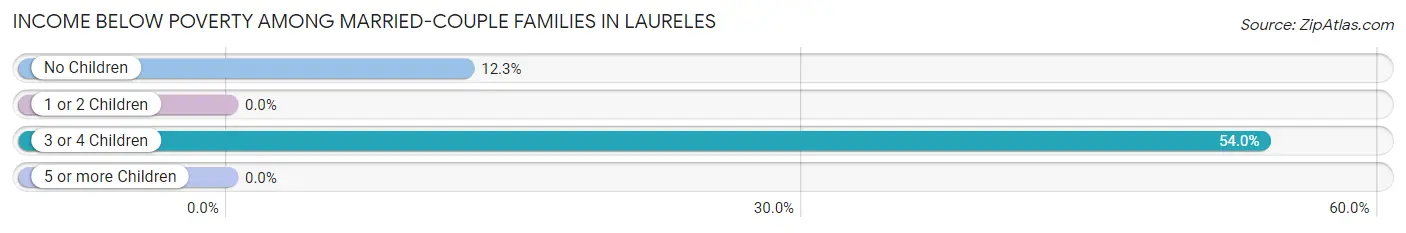
| Children | Above Poverty | Below Poverty |
| No Children | 206 (87.7%) | 29 (12.3%) |
| 1 or 2 Children | 138 (100.0%) | 0 (0.0%) |
| 3 or 4 Children | 35 (46.1%) | 41 (53.9%) |
| 5 or more Children | 11 (100.0%) | 0 (0.0%) |
| Total | 390 (84.8%) | 70 (15.2%) |
Income Below Poverty Among Single-Parent Households in Laureles
According to the poverty data in Laureles, 11.0% or 15 single-father households and 71.0% or 174 single-mother households are living below the poverty line. Among single-father households, those with 1 or 2 children have the highest poverty rate, with 15 households (25.4%) experiencing poverty. Likewise, among single-mother households, those with 1 or 2 children have the highest poverty rate, with 163 households (85.3%) falling below the poverty line.
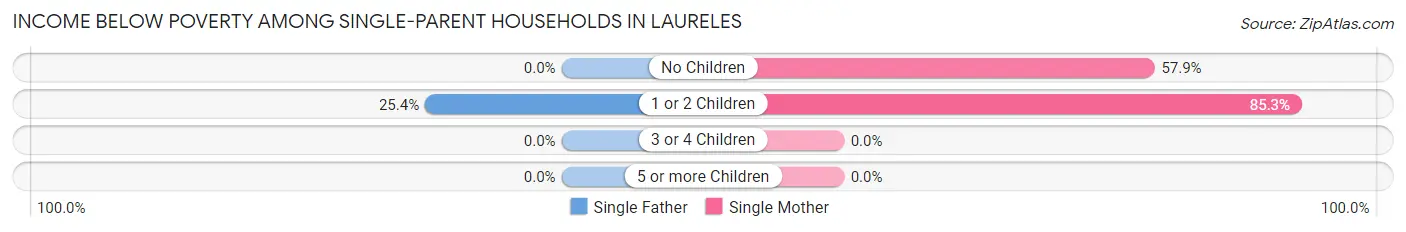
| Children | Single Father | Single Mother |
| No Children | 0 (0.0%) | 11 (57.9%) |
| 1 or 2 Children | 15 (25.4%) | 163 (85.3%) |
| 3 or 4 Children | 0 (0.0%) | 0 (0.0%) |
| 5 or more Children | 0 (0.0%) | 0 (0.0%) |
| Total | 15 (11.0%) | 174 (71.0%) |
Income Below Poverty Among Married-Couple vs Single-Parent Households in Laureles
The poverty data for Laureles shows that 70 of the married-couple family households (15.2%) and 189 of the single-parent households (49.5%) are living below the poverty level. Within the married-couple family households, those with 3 or 4 children have the highest poverty rate, with 41 households (53.9%) falling below the poverty line. Among the single-parent households, those with 1 or 2 children have the highest poverty rate, with 178 household (71.2%) living below poverty.
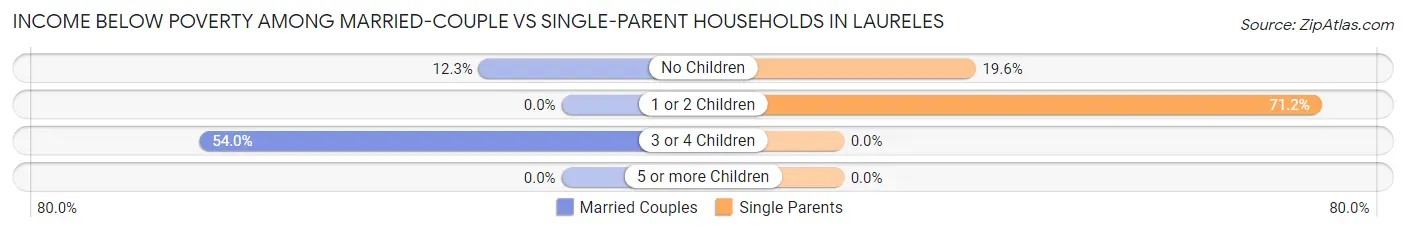
| Children | Married-Couple Families | Single-Parent Households |
| No Children | 29 (12.3%) | 11 (19.6%) |
| 1 or 2 Children | 0 (0.0%) | 178 (71.2%) |
| 3 or 4 Children | 41 (53.9%) | 0 (0.0%) |
| 5 or more Children | 0 (0.0%) | 0 (0.0%) |
| Total | 70 (15.2%) | 189 (49.5%) |
Race in Laureles
The most populous races in Laureles are Hispanic or Latino (3,751 | 98.3%), White / Caucasian (2,560 | 67.0%), and Two or more Races (1,062 | 27.8%).
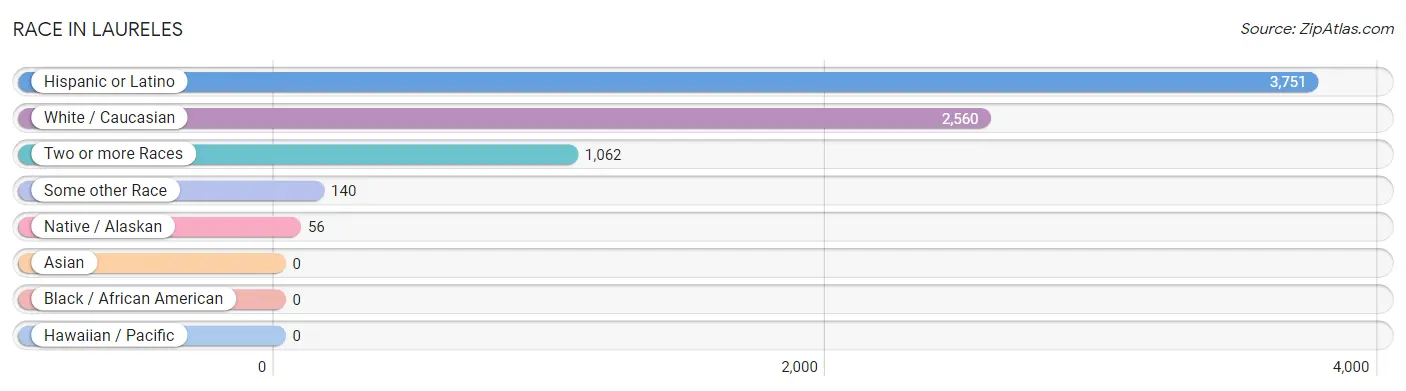
| Race | # Population | % Population |
| Asian | 0 | 0.0% |
| Black / African American | 0 | 0.0% |
| Hawaiian / Pacific | 0 | 0.0% |
| Hispanic or Latino | 3,751 | 98.3% |
| Native / Alaskan | 56 | 1.5% |
| White / Caucasian | 2,560 | 67.0% |
| Two or more Races | 1,062 | 27.8% |
| Some other Race | 140 | 3.7% |
| Total | 3,818 | 100.0% |
Ancestry in Laureles
The most populous ancestries reported in Laureles are Mexican (3,454 | 90.5%), Central American (56 | 1.5%), Choctaw (56 | 1.5%), Honduran (37 | 1.0%), and European (34 | 0.9%), together accounting for 95.3% of all Laureles residents.
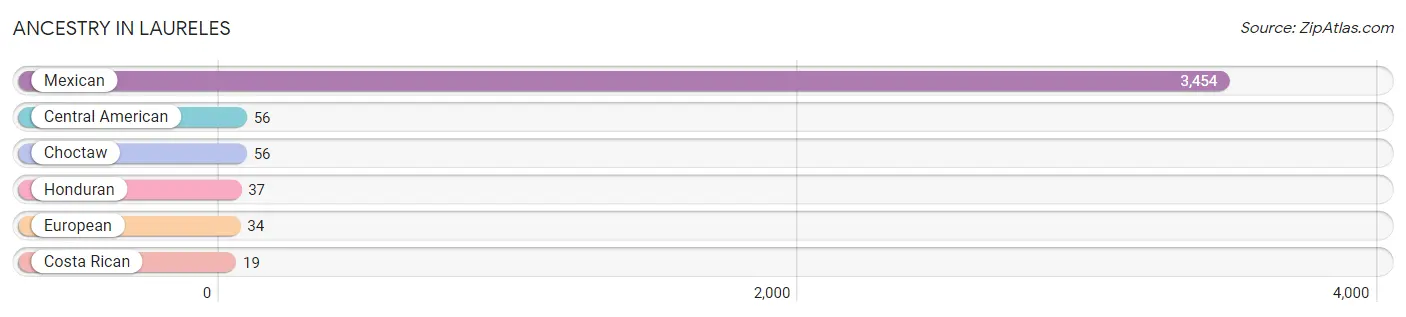
| Ancestry | # Population | % Population |
| Central American | 56 | 1.5% |
| Choctaw | 56 | 1.5% |
| Costa Rican | 19 | 0.5% |
| European | 34 | 0.9% |
| Honduran | 37 | 1.0% |
| Mexican | 3,454 | 90.5% | View All 6 Rows |
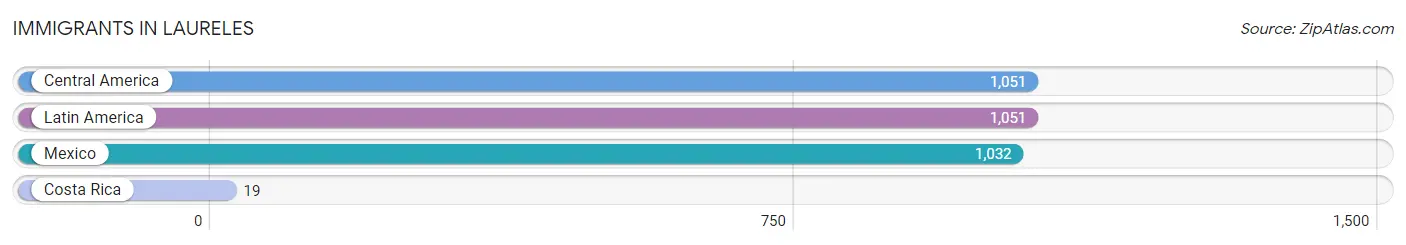
Immigrants in Laureles
The most numerous immigrant groups reported in Laureles came from Central America (1,051 | 27.5%), Latin America (1,051 | 27.5%), Mexico (1,032 | 27.0%), and Costa Rica (19 | 0.5%), together accounting for 82.6% of all Laureles residents.
| Immigration Origin | # Population | % Population |
| Central America | 1,051 | 27.5% |
| Costa Rica | 19 | 0.5% |
| Latin America | 1,051 | 27.5% |
| Mexico | 1,032 | 27.0% | View All 4 Rows |
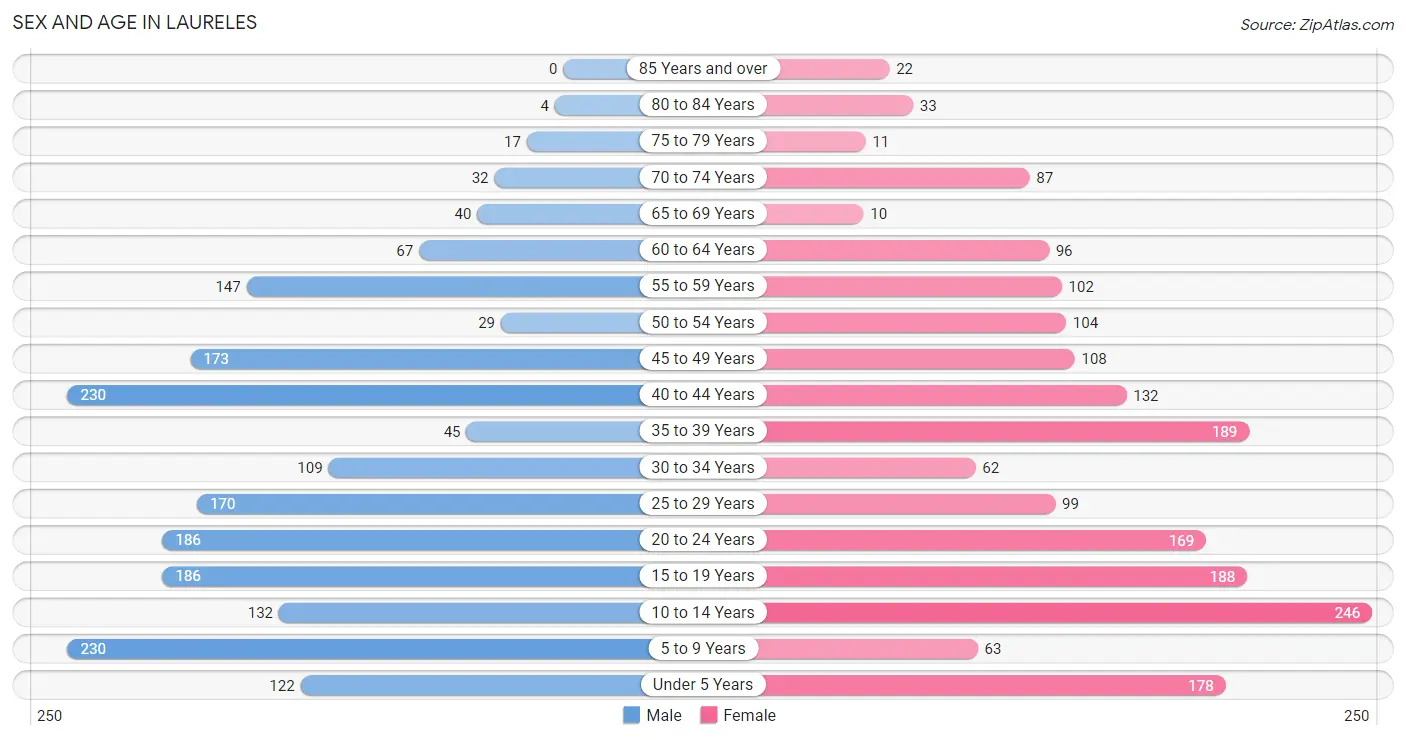
Sex and Age in Laureles
Sex and Age in Laureles
The most populous age groups in Laureles are 5 to 9 Years (230 | 12.0%) for men and 10 to 14 Years (246 | 13.0%) for women.
| Age Bracket | Male | Female |
| Under 5 Years | 122 (6.4%) | 178 (9.4%) |
| 5 to 9 Years | 230 (12.0%) | 63 (3.3%) |
| 10 to 14 Years | 132 (6.9%) | 246 (13.0%) |
| 15 to 19 Years | 186 (9.7%) | 188 (9.9%) |
| 20 to 24 Years | 186 (9.7%) | 169 (8.9%) |
| 25 to 29 Years | 170 (8.9%) | 99 (5.2%) |
| 30 to 34 Years | 109 (5.7%) | 62 (3.3%) |
| 35 to 39 Years | 45 (2.3%) | 189 (10.0%) |
| 40 to 44 Years | 230 (12.0%) | 132 (7.0%) |
| 45 to 49 Years | 173 (9.0%) | 108 (5.7%) |
| 50 to 54 Years | 29 (1.5%) | 104 (5.5%) |
| 55 to 59 Years | 147 (7.7%) | 102 (5.4%) |
| 60 to 64 Years | 67 (3.5%) | 96 (5.1%) |
| 65 to 69 Years | 40 (2.1%) | 10 (0.5%) |
| 70 to 74 Years | 32 (1.7%) | 87 (4.6%) |
| 75 to 79 Years | 17 (0.9%) | 11 (0.6%) |
| 80 to 84 Years | 4 (0.2%) | 33 (1.7%) |
| 85 Years and over | 0 (0.0%) | 22 (1.2%) |
| Total | 1,919 (100.0%) | 1,899 (100.0%) |
Families and Households in Laureles
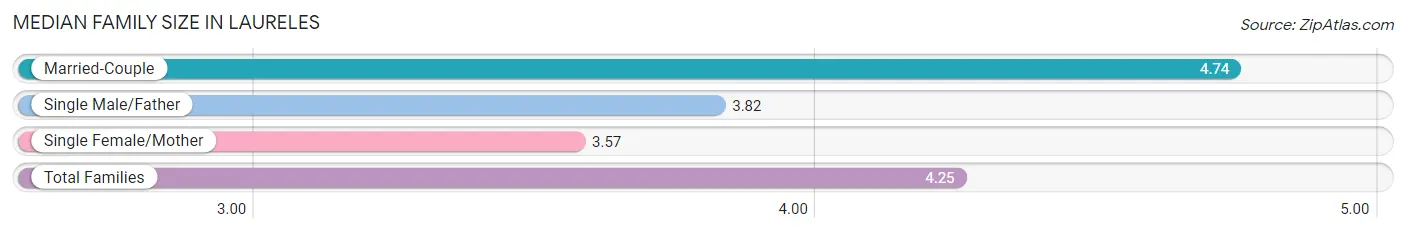
Median Family Size in Laureles
The median family size in Laureles is 4.25 persons per family, with married-couple families (460 | 54.6%) accounting for the largest median family size of 4.74 persons per family. On the other hand, single female/mother families (245 | 29.1%) represent the smallest median family size with 3.57 persons per family.
| Family Type | # Families | Family Size |
| Married-Couple | 460 (54.6%) | 4.74 |
| Single Male/Father | 137 (16.3%) | 3.82 |
| Single Female/Mother | 245 (29.1%) | 3.57 |
| Total Families | 842 (100.0%) | 4.25 |
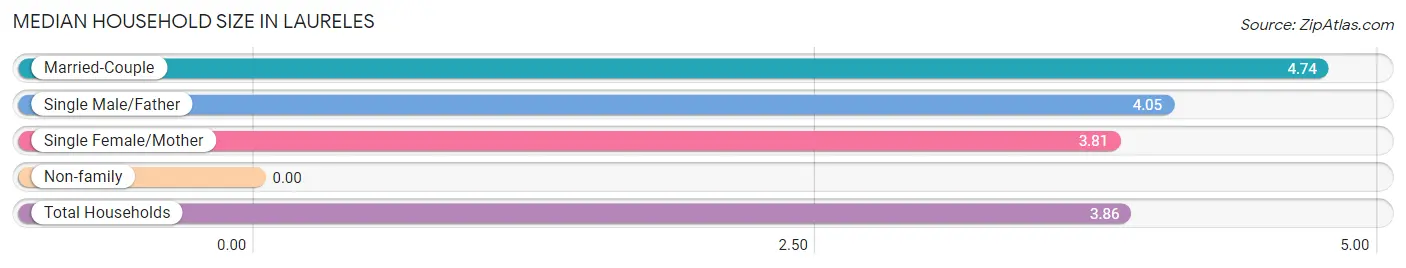
Median Household Size in Laureles
| Household Type | # Households | Household Size |
| Married-Couple | 460 (46.5%) | 4.74 |
| Single Male/Father | 137 (13.8%) | 4.05 |
| Single Female/Mother | 245 (24.7%) | 3.81 |
| Non-family | 148 (14.9%) | - |
| Total Households | 990 (100.0%) | 3.86 |
Household Size by Marriage Status in Laureles
Out of a total of 990 households in Laureles, 842 (85.1%) are family households, while 148 (14.9%) are nonfamily households. The most numerous type of family households are 2-person households, comprising 198, and the most common type of nonfamily households are 1-person households, comprising 148.
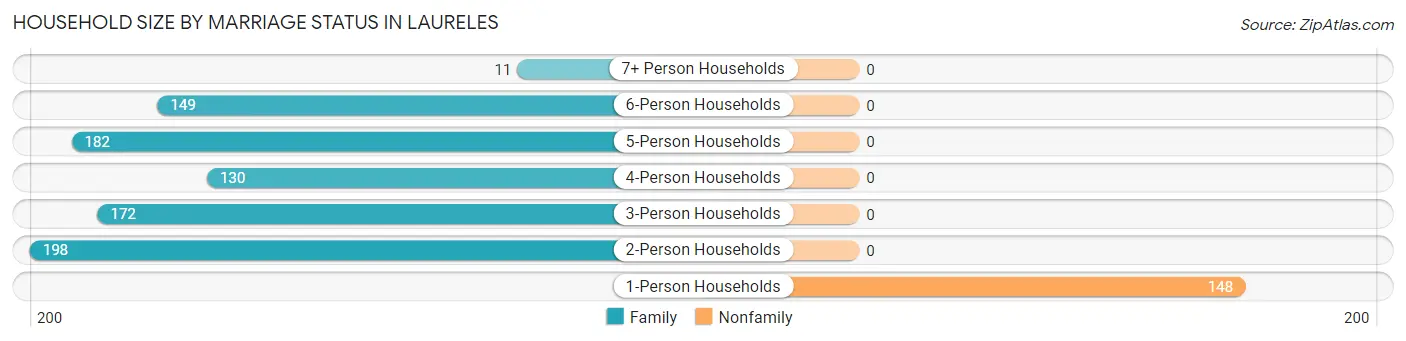
| Household Size | Family Households | Nonfamily Households |
| 1-Person Households | - | 148 (14.9%) |
| 2-Person Households | 198 (20.0%) | 0 (0.0%) |
| 3-Person Households | 172 (17.4%) | 0 (0.0%) |
| 4-Person Households | 130 (13.1%) | 0 (0.0%) |
| 5-Person Households | 182 (18.4%) | 0 (0.0%) |
| 6-Person Households | 149 (15.0%) | 0 (0.0%) |
| 7+ Person Households | 11 (1.1%) | 0 (0.0%) |
| Total | 842 (85.1%) | 148 (14.9%) |
Female Fertility in Laureles
Fertility by Age in Laureles
Average fertility rate in Laureles is 27.0 births per 1,000 women. Women in the age bracket of 20 to 34 years have the highest fertility rate with 79.0 births per 1,000 women. Women in the age bracket of 20 to 34 years acount for 100.0% of all women with births.
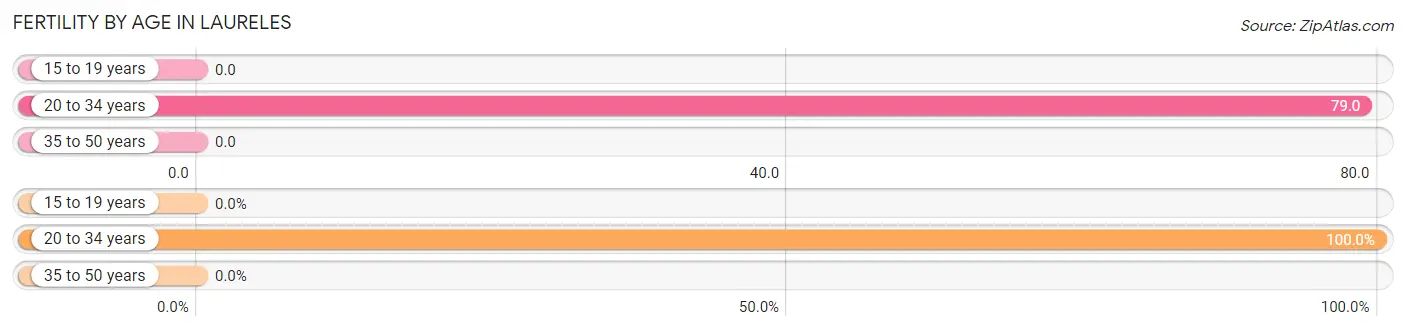
| Age Bracket | Women with Births | Births / 1,000 Women |
| 15 to 19 years | 0 (0.0%) | 0.0 |
| 20 to 34 years | 26 (100.0%) | 79.0 |
| 35 to 50 years | 0 (0.0%) | 0.0 |
| Total | 26 (100.0%) | 27.0 |
Fertility by Age by Marriage Status in Laureles
34.6% of women with births (26) in Laureles are married. The highest percentage of unmarried women with births falls into 20 to 34 years age bracket with 65.4% of them unmarried at the time of birth, while the lowest percentage of unmarried women with births belong to 20 to 34 years age bracket with 65.4% of them unmarried.
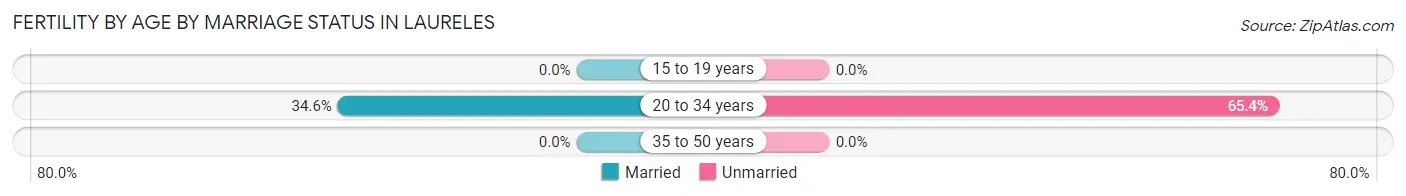
| Age Bracket | Married | Unmarried |
| 15 to 19 years | 0 (0.0%) | 0 (0.0%) |
| 20 to 34 years | 9 (34.6%) | 17 (65.4%) |
| 35 to 50 years | 0 (0.0%) | 0 (0.0%) |
| Total | 9 (34.6%) | 17 (65.4%) |
Fertility by Education in Laureles
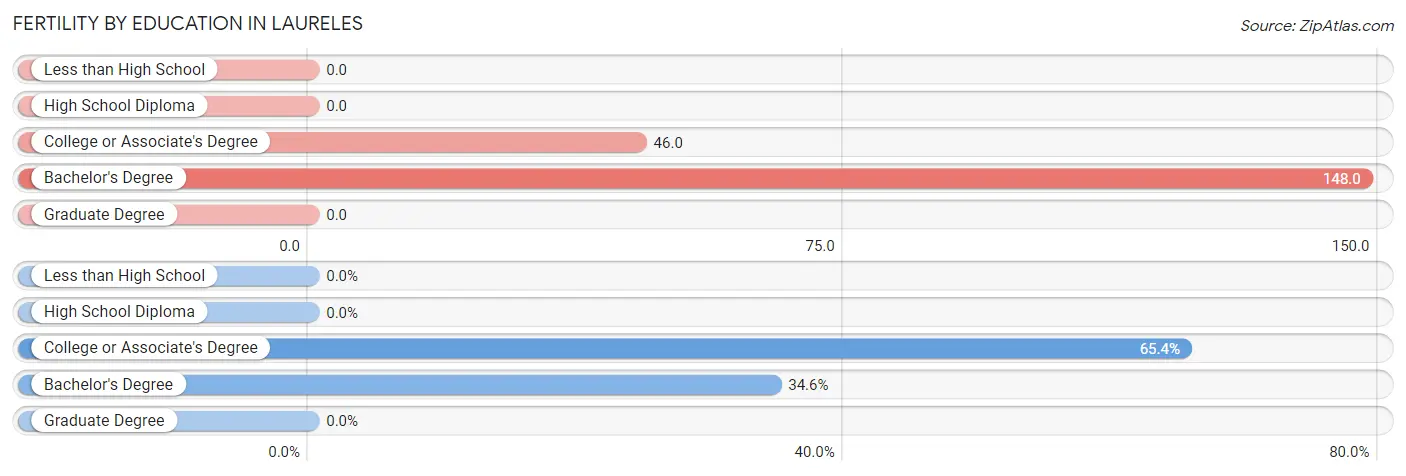
| Educational Attainment | Women with Births | Births / 1,000 Women |
| Less than High School | 0 (0.0%) | 0.0 |
| High School Diploma | 0 (0.0%) | 0.0 |
| College or Associate's Degree | 17 (65.4%) | 46.0 |
| Bachelor's Degree | 9 (34.6%) | 148.0 |
| Graduate Degree | 0 (0.0%) | 0.0 |
| Total | 26 (100.0%) | 27.0 |
Fertility by Education by Marriage Status in Laureles
65.4% of women with births in Laureles are unmarried. Women with the educational attainment of bachelor's degree are most likely to be married with 100.0% of them married at childbirth, while women with the educational attainment of college or associate's degree are least likely to be married with 100.0% of them unmarried at childbirth.
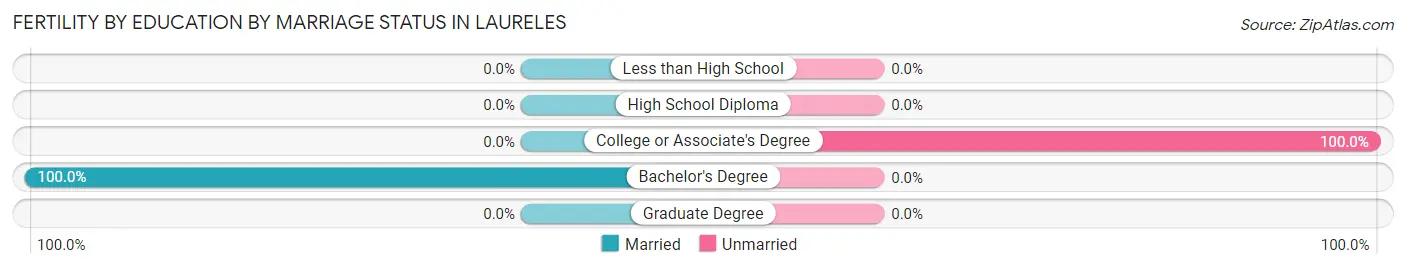
| Educational Attainment | Married | Unmarried |
| Less than High School | 0 (0.0%) | 0 (0.0%) |
| High School Diploma | 0 (0.0%) | 0 (0.0%) |
| College or Associate's Degree | 0 (0.0%) | 17 (100.0%) |
| Bachelor's Degree | 9 (100.0%) | 0 (0.0%) |
| Graduate Degree | 0 (0.0%) | 0 (0.0%) |
| Total | 9 (34.6%) | 17 (65.4%) |
Employment Characteristics in Laureles
Employment by Class of Employer in Laureles
Among the 1,326 employed individuals in Laureles, private company employees (896 | 67.6%), local government employees (187 | 14.1%), and self-employed (not incorporated) (112 | 8.5%) make up the most common classes of employment.
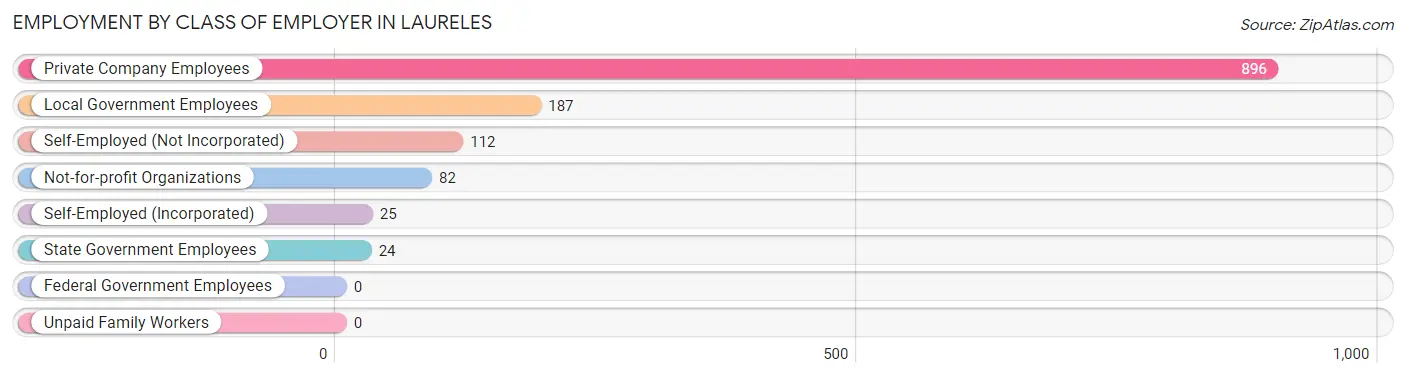
| Employer Class | # Employees | % Employees |
| Private Company Employees | 896 | 67.6% |
| Self-Employed (Incorporated) | 25 | 1.9% |
| Self-Employed (Not Incorporated) | 112 | 8.5% |
| Not-for-profit Organizations | 82 | 6.2% |
| Local Government Employees | 187 | 14.1% |
| State Government Employees | 24 | 1.8% |
| Federal Government Employees | 0 | 0.0% |
| Unpaid Family Workers | 0 | 0.0% |
| Total | 1,326 | 100.0% |
Employment Status by Age in Laureles
According to the labor force statistics for Laureles, out of the total population over 16 years of age (2,751), 53.0% or 1,458 individuals are in the labor force, with 9.0% or 131 of them unemployed. The age group with the highest labor force participation rate is 25 to 29 years, with 85.9% or 231 individuals in the labor force. Within the labor force, the 25 to 29 years age range has the highest percentage of unemployed individuals, with 48.9% or 113 of them being unemployed.
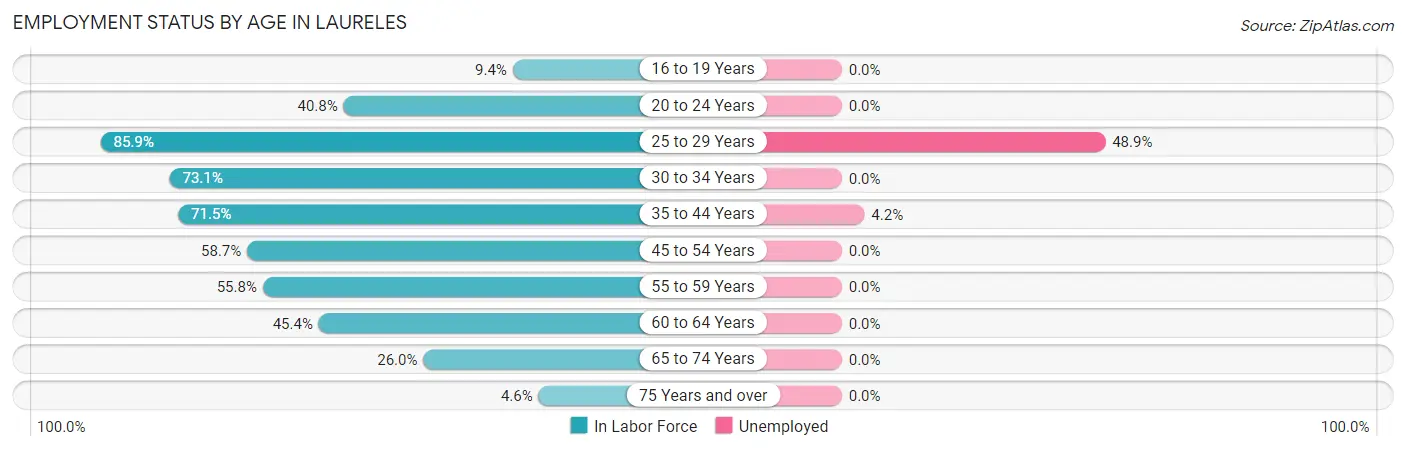
| Age Bracket | In Labor Force | Unemployed |
| 16 to 19 Years | 26 (9.4%) | 0 (0.0%) |
| 20 to 24 Years | 145 (40.8%) | 0 (0.0%) |
| 25 to 29 Years | 231 (85.9%) | 113 (48.9%) |
| 30 to 34 Years | 125 (73.1%) | 0 (0.0%) |
| 35 to 44 Years | 426 (71.5%) | 18 (4.2%) |
| 45 to 54 Years | 243 (58.7%) | 0 (0.0%) |
| 55 to 59 Years | 139 (55.8%) | 0 (0.0%) |
| 60 to 64 Years | 74 (45.4%) | 0 (0.0%) |
| 65 to 74 Years | 44 (26.0%) | 0 (0.0%) |
| 75 Years and over | 4 (4.6%) | 0 (0.0%) |
| Total | 1,458 (53.0%) | 131 (9.0%) |
Employment Status by Educational Attainment in Laureles
According to labor force statistics for Laureles, 66.5% of individuals (1,238) out of the total population between 25 and 64 years of age (1,862) are in the labor force, with 10.6% or 131 of them being unemployed. The group with the highest labor force participation rate are those with the educational attainment of college / associate degree, with 87.7% or 335 individuals in the labor force. Within the labor force, individuals with high school diploma education have the highest percentage of unemployment, with 24.0% or 85 of them being unemployed.
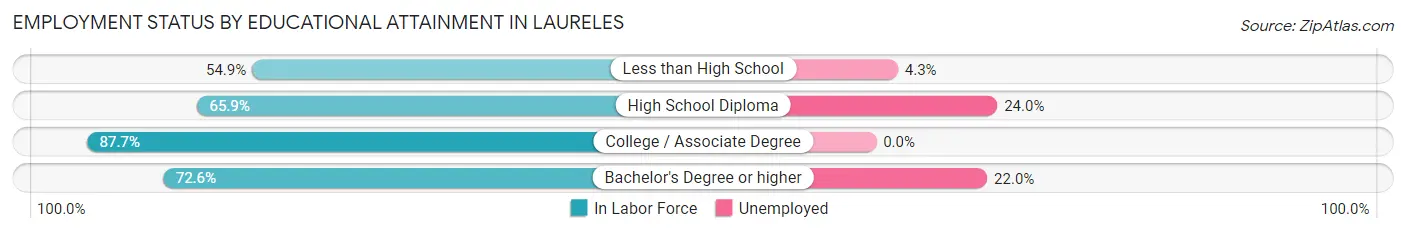
| Educational Attainment | In Labor Force | Unemployed |
| Less than High School | 422 (54.9%) | 33 (4.3%) |
| High School Diploma | 354 (65.9%) | 129 (24.0%) |
| College / Associate Degree | 335 (87.7%) | 0 (0.0%) |
| Bachelor's Degree or higher | 127 (72.6%) | 38 (22.0%) |
| Total | 1,238 (66.5%) | 197 (10.6%) |
Employment Occupations by Sex in Laureles
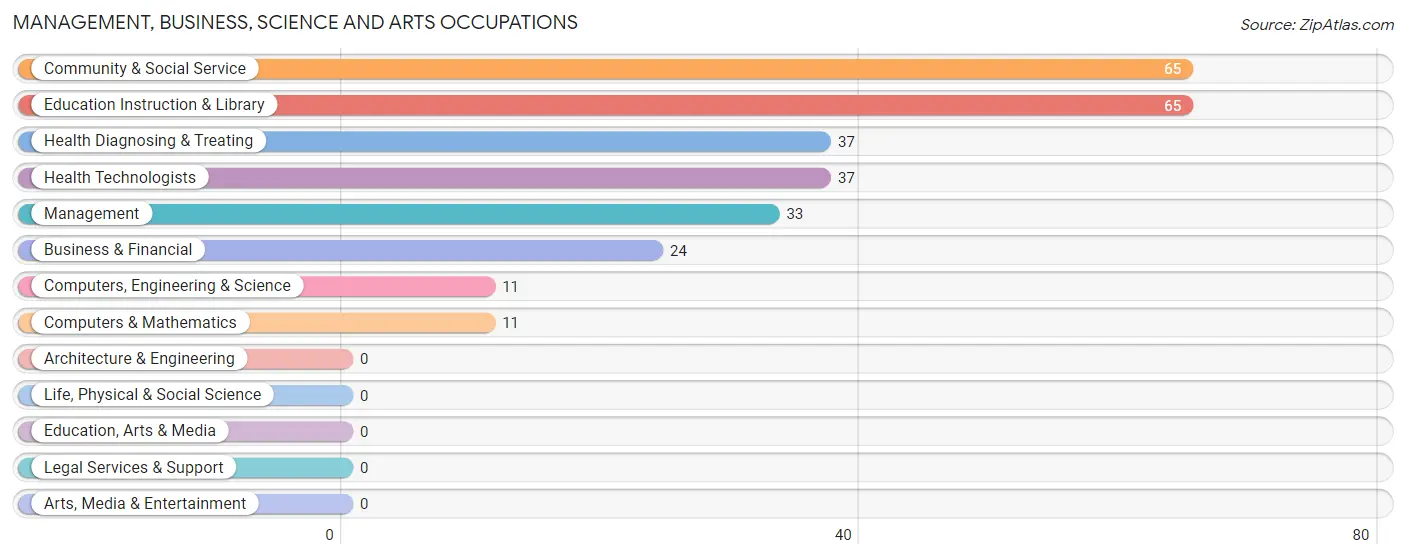
Management, Business, Science and Arts Occupations
The most common Management, Business, Science and Arts occupations in Laureles are Community & Social Service (65 | 4.9%), Education Instruction & Library (65 | 4.9%), Health Diagnosing & Treating (37 | 2.8%), Health Technologists (37 | 2.8%), and Management (33 | 2.5%).
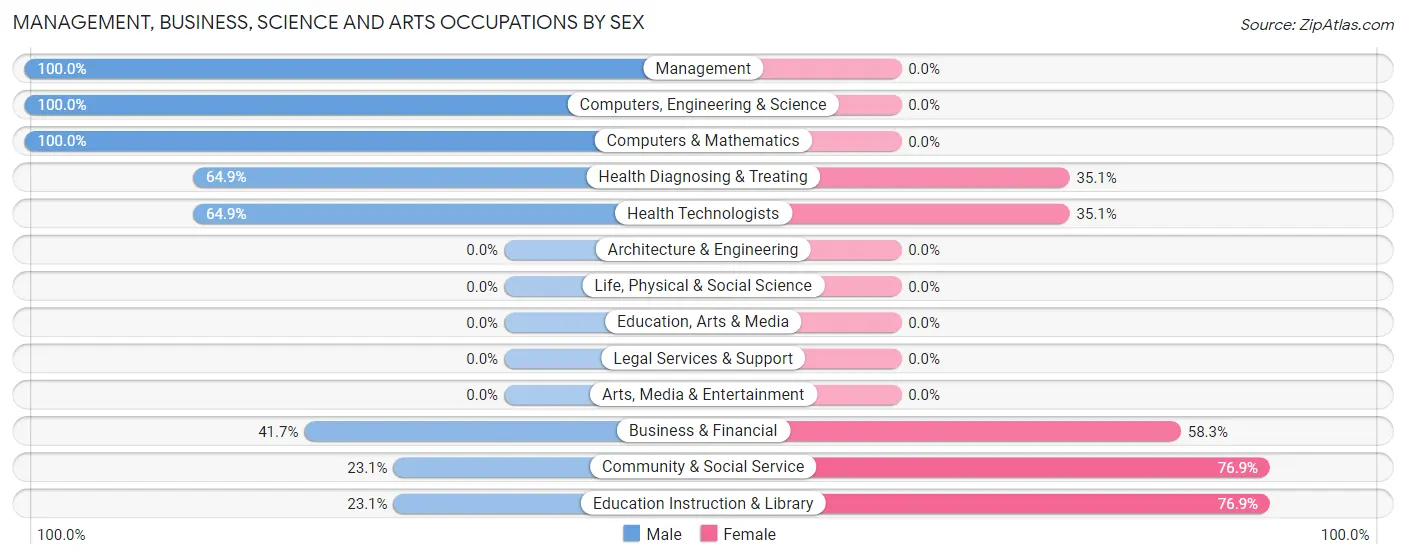
Management, Business, Science and Arts Occupations by Sex
Within the Management, Business, Science and Arts occupations in Laureles, the most male-oriented occupations are Management (100.0%), Computers, Engineering & Science (100.0%), and Computers & Mathematics (100.0%), while the most female-oriented occupations are Community & Social Service (76.9%), Education Instruction & Library (76.9%), and Business & Financial (58.3%).
| Occupation | Male | Female |
| Management | 33 (100.0%) | 0 (0.0%) |
| Business & Financial | 10 (41.7%) | 14 (58.3%) |
| Computers, Engineering & Science | 11 (100.0%) | 0 (0.0%) |
| Computers & Mathematics | 11 (100.0%) | 0 (0.0%) |
| Architecture & Engineering | 0 (0.0%) | 0 (0.0%) |
| Life, Physical & Social Science | 0 (0.0%) | 0 (0.0%) |
| Community & Social Service | 15 (23.1%) | 50 (76.9%) |
| Education, Arts & Media | 0 (0.0%) | 0 (0.0%) |
| Legal Services & Support | 0 (0.0%) | 0 (0.0%) |
| Education Instruction & Library | 15 (23.1%) | 50 (76.9%) |
| Arts, Media & Entertainment | 0 (0.0%) | 0 (0.0%) |
| Health Diagnosing & Treating | 24 (64.9%) | 13 (35.1%) |
| Health Technologists | 24 (64.9%) | 13 (35.1%) |
| Total (Category) | 93 (54.7%) | 77 (45.3%) |
| Total (Overall) | 795 (60.0%) | 531 (40.1%) |
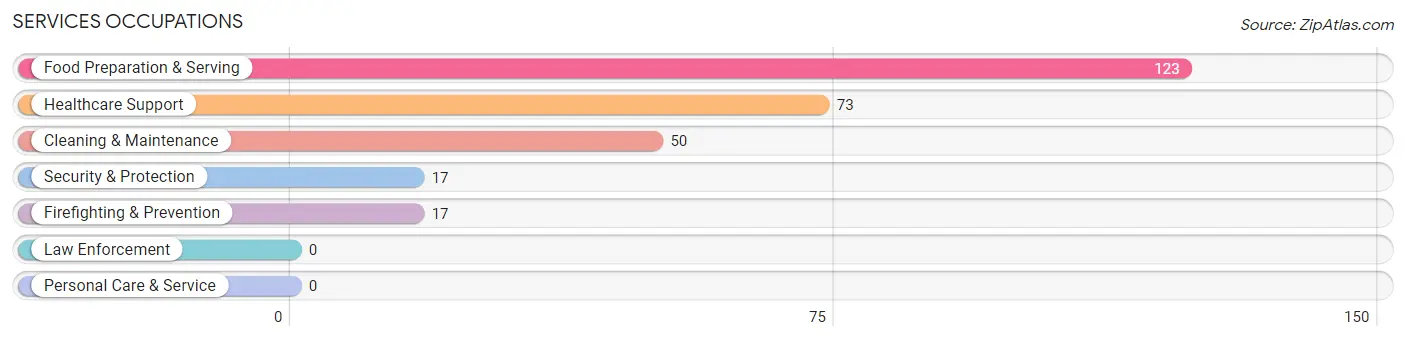
Services Occupations
The most common Services occupations in Laureles are Food Preparation & Serving (123 | 9.3%), Healthcare Support (73 | 5.5%), Cleaning & Maintenance (50 | 3.8%), Security & Protection (17 | 1.3%), and Firefighting & Prevention (17 | 1.3%).
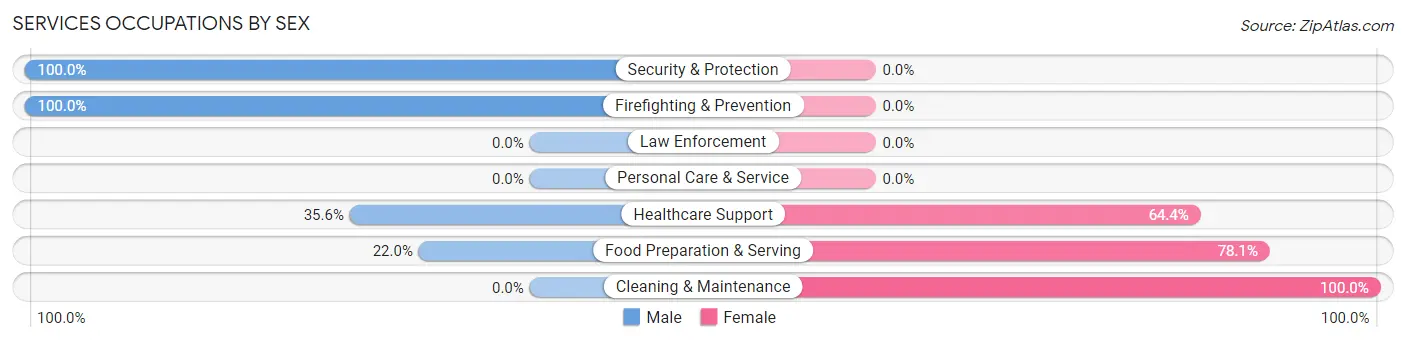
Services Occupations by Sex
Within the Services occupations in Laureles, the most male-oriented occupations are Security & Protection (100.0%), Firefighting & Prevention (100.0%), and Healthcare Support (35.6%), while the most female-oriented occupations are Cleaning & Maintenance (100.0%), Food Preparation & Serving (78.0%), and Healthcare Support (64.4%).
| Occupation | Male | Female |
| Healthcare Support | 26 (35.6%) | 47 (64.4%) |
| Security & Protection | 17 (100.0%) | 0 (0.0%) |
| Firefighting & Prevention | 17 (100.0%) | 0 (0.0%) |
| Law Enforcement | 0 (0.0%) | 0 (0.0%) |
| Food Preparation & Serving | 27 (22.0%) | 96 (78.0%) |
| Cleaning & Maintenance | 0 (0.0%) | 50 (100.0%) |
| Personal Care & Service | 0 (0.0%) | 0 (0.0%) |
| Total (Category) | 70 (26.6%) | 193 (73.4%) |
| Total (Overall) | 795 (60.0%) | 531 (40.1%) |
Sales and Office Occupations
The most common Sales and Office occupations in Laureles are Office & Administration (134 | 10.1%), and Sales & Related (100 | 7.5%).
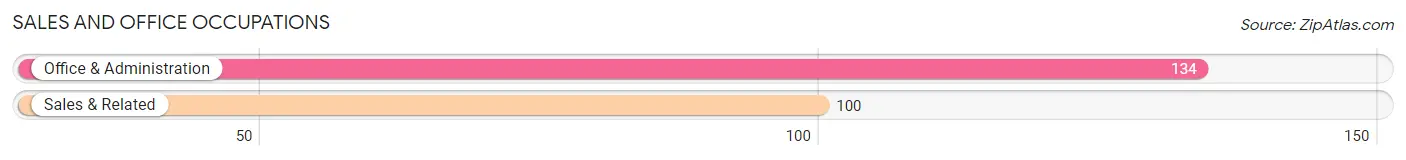
Sales and Office Occupations by Sex
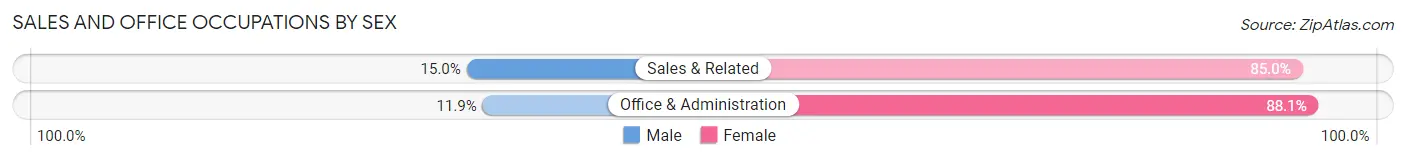
| Occupation | Male | Female |
| Sales & Related | 15 (15.0%) | 85 (85.0%) |
| Office & Administration | 16 (11.9%) | 118 (88.1%) |
| Total (Category) | 31 (13.3%) | 203 (86.8%) |
| Total (Overall) | 795 (60.0%) | 531 (40.1%) |
Natural Resources, Construction and Maintenance Occupations
The most common Natural Resources, Construction and Maintenance occupations in Laureles are Construction & Extraction (300 | 22.6%), and Installation, Maintenance & Repair (41 | 3.1%).
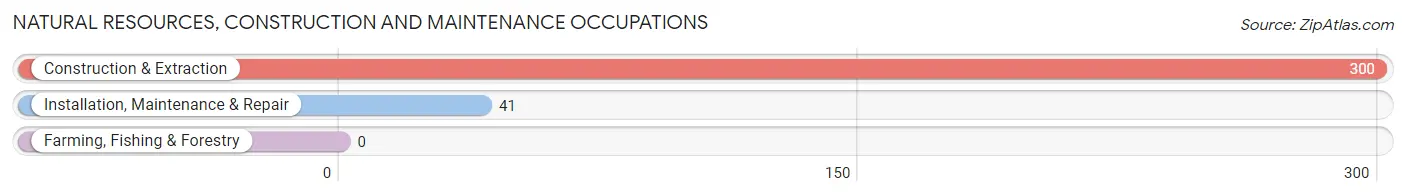
Natural Resources, Construction and Maintenance Occupations by Sex
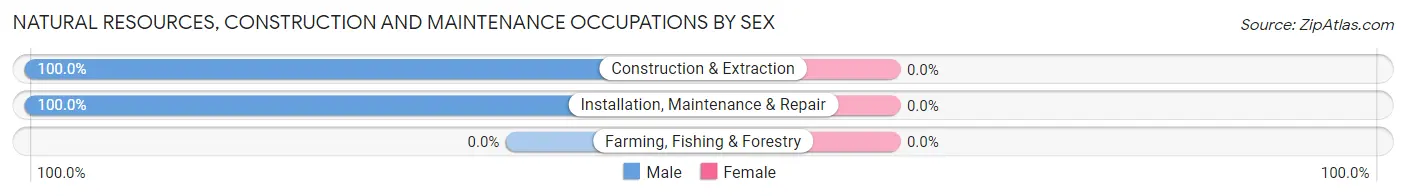
| Occupation | Male | Female |
| Farming, Fishing & Forestry | 0 (0.0%) | 0 (0.0%) |
| Construction & Extraction | 300 (100.0%) | 0 (0.0%) |
| Installation, Maintenance & Repair | 41 (100.0%) | 0 (0.0%) |
| Total (Category) | 341 (100.0%) | 0 (0.0%) |
| Total (Overall) | 795 (60.0%) | 531 (40.1%) |
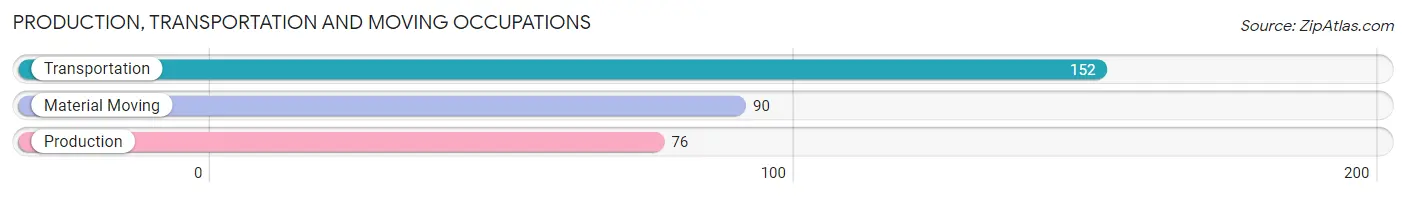
Production, Transportation and Moving Occupations
The most common Production, Transportation and Moving occupations in Laureles are Transportation (152 | 11.5%), Material Moving (90 | 6.8%), and Production (76 | 5.7%).
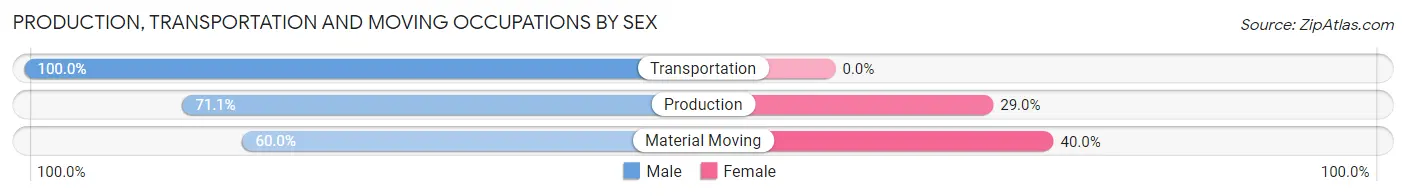
Production, Transportation and Moving Occupations by Sex
| Occupation | Male | Female |
| Production | 54 (71.1%) | 22 (28.9%) |
| Transportation | 152 (100.0%) | 0 (0.0%) |
| Material Moving | 54 (60.0%) | 36 (40.0%) |
| Total (Category) | 260 (81.8%) | 58 (18.2%) |
| Total (Overall) | 795 (60.0%) | 531 (40.1%) |
Employment Industries by Sex in Laureles
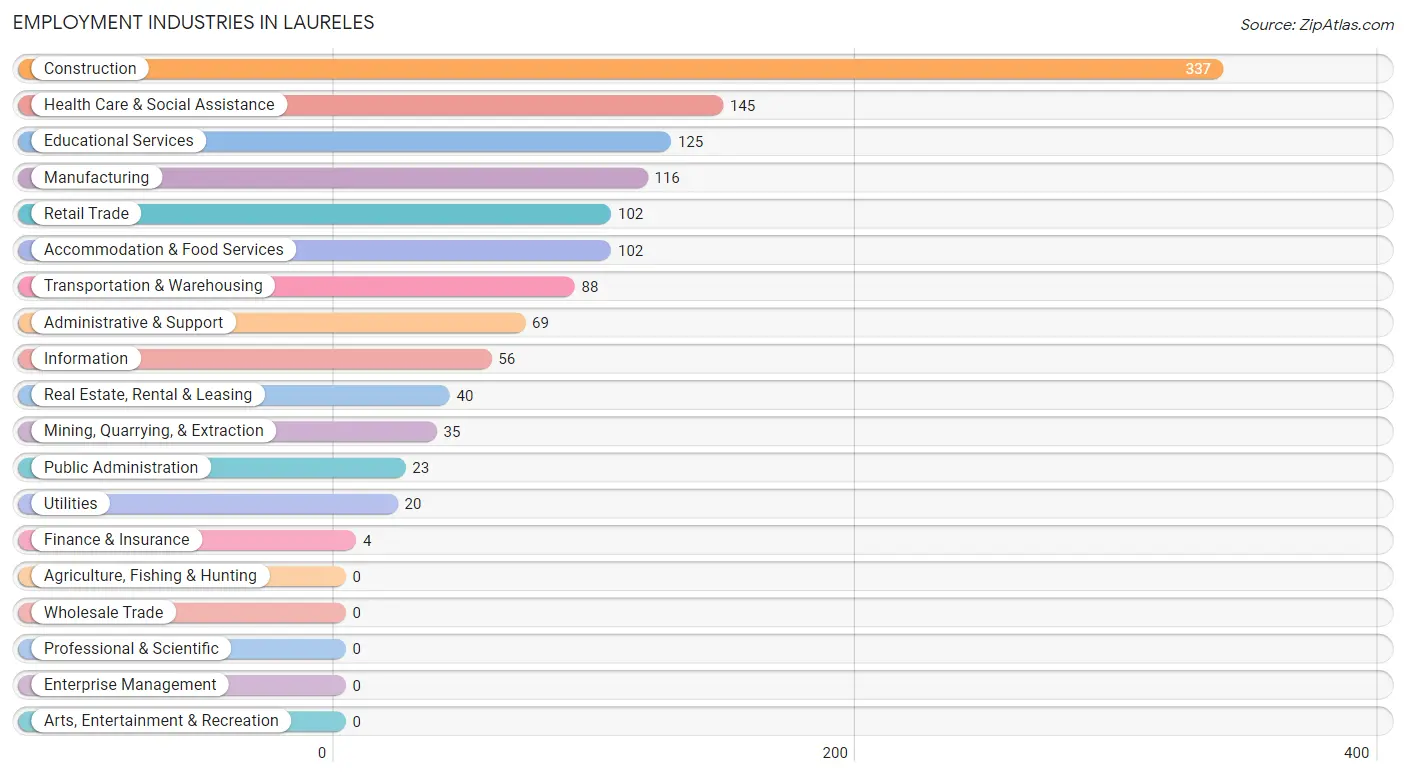
Employment Industries in Laureles
The major employment industries in Laureles include Construction (337 | 25.4%), Health Care & Social Assistance (145 | 10.9%), Educational Services (125 | 9.4%), Manufacturing (116 | 8.7%), and Retail Trade (102 | 7.7%).
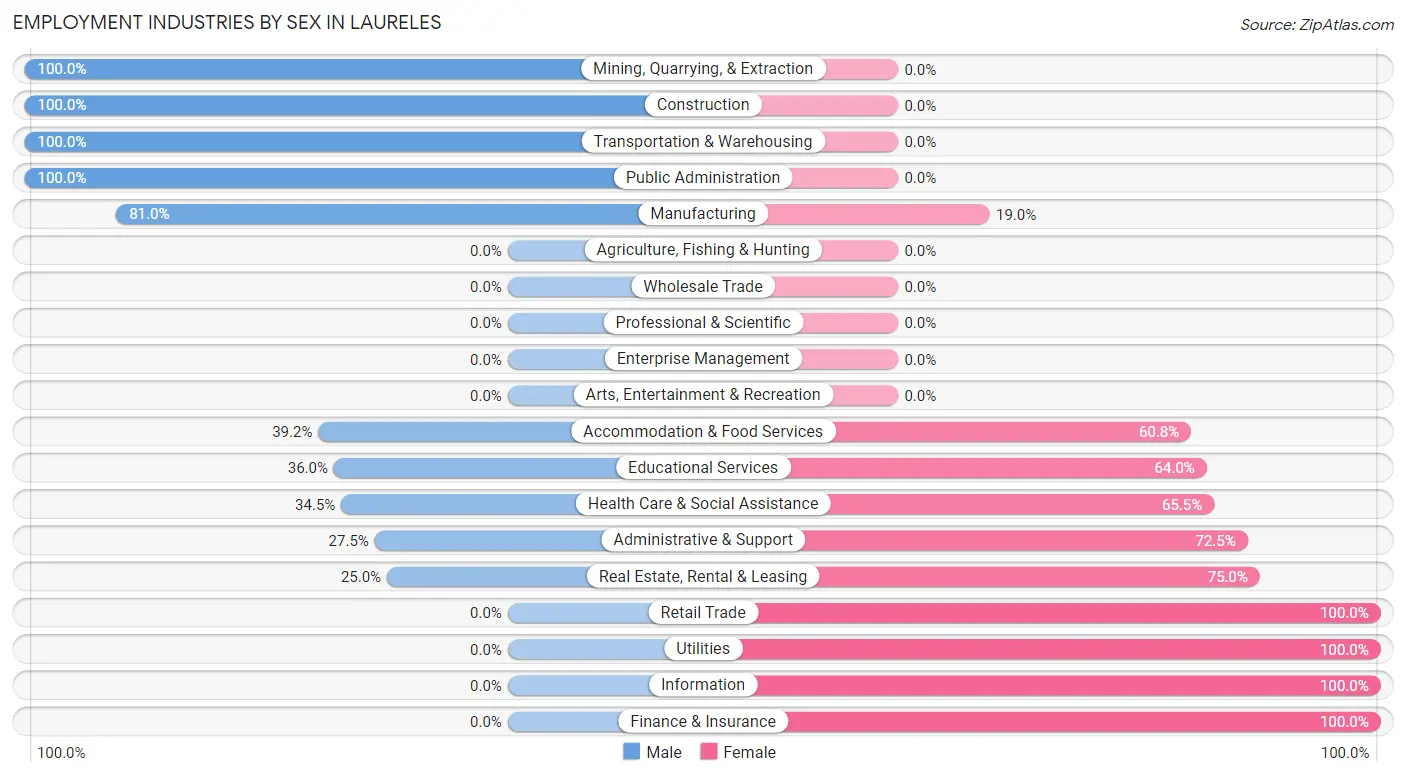
Employment Industries by Sex in Laureles
The Laureles industries that see more men than women are Mining, Quarrying, & Extraction (100.0%), Construction (100.0%), and Transportation & Warehousing (100.0%), whereas the industries that tend to have a higher number of women are Retail Trade (100.0%), Utilities (100.0%), and Information (100.0%).
| Industry | Male | Female |
| Agriculture, Fishing & Hunting | 0 (0.0%) | 0 (0.0%) |
| Mining, Quarrying, & Extraction | 35 (100.0%) | 0 (0.0%) |
| Construction | 337 (100.0%) | 0 (0.0%) |
| Manufacturing | 94 (81.0%) | 22 (19.0%) |
| Wholesale Trade | 0 (0.0%) | 0 (0.0%) |
| Retail Trade | 0 (0.0%) | 102 (100.0%) |
| Transportation & Warehousing | 88 (100.0%) | 0 (0.0%) |
| Utilities | 0 (0.0%) | 20 (100.0%) |
| Information | 0 (0.0%) | 56 (100.0%) |
| Finance & Insurance | 0 (0.0%) | 4 (100.0%) |
| Real Estate, Rental & Leasing | 10 (25.0%) | 30 (75.0%) |
| Professional & Scientific | 0 (0.0%) | 0 (0.0%) |
| Enterprise Management | 0 (0.0%) | 0 (0.0%) |
| Administrative & Support | 19 (27.5%) | 50 (72.5%) |
| Educational Services | 45 (36.0%) | 80 (64.0%) |
| Health Care & Social Assistance | 50 (34.5%) | 95 (65.5%) |
| Arts, Entertainment & Recreation | 0 (0.0%) | 0 (0.0%) |
| Accommodation & Food Services | 40 (39.2%) | 62 (60.8%) |
| Public Administration | 23 (100.0%) | 0 (0.0%) |
| Total | 795 (60.0%) | 531 (40.1%) |
Education in Laureles
School Enrollment in Laureles
The most common levels of schooling among the 1,247 students in Laureles are high school (363 | 29.1%), elementary school (297 | 23.8%), and middle school (280 | 22.5%).
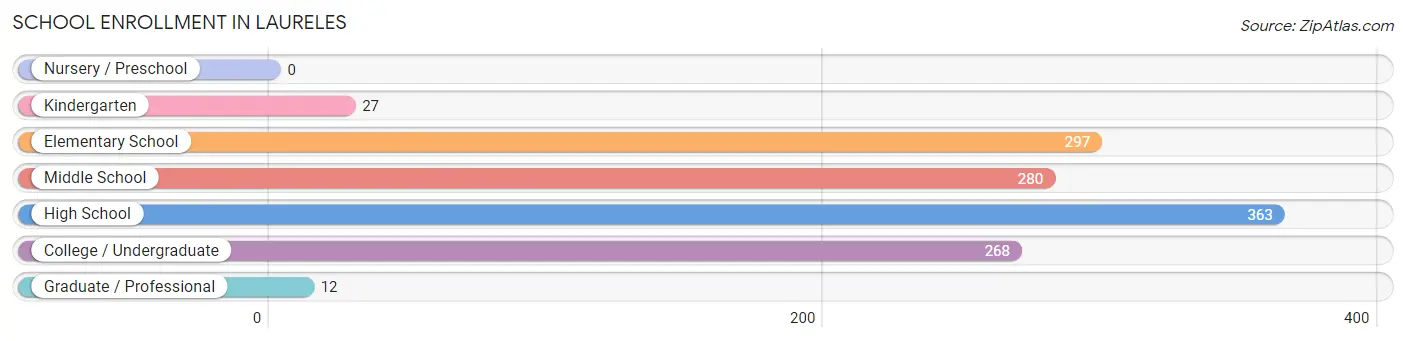
| School Level | # Students | % Students |
| Nursery / Preschool | 0 | 0.0% |
| Kindergarten | 27 | 2.2% |
| Elementary School | 297 | 23.8% |
| Middle School | 280 | 22.5% |
| High School | 363 | 29.1% |
| College / Undergraduate | 268 | 21.5% |
| Graduate / Professional | 12 | 1.0% |
| Total | 1,247 | 100.0% |
School Enrollment by Age by Funding Source in Laureles
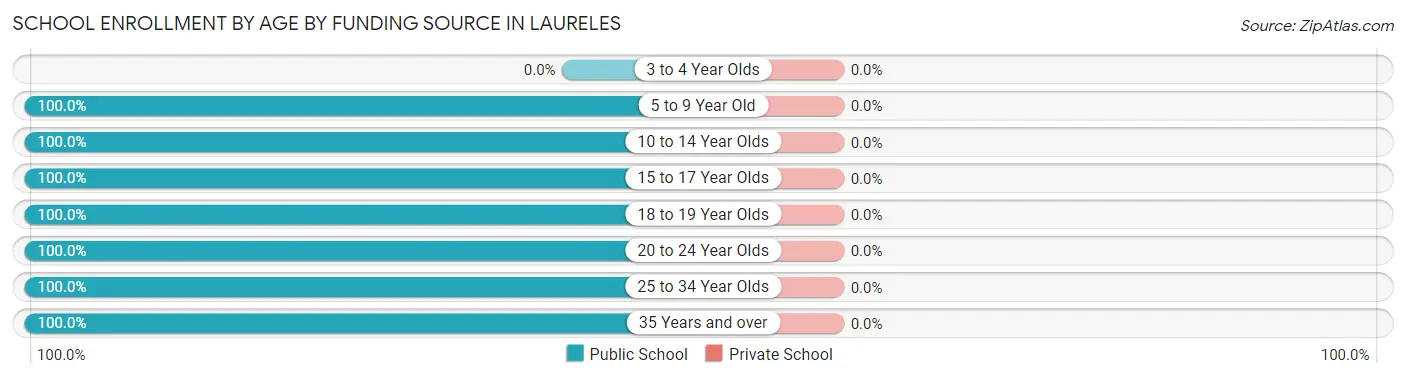
| Age Bracket | Public School | Private School |
| 3 to 4 Year Olds | 0 (0.0%) | 0 (0.0%) |
| 5 to 9 Year Old | 293 (100.0%) | 0 (0.0%) |
| 10 to 14 Year Olds | 311 (100.0%) | 0 (0.0%) |
| 15 to 17 Year Olds | 252 (100.0%) | 0 (0.0%) |
| 18 to 19 Year Olds | 122 (100.0%) | 0 (0.0%) |
| 20 to 24 Year Olds | 195 (100.0%) | 0 (0.0%) |
| 25 to 34 Year Olds | 55 (100.0%) | 0 (0.0%) |
| 35 Years and over | 19 (100.0%) | 0 (0.0%) |
| Total | 1,247 (100.0%) | 0 (0.0%) |
Educational Attainment by Field of Study in Laureles
Arts & humanities (85 | 43.8%), bio, nature & agricultural (24 | 12.4%), social sciences (24 | 12.4%), liberal arts & history (15 | 7.7%), and science & technology (13 | 6.7%) are the most common fields of study among 194 individuals in Laureles who have obtained a bachelor's degree or higher.
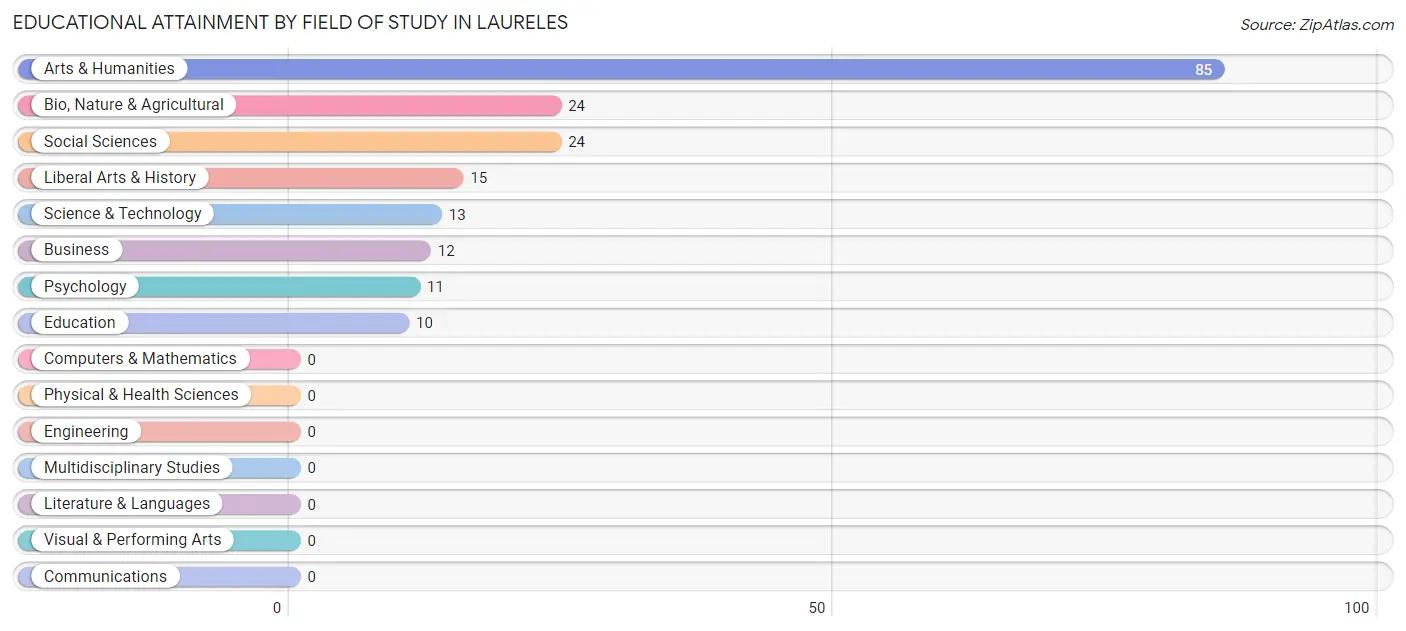
| Field of Study | # Graduates | % Graduates |
| Computers & Mathematics | 0 | 0.0% |
| Bio, Nature & Agricultural | 24 | 12.4% |
| Physical & Health Sciences | 0 | 0.0% |
| Psychology | 11 | 5.7% |
| Social Sciences | 24 | 12.4% |
| Engineering | 0 | 0.0% |
| Multidisciplinary Studies | 0 | 0.0% |
| Science & Technology | 13 | 6.7% |
| Business | 12 | 6.2% |
| Education | 10 | 5.1% |
| Literature & Languages | 0 | 0.0% |
| Liberal Arts & History | 15 | 7.7% |
| Visual & Performing Arts | 0 | 0.0% |
| Communications | 0 | 0.0% |
| Arts & Humanities | 85 | 43.8% |
| Total | 194 | 100.0% |
Transportation & Commute in Laureles
Vehicle Availability by Sex in Laureles
The most prevalent vehicle ownership categories in Laureles are males with 4 vehicles (250, accounting for 31.5%) and females with 4 vehicles (98, making up 47.1%).
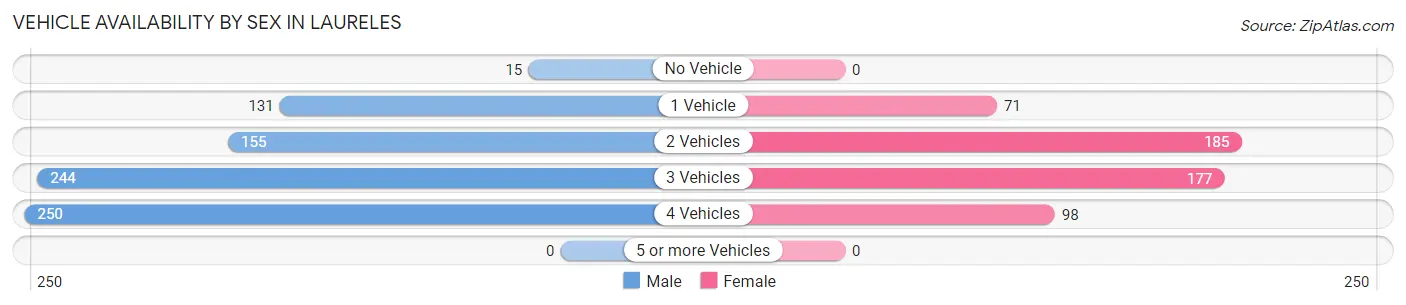
| Vehicles Available | Male | Female |
| No Vehicle | 15 (1.9%) | 0 (0.0%) |
| 1 Vehicle | 131 (16.5%) | 71 (13.4%) |
| 2 Vehicles | 155 (19.5%) | 185 (34.8%) |
| 3 Vehicles | 244 (30.7%) | 177 (33.3%) |
| 4 Vehicles | 250 (31.5%) | 98 (18.5%) |
| 5 or more Vehicles | 0 (0.0%) | 0 (0.0%) |
| Total | 795 (100.0%) | 531 (100.0%) |
Commute Time in Laureles
The most frequently occuring commute durations in Laureles are 30 to 34 minutes (397 commuters, 32.6%), 20 to 24 minutes (194 commuters, 15.9%), and 10 to 14 minutes (169 commuters, 13.9%).
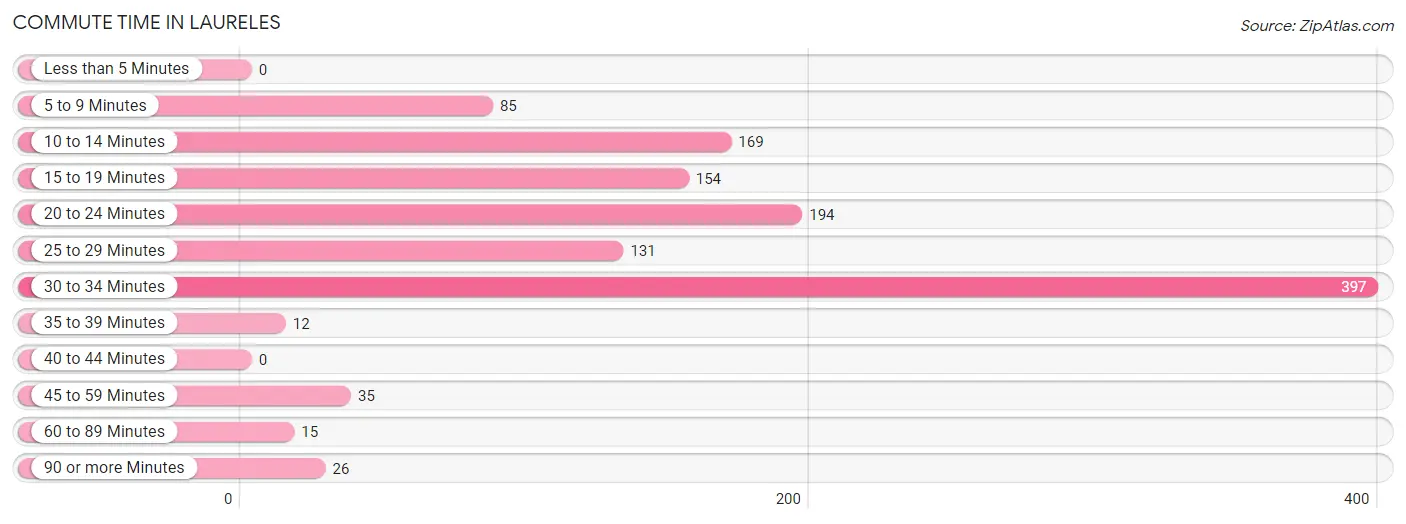
| Commute Time | # Commuters | % Commuters |
| Less than 5 Minutes | 0 | 0.0% |
| 5 to 9 Minutes | 85 | 7.0% |
| 10 to 14 Minutes | 169 | 13.9% |
| 15 to 19 Minutes | 154 | 12.6% |
| 20 to 24 Minutes | 194 | 15.9% |
| 25 to 29 Minutes | 131 | 10.8% |
| 30 to 34 Minutes | 397 | 32.6% |
| 35 to 39 Minutes | 12 | 1.0% |
| 40 to 44 Minutes | 0 | 0.0% |
| 45 to 59 Minutes | 35 | 2.9% |
| 60 to 89 Minutes | 15 | 1.2% |
| 90 or more Minutes | 26 | 2.1% |
Commute Time by Sex in Laureles
The most common commute times in Laureles are 30 to 34 minutes (204 commuters, 28.1%) for males and 30 to 34 minutes (193 commuters, 39.2%) for females.
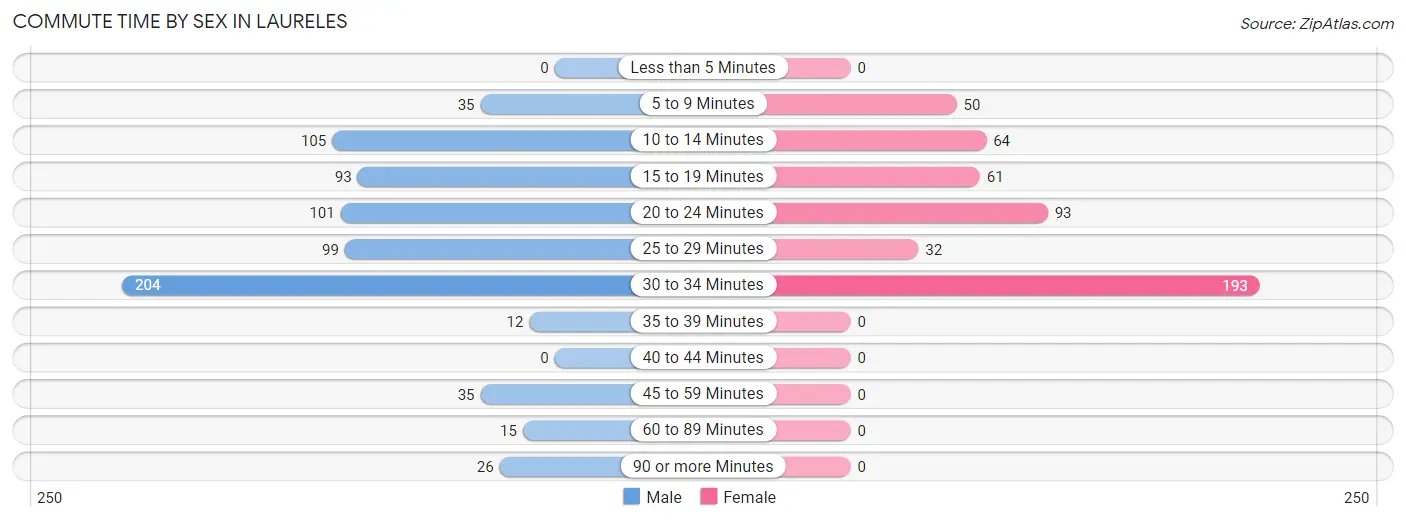
| Commute Time | Male | Female |
| Less than 5 Minutes | 0 (0.0%) | 0 (0.0%) |
| 5 to 9 Minutes | 35 (4.8%) | 50 (10.1%) |
| 10 to 14 Minutes | 105 (14.5%) | 64 (13.0%) |
| 15 to 19 Minutes | 93 (12.8%) | 61 (12.4%) |
| 20 to 24 Minutes | 101 (13.9%) | 93 (18.9%) |
| 25 to 29 Minutes | 99 (13.7%) | 32 (6.5%) |
| 30 to 34 Minutes | 204 (28.1%) | 193 (39.2%) |
| 35 to 39 Minutes | 12 (1.7%) | 0 (0.0%) |
| 40 to 44 Minutes | 0 (0.0%) | 0 (0.0%) |
| 45 to 59 Minutes | 35 (4.8%) | 0 (0.0%) |
| 60 to 89 Minutes | 15 (2.1%) | 0 (0.0%) |
| 90 or more Minutes | 26 (3.6%) | 0 (0.0%) |
Time of Departure to Work by Sex in Laureles
The most frequent times of departure to work in Laureles are 9:00 AM to 9:59 AM (132, 18.2%) for males and 9:00 AM to 9:59 AM (111, 22.5%) for females.
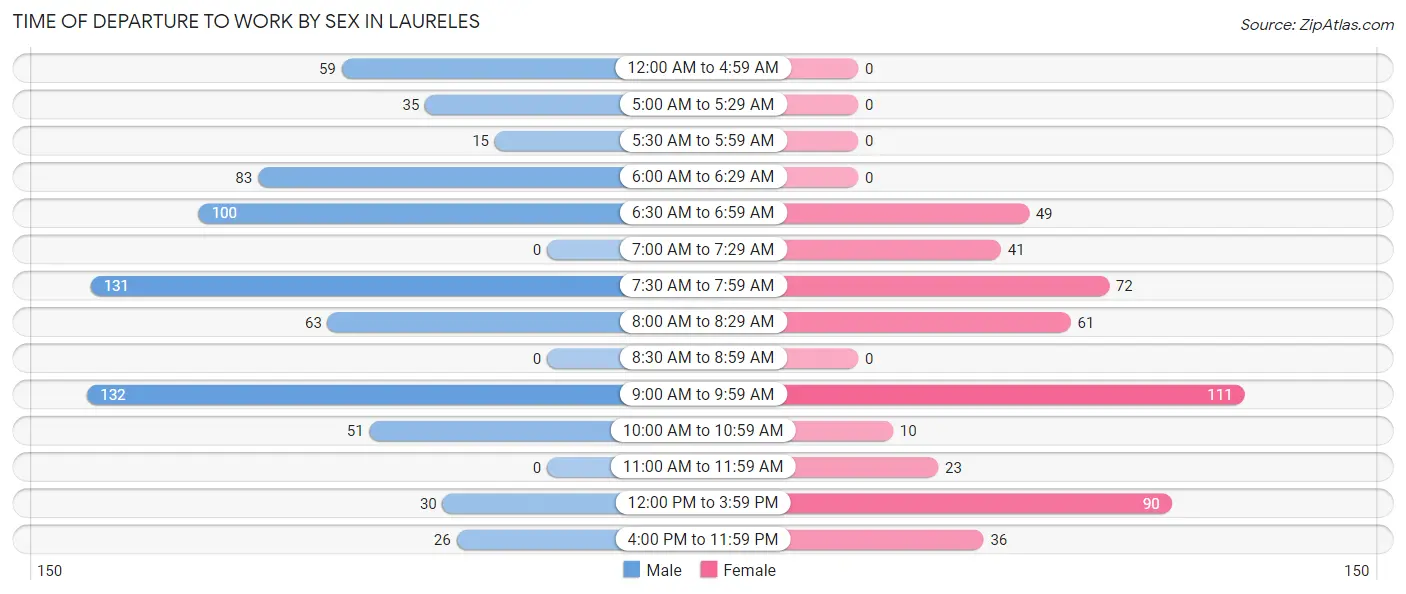
| Time of Departure | Male | Female |
| 12:00 AM to 4:59 AM | 59 (8.1%) | 0 (0.0%) |
| 5:00 AM to 5:29 AM | 35 (4.8%) | 0 (0.0%) |
| 5:30 AM to 5:59 AM | 15 (2.1%) | 0 (0.0%) |
| 6:00 AM to 6:29 AM | 83 (11.5%) | 0 (0.0%) |
| 6:30 AM to 6:59 AM | 100 (13.8%) | 49 (9.9%) |
| 7:00 AM to 7:29 AM | 0 (0.0%) | 41 (8.3%) |
| 7:30 AM to 7:59 AM | 131 (18.1%) | 72 (14.6%) |
| 8:00 AM to 8:29 AM | 63 (8.7%) | 61 (12.4%) |
| 8:30 AM to 8:59 AM | 0 (0.0%) | 0 (0.0%) |
| 9:00 AM to 9:59 AM | 132 (18.2%) | 111 (22.5%) |
| 10:00 AM to 10:59 AM | 51 (7.0%) | 10 (2.0%) |
| 11:00 AM to 11:59 AM | 0 (0.0%) | 23 (4.7%) |
| 12:00 PM to 3:59 PM | 30 (4.1%) | 90 (18.3%) |
| 4:00 PM to 11:59 PM | 26 (3.6%) | 36 (7.3%) |
| Total | 725 (100.0%) | 493 (100.0%) |
Housing Occupancy in Laureles
Occupancy by Ownership in Laureles
Of the total 990 dwellings in Laureles, owner-occupied units account for 934 (94.3%), while renter-occupied units make up 56 (5.7%).
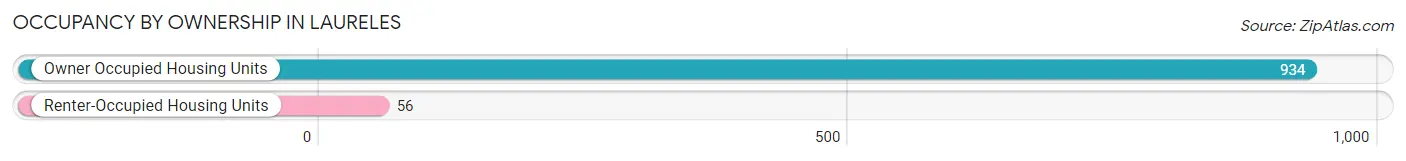
| Occupancy | # Housing Units | % Housing Units |
| Owner Occupied Housing Units | 934 | 94.3% |
| Renter-Occupied Housing Units | 56 | 5.7% |
| Total Occupied Housing Units | 990 | 100.0% |
Occupancy by Household Size in Laureles
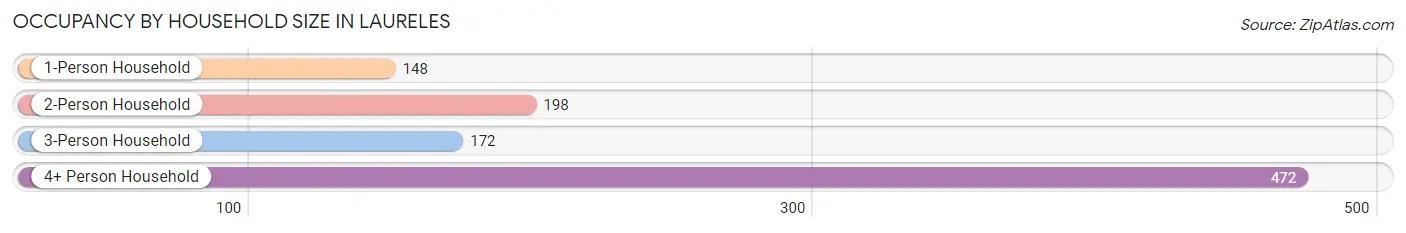
| Household Size | # Housing Units | % Housing Units |
| 1-Person Household | 148 | 14.9% |
| 2-Person Household | 198 | 20.0% |
| 3-Person Household | 172 | 17.4% |
| 4+ Person Household | 472 | 47.7% |
| Total Housing Units | 990 | 100.0% |
Occupancy by Ownership by Household Size in Laureles
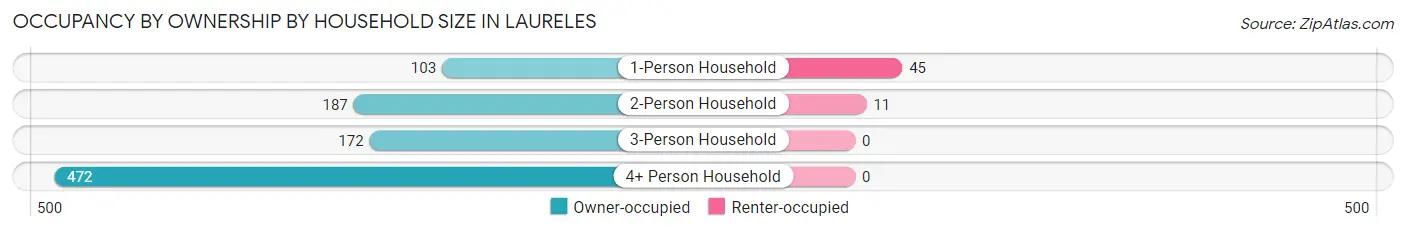
| Household Size | Owner-occupied | Renter-occupied |
| 1-Person Household | 103 (69.6%) | 45 (30.4%) |
| 2-Person Household | 187 (94.4%) | 11 (5.6%) |
| 3-Person Household | 172 (100.0%) | 0 (0.0%) |
| 4+ Person Household | 472 (100.0%) | 0 (0.0%) |
| Total Housing Units | 934 (94.3%) | 56 (5.7%) |
Occupancy by Educational Attainment in Laureles
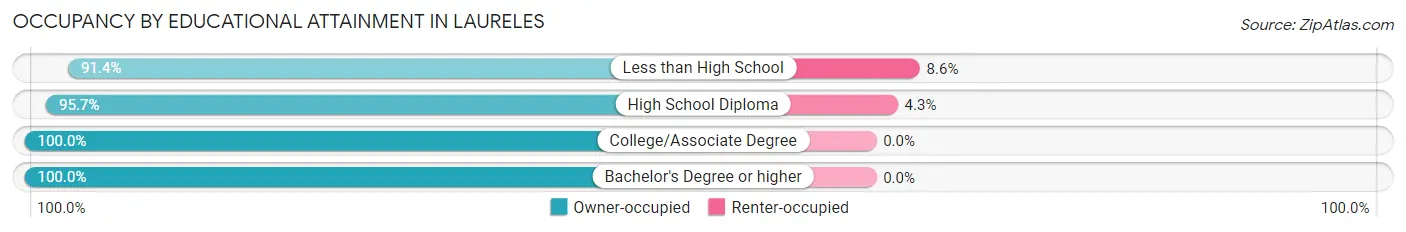
| Household Size | Owner-occupied | Renter-occupied |
| Less than High School | 477 (91.4%) | 45 (8.6%) |
| High School Diploma | 247 (95.7%) | 11 (4.3%) |
| College/Associate Degree | 155 (100.0%) | 0 (0.0%) |
| Bachelor's Degree or higher | 55 (100.0%) | 0 (0.0%) |
Occupancy by Age of Householder in Laureles
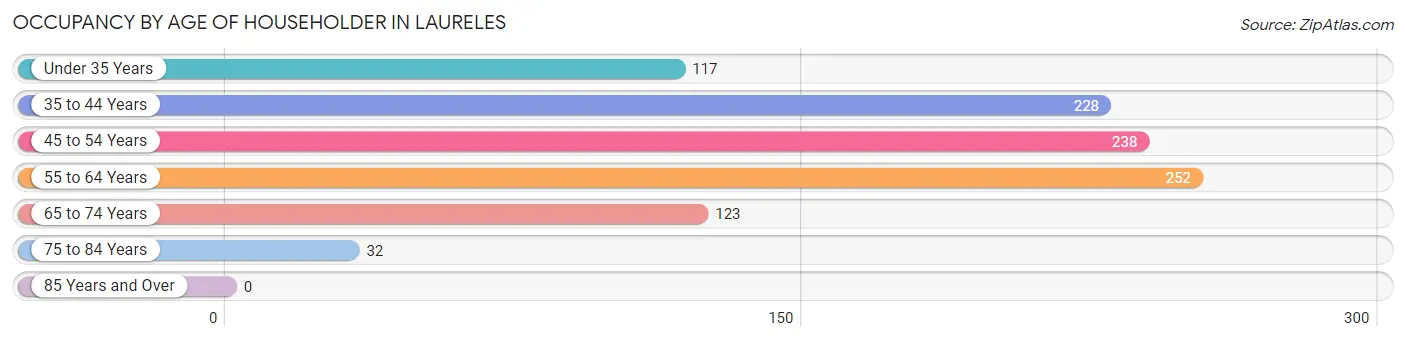
| Age Bracket | # Households | % Households |
| Under 35 Years | 117 | 11.8% |
| 35 to 44 Years | 228 | 23.0% |
| 45 to 54 Years | 238 | 24.0% |
| 55 to 64 Years | 252 | 25.5% |
| 65 to 74 Years | 123 | 12.4% |
| 75 to 84 Years | 32 | 3.2% |
| 85 Years and Over | 0 | 0.0% |
| Total | 990 | 100.0% |
Housing Finances in Laureles
Median Income by Occupancy in Laureles
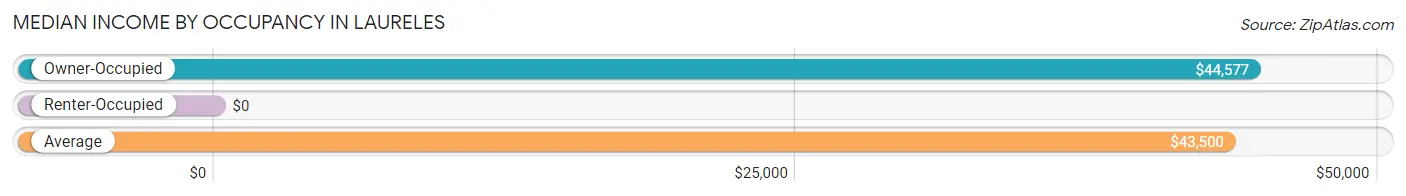
| Occupancy Type | # Households | Median Income |
| Owner-Occupied | 934 (94.3%) | $44,577 |
| Renter-Occupied | 56 (5.7%) | $0 |
| Average | 990 (100.0%) | $43,500 |
Occupancy by Householder Income Bracket in Laureles
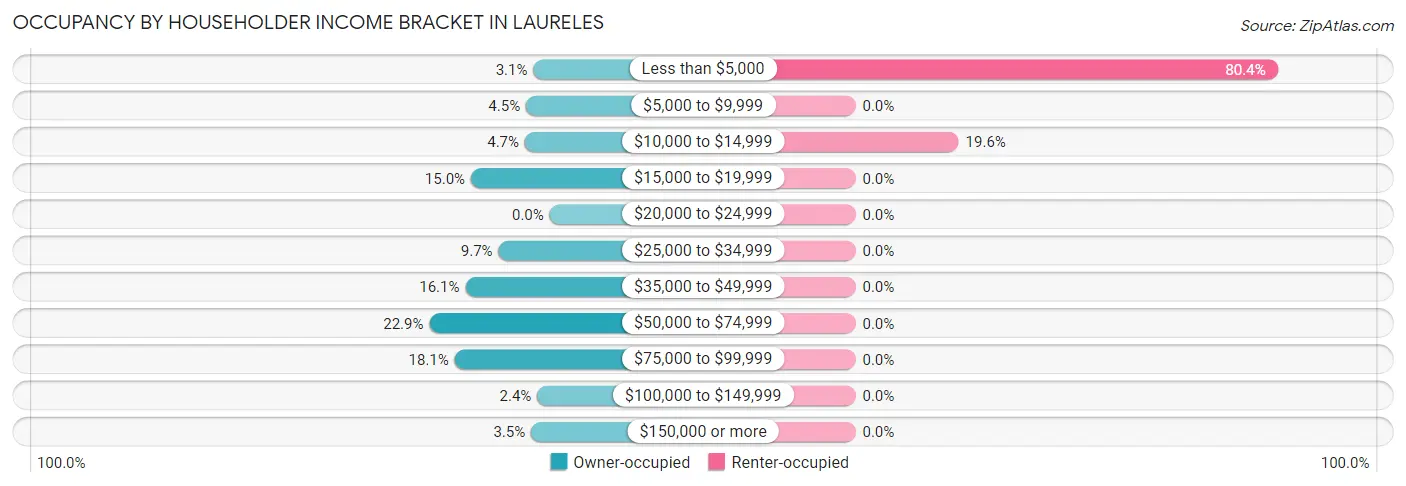
| Income Bracket | Owner-occupied | Renter-occupied |
| Less than $5,000 | 29 (3.1%) | 45 (80.4%) |
| $5,000 to $9,999 | 42 (4.5%) | 0 (0.0%) |
| $10,000 to $14,999 | 44 (4.7%) | 11 (19.6%) |
| $15,000 to $19,999 | 140 (15.0%) | 0 (0.0%) |
| $20,000 to $24,999 | 0 (0.0%) | 0 (0.0%) |
| $25,000 to $34,999 | 91 (9.7%) | 0 (0.0%) |
| $35,000 to $49,999 | 150 (16.1%) | 0 (0.0%) |
| $50,000 to $74,999 | 214 (22.9%) | 0 (0.0%) |
| $75,000 to $99,999 | 169 (18.1%) | 0 (0.0%) |
| $100,000 to $149,999 | 22 (2.4%) | 0 (0.0%) |
| $150,000 or more | 33 (3.5%) | 0 (0.0%) |
| Total | 934 (100.0%) | 56 (100.0%) |
Monthly Housing Cost Tiers in Laureles
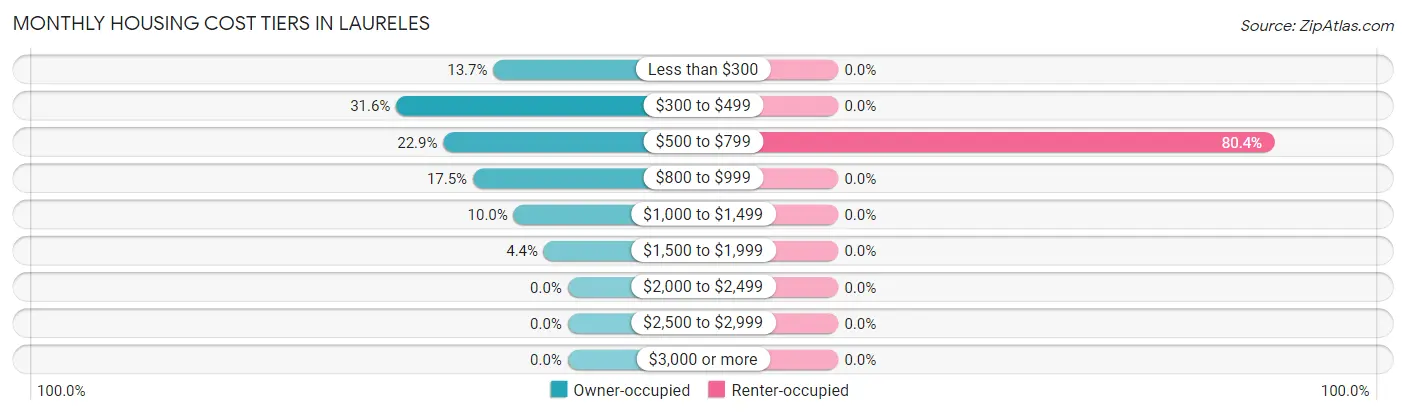
| Monthly Cost | Owner-occupied | Renter-occupied |
| Less than $300 | 128 (13.7%) | 0 (0.0%) |
| $300 to $499 | 295 (31.6%) | 0 (0.0%) |
| $500 to $799 | 214 (22.9%) | 45 (80.4%) |
| $800 to $999 | 163 (17.4%) | 0 (0.0%) |
| $1,000 to $1,499 | 93 (10.0%) | 0 (0.0%) |
| $1,500 to $1,999 | 41 (4.4%) | 0 (0.0%) |
| $2,000 to $2,499 | 0 (0.0%) | 0 (0.0%) |
| $2,500 to $2,999 | 0 (0.0%) | 0 (0.0%) |
| $3,000 or more | 0 (0.0%) | 0 (0.0%) |
| Total | 934 (100.0%) | 56 (100.0%) |
Physical Housing Characteristics in Laureles
Housing Structures in Laureles
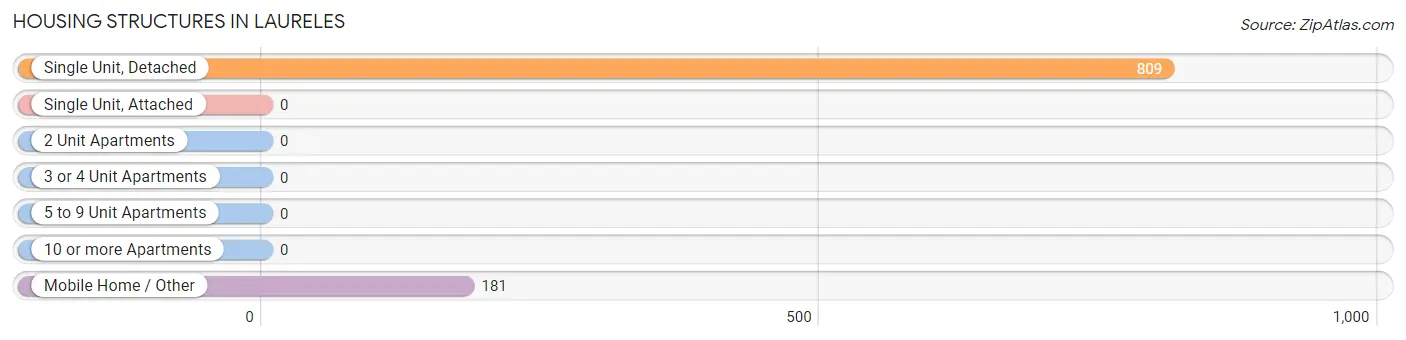
| Structure Type | # Housing Units | % Housing Units |
| Single Unit, Detached | 809 | 81.7% |
| Single Unit, Attached | 0 | 0.0% |
| 2 Unit Apartments | 0 | 0.0% |
| 3 or 4 Unit Apartments | 0 | 0.0% |
| 5 to 9 Unit Apartments | 0 | 0.0% |
| 10 or more Apartments | 0 | 0.0% |
| Mobile Home / Other | 181 | 18.3% |
| Total | 990 | 100.0% |
Housing Structures by Occupancy in Laureles
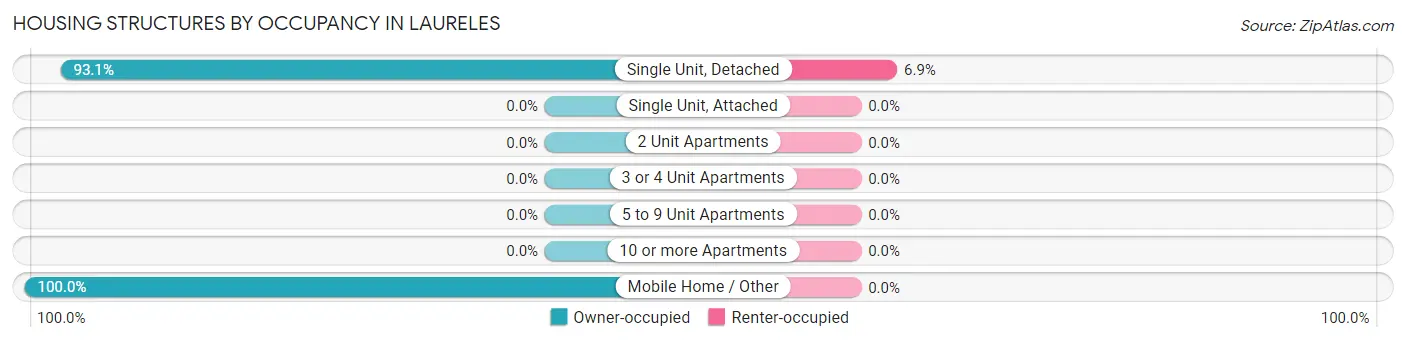
| Structure Type | Owner-occupied | Renter-occupied |
| Single Unit, Detached | 753 (93.1%) | 56 (6.9%) |
| Single Unit, Attached | 0 (0.0%) | 0 (0.0%) |
| 2 Unit Apartments | 0 (0.0%) | 0 (0.0%) |
| 3 or 4 Unit Apartments | 0 (0.0%) | 0 (0.0%) |
| 5 to 9 Unit Apartments | 0 (0.0%) | 0 (0.0%) |
| 10 or more Apartments | 0 (0.0%) | 0 (0.0%) |
| Mobile Home / Other | 181 (100.0%) | 0 (0.0%) |
| Total | 934 (94.3%) | 56 (5.7%) |
Housing Structures by Number of Rooms in Laureles
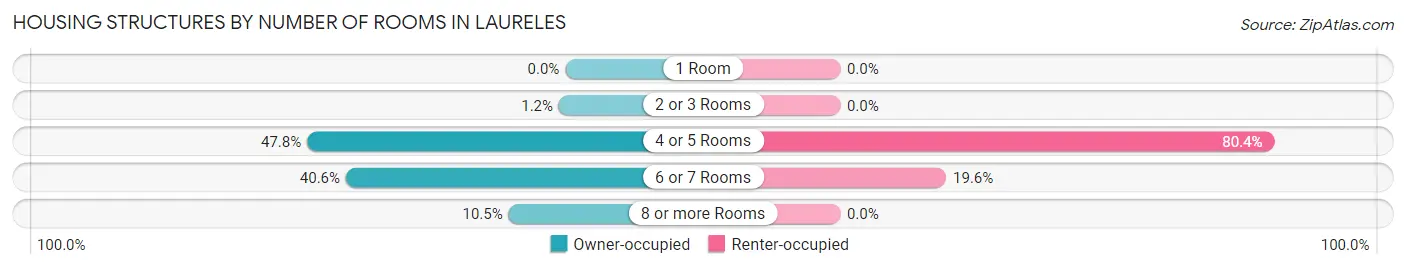
| Number of Rooms | Owner-occupied | Renter-occupied |
| 1 Room | 0 (0.0%) | 0 (0.0%) |
| 2 or 3 Rooms | 11 (1.2%) | 0 (0.0%) |
| 4 or 5 Rooms | 446 (47.7%) | 45 (80.4%) |
| 6 or 7 Rooms | 379 (40.6%) | 11 (19.6%) |
| 8 or more Rooms | 98 (10.5%) | 0 (0.0%) |
| Total | 934 (100.0%) | 56 (100.0%) |
Housing Structure by Heating Type in Laureles
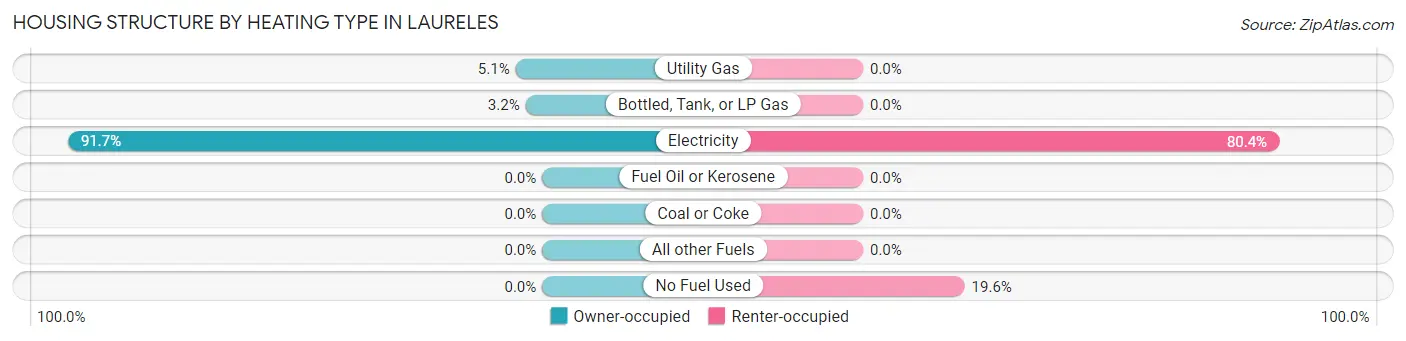
| Heating Type | Owner-occupied | Renter-occupied |
| Utility Gas | 48 (5.1%) | 0 (0.0%) |
| Bottled, Tank, or LP Gas | 30 (3.2%) | 0 (0.0%) |
| Electricity | 856 (91.6%) | 45 (80.4%) |
| Fuel Oil or Kerosene | 0 (0.0%) | 0 (0.0%) |
| Coal or Coke | 0 (0.0%) | 0 (0.0%) |
| All other Fuels | 0 (0.0%) | 0 (0.0%) |
| No Fuel Used | 0 (0.0%) | 11 (19.6%) |
| Total | 934 (100.0%) | 56 (100.0%) |
Household Vehicle Usage in Laureles
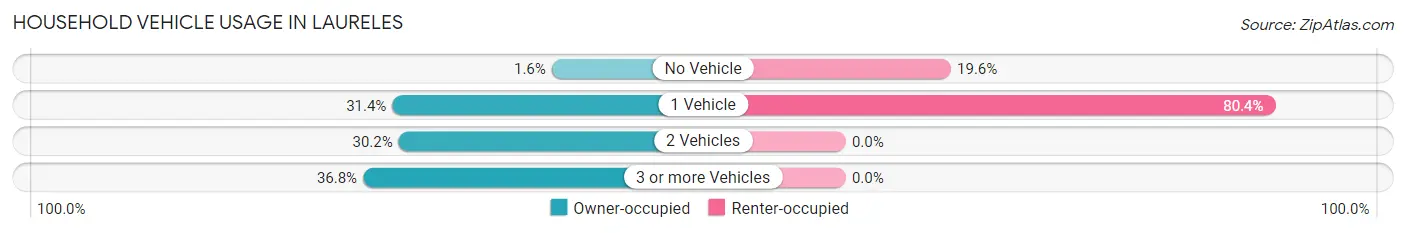
| Vehicles per Household | Owner-occupied | Renter-occupied |
| No Vehicle | 15 (1.6%) | 11 (19.6%) |
| 1 Vehicle | 293 (31.4%) | 45 (80.4%) |
| 2 Vehicles | 282 (30.2%) | 0 (0.0%) |
| 3 or more Vehicles | 344 (36.8%) | 0 (0.0%) |
| Total | 934 (100.0%) | 56 (100.0%) |
Real Estate & Mortgages in Laureles
Real Estate and Mortgage Overview in Laureles
| Characteristic | Without Mortgage | With Mortgage |
| Housing Units | 697 | 237 |
| Median Property Value | $88,300 | $0 |
| Median Household Income | $43,404 | $0 |
| Monthly Housing Costs | $450 | $0 |
| Real Estate Taxes | $1,093 | $19 |
Property Value by Mortgage Status in Laureles
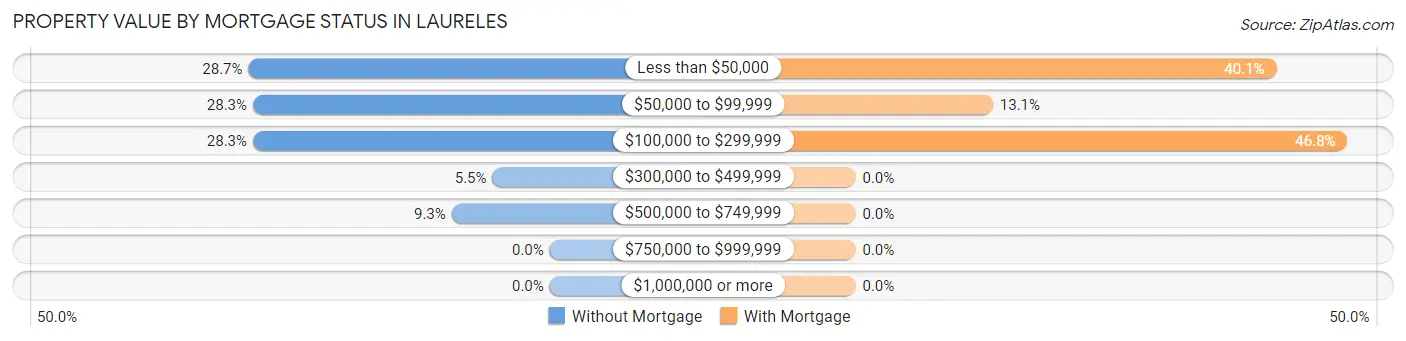
| Property Value | Without Mortgage | With Mortgage |
| Less than $50,000 | 200 (28.7%) | 95 (40.1%) |
| $50,000 to $99,999 | 197 (28.3%) | 31 (13.1%) |
| $100,000 to $299,999 | 197 (28.3%) | 111 (46.8%) |
| $300,000 to $499,999 | 38 (5.4%) | 0 (0.0%) |
| $500,000 to $749,999 | 65 (9.3%) | 0 (0.0%) |
| $750,000 to $999,999 | 0 (0.0%) | 0 (0.0%) |
| $1,000,000 or more | 0 (0.0%) | 0 (0.0%) |
| Total | 697 (100.0%) | 237 (100.0%) |
Household Income by Mortgage Status in Laureles
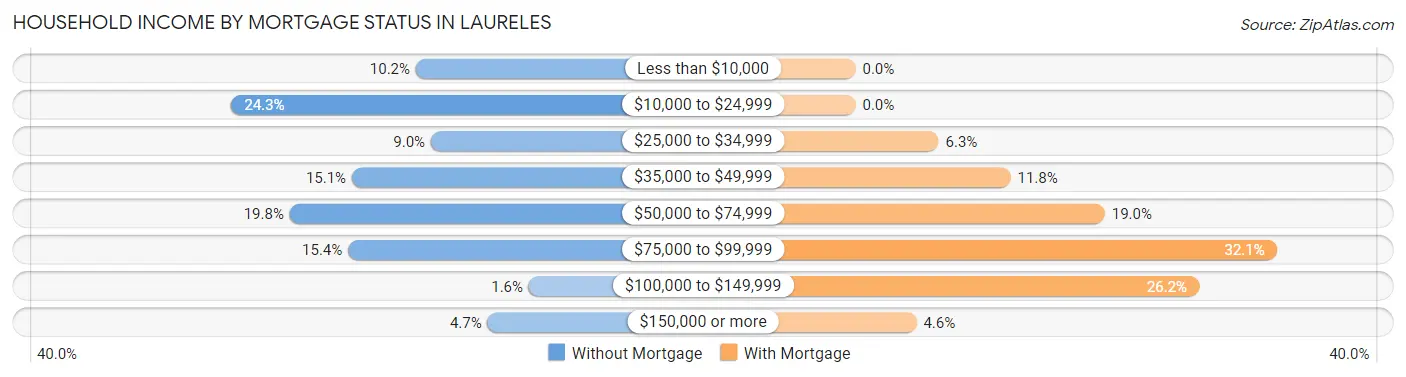
| Household Income | Without Mortgage | With Mortgage |
| Less than $10,000 | 71 (10.2%) | 0 (0.0%) |
| $10,000 to $24,999 | 169 (24.2%) | 0 (0.0%) |
| $25,000 to $34,999 | 63 (9.0%) | 15 (6.3%) |
| $35,000 to $49,999 | 105 (15.1%) | 28 (11.8%) |
| $50,000 to $74,999 | 138 (19.8%) | 45 (19.0%) |
| $75,000 to $99,999 | 107 (15.3%) | 76 (32.1%) |
| $100,000 to $149,999 | 11 (1.6%) | 62 (26.2%) |
| $150,000 or more | 33 (4.7%) | 11 (4.6%) |
| Total | 697 (100.0%) | 237 (100.0%) |
Property Value to Household Income Ratio in Laureles
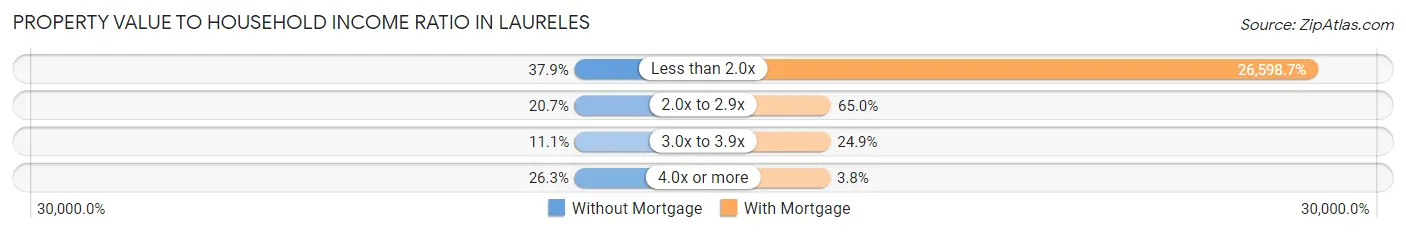
| Value-to-Income Ratio | Without Mortgage | With Mortgage |
| Less than 2.0x | 264 (37.9%) | 63,039 (26,598.7%) |
| 2.0x to 2.9x | 144 (20.7%) | 154 (65.0%) |
| 3.0x to 3.9x | 77 (11.1%) | 59 (24.9%) |
| 4.0x or more | 183 (26.3%) | 9 (3.8%) |
| Total | 697 (100.0%) | 237 (100.0%) |
Real Estate Taxes by Mortgage Status in Laureles
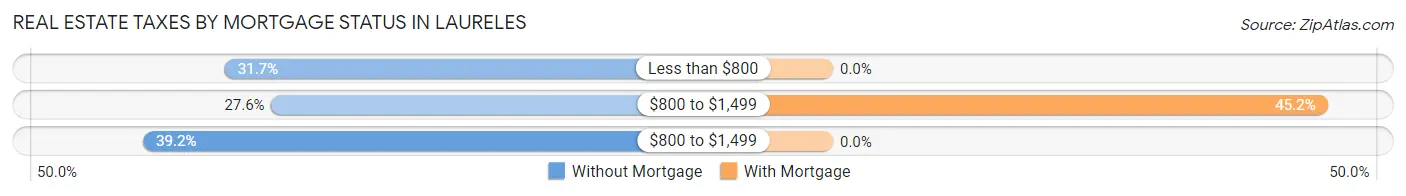
| Property Taxes | Without Mortgage | With Mortgage |
| Less than $800 | 221 (31.7%) | 0 (0.0%) |
| $800 to $1,499 | 192 (27.6%) | 107 (45.2%) |
| $800 to $1,499 | 273 (39.2%) | 0 (0.0%) |
| Total | 697 (100.0%) | 237 (100.0%) |
Health & Disability in Laureles
Health Insurance Coverage by Age in Laureles
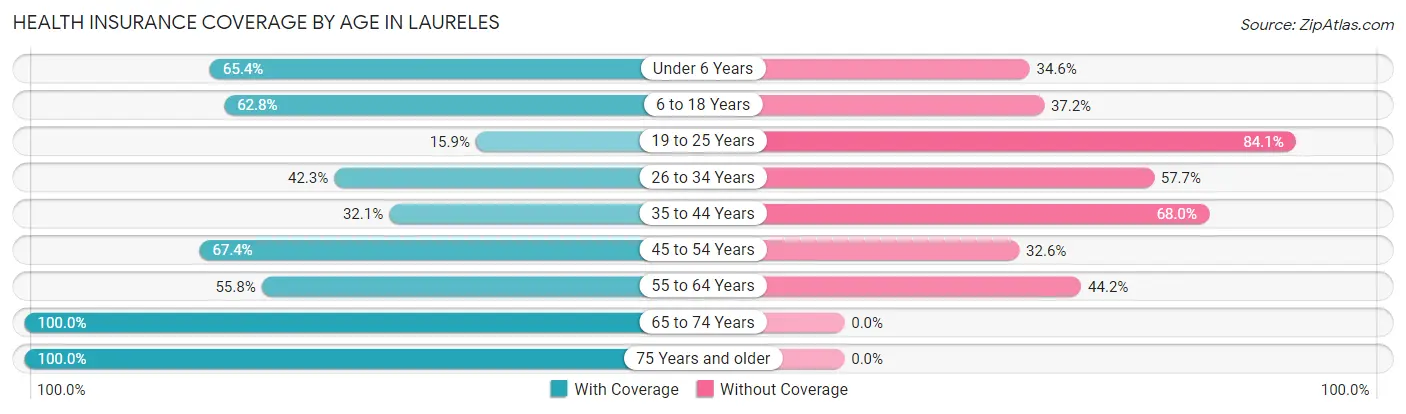
| Age Bracket | With Coverage | Without Coverage |
| Under 6 Years | 214 (65.4%) | 113 (34.6%) |
| 6 to 18 Years | 585 (62.8%) | 347 (37.2%) |
| 19 to 25 Years | 76 (15.9%) | 403 (84.1%) |
| 26 to 34 Years | 170 (42.3%) | 232 (57.7%) |
| 35 to 44 Years | 191 (32.1%) | 405 (67.9%) |
| 45 to 54 Years | 279 (67.4%) | 135 (32.6%) |
| 55 to 64 Years | 230 (55.8%) | 182 (44.2%) |
| 65 to 74 Years | 169 (100.0%) | 0 (0.0%) |
| 75 Years and older | 87 (100.0%) | 0 (0.0%) |
| Total | 2,001 (52.4%) | 1,817 (47.6%) |
Health Insurance Coverage by Citizenship Status in Laureles
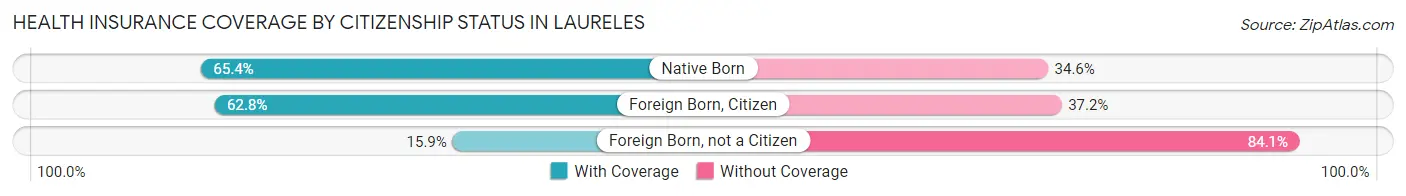
| Citizenship Status | With Coverage | Without Coverage |
| Native Born | 214 (65.4%) | 113 (34.6%) |
| Foreign Born, Citizen | 585 (62.8%) | 347 (37.2%) |
| Foreign Born, not a Citizen | 76 (15.9%) | 403 (84.1%) |
Health Insurance Coverage by Household Income in Laureles
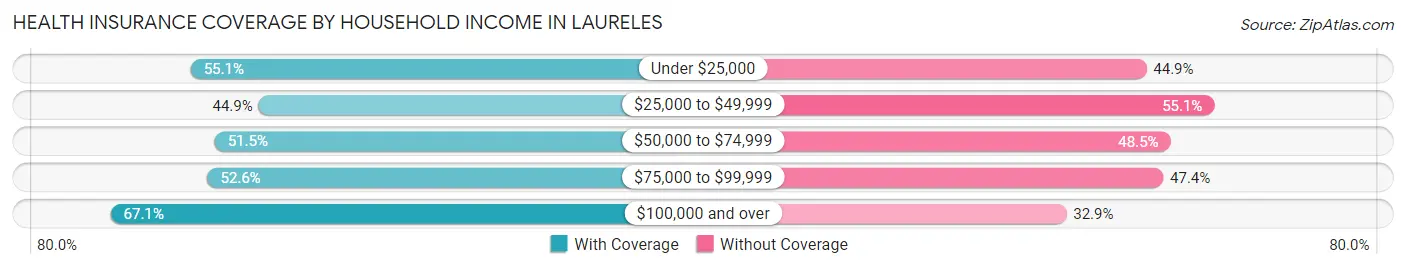
| Household Income | With Coverage | Without Coverage |
| Under $25,000 | 394 (55.1%) | 321 (44.9%) |
| $25,000 to $49,999 | 417 (44.9%) | 511 (55.1%) |
| $50,000 to $74,999 | 445 (51.5%) | 419 (48.5%) |
| $75,000 to $99,999 | 488 (52.6%) | 440 (47.4%) |
| $100,000 and over | 257 (67.1%) | 126 (32.9%) |
Public vs Private Health Insurance Coverage by Age in Laureles
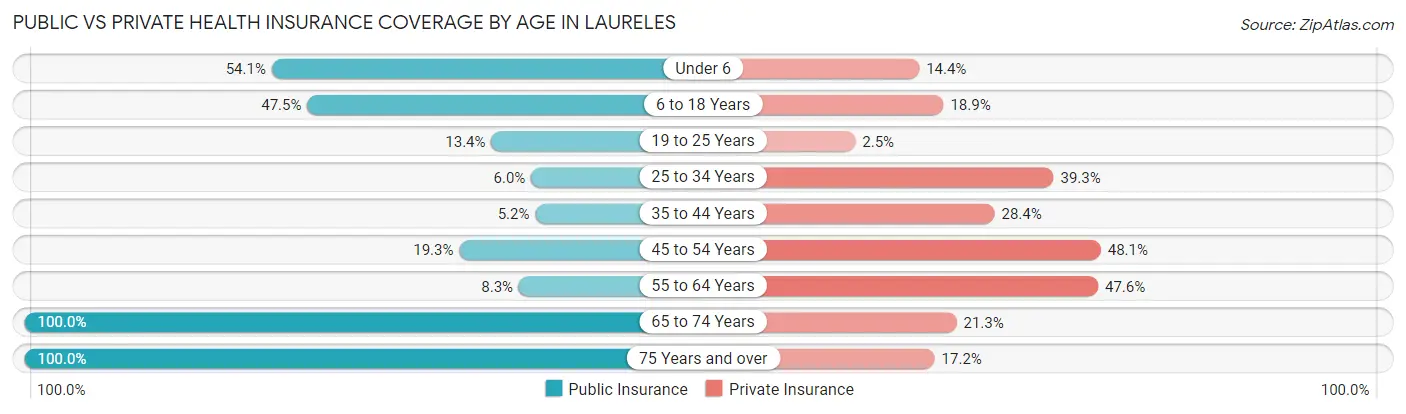
| Age Bracket | Public Insurance | Private Insurance |
| Under 6 | 177 (54.1%) | 47 (14.4%) |
| 6 to 18 Years | 443 (47.5%) | 176 (18.9%) |
| 19 to 25 Years | 64 (13.4%) | 12 (2.5%) |
| 25 to 34 Years | 24 (6.0%) | 158 (39.3%) |
| 35 to 44 Years | 31 (5.2%) | 169 (28.4%) |
| 45 to 54 Years | 80 (19.3%) | 199 (48.1%) |
| 55 to 64 Years | 34 (8.3%) | 196 (47.6%) |
| 65 to 74 Years | 169 (100.0%) | 36 (21.3%) |
| 75 Years and over | 87 (100.0%) | 15 (17.2%) |
| Total | 1,109 (29.0%) | 1,008 (26.4%) |
Disability Status by Sex by Age in Laureles
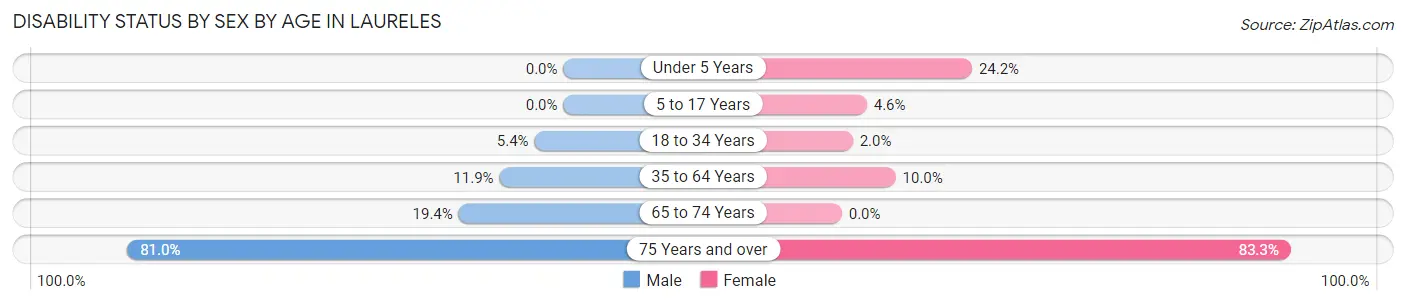
| Age Bracket | Male | Female |
| Under 5 Years | 0 (0.0%) | 43 (24.2%) |
| 5 to 17 Years | 0 (0.0%) | 20 (4.6%) |
| 18 to 34 Years | 28 (5.4%) | 8 (2.0%) |
| 35 to 64 Years | 82 (11.9%) | 73 (10.0%) |
| 65 to 74 Years | 14 (19.4%) | 0 (0.0%) |
| 75 Years and over | 17 (80.9%) | 55 (83.3%) |
Disability Class by Sex by Age in Laureles
Disability Class: Hearing Difficulty
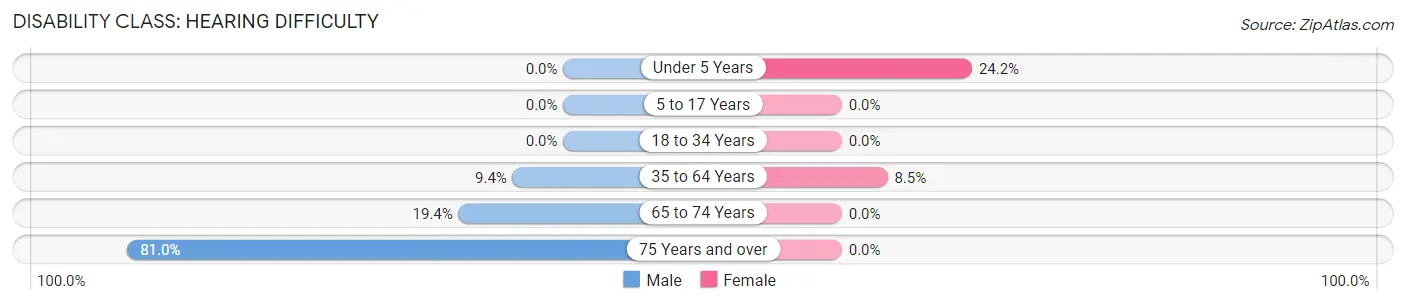
| Age Bracket | Male | Female |
| Under 5 Years | 0 (0.0%) | 43 (24.2%) |
| 5 to 17 Years | 0 (0.0%) | 0 (0.0%) |
| 18 to 34 Years | 0 (0.0%) | 0 (0.0%) |
| 35 to 64 Years | 65 (9.4%) | 62 (8.5%) |
| 65 to 74 Years | 14 (19.4%) | 0 (0.0%) |
| 75 Years and over | 17 (80.9%) | 0 (0.0%) |
Disability Class: Vision Difficulty
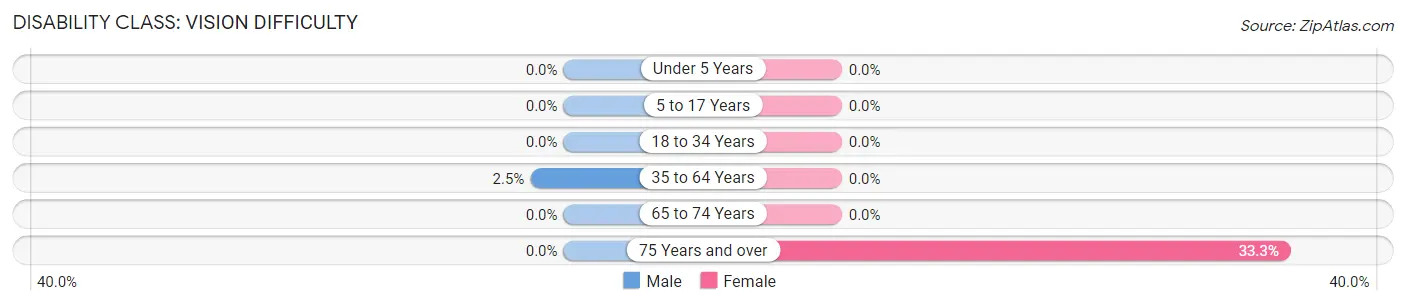
| Age Bracket | Male | Female |
| Under 5 Years | 0 (0.0%) | 0 (0.0%) |
| 5 to 17 Years | 0 (0.0%) | 0 (0.0%) |
| 18 to 34 Years | 0 (0.0%) | 0 (0.0%) |
| 35 to 64 Years | 17 (2.5%) | 0 (0.0%) |
| 65 to 74 Years | 0 (0.0%) | 0 (0.0%) |
| 75 Years and over | 0 (0.0%) | 22 (33.3%) |
Disability Class: Cognitive Difficulty
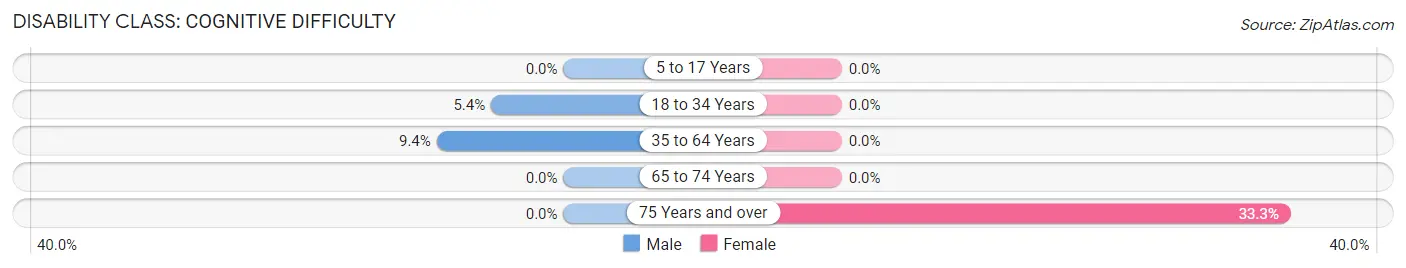
| Age Bracket | Male | Female |
| 5 to 17 Years | 0 (0.0%) | 0 (0.0%) |
| 18 to 34 Years | 28 (5.4%) | 0 (0.0%) |
| 35 to 64 Years | 65 (9.4%) | 0 (0.0%) |
| 65 to 74 Years | 0 (0.0%) | 0 (0.0%) |
| 75 Years and over | 0 (0.0%) | 22 (33.3%) |
Disability Class: Ambulatory Difficulty
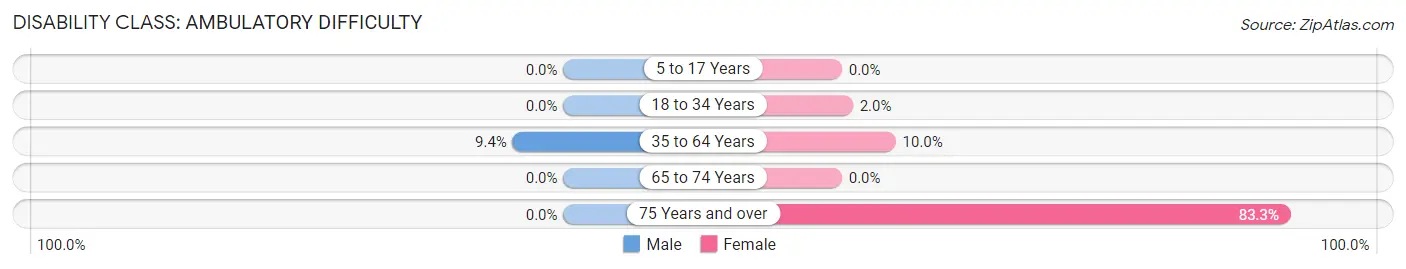
| Age Bracket | Male | Female |
| 5 to 17 Years | 0 (0.0%) | 0 (0.0%) |
| 18 to 34 Years | 0 (0.0%) | 8 (2.0%) |
| 35 to 64 Years | 65 (9.4%) | 73 (10.0%) |
| 65 to 74 Years | 0 (0.0%) | 0 (0.0%) |
| 75 Years and over | 0 (0.0%) | 55 (83.3%) |
Disability Class: Self-Care Difficulty
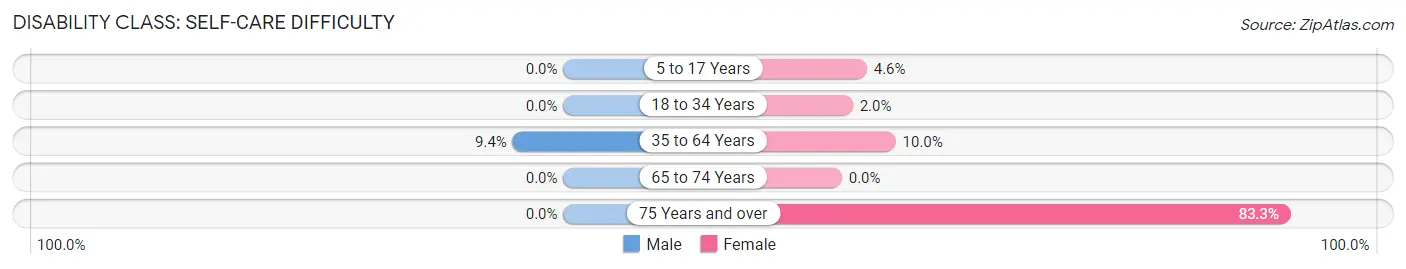
| Age Bracket | Male | Female |
| 5 to 17 Years | 0 (0.0%) | 20 (4.6%) |
| 18 to 34 Years | 0 (0.0%) | 8 (2.0%) |
| 35 to 64 Years | 65 (9.4%) | 73 (10.0%) |
| 65 to 74 Years | 0 (0.0%) | 0 (0.0%) |
| 75 Years and over | 0 (0.0%) | 55 (83.3%) |
Technology Access in Laureles
Computing Device Access in Laureles
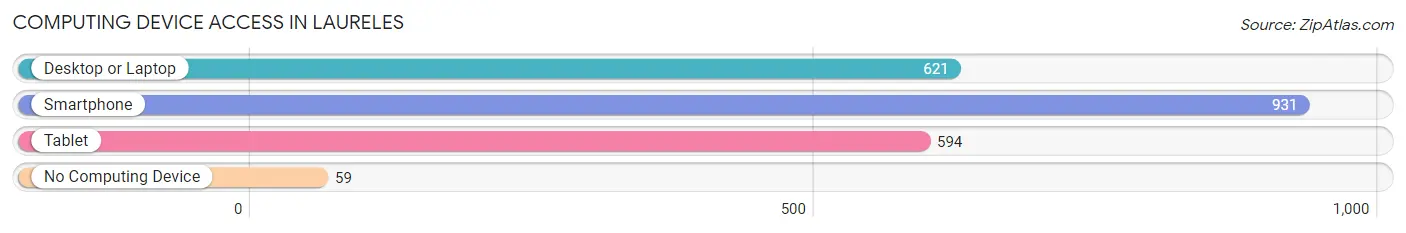
| Device Type | # Households | % Households |
| Desktop or Laptop | 621 | 62.7% |
| Smartphone | 931 | 94.0% |
| Tablet | 594 | 60.0% |
| No Computing Device | 59 | 6.0% |
| Total | 990 | 100.0% |
Internet Access in Laureles
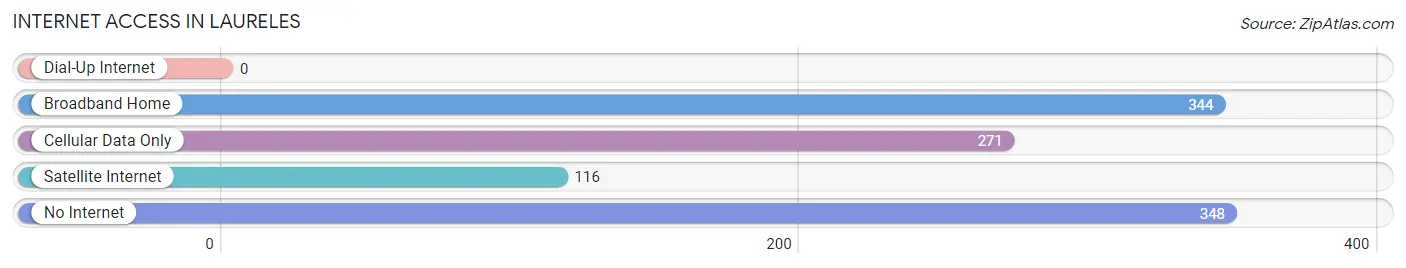
| Internet Type | # Households | % Households |
| Dial-Up Internet | 0 | 0.0% |
| Broadband Home | 344 | 34.7% |
| Cellular Data Only | 271 | 27.4% |
| Satellite Internet | 116 | 11.7% |
| No Internet | 348 | 35.1% |
| Total | 990 | 100.0% |
Laureles Summary
Laureles, Texas is a small unincorporated community located in the southeastern corner of Hidalgo County, Texas. It is situated on the banks of the Rio Grande, just south of the city of McAllen. The population of Laureles was estimated to be around 1,000 in 2020.
History
Laureles was founded in the late 19th century by a group of Mexican settlers who were looking for a place to settle and farm. The area was originally known as El Rancho de los Laureles, or “The Ranch of the Laurels”. The name was derived from the abundance of laurel trees in the area.
The first settlers in Laureles were mostly farmers and ranchers, and the area quickly became known for its agricultural production. The town was officially incorporated in 1909, and the first post office was established in 1910.
Geography
Laureles is located in the southeastern corner of Hidalgo County, Texas, on the banks of the Rio Grande. It is situated just south of the city of McAllen, and is bordered by the cities of Edinburg and Mission. The town is located at an elevation of approximately 200 feet above sea level.
The climate in Laureles is subtropical, with hot summers and mild winters. The average annual temperature is around 75 degrees Fahrenheit, and the average annual precipitation is around 24 inches.
Economy
The economy of Laureles is largely based on agriculture. The town is home to several large farms and ranches, and the surrounding area is known for its production of cotton, corn, sorghum, and other crops.
In addition to agriculture, Laureles is also home to several small businesses, including restaurants, grocery stores, and other retail establishments. The town is also home to a number of manufacturing companies, including a furniture factory and a plastics factory.
Demographics
As of the 2010 census, the population of Laureles was estimated to be around 1,000. The racial makeup of the town was 94.3% Hispanic or Latino, 4.3% White, and 1.4% Other. The median household income in Laureles was estimated to be around $25,000.
The majority of the population in Laureles is Roman Catholic, and the town is home to several churches. The town is also home to a number of schools, including a public elementary school and a private Catholic school.
Conclusion
Laureles, Texas is a small unincorporated community located in the southeastern corner of Hidalgo County, Texas. It is situated on the banks of the Rio Grande, just south of the city of McAllen. The population of Laureles was estimated to be around 1,000 in 2020. The economy of Laureles is largely based on agriculture, and the town is home to several small businesses. The majority of the population in Laureles is Roman Catholic, and the town is home to several churches and schools.
Common Questions
What is Per Capita Income in Laureles?
Per Capita income in Laureles is $13,945.
What is the Median Family Income in Laureles?
Median Family Income in Laureles is $46,483.
What is the Median Household income in Laureles?
Median Household Income in Laureles is $43,500.
What is Income or Wage Gap in Laureles?
Income or Wage Gap in Laureles is 40.4%.
Women in Laureles earn 59.6 cents for every dollar earned by a man.
What is Inequality or Gini Index in Laureles?
Inequality or Gini Index in Laureles is 0.42.
What is the Total Population of Laureles?
Total Population of Laureles is 3,818.
What is the Total Male Population of Laureles?
Total Male Population of Laureles is 1,919.
What is the Total Female Population of Laureles?
Total Female Population of Laureles is 1,899.
What is the Ratio of Males per 100 Females in Laureles?
There are 101.05 Males per 100 Females in Laureles.
What is the Ratio of Females per 100 Males in Laureles?
There are 98.96 Females per 100 Males in Laureles.
What is the Median Population Age in Laureles?
Median Population Age in Laureles is 28.2 Years.
What is the Average Family Size in Laureles
Average Family Size in Laureles is 4.2 People.
What is the Average Household Size in Laureles
Average Household Size in Laureles is 3.9 People.
How Large is the Labor Force in Laureles?
There are 1,458 People in the Labor Forcein in Laureles.
What is the Percentage of People in the Labor Force in Laureles?
53.0% of People are in the Labor Force in Laureles.
What is the Unemployment Rate in Laureles?
Unemployment Rate in Laureles is 9.0%.