Zip Codes with the Highest Percentage of Population Employed in Education Instruction & Library in Mississippi
RELATED REPORTS & OPTIONS
Education Instruction & Library
Mississippi
Compare Zip Codes
Map of Zip Codes with the Highest Percentage of Population Employed in Education Instruction & Library in Mississippi
0.0%
40.0%
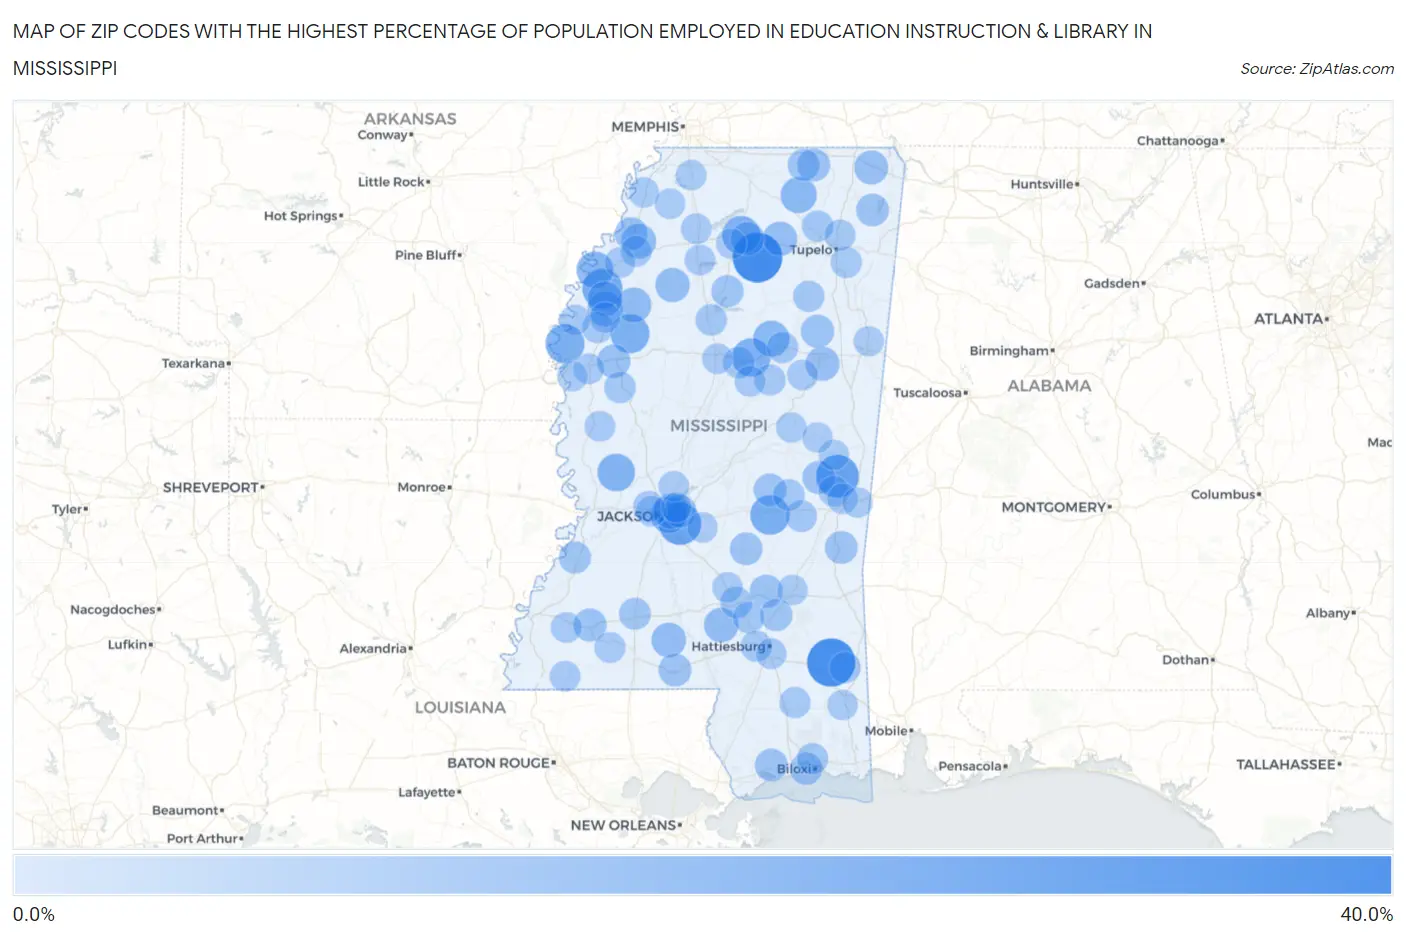
Zip Codes with the Highest Percentage of Population Employed in Education Instruction & Library in Mississippi
| Zip Code | % Employed | vs State | vs National | |
| 1. | 38949 | 36.4% | 6.8% (+29.5)#1 | 6.2% (+30.2)#161 |
| 2. | 39461 | 34.5% | 6.8% (+27.6)#2 | 6.2% (+28.3)#193 |
| 3. | 39326 | 26.3% | 6.8% (+19.5)#3 | 6.2% (+20.1)#333 |
| 4. | 39193 | 25.6% | 6.8% (+18.7)#4 | 6.2% (+19.4)#348 |
| 5. | 38774 | 22.4% | 6.8% (+15.6)#5 | 6.2% (+16.2)#495 |
| 6. | 39336 | 21.4% | 6.8% (+14.6)#6 | 6.2% (+15.3)#542 |
| 7. | 38772 | 20.8% | 6.8% (+13.9)#7 | 6.2% (+14.6)#584 |
| 8. | 38736 | 20.7% | 6.8% (+13.8)#8 | 6.2% (+14.5)#591 |
| 9. | 39767 | 20.1% | 6.8% (+13.3)#9 | 6.2% (+13.9)#639 |
| 10. | 38677 | 19.4% | 6.8% (+12.6)#10 | 6.2% (+13.2)#701 |
| 11. | 39162 | 18.7% | 6.8% (+11.8)#11 | 6.2% (+12.5)#769 |
| 12. | 38720 | 17.6% | 6.8% (+10.7)#12 | 6.2% (+11.4)#887 |
| 13. | 39202 | 17.0% | 6.8% (+10.2)#13 | 6.2% (+10.8)#943 |
| 14. | 39771 | 16.7% | 6.8% (+9.82)#14 | 6.2% (+10.5)#1,003 |
| 15. | 38610 | 16.4% | 6.8% (+9.57)#15 | 6.2% (+10.2)#1,037 |
| 16. | 39216 | 15.8% | 6.8% (+8.92)#16 | 6.2% (+9.59)#1,140 |
| 17. | 38759 | 15.2% | 6.8% (+8.40)#17 | 6.2% (+9.06)#1,242 |
| 18. | 38737 | 15.0% | 6.8% (+8.20)#18 | 6.2% (+8.86)#1,273 |
| 19. | 38762 | 14.9% | 6.8% (+8.05)#19 | 6.2% (+8.72)#1,297 |
| 20. | 38639 | 14.5% | 6.8% (+7.66)#20 | 6.2% (+8.32)#1,387 |
| 21. | 39641 | 14.3% | 6.8% (+7.49)#21 | 6.2% (+8.16)#1,435 |
| 22. | 39421 | 14.2% | 6.8% (+7.40)#22 | 6.2% (+8.06)#1,471 |
| 23. | 38921 | 14.0% | 6.8% (+7.12)#23 | 6.2% (+7.78)#1,550 |
| 24. | 38871 | 13.8% | 6.8% (+6.95)#24 | 6.2% (+7.61)#1,612 |
| 25. | 39759 | 13.6% | 6.8% (+6.72)#25 | 6.2% (+7.38)#1,689 |
| 26. | 38846 | 13.3% | 6.8% (+6.41)#26 | 6.2% (+7.08)#1,796 |
| 27. | 38655 | 12.7% | 6.8% (+5.84)#27 | 6.2% (+6.50)#2,027 |
| 28. | 38751 | 12.5% | 6.8% (+5.62)#28 | 6.2% (+6.29)#2,144 |
| 29. | 39741 | 12.3% | 6.8% (+5.44)#29 | 6.2% (+6.11)#2,242 |
| 30. | 39653 | 12.3% | 6.8% (+5.42)#30 | 6.2% (+6.08)#2,254 |
| 31. | 38617 | 12.3% | 6.8% (+5.41)#31 | 6.2% (+6.08)#2,256 |
| 32. | 39480 | 12.2% | 6.8% (+5.31)#32 | 6.2% (+5.97)#2,307 |
| 33. | 39232 | 12.0% | 6.8% (+5.16)#33 | 6.2% (+5.82)#2,383 |
| 34. | 39667 | 11.9% | 6.8% (+5.03)#34 | 6.2% (+5.69)#2,460 |
| 35. | 38674 | 11.8% | 6.8% (+4.96)#35 | 6.2% (+5.63)#2,495 |
| 36. | 39057 | 11.8% | 6.8% (+4.92)#36 | 6.2% (+5.58)#2,516 |
| 37. | 39325 | 11.7% | 6.8% (+4.87)#37 | 6.2% (+5.54)#2,554 |
| 38. | 39355 | 11.7% | 6.8% (+4.81)#38 | 6.2% (+5.48)#2,598 |
| 39. | 39571 | 11.6% | 6.8% (+4.78)#39 | 6.2% (+5.45)#2,611 |
| 40. | 38859 | 11.6% | 6.8% (+4.76)#40 | 6.2% (+5.43)#2,622 |
| 41. | 39153 | 11.5% | 6.8% (+4.63)#41 | 6.2% (+5.30)#2,712 |
| 42. | 39437 | 11.2% | 6.8% (+4.39)#42 | 6.2% (+5.05)#2,897 |
| 43. | 39531 | 11.1% | 6.8% (+4.22)#43 | 6.2% (+4.89)#3,014 |
| 44. | 38922 | 11.0% | 6.8% (+4.19)#44 | 6.2% (+4.86)#3,033 |
| 45. | 38629 | 10.9% | 6.8% (+4.01)#45 | 6.2% (+4.68)#3,159 |
| 46. | 39150 | 10.7% | 6.8% (+3.89)#46 | 6.2% (+4.56)#3,248 |
| 47. | 39601 | 10.5% | 6.8% (+3.63)#47 | 6.2% (+4.30)#3,471 |
| 48. | 39428 | 10.4% | 6.8% (+3.51)#48 | 6.2% (+4.18)#3,587 |
| 49. | 39332 | 10.1% | 6.8% (+3.26)#49 | 6.2% (+3.92)#3,825 |
| 50. | 39327 | 10.0% | 6.8% (+3.20)#50 | 6.2% (+3.86)#3,880 |
| 51. | 38754 | 9.9% | 6.8% (+3.08)#51 | 6.2% (+3.75)#4,013 |
| 52. | 39752 | 9.9% | 6.8% (+3.05)#52 | 6.2% (+3.72)#4,056 |
| 53. | 39747 | 9.9% | 6.8% (+3.02)#53 | 6.2% (+3.68)#4,099 |
| 54. | 39479 | 9.8% | 6.8% (+2.99)#54 | 6.2% (+3.65)#4,128 |
| 55. | 38901 | 9.8% | 6.8% (+2.97)#55 | 6.2% (+3.63)#4,154 |
| 56. | 39540 | 9.7% | 6.8% (+2.85)#56 | 6.2% (+3.51)#4,287 |
| 57. | 38828 | 9.7% | 6.8% (+2.83)#57 | 6.2% (+3.50)#4,304 |
| 58. | 38851 | 9.6% | 6.8% (+2.78)#58 | 6.2% (+3.45)#4,354 |
| 59. | 38862 | 9.6% | 6.8% (+2.76)#59 | 6.2% (+3.42)#4,394 |
| 60. | 39451 | 9.6% | 6.8% (+2.75)#60 | 6.2% (+3.42)#4,398 |
| 61. | 38730 | 9.6% | 6.8% (+2.74)#61 | 6.2% (+3.41)#4,413 |
| 62. | 39402 | 9.5% | 6.8% (+2.69)#62 | 6.2% (+3.35)#4,477 |
| 63. | 39577 | 9.4% | 6.8% (+2.53)#63 | 6.2% (+3.19)#4,676 |
| 64. | 39772 | 9.3% | 6.8% (+2.44)#64 | 6.2% (+3.11)#4,813 |
| 65. | 38645 | 9.2% | 6.8% (+2.34)#65 | 6.2% (+3.01)#4,950 |
| 66. | 38866 | 9.2% | 6.8% (+2.34)#66 | 6.2% (+3.00)#4,957 |
| 67. | 39056 | 9.1% | 6.8% (+2.26)#67 | 6.2% (+2.92)#5,053 |
| 68. | 39664 | 9.0% | 6.8% (+2.17)#68 | 6.2% (+2.84)#5,197 |
| 69. | 38732 | 9.0% | 6.8% (+2.17)#69 | 6.2% (+2.84)#5,198 |
| 70. | 39745 | 8.9% | 6.8% (+2.06)#70 | 6.2% (+2.73)#5,368 |
| 71. | 39661 | 8.9% | 6.8% (+2.00)#71 | 6.2% (+2.67)#5,463 |
| 72. | 39631 | 8.8% | 6.8% (+1.97)#72 | 6.2% (+2.64)#5,512 |
| 73. | 38721 | 8.8% | 6.8% (+1.97)#73 | 6.2% (+2.64)#5,515 |
| 74. | 39058 | 8.8% | 6.8% (+1.91)#74 | 6.2% (+2.58)#5,603 |
| 75. | 38756 | 8.8% | 6.8% (+1.91)#75 | 6.2% (+2.57)#5,617 |
| 76. | 38658 | 8.7% | 6.8% (+1.87)#76 | 6.2% (+2.54)#5,684 |
| 77. | 39769 | 8.7% | 6.8% (+1.86)#77 | 6.2% (+2.53)#5,695 |
| 78. | 38967 | 8.7% | 6.8% (+1.84)#78 | 6.2% (+2.50)#5,755 |
| 79. | 38614 | 8.7% | 6.8% (+1.81)#79 | 6.2% (+2.48)#5,792 |
| 80. | 38726 | 8.7% | 6.8% (+1.81)#80 | 6.2% (+2.48)#5,803 |
| 81. | 39305 | 8.6% | 6.8% (+1.79)#81 | 6.2% (+2.45)#5,845 |
| 82. | 38666 | 8.6% | 6.8% (+1.77)#82 | 6.2% (+2.44)#5,879 |
| 83. | 39119 | 8.6% | 6.8% (+1.76)#83 | 6.2% (+2.43)#5,894 |
| 84. | 39342 | 8.6% | 6.8% (+1.74)#84 | 6.2% (+2.41)#5,936 |
| 85. | 39401 | 8.6% | 6.8% (+1.73)#85 | 6.2% (+2.39)#5,962 |
| 86. | 39346 | 8.5% | 6.8% (+1.69)#86 | 6.2% (+2.36)#6,018 |
| 87. | 38676 | 8.5% | 6.8% (+1.66)#87 | 6.2% (+2.32)#6,083 |
| 88. | 38673 | 8.5% | 6.8% (+1.64)#88 | 6.2% (+2.31)#6,116 |
| 89. | 39328 | 8.5% | 6.8% (+1.64)#89 | 6.2% (+2.31)#6,117 |
| 90. | 38665 | 8.4% | 6.8% (+1.58)#90 | 6.2% (+2.25)#6,227 |
| 91. | 39042 | 8.4% | 6.8% (+1.55)#91 | 6.2% (+2.21)#6,299 |
| 92. | 38632 | 8.4% | 6.8% (+1.52)#92 | 6.2% (+2.19)#6,364 |
| 93. | 39354 | 8.3% | 6.8% (+1.48)#93 | 6.2% (+2.15)#6,437 |
| 94. | 39110 | 8.3% | 6.8% (+1.45)#94 | 6.2% (+2.12)#6,516 |
| 95. | 39443 | 8.3% | 6.8% (+1.45)#95 | 6.2% (+2.11)#6,533 |
| 96. | 39211 | 8.3% | 6.8% (+1.41)#96 | 6.2% (+2.08)#6,597 |
| 97. | 39364 | 8.2% | 6.8% (+1.40)#97 | 6.2% (+2.07)#6,616 |
| 98. | 39705 | 8.2% | 6.8% (+1.40)#98 | 6.2% (+2.06)#6,624 |
| 99. | 38701 | 8.2% | 6.8% (+1.37)#99 | 6.2% (+2.04)#6,676 |
| 100. | 39452 | 8.2% | 6.8% (+1.37)#100 | 6.2% (+2.04)#6,682 |
Common Questions
What are the Top 10 Zip Codes with the Highest Percentage of Population Employed in Education Instruction & Library in Mississippi?
Top 10 Zip Codes with the Highest Percentage of Population Employed in Education Instruction & Library in Mississippi are:
What zip code has the Highest Percentage of Population Employed in Education Instruction & Library in Mississippi?
38949 has the Highest Percentage of Population Employed in Education Instruction & Library in Mississippi with 36.4%.
What is the Percentage of Population Employed in Education Instruction & Library in the State of Mississippi?
Percentage of Population Employed in Education Instruction & Library in Mississippi is 6.8%.
What is the Percentage of Population Employed in Education Instruction & Library in the United States?
Percentage of Population Employed in Education Instruction & Library in the United States is 6.2%.